|
Title: ASIC Difficulty Curves Post by: bitboyben on October 31, 2012, 08:52:08 PM I was tinkering around with the current difficulty increases say 0.2% to 0.6% per day and plugged that in to the forecast increase of ASIC hardware.
Came up with some interesting numbers. Then I decided at what point would electrical consumption come in to play. I was a bit surprised as to how quickly the GH/W would come in to play with ASICs. I wasn't expecting it to be an issue for at least a few years. I made a quick chart and decided to share it. This is weekly increases and the Total Hash rate. The dashed lines represent at what total hash rate a ~$1400 ~60G/h ASIC would after power consumption provide at least +5% return on top of the price of the equipment within a year. There's a lot I don't take into account. Starting with the fluctuating price of bitcoins. Assumed $12 here. Comments? http://img17.imageshack.us/img17/7202/bitcoinasicstrategy.jpg Title: Re: ASIC Difficulty Curves Post by: Cablez on October 31, 2012, 09:22:51 PM I did something a little similar looking at the earning tack a few days ago.
Here is a quick little representation of the mining income upon ASIC release. The only assumptions are 2 BFL SC singles and a linear rate of difficulty adjustment per day. Not completely realistic but close. https://i.imgur.com/7u8sv.png Title: Re: ASIC Difficulty Curves Post by: bcpokey on October 31, 2012, 10:55:35 PM My eyes hurt quite a bit trying to look at the tiny numbers of the first image. I'm not sure what you mean when you say current increases, that you are referencing, but it seems clear at even a cursory glance that only the .2% / day rate is within sensible tolerances.
You are already starting your curves at 200TH/sec, when asic rates are close to parity with current GPU rates (that is to say the $ value of buying an asic in that world is similar to the $ value of buying a GPU in our current bitcoin world). Even the .4% curve, over the course of 30 days, increases from 200TH/sec to 400TH/sec, or using your values: 3,333 singles at a cost of $4,700,000 of hardware has been brought online that month. Possible I suppose, but let's not forget that the incentive to buy asics is much lower at this point, with supply potentially still far more limited than the current GPU market, and for comparison the entire GPU / FPGA mining set up running now is probably closer to $7m in value. Something to bear in mind I suppose, but seems very unlikely. For the second graph, I would think for that to be helpful to yourself and others, you would want to use the step-function change that occurs with bitcoin rather than linearity, as it will certainly impact the results quit a bit. Difficulty takes a step after every 2016 blocks, based on time over expected time. If you were to luckily hop on that early, you drastically under-represent your first 5 day earnings, which would of course account for the majority of your first 30 day return. This would also be closer to the mark on reality, as the change of hashing power will almost certainly be far more accelerated than the even distribution you are working with. Admittedly somewhat nitpicky, but I figure for usability these are low-hanging fruits. Title: Re: ASIC Difficulty Curves Post by: creativex on October 31, 2012, 11:47:44 PM I believe the unit of time referenced in the first chart to be weeks and not days. It is a bit difficult to follow, but interesting just the same. Thanks for sharing the work that went into these guys.
Title: Re: ASIC Difficulty Curves Post by: bcpokey on November 01, 2012, 12:11:56 AM I believe the unit of time referenced in the first chart to be weeks and not days. It is a bit difficult to follow, but interesting just the same. Thanks for sharing the work that went into these guys. That would indeed make more sense (guess my smarting eyes missed the word weekly in the OP), and allow for numbers to be more sensible. I still question a doubling of hashing power in 30 weeks, but it's certainly possible. Power consumption definitely changes the name of the game quite a bit. Title: Re: ASIC Difficulty Curves Post by: creativex on November 01, 2012, 12:37:02 AM As stated many variables are left out. Sentiment is one, and it's obviously a biggie. Miners as a group tend to be fairly...not dumb, so they're unlikely to just blindly walk off the cliff of indefinite ROI by the hundreds. If and when the profitability of mining with ASICs becomes marginal then sales will fall. If these fellers instead invest in bitcoins directly then prices are likely to rise.
I don't see electricity costs as playing a large role in ASIC mining profitability for some time to come. I believe you can safely chuck the top and bottom lines as the presumed efficiency leader(BFL) will still require something to tether to and even a little tablet will use 20w or so. The 480w mark is probably more power than any of the currently announced ASIC units will consume to reach 60Gh. Average is probably right around the 500Th mark on that chart and I don't see us reaching that for some time. Even then with the huge increase in efficiency ASIC has over GPU mining I don't see it as the determining factor for some time, though obviously in areas with high power costs that time will arrive much sooner than for others. Title: Re: ASIC Difficulty Curves Post by: MrTeal on November 01, 2012, 12:38:01 AM You'll be better off just adding the first couple months manually and then try to use a function after that.
I'd actually recommend using at most a linear increase after the initial batches of ASICs hit, with it more likely we'll see a sqrt(x) or log(x) increase. Look at the graphs of hashrate historically. http://bitcoinx.com/charts/chart_large_lin.png In the 3 months between May and August 2011, hashrate increased by a factor of 10 as everyone started GPU mining. It was then basically flatlined until for a year until this summer when the price jumped. Given the assumption that people are making about price staying constant, I'd say it's much more likely that we'll see an initial huge surge as all of 6-12 month payoff slack is taken up, and then a tapering off of hashrate growth. Title: Re: ASIC Difficulty Curves Post by: bitboyben on November 01, 2012, 04:32:24 AM Thanks for the feed back so far. I'll get back to it tomorrow.
Title: Re: ASIC Difficulty Curves Post by: bitboyben on November 02, 2012, 12:12:34 AM So here's my shopping list of proposed changes:
Revised power prices: I based the electricity costs on my current costs. I think I'm in the lower third. I'll take a look at some of the rates others are be paying by looking up local costs on the forum as posted. Clean up "weeks" Make larger: Size suggestions Add resistance to difficulty increases. Log(x)/historical charts: Thanks for the input on that. It will of course become less favourable for miner to continue to invest in hardware as difficulty increases. I'm thinking of making a poll asking what levels of minimum reveue people would be comfortable with. Other difficulty data sets: I realize that I went basically straight to 200Ths. I based that on my earlier poll on Hash rate. From the sounds of it BFL will ship 150Ths in the first shipment/batch. I don't have order numbers on other ASIC producers. Any info on that would be helpful. I also had some stepped (two week) difficuly rates using other rate increase theories. I picked 0.2%-0.6% based on the daily change charts over the last 6-7 months. I suppose FPGA shipments have lead to steady increases over that time period and the CPU to GPU hash increases maybe more realisic. Predicting shipments- So much has been already written on this. I guess I'm looking for the rate of deliveries not exact dates. I don't think the manufacturers could even say at this point. Predicting reinvestment: Not sure how much revenue miners will be reinvesting. Seems silly not to do some. but who wants to put 100% revenue into more hardware. Reexamine underlying revenue calculators: need to double check the unerlying math makes sense Thank you all for input Title: Re: ASIC Difficulty Curves Post by: MrTeal on November 02, 2012, 12:58:44 AM I believe that the first batch of bASIC units is about 50TH/s, and there's been two 300 piece preorders of 66GH/s Avalon units.
I really don't know what an acceptable level of expected ROI for ASIC units are. For me, it's much shorter than it would be for something like a GPU rig was. With GPUs, a 12 month ROI would have been acceptable for a whole rig, since you have a value floor because of the inherent general purpose value of the hardware. With ASICs, there is no secondary market outside bitcoin mining. If you pay cash expecting a 12 month ROI and the price goes to $5 you basically have to hold your coin or accept that you might take 5 years to pay off the unit. If for some reason countries legislate or regulate BTC enough to kill the price, your investment might just be a writeoff. It's much riskier than CPU or GPU mining was, and even more risky than FPGA mining. Title: Re: ASIC Difficulty Curves Post by: bitboyben on November 02, 2012, 09:33:46 PM Thanks MrTeal I hope you had a chance to check out the ROI poll I put on the board as well. Maybe I need to tweak that to reflect the greater risk will require higher ROI for those exact reasons. maybe +20% is the new break even point for some because of the specific nature of ASIC hardware. In my case it was easy to get the GPU bc I wanted one any way. But if potential newcomers have to get mining specific hardware and the returns are low they may not bother. Which would be good for established miners and potentially good for the price of btc if newcomers directly invest in btc.
Title: Re: ASIC Difficulty Curves Post by: bcpokey on November 03, 2012, 08:22:29 PM Since I enjoy charting and numbers, I thought I'd throw my hat in the ring.
I did a lot of hand calculation, since I feel that for certain periods of time, formulas are not applicable (just as for certain periods they are). So this is my view of what will happen if and when BFL hits the market with their projected quantities and dates. Assumptions: 20,000 fully functional ASIC chips, at 7.5GH/sec a piece, arriving ~Nov 25th, being shipped in 1/3rd installments roughly once per week to their pre-orders and post-orders (so 50TH delivered in chunks each week, coming online at roughly the same time). Rounding: A fair amount, but nothing critical to the numbers. The columns you see are: Total Network Hashing power (in GHash/sec); Difficulty; Date; BTC Generated (for 60GH/sec per day); USD equiv (@$10.5USD / BTC); Cumulative BTC generation. The graphs are ugly but self-explanatory. I believe this area of time (it can be translated to any point in time until the other producers begin to ship, so dates don't matter) is the most interesting and graph worthy. Early adopters will make out like bandits, but once the 150TH has been rolled out, things are much less interesting, and begins to mirror the GPU world, for generation/ROI and so forth, and the trend becomes easy to see (the top isn't easy to predict, but I'm figuring ~200-250TH/sec as the initial goldrush surge fades). Thoughts and comments, and criticisms welcome, within reason. https://i.imgur.com/FhMfQ.png Title: Re: ASIC Difficulty Curves Post by: bitboyben on November 04, 2012, 02:02:51 AM Great stuff, thanks for sharing.
I've seen spread sheets of the historical hash power/ difficulty out there I was, as suggested, going to slap the percentage difficulty change on to some of these exisiting numbers and see where that takes us. I just ned to find it, and not get tied up so much with work so I can actually work on this. Title: Re: ASIC Difficulty Curves Post by: kjlimo on November 04, 2012, 02:57:58 PM Thanks for putting this together. I agree with what you've done.
Exciting to think that we could make $1k per unit in Dec and still have a rate of over $3k for 2013. Obviously something will change before then, but still fun to think about. Getting excited!!! Title: Re: ASIC Difficulty Curves Post by: Xfinity on November 05, 2012, 01:07:04 PM interesting stuff, thanks for sharing!
Title: Re: ASIC Difficulty Curves Post by: bitboyben on November 06, 2012, 05:20:46 AM Looking for some feedback on my assumptions.
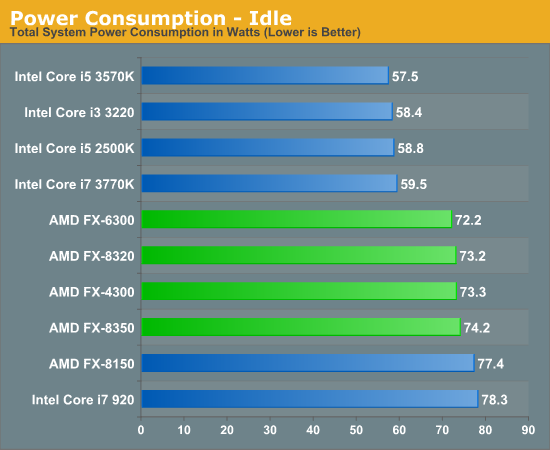
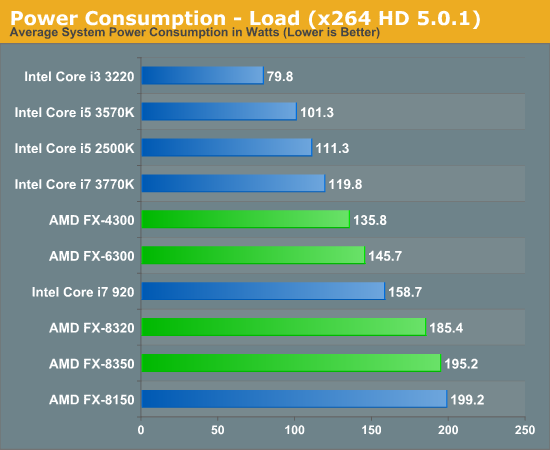
On the initial jump in Hashing power I got BFL 150Th and bASIC 50THs and Avalon ~40THs I'm thinking will take about 6-12 weeks to be delivered? Initial delivery dates and Delivery times seem to be getting closer and closer between the various manufacturers. Agree close enough? y/n? I should double check to see where about the GPU profitability will become negative and see where that would happen on the graph. I may be able to subtract the current ~25TH network at that point in time. I still like the 0.2%, 0.4% and 0.6% difficulty per day increases. I calculated 5% per difficulty period falls in between those numbers and smarter guys than me seem to be happy with that number. I'm looking to project the next year in difficulty per week. I won't factor for BTC-> fiat exchange(yet). I'm trying to determine a range of numbers(dates/difficulty) where a given ASIC hardware unit has a ROI of 1 year -5% to +30% and include electrical costs of 0.1-0.3USD/KWhr and the missing 100W for a host. As the difficulty approaches this range I can reduce the change in difficulty as miners are assumed to be purchasing less hardware as the ROI decreases. Bit off topic but does the price of BTC increasing only ~140% over the last year but the difficulty increasing 220%->340%? mean anything to any one? Title: Re: ASIC Difficulty Curves Post by: MrTeal on November 06, 2012, 06:11:37 AM Looking for some feedback on my assumptions. Sounds about rightOn the initial jump in Hashing power I got BFL 150Th and bASIC 50THs and Avalon ~40THs I'm thinking will take about 6-12 weeks to be delivered? Initial delivery dates and Delivery times seem to be getting closer and closer between the various manufacturers. Agree close enough? y/n? Quote I should double check to see where about the GPU profitability will become negative and see where that would happen on the graph. I may be able to subtract the current ~25TH network at that point in time. GPU Mining will become unprofitable pretty much as ASICs hit for everyone that doesn't have free power. Not all of the current 25TH/s is GPUs though, a bunch is FPGAs. The BFL Singles would be profitable at the current exchange rate and $0.10/kWh until about 150TH/s, while the Spartan based ones like the ModMinerQuad would be profitable until about 300TH/s under the same conditions. It's hard to tell how much FPGA hardware will not get traded in though.Quote I'm trying to determine a range of numbers(dates/difficulty) where a given ASIC hardware unit has a ROI of 1 year -5% to +30% and include electrical costs of 0.1-0.3USD/KWhr and the missing 100W for a host. I'd include maybe 50W for a host. For one, even my desktop with a bunch of case fans, an overclocked i5-2500k and two 6970s doesn't idle over 100W. Anyone building a mining system can easily have much lower draw than that. As the difficulty approaches this range I can reduce the change in difficulty as miners are assumed to be purchasing less hardware as the ROI decreases. http://images.anandtech.com/graphs/graph6396/51143.pnghttp://images.anandtech.com/graphs/graph6396/51142.png Idle power consumption for something like an i3-3220 is under 60 watts, and that's with a high performance Z77 MB (ASUS Maximus V Gene), 4 sticks of RAM, and a high power GPU. Even under load encoding x264 it only drew 80W. Second, the average number of devices per host is likely greater than 1. Using too high a host computer power draw will mask differences between different ASICs. Quote Bit off topic but does the price of BTC increasing only ~140% over the last year but the difficulty increasing 220%->340%? mean anything to any one? It hasn't, the price of BTC this time last year was under US$3.Title: Re: ASIC Difficulty Curves Post by: organofcorti on November 06, 2012, 02:40:31 PM I still like the 0.2%, 0.4% and 0.6% difficulty per day increases. I calculated 5% per difficulty period falls in between those numbers and smarter guys than me seem to be happy with that number. An increase of 1.0035% per day isn't the same as an increase of 5% per difficulty period - the latter is a step function, and also increasing the percentage increase decreases the length of time for which the difficulty implies, since an increase in difficulty of 5% means 2016 blocks were solved 5% faster than expected. Depending on what you want to do with the data, I think you might be better off measuring time in difficulty periods. A difficulty period is then converted to days as follows: Code: days = difficulty periods * 14/(1+average percentage increase per difficulty period) For example, 10 difficulty periods where the difficulty increases by 5%: Code: days = 10 * 14/1.05 = 133.33 days HTH Title: Re: ASIC Difficulty Curves Post by: bitboyben on November 06, 2012, 10:04:07 PM Ok thanks guys.
MrTeal: Thanks again for the numbers. I agree that 100w is conservative. I'm personally hoping to run my ASIC on the RPi or a laptop which uses a about 35w when I last measured it. And you are right if people are going to buy more hardware the share of the host's power draw diminishes. Also the host can be used for other operations while it is mining if someone so chooses, so how do we calculate for that? Maybe I'll stick with 50W as a fairly conservative number. I was just going to stick with organofcorti's numbers because he has done so much work already. As for the bitcoin price YTD, I got it off here http://www.bitcoinmoney.com/post/34853623626/october-2012-results (http://www.bitcoinmoney.com/post/34853623626/october-2012-results) and you are right. 137% is the price rise since the start of Jan 2012 so not a full year. organofcorti: http://organofcorti.blogspot.ca/2012/11/93-more-on-asic-choices.html I saw your new maths on your blog there and much of it contains data that I was trying to get for myself. Props on doing that. I found that your charts are awesome because they cover so many different possibilities. However, I'd like to use certain sets of assumptions to come out with my own set of numbers and start to affect the difficulty curves as miners approach stated max difficulty goals. By max difficulty curves I would like to assume that a percentage of revenue will go in to reinvesting until such time that difficulty approaches a miner's preferred min ROI. That min ROI is -5% to +20% ROI over one year including electrical use and the cost of hardware. This is not to be confused with Profitable in the sense that the mining equipment is producing more BTC than it is using in electricity. And of course you have a formula for that in your latest post. (I think I'm repeating myself again, again) I've been using THs, USD$ and days/weeks/months for my calculations not BTC, difficulty and difficulty periods so I'll have to switch over. Good points and thanks for the help. Title: Re: ASIC Difficulty Curves Post by: 2GOOD on November 06, 2012, 10:20:56 PM Quote organofcorti: http://organofcorti.blogspot.ca/2012/11/93-more-on-asic-choices.html Very good stuff. Thank You Title: Re: ASIC Difficulty Curves Post by: bitboyben on November 07, 2012, 04:59:18 AM So I figured I'd break down the difficulty chart in to two. One near term which is driven by expected ASIC deliveries and the longer term difficulty increases which will be driven by ROI.
I figured I'd get the ASIC deliveries part of the difficulty curve out of the way because it seems more predictable and less controversial as most people's models have fallen some where within reasonable limits of these ranges. The goal was to give some measuring tools for miners to evaluate the rates of change to the difficulty such that they can have plan A, B and C for low, medium and high levels of difficulty rather than say this is the most accurate model base your numbers on this (little shout out to the book "The Flaw of Averages" for that idea). There may be limited application to rising or falling exchange rate as well. Increasing values of BTC is as good or better than lowering the difficulty. The core question being answered is "Given my situation: Do I reinvest in hardware and if so how much?" Of course that is a personal question and your individual variables and values may be quite different from mine. What is in there? First off I decided to stick with TH on total network hash rate as the measure of difficulty. BFL 150TH, bASIC 50TH, Avalon 40TH 6,8,12 weeks roll outs. 240TH, 250TH, and 270TH 240 b/c total of deliveries 250 b/c total of deliveries plus some reserve GPU/FPGA users hanging on and a small bonus in case released hardware runs slightly better than advertised. 270 b/c total of deliveries plus approximately the current max TH I've seen on some of the Total hash rate charts. As the graph approaches the estimated delivery amounts I tag on a simple +2% per time period. I did this for denoting there will be a continual increase after the deliveries are out the door. I don't plan on using this for the longer term difficulty increases. I gave GPU Users till about 70TH until they would drop out. As for FPGA users I guessed most would upgrade if they could as there are many good avenues for that. So of the 25TH attributed to those groups I dropped it to 5TH for those hanging on for various reasons above 70TH. Used logistic function as the basis for the chart. I'm going to carry on with some more scenarios based on the population growth models with the follow up longer term difficulty chart. I think the parallels between BTC mining and Population growth in ecology are a great match. http://en.wikipedia.org/wiki/Logistic_function With that in mind I think the *quicker* the difficulty rises the *slower* the long term difficulty will creep towards theoretical maximums. So far this is more pessimistic than my original numbers over the short term. http://img594.imageshack.us/img594/5031/asicdp1page2.jpg http://img4.imageshack.us/img4/9222/asicdp1page1.jpg Title: Re: ASIC Difficulty Curves Post by: organofcorti on November 07, 2012, 06:06:01 AM I think you've detailed your estimate of the initial hashrate increase quite well. However estimating a longer term difficulty change will require an estimate of the USD-BTC exchange rate since the exchange rate seems to drive difficulty, with a slight lag. If you can derive an equation to relate the two historical values, it might lend your model greater verisimilitude.
Title: Re: ASIC Difficulty Curves Post by: MrTeal on November 07, 2012, 02:42:44 PM I think you've detailed your estimate of the initial hashrate increase quite well. However estimating a longer term difficulty change will require an estimate of the USD-BTC exchange rate since the exchange rate seems to drive difficulty, with a slight lag. If you can derive an equation to relate the two historical values, it might lend your model greater verisimilitude. That the big problem with estimating longterm difficulty, since anyone who claims to know what the price will do is either filthy rich or lying. Even with bitboyen's estimate of 270TH/s giving a difficulty of ~38M, very few people are going to invest in new ASICs if the price drops down to $5 without massive hardware price drops. It will be interesting to see what the mining factor 100 (or maybe USD/24hr@100GH/s now) will be once things stabilize in the spring. Title: Re: ASIC Difficulty Curves Post by: organofcorti on November 08, 2012, 01:12:46 AM ...... Even with bitboyen's estimate of 270TH/s giving a difficulty of ~38M, very few people are going to invest in new ASICs if the price drops down to $5 without massive hardware price drops. It will be interesting to see what the mining factor 100 (or maybe USD/24hr@100GH/s now) will be once things stabilize in the spring. If bitboyben's calculations are correct, D=38 million would be due to already purchased ASICs - unless the exchange rate drops very low they will be running constantly to get a return on their investment sooner. No moer ASICs need be purchased. If the rate does drop significantly (like your US$5/BTC suggestion) D will only drop slowly - people paying more electricity will stop mining first. Title: Re: ASIC Difficulty Curves Post by: jl2035 on November 08, 2012, 11:28:52 AM I will be very interesting when all that hw gets shipped..
Title: Re: ASIC Difficulty Curves Post by: bitboyben on November 08, 2012, 06:26:52 PM I would like to suggest using $10 as the price when calculating difficulty curves as it is close to the current price first off and secondly of the price changes those charts can be more easily adjusted percentage wise.
38million difficulty Have we already peaked? And so soon? This can't be good for hardware sales. Title: Re: ASIC Difficulty Curves Post by: DeathAndTaxes on November 08, 2012, 06:40:51 PM In the 3 months between May and August 2011, hashrate increased by a factor of 10 as everyone started GPU mining. It was then basically flatlined until for a year until this summer when the price jumped. Given the assumption that people are making about price staying constant, I'd say it's much more likely that we'll see an initial huge surge as all of 6-12 month payoff slack is taken up, and then a tapering off of hashrate growth. One thing to keep in mind is that ASICs introduce a new variable... hardware pricing. While they have large upfront costs the per unit cost is far lower than current retail price. So if/when new sales flatline (and difficulty stagnates) ASIC sellers can drop prices significantly. Sell the same unit for 50% of current price and suddenly it looks very profitable and sales start to pour back in (and in time difficulty takes another leg up). Months later the same stagnation occurs and one can cut prices again and again and again. After selling the same units at 3 or 4 price points the profits can be rolled into an improved design at a smaller manufacturing process and the same process starts all over. We didn't see that "much" with GPU. Yeah as 5000 series hit end of life there were some "sales" and closeouts which resulted in lower hardware cost (MH/$) and then later buying used GPU lowered it further but the frequency of such price revisions and the magnitude was much less than you can expect from ASICs. Title: Re: ASIC Difficulty Curves Post by: MrTeal on November 08, 2012, 07:02:54 PM In the 3 months between May and August 2011, hashrate increased by a factor of 10 as everyone started GPU mining. It was then basically flatlined until for a year until this summer when the price jumped. Given the assumption that people are making about price staying constant, I'd say it's much more likely that we'll see an initial huge surge as all of 6-12 month payoff slack is taken up, and then a tapering off of hashrate growth. One thing to keep in mind is that ASICs introduce a new variable... hardware pricing. While they have large upfront costs the per unit cost is far lower than current retail price. So if/when new sales flatline (and difficulty stagnates) ASIC sellers can drop prices significantly. Sell the same unit for 50% of current price and suddenly it looks very profitable and sales start to pour back in (and in time difficulty takes another leg up). Months later the same stagnation occurs and one can cut prices again and again and again. After selling the same units at 3 or 4 price points the profits can be rolled into an improved design at a smaller manufacturing process and the same process starts all over. We didn't see that "much" with GPU. Yeah as 5000 series hit end of life there were some "sales" and closeouts which resulted in lower hardware cost (MH/$) and then later buying used GPU lowered it further but the frequency of such price revisions and the magnitude was much less than you can expect from ASICs. True, though there will be limits to that. BFL is obviously in the drivers seat there, if they can get their costs down. I'm unsure how low the price on something like ASICMINER could go, given their 4.2GH/J efficiency. BFL might be able to get 1TH/s down to $5000, but ASICMINER would have trouble with that when they have to deal with powering, housing and cooling 4.2kW. That's all assuming price stays constant, as I said. If (and when) prices for hardware drop (or the price of BTC rises), you would expect another inrush of hashing power. Title: Re: ASIC Difficulty Curves Post by: bcpokey on November 09, 2012, 02:13:49 AM In the 3 months between May and August 2011, hashrate increased by a factor of 10 as everyone started GPU mining. It was then basically flatlined until for a year until this summer when the price jumped. Given the assumption that people are making about price staying constant, I'd say it's much more likely that we'll see an initial huge surge as all of 6-12 month payoff slack is taken up, and then a tapering off of hashrate growth. One thing to keep in mind is that ASICs introduce a new variable... hardware pricing. While they have large upfront costs the per unit cost is far lower than current retail price. So if/when new sales flatline (and difficulty stagnates) ASIC sellers can drop prices significantly. Sell the same unit for 50% of current price and suddenly it looks very profitable and sales start to pour back in (and in time difficulty takes another leg up). Months later the same stagnation occurs and one can cut prices again and again and again. After selling the same units at 3 or 4 price points the profits can be rolled into an improved design at a smaller manufacturing process and the same process starts all over. We didn't see that "much" with GPU. Yeah as 5000 series hit end of life there were some "sales" and closeouts which resulted in lower hardware cost (MH/$) and then later buying used GPU lowered it further but the frequency of such price revisions and the magnitude was much less than you can expect from ASICs. That's a very good point, that I hadn't really considered previously, so thanks for bringing it up. It's actually an interesting distortion to the curve, a cost-bending to hardware to combat the almost inevitable hardware sale stagnation. One can only hope that it would be done in a timely fashion, as too immediate a drop would be tantamount to spitting in the early-adopters faces ("thanks for bankrolling development, now all the johnny come-lately folks get a free ride on your buck, and knock down your ROI"). If companies take the long view though, and BTC remains relatively stable/successful, I can see this leading to good things as the new tech becomes more accessible to all, and of course, as stronger hash rates shore up the security of bitcoin. Title: Re: ASIC Difficulty Curves Post by: organofcorti on November 10, 2012, 08:31:27 AM Used logistic function as the basis for the chart. I'm going to carry on with some more scenarios based on the population growth models with the follow up longer term difficulty chart. I think the parallels between BTC mining and Population growth in ecology are a great match. http://en.wikipedia.org/wiki/Logistic_function Try using the log-logistic or log-normal functions. I think they might be a better model and more what you're after. Title: Re: ASIC Difficulty Curves Post by: bitboyben on November 11, 2012, 08:39:09 AM Used logistic function as the basis for the chart. I'm going to carry on with some more scenarios based on the population growth models with the follow up longer term difficulty chart. I think the parallels between BTC mining and Population growth in ecology are a great match. http://en.wikipedia.org/wiki/Logistic_function Try using the log-logistic or log-normal functions. I think they might be a better model and more what you're after. Title: Re: ASIC Difficulty Curves Post by: organofcorti on November 11, 2012, 08:57:43 AM Used logistic function as the basis for the chart. I'm going to carry on with some more scenarios based on the population growth models with the follow up longer term difficulty chart. I think the parallels between BTC mining and Population growth in ecology are a great match. http://en.wikipedia.org/wiki/Logistic_function Try using the log-logistic or log-normal functions. I think they might be a better model and more what you're after. But we don't reproduce. With our technology I mean. Well, I never did, anyway. Maybe others are not so squeamish ;) Title: Re: ASIC Difficulty Curves Post by: ercolinux on November 11, 2012, 09:25:27 AM ...... Even with bitboyen's estimate of 270TH/s giving a difficulty of ~38M, very few people are going to invest in new ASICs if the price drops down to $5 without massive hardware price drops. It will be interesting to see what the mining factor 100 (or maybe USD/24hr@100GH/s now) will be once things stabilize in the spring. If bitboyben's calculations are correct, D=38 million would be due to already purchased ASICs - unless the exchange rate drops very low they will be running constantly to get a return on their investment sooner. No moer ASICs need be purchased. If the rate does drop significantly (like your US$5/BTC suggestion) D will only drop slowly - people paying more electricity will stop mining first. Due to nature of ASIC people that mine with them will not stop unless they lose lot of money in doing that (2 or 3BTC of power for every BTC mined IMHO): no way to resell them plus the fact that probably new generation of even faster or less power hungry ASIC can be presented in any future so in case of price drop keep the ASIC offline it's a direct loss of hundreds of $, it's less dangerous lost some money in mining and keep the bitcoin hoping that in future price will rise again. Title: Re: ASIC Difficulty Curves Post by: kjlimo on November 11, 2012, 12:41:22 PM Used logistic function as the basis for the chart. I'm going to carry on with some more scenarios based on the population growth models with the follow up longer term difficulty chart. I think the parallels between BTC mining and Population growth in ecology are a great match. http://en.wikipedia.org/wiki/Logistic_function Try using the log-logistic or log-normal functions. I think they might be a better model and more what you're after. What? BTC per day is a limited resource? How are things going to go down? Oh knows... I'm so blissfully unaware....?!?!?!? Title: Re: ASIC Difficulty Curves Post by: MrTeal on November 11, 2012, 06:05:38 PM Used logistic function as the basis for the chart. I'm going to carry on with some more scenarios based on the population growth models with the follow up longer term difficulty chart. I think the parallels between BTC mining and Population growth in ecology are a great match. http://en.wikipedia.org/wiki/Logistic_function Try using the log-logistic or log-normal functions. I think they might be a better model and more what you're after. What? BTC per day is a limited resource? How are things going to go down? Oh knows... I'm so blissfully unaware....?!?!?!? Maybe for you. I bought a few ASICs and now I'm going to retire. Title: Re: ASIC Difficulty Curves Post by: Joshwaa on November 16, 2012, 03:16:48 PM I ordered 5 and I have already retired. This is good no?
Title: Re: ASIC Difficulty Curves Post by: bitboyben on November 27, 2012, 07:18:09 PM Well BFL just announced that they will be receiving 100,000 chips. Does this mean ASIC mining will become marginally profitable in mere months?
Title: Re: ASIC Difficulty Curves Post by: ercolinux on November 27, 2012, 07:37:38 PM Well BFL just announced that they will be receiving 100,000 chips. Does this mean ASIC mining will become marginally profitable in mere months? 100.000 chips are 12500 Single boards or 500 MiniRig or a total of 750.000GHash/s -> 750THash/s. If is true this make ASIC not profitables at all unless a big jump in bitcoin price: if only BFL sell ASIC with this numbers a Single will take 2 years to repay itself at $0,15/KWh and a MiniRig 500 days. Title: Re: ASIC Difficulty Curves Post by: MrTeal on November 27, 2012, 07:47:28 PM Well BFL just announced that they will be receiving 100,000 chips. Does this mean ASIC mining will become marginally profitable in mere months? 12,500 Singles at current prices is over $16M worth of product. Do you think BFL is going to be able to sell that much in a few months? Title: Re: ASIC Difficulty Curves Post by: bitboyben on November 27, 2012, 07:58:42 PM Yes good point.
I guess it means that they can sell it as fast as they can make them. If they can push out 20,000 chips in ~ two months then it seems possible to get the other 80,000 in eight months. But yes sales are also key. If I was to take my assumptions further it would put pressure on miners to buy more hardware sooner while difficulty is projected to be lower. But that would increase the Sales/difficulty even faster. Thoughts? Title: Re: ASIC Difficulty Curves Post by: scrybe on November 28, 2012, 01:17:10 AM I'm thinking that the 100k chip order will last at least 4-6 months, maybe longer. We are only looking at 10-15k to cover the initial preorders that ship "though the end of the year" that cut off in September IIRC.
One of the latest tidbits that leaked from Josh was that Rev 1 (i.e. not this run, January or later) would potentially be packaged in ceramic, so there might be a 25-50% faster unit available from them within a few months. This is mixed news as early adopters will have to trade-up or resell their old unit to get the same speed, but it might or might not be worth it. We will have Moore's law speed increases for a bit yet which is about 1.5x faster per year, as well as some catch-up that could get closer to modern processes. These are NOT the last ASICs to be produced or sold, unless bitcoin fails entirely, and soon. I also did a rough model on log10, and it seems like the curve is too steep at the beginning, or the end depending on how many time periods you use. I'm assuming a period of large clearing batches (5k? 10k? chips/week) for backorders from mid-December (network impact date, not ship) to mid Feb. Then smaller batches once they catch up, in the hundreds of chips per week, maybe thousands if the +/- is still high. This updates my current hypothesis: I think BFL (and a lot of others) are making a solid bet on the long term value of bitcoin rising. We should be able to look forward to at least 50-100% price increase in 2013, maybe much, much more. Once the hockey-stick curve comes on BTC value BFL and others want to be all spun up and ready to sell into the consumer level ASIC wars that will result. Right now we are modeling the supply side of the equations because our demand on ASIC has been starved for so long. We also have to remember to look at the demand side of the equation where more folks will rush to participate if the margins (or perceived margins by those bad at math) get too high. So right now BFL (and others) are making some money, but when I can buy a terahash for under 200BTC, they get to say: http://a.tgcdn.net/images/products/additional/large/e5a4_bazinga_hoodie.jpg So, I think it's a bad idea to count out price changes, do your model at a few different price points for EoY with a linear model and see how it effects things. Title: Re: ASIC Difficulty Curves Post by: kjlimo on December 11, 2012, 05:33:54 AM ... This updates my current hypothesis: I think BFL (and a lot of others) are making a solid bet on the long term value of bitcoin rising. We should be able to look forward to at least 50-100% price increase in 2013, maybe much, much more. Once the hockey-stick curve comes on BTC value BFL and others want to be all spun up and ready to sell into the consumer level ASIC wars that will result. ... If you think the price is going up, I'm pretty sure you should buy bitcoins and not bitcoin hardware... Haven't done the math in a while, but if you think there's going to be a 50-100% increase in BTC price, then buying bitcoins will make you a lot more money than buying hardware. this was true 12 months ago, this was true 6 months ago, and I think it will remain true for the next 6-12 months. That being said, I've put $5k USD into bitcoins and $5k USD into hardware b/c I believe these are slightly hedged against one another. My hardware is an investment based upon the believe that price could stay the same level (or even lower); while my bitcoin investment is based upon my belief that the price could continue to grow as adoption increases. Happy investing. Title: Re: ASIC Difficulty Curves Post by: scrybe on December 11, 2012, 01:23:22 PM ... This updates my current hypothesis: I think BFL (and a lot of others) are making a solid bet on the long term value of bitcoin rising. We should be able to look forward to at least 50-100% price increase in 2013, maybe much, much more. Once the hockey-stick curve comes on BTC value BFL and others want to be all spun up and ready to sell into the consumer level ASIC wars that will result. ... If you think the price is going up, I'm pretty sure you should buy bitcoins and not bitcoin hardware... Haven't done the math in a while, but if you think there's going to be a 50-100% increase in BTC price, then buying bitcoins will make you a lot more money than buying hardware. this was true 12 months ago, this was true 6 months ago, and I think it will remain true for the next 6-12 months. That being said, I've put $5k USD into bitcoins and $5k USD into hardware b/c I believe these are slightly hedged against one another. My hardware is an investment based upon the believe that price could stay the same level (or even lower); while my bitcoin investment is based upon my belief that the price could continue to grow as adoption increases. Happy investing. I generally agree, but I'm going 4:1 because I view it as buying discounted coins on an ongoing basis, if you don't cash out the profits right away. Mining for ASIC early adopters should be able to hit 100%+ ROI within 12 months, everything after that is like a free BitCoin. (and the profits are so heavily weighted toward the front that the risk decreases as you continue to mine.) I like your last point the best, if I make 100%+ ROI at current prices (to plan) AND the price goes up 2, 3, 10, or 100 times, I'll be even more happy. Or it could be that I'm a huge geek and I could not resist the lure of the "humming boxes that make Magic Nerd Money" and helping out on a cool project. Title: Re: ASIC Difficulty Curves Post by: MrTeal on December 11, 2012, 02:38:53 PM I'm of the opinion that when looking at mining hardware, just convert to Bitcoin and then stay there. Yes there is power costs and that expense will be tied to the exchange rate, but energy is minor enough that you can make an estimate without completely throwing out your calculations.
Right now the question is whether spending about BTC100 on a 72GH/s bASIC or 60GH/s Single SC will return BTC100 within a reasonable time frame and before energy costs start to become a major percentage of income. |