|
Title: Bumping into scarcity: does this graphic explain it well? Post by: coastermonger on March 08, 2013, 04:48:03 AM Title: Re: Bumping into scarcity: does this graphic explain it well? Post by: redwraith on March 08, 2013, 04:58:31 AM As long as they have utility, scarcity will continue driving it up, despite the occasional violent sell-off.
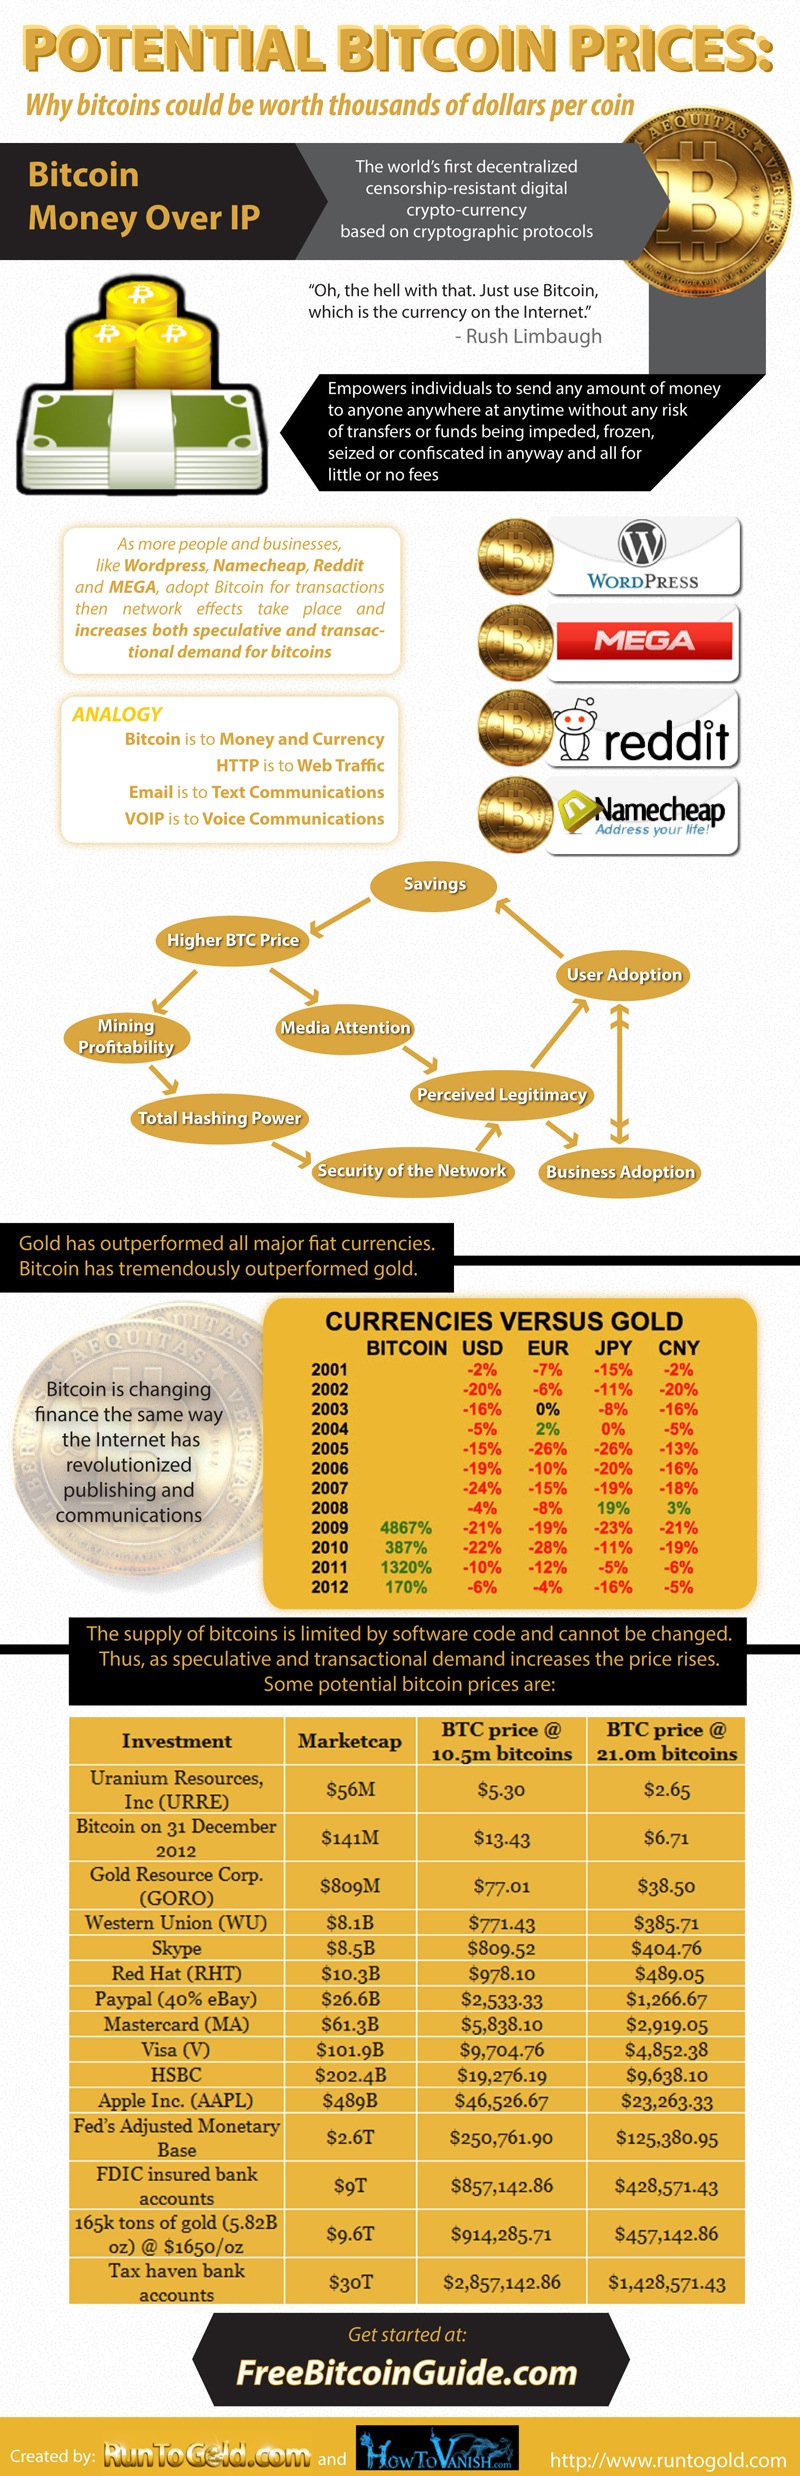
Title: Re: Bumping into scarcity: does this graphic explain it well? Post by: inge on March 08, 2013, 08:49:36 AM If people is starting using Bitcoins for real transactions, as I think they are, than demand will keep growing.
Regards, Inge Title: Re: Bumping into scarcity: does this graphic explain it well? Post by: sunnankar on March 08, 2013, 04:25:54 PM If people is starting using Bitcoins for real transactions, as I think they are, than demand will keep growing. Exactly. http://www.runtogold.com/images/potential-bitcoin-prices.jpg Title: Re: Bumping into scarcity: does this graphic explain it well? Post by: Spaceman_Spiff on March 08, 2013, 05:40:52 PM OP, that sounds about right to me.
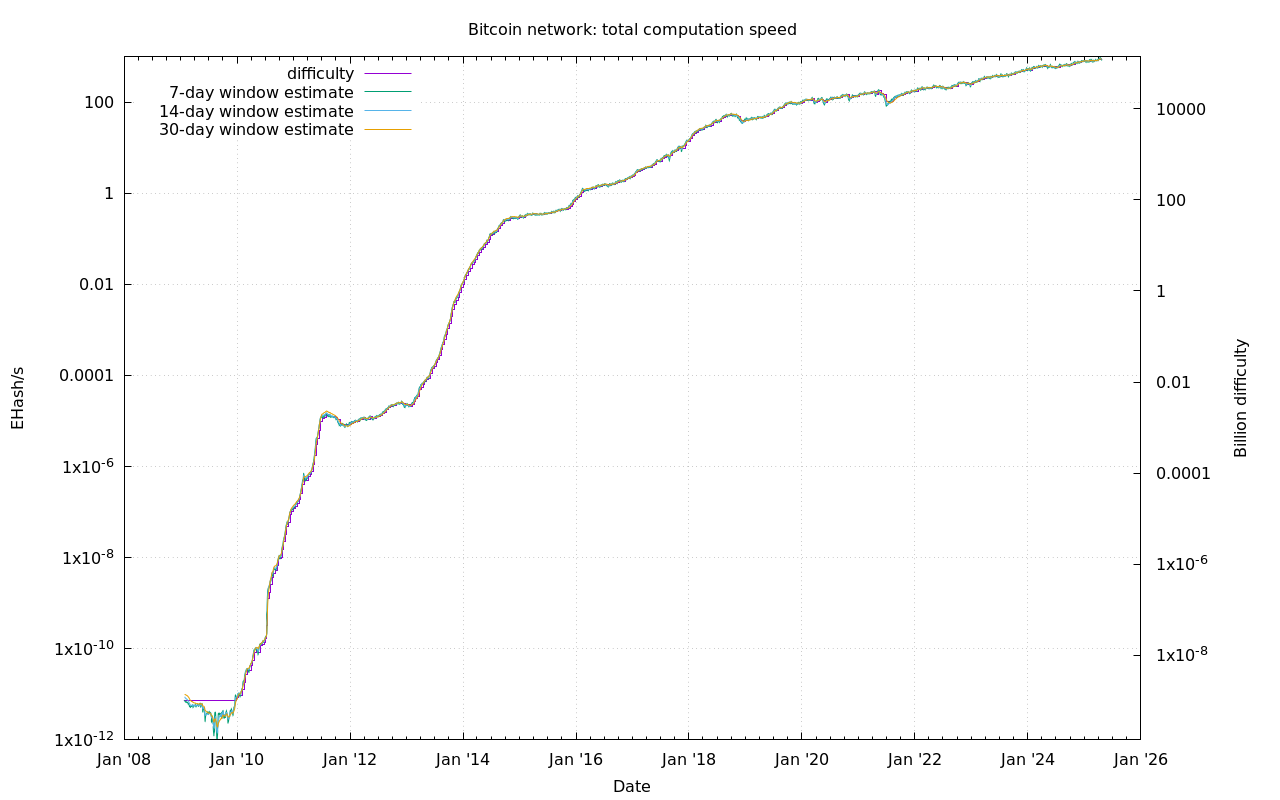
Trace, nice collection of data. Didn't know market cap of Mastercard and Visa were so big compared to AAPL (thought AAPL would be an order of magnitude higher). Title: Re: Bumping into scarcity: does this graphic explain it well? Post by: mobodick on March 08, 2013, 06:23:53 PM I think this cannot be complete. In both selloff events (the 2011 one and the recent one) the driving force was a revolution in mining hardware. THIS is what drives the price up but it is missing from the picture. Since the mining algotithm is energy bound i expect future hardware to have less spectacular effects on the price. Title: Re: Bumping into scarcity: does this graphic explain it well? Post by: niko on March 09, 2013, 05:20:17 PM I think this cannot be complete. What revolution in hardware in 2011 are you talking about? GPU mining kicked off in summer 2010.In both selloff events (the 2011 one and the recent one) the driving force was a revolution in mining hardware. THIS is what drives the price up but it is missing from the picture. Title: Re: Bumping into scarcity: does this graphic explain it well? Post by: mobodick on March 09, 2013, 06:34:59 PM I think this cannot be complete. What revolution in hardware in 2011 are you talking about? GPU mining kicked off in summer 2010.In both selloff events (the 2011 one and the recent one) the driving force was a revolution in mining hardware. THIS is what drives the price up but it is missing from the picture. But it didn't gain tracking untill early 2011. Title: Re: Bumping into scarcity: does this graphic explain it well? Post by: byronbb on March 09, 2013, 06:41:11 PM I think this cannot be complete. What revolution in hardware in 2011 are you talking about? GPU mining kicked off in summer 2010.In both selloff events (the 2011 one and the recent one) the driving force was a revolution in mining hardware. THIS is what drives the price up but it is missing from the picture. But it didn't gain tracking untill early 2011. OPenCL 1.0 was released Oct 1 2010 and within 2 weeks someone decided to buy 500k bitcoins. Title: Re: Bumping into scarcity: does this graphic explain it well? Post by: niko on March 09, 2013, 06:54:09 PM I think this cannot be complete. What revolution in hardware in 2011 are you talking about? GPU mining kicked off in summer 2010.In both selloff events (the 2011 one and the recent one) the driving force was a revolution in mining hardware. THIS is what drives the price up but it is missing from the picture. But it didn't gain tracking untill early 2011. OPenCL 1.0 was released Oct 1 2010 and within 2 weeks someone decided to buy 500k bitcoins. http://bitcoin.sipa.be/speed-ever.png As for your "someone bought 500k coins" - https://i.imgur.com/Ds4lhfC.png The volume over these couple of days may have been 500k coins, worth approximately $35k. What is the point you are trying to make? Just 2 weeks after Jupiter and Mars were in opposition two years ago, someone dumped $144k. Clearly, this is correlated. Title: Re: Bumping into scarcity: does this graphic explain it well? Post by: byronbb on March 09, 2013, 07:26:11 PM I think this cannot be complete. What revolution in hardware in 2011 are you talking about? GPU mining kicked off in summer 2010.In both selloff events (the 2011 one and the recent one) the driving force was a revolution in mining hardware. THIS is what drives the price up but it is missing from the picture. But it didn't gain tracking untill early 2011. OPenCL 1.0 was released Oct 1 2010 and within 2 weeks someone decided to buy 500k bitcoins. http://bitcoin.sipa.be/speed-ever.png As for your "someone bought 500k coins" - https://i.imgur.com/Ds4lhfC.png The volume over these couple of days may have been 500k coins, worth approximately $35k. What is the point you are trying to make? Just 2 weeks after Jupiter and Mars were in opposition two years ago, someone dumped $144k. Clearly, this is correlated. OpenCL 1.0 is related to GPU mining which is related to bitcoins. Planets of course having nothing to do with bitcoins, but that was never my suggestion. Avalon was confirmed to be real: the price goes parabolic. OpenCL 1.0 is released giving average joe the ability to mine with his GPUs, a large buy comes in days after. I guess I could fire up paint.exe and draw you a picture but I'll leave it to your interplanetary imagination for now. Title: Re: Bumping into scarcity: does this graphic explain it well? Post by: mobodick on March 09, 2013, 08:14:10 PM I think this cannot be complete. What revolution in hardware in 2011 are you talking about? GPU mining kicked off in summer 2010.In both selloff events (the 2011 one and the recent one) the driving force was a revolution in mining hardware. THIS is what drives the price up but it is missing from the picture. But it didn't gain tracking untill early 2011. OPenCL 1.0 was released Oct 1 2010 and within 2 weeks someone decided to buy 500k bitcoins. http://bitcoin.sipa.be/speed-ever.png Sure, there were people mining with GPUs in 2010, but how many ? You shouldn't look at a log graph because mining is a linear process. So if you look at the graph in the correct context you can clearly see that the gpu tide started to boom in the first part of 2011. Title: Re: Bumping into scarcity: does this graphic explain it well? Post by: yucca on March 12, 2013, 10:09:23 PM Hopefully the day will come when a BTC "price" chart will not exist as all other currencies will be gone. So 1BTC==1BTC and everthing is priced in BTC. I suppose you could price it in gold, but that would yield no information about BTC value, only gold value.
Title: Re: Bumping into scarcity: does this graphic explain it well? Post by: mobodick on March 12, 2013, 10:26:40 PM Hopefully the day will come when a BTC "price" chart will not exist as all other currencies will be gone. So 1BTC==1BTC and everthing is priced in BTC. I suppose you could price it in gold, but that would yield no information about BTC value, only gold value. And how would you decide what you can buy for this 1BTC==1BTC? Huh? Huh? Title: Re: Bumping into scarcity: does this graphic explain it well? Post by: yucca on March 12, 2013, 10:36:53 PM Hopefully the day will come when a BTC "price" chart will not exist as all other currencies will be gone. So 1BTC==1BTC and everthing is priced in BTC. I suppose you could price it in gold, but that would yield no information about BTC value, only gold value. And how would you decide what you can buy for this 1BTC==1BTC? Huh? Huh? The free market would decide, everything would be priced in BTC. I'm thinking quite a time in the future here (all going well). Title: Re: Bumping into scarcity: does this graphic explain it well? Post by: notme on March 13, 2013, 06:05:33 AM OP, that sounds about right to me. Trace, nice collection of data. Didn't know market cap of Mastercard and Visa were so big compared to AAPL (thought AAPL would be an order of magnitude higher). Elevator going down: http://stockcharts.com/c-sc/sc?s=AAPL&p=D&b=5&g=0&i=0&r=1363154698440 |