|
Title: Market Cap and Price plot lines on Charts Post by: Woodford on October 08, 2016, 04:05:44 AM I see market Cap often plotted on altcoin charts with Price line. Sometimes market cap is above price line and sometimes it's below. I know what market cap is, but I don't know what it means when being charted with price. So what does it mean if market cap is plotted on a chart, and it's above or below price line? Is there some web site where I could learn this sort of information?
Woodford Title: Re: Market Cap and Price plot lines on Charts Post by: Yakamoto on October 08, 2016, 04:13:29 AM I see market Cap often plotted on altcoin charts with Price line. Sometimes market cap is above price line and sometimes it's below. I know what market cap is, but I don't know what it means when being charted with price. So what does it mean if market cap is plotted on a chart, and it's above or below price line? Is there some web site where I could learn this sort of information? I would have to see a chart you're referring to in order to understand what it is that you're trying to explain to us. It is possible that the market cap is simply something like a line showing where $10b/$11b is located and it might just be a reference point because of that.Woodford I really have no idea what it is you're trying to explain otherwise. Title: Re: Market Cap and Price plot lines on Charts Post by: MONKEYJUNK on October 08, 2016, 06:05:45 AM What do you are asking? Marketcap or daily volume of trades?
Marketcap is based on the actual price of the coin Title: Re: Market Cap and Price plot lines on Charts Post by: amacar2 on October 08, 2016, 06:29:46 AM If you can provide link to chart you are talking about it will be better, and if you are talking about marketcap chart about altcoins than marketcap may not get updated in real time and price may behave instantly in exchange platforms so you may see some ups and downs in price than calculated from their marketcap. For altcoin marketcap and charts you can use this https://coinmarketcap.com/charts/
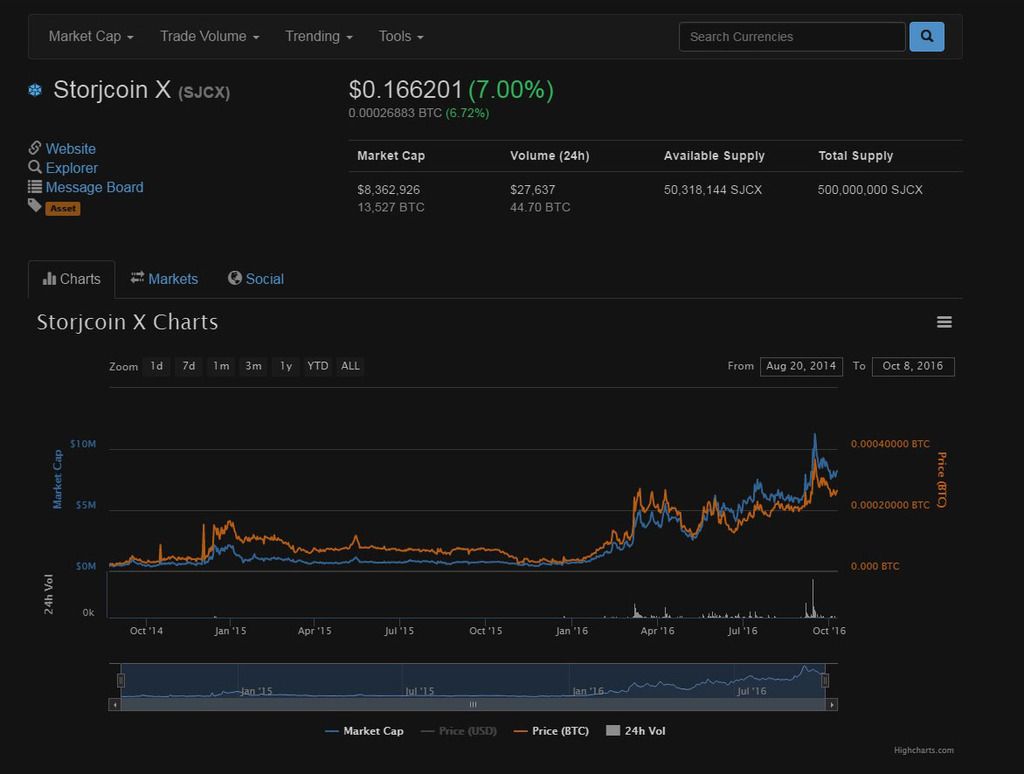
Title: Re: Market Cap and Price plot lines on Charts Post by: pooya87 on October 08, 2016, 06:30:48 AM ~~ I know what market cap is, ~~ think about it again, it is easy: market cap is "Price multiplied by Available supply" so it is simple math. first of all the chart doesn't have the same vertical values one is written on the right and the other is on the left so it is not really a good comparission. but the reason for what you saw is this: when one of these changes faster than the other market cap grows fast and so you see a sharp move in the chart. for example when the altcoin is pumped the price is rising super fast so price * supply goes up super fast hence the sharp move and when it is dumped back again price * supply goes down super fast hence another sharp move. Title: Re: Market Cap and Price plot lines on Charts Post by: Woodford on October 08, 2016, 05:06:29 PM http://img.photobucket.com/albums/v715/3d101/SJCX.jpg
Here is a picture of a chart with both Market cap and Price. I thought perhaps it was a signal indicator when one crossed the other, but from what I am being told here, they are not. Is this correct? So you are saying each one is read separately and that it makes no difference if one crosses another. Does it really matter to a trader what the market cap is on any altcoin? After reading up on market cap about the only difference is low market cap altcoins are more volatile than large market cap altcoins when trading. At least, that is what I read on the subject. Title: Re: Market Cap and Price plot lines on Charts Post by: Wind_FURY on October 09, 2016, 08:13:25 AM I see market Cap often plotted on altcoin charts with Price line. Sometimes market cap is above price line and sometimes it's below. I know what market cap is, but I don't know what it means when being charted with price. So what does it mean if market cap is plotted on a chart, and it's above or below price line? Is there some web site where I could learn this sort of information? Woodford Do not put too much attention to it. If there ever was a correlation between a market cap line being above a price line and profitability to trade the cryptocurrency then it would have been discovered already. The best indicator if you are looking for a cryptocurrency to invest in is the team behind it. A team full of "A" players has a better chance to be successful. My first cryptocurrency investment outside of Bitcoin is Ethereum Classic. I was attracted to the developer Elaine Ou's talent and I believe in her. If she sees something in ETC then that makes me confident in the platform also. |