|
Title: Analysis of Realistic $ Earnings From Butterfly Labs Mining Hardware Post by: ripple on April 15, 2013, 06:00:59 PM I would like to try and simplify calculation of the breakeven point for people who might have ordered a mining rig from butterfly Labs (BFL).
I don't think that the increase in hash rate from other ASIC miners is particularly relevant to calculations of breakeven. This is because of the much bigger hash figure created collectively from every Tom Dick and Harry switching on their computer at night to make Bitcoins. Now that Bitcoin as has become so well-known there must be millions of teenagers whose parents pay for electricity that will quite happily run their computers with a couple of graphics cards in their bedroom 24/7 who collectively become the new competition. There will even be some IT managers sneakily running their vast departments the same way at night. I don't think it's unreasonable to assume that with all the publicity generated about Bitcoin in the media that in the next few months there will be several million additional home or business computers switched on overnight worldwide to mine Bitcoins just using the CPU and Graphics cards. The total computation output of 1 million home or business computers at say 50 MHs is equivalent the output of 10,000 Jalapeno rigs, or equivalent to 1,000 rigs at 50 GHs. Even if they don't make money a valuable lesson may be be learned by home computer owners is that leaving their equipment on, whether mining or idle is costing somebody money! In the breakeven calculation, the more important figure is the difficulty level. This level is now 7,672,999 and increases every two weeks by about 18%. The latest change from 7,672,999 to 9,121,259 is 18.88745%. This analysis shows you a method to calculate profits by adjusting the difficulty for each month. You can decide your own rate of increase in difficulty and adjust the present publicly published figure of 18% up or down. I have compiled the following table showing the difficulty level extrapolated from present figures: Date Difficulty Level --------------------------- 17/04/2013 9,121,259.40 01/05/2013 10,842,874.22 14/05/2013 12,889,439.52 27/05/2013 15,322,288.88 09/06/2013 18,214,332.46 22/06/2013 21,652,242.00 05/07/2013 25,739,048.34 18/07/2013 30,597,229.13 31/07/2013 36,372,379.34 13/08/2013 43,237,574.67 26/08/2013 51,398,558.38 08/09/2013 61,099,907.29 21/09/2013 72,632,361.46 04/10/2013 86,341,537.41 17/10/2013 102,638,285.93 30/10/2013 122,011,004.83 12/11/2013 145,040,275.80 25/11/2013 172,416,263.88 08/12/2013 204,959,401.01 21/12/2013 243,644,973.60 03/01/2014 289,632,350.94 16/01/2014 344,299,730.35 29/01/2014 409,285,440.44 11/02/2014 486,537,040.22 24/02/2014 578,369,685.59 09/03/2014 687,535,512.33 22/03/2014 817,306,114.92 22/03/2014 971,570,593.08 22/03/2014 1,154,952,104.36 22/03/2014 1,372,946,415.71 22/03/2014 1,632,086,606.27 22/03/2014 1,940,138,857.49 22/03/2014 2,306,335,198.06 22/03/2014 2,741,650,178.95 If we now assume that butterfly labs will deliver in July. Let's say 31st of July (so they won't be lying), then the average hash rate per month can be calculated for a Jalepino 5GHs rig as an example. Month 1 is August 2013. Month Average difficulty Earnings ------------------------------------------ 1 39,804,977.00 $186 2 56,249,232.83 $131 3 79,486,949.44 $92 4 112,324,645.38 $65 5 158,728,269.84 $45 6 224,302,187.31 $31 7 316,966,040.65 $22 8 447,911,240.33 $15 9 632,952,598.96 $10 10 894,438,354.00 $6 11 1,263,949,260.04 $4 12 1,786,112,731.88 $2 13 2,523,992,688.50 $1 As you can see the earnings diminish rapidly due to the difficulty level increasing, and are based on a bitcoin price of $100. The above earnings figures are taken from the profit calculator on the butterfly labs website, but importantly I have used a separate calculation for each of the twelve months, using increasing levels of difficulty for each month which their calculator surprisingly omits. I contacted a representative from butterfly labs about this glaring omission from their calculation page on the website and their response was that the increasing difficulty was a perfectly realistic assumption, but that it should be entered into the calculator by buyers for themselves, and it was not the responsibility of the company to do this. In my view their calculator is misleading and misrepresents profit potential as the average consumer would use the existing difficulty level and believe the unlimited riches promised by the company. Profitability will clearly depend on when you receive delivery. The following are three scenarios: 1. End-July Delivery. The total earnings are $609. The basic cost of the unit is $274, or $312 if you are shipping to the United Kingdom by standard air mail. So the profit for the year is $297 if you received at end July and start mining from 1st August. 2. End-August delivery. Now let's say you are unlucky to receive your unit at end of August. Your estimated earnings for the first year would then be $423 less $312 = $111. 3. End-September delivery. If you received your unit at the end of September earnings would be $292 less $312, and you would make an annual loss of $20 !!! So the crux for miners buying from butterfly labs is when they will actually receive the unit. The website states: "Pre-order Terms: Bitforce SC (ASIC) products are in final stage development with initial shipping scheduled for the last half of April 2013. Products are shipped according to placement in the order queue, and delivery may take 2 months or more after order. All sales are final." Their voicemail service by contrast recently stated shipping will commence July 2013, but now has simply states "soon". If you placed your unit early and receive end-July, you might be lucky to double your money. If however you ordered later, or the company delays orders further, and you receive end-September or later your earnings may be squat! I hope this helps people who are thinking of buying the unit from Butterfly labs. It seems the trick to staying ahead is by keeping up-to-date with the latest technology, already having existing fast hardware, and knowing the right timing to incrementally upgrade, in order to keep pace with the difficulty level. :) Title: Re: Realistic Earnings From Butterfly Labs Miners Post by: Frizz23 on April 15, 2013, 06:45:24 PM Thanks for your work, ripple.
The earnings figures are taken from calculator on the butterfly labs website, I hope they delete this calculator asap - because otherwise no one would order their products any more ;) Title: Re: Analysis of Realistic $ Earnings From Butterfly Labs Mining Hardware Post by: jhansen858 on April 16, 2013, 06:01:42 AM I have compiled the following table showing the difficulty level extrapolated from present figures: Date Difficulty Level --------------------------- 17/04/2013 9,121,259.40 01/05/2013 10,842,874.22 14/05/2013 12,889,439.52 27/05/2013 15,322,288.88 09/06/2013 18,214,332.46 22/06/2013 21,652,242.00 05/07/2013 25,739,048.34 18/07/2013 30,597,229.13 31/07/2013 36,372,379.34 13/08/2013 43,237,574.67 26/08/2013 51,398,558.38 08/09/2013 61,099,907.29 21/09/2013 72,632,361.46 04/10/2013 86,341,537.41 17/10/2013 102,638,285.93 30/10/2013 122,011,004.83 12/11/2013 145,040,275.80 25/11/2013 172,416,263.88 08/12/2013 204,959,401.01 21/12/2013 243,644,973.60 03/01/2014 289,632,350.94 16/01/2014 344,299,730.35 29/01/2014 409,285,440.44 11/02/2014 486,537,040.22 24/02/2014 578,369,685.59 09/03/2014 687,535,512.33 22/03/2014 817,306,114.92 22/03/2014 971,570,593.08 22/03/2014 1,154,952,104.36 22/03/2014 1,372,946,415.71 22/03/2014 1,632,086,606.27 22/03/2014 1,940,138,857.49 22/03/2014 2,306,335,198.06 22/03/2014 2,741,650,178.95 You really think a difficulty of 2 Billion is realistic? I don't see it going that high by then. What what do i know. The GPU thing made it spike for a while then it kinda leveld off and even went down for a second. Title: Re: Analysis of Realistic $ Earnings From Butterfly Labs Mining Hardware Post by: ripple on April 16, 2013, 11:01:55 AM jhansen858, its anyone's guess.
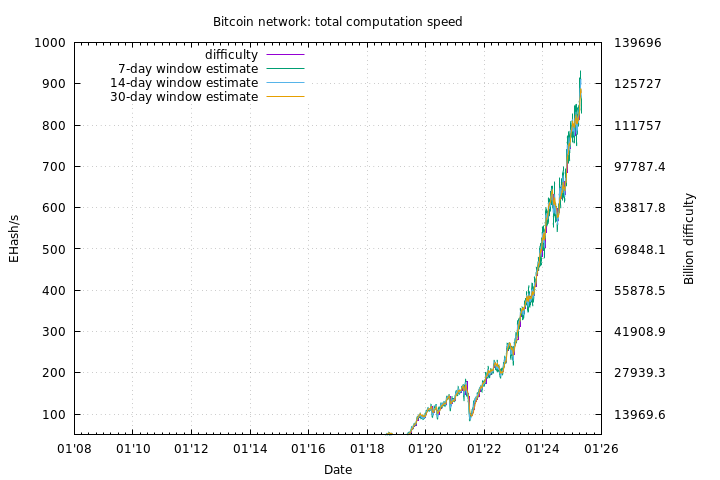
An 18% increase was based on current difficulty lagged from the boom market which may prove to be greatly exaggerated. If prices continue to fall or stabilize at a low price, then the rate of increase in the difficulty levels will definitely reduce. If prices of bitcoins drop further then miners will leave the market and the rate of difficulty levels will drop as a result, as difficulty levels are automatically adjusted depending on the total mining success in the previous period. But this takes us back to profitability levels for mining rigs from butterfly labs which would have to be reworked taking into account reduced profitability from reduced earnings due to the lower price of bitcoins. We may see linear rather than exponential levels in difficulty. So forecasting difficulty levels is about as difficult as forecasting bitcoin prices! It will be interesting to do same analysis in a months time based on the then current difficulty level changes. A lesson here is that anyone considering buying butterfly rig that they should avoid placing an order unless they have first taken into account the fact that the butterfly labs calculator shows a snapshot in time and ignores changes in difficulty level over time. Here is a graph of historic difficulty (courtesy of bitcoin.sipa.be). http://bitcoin.sipa.be/speed-small-lin-ever.png Here is another chart of interest. In the next chart in the top graph the difficulty level is shown in red. This puts the relationship between price and difficulty in a good perspective showing that difficulty levels do also eventually adapt to the price of bitcoins (shown in blue). http://www.bitcoinx.com/charts1/chart_large_lin.png Title: Re: Analysis of Realistic $ Earnings From Butterfly Labs Mining Hardware Post by: Synefiere on April 16, 2013, 01:19:20 PM This puts the relationship between price and difficulty in a good perspective showing that difficulty levels do also eventually adapt to the price of bitcoins (shown in blue). http://www.bitcoinx.com/charts1/chart_large_lin.png VERY VERY eventually .... a lot witht the price going up had to do with the recent interest in the BTC currency and is not essentially in correlation with the difficulty increase. Title: Re: Analysis of Realistic $ Earnings From Butterfly Labs Mining Hardware Post by: greyhawk on April 16, 2013, 01:37:29 PM VERY VERY eventually .... a lot witht the price going up had to do with the recent interest in the BTC currency and is not essentially in correlation with the difficulty increase. Avalon just sold a batch of 10000 individual ASICs to DIY PCB builders, with others on the way. Expect difficulty to rise hard and fast to dingledongle BFL customers in their buttocks. Title: Re: Analysis of Realistic $ Earnings From Butterfly Labs Mining Hardware Post by: organofcorti on April 16, 2013, 03:49:47 PM [...] So forecasting difficulty levels is about as difficult as forecasting bitcoin prices! [....] Not really. Forecasting bitcoin prices is impossible to do with measurable accuracy. Forecasting the network hashrate and difficulty is possible to do with some accuracy. I do weekly forecasts here: http://organofcorti.blogspot.com.au/search?q=%22weekly+forecast%22 The four week forecast network hashrate has been quite accurate recently: http://4.bp.blogspot.com/-Gk0jhHcfa3c/UWuwBkD-2QI/AAAAAAAAHfU/NCMdvBnKVHE/s1600/NetworkForecast.2013-04-15.png (http://organofcorti.blogspot.com.au/search?q=%22weekly+forecast%22) Title: Re: Analysis of Realistic $ Earnings From Butterfly Labs Mining Hardware Post by: mobodick on April 16, 2013, 04:01:03 PM I have compiled the following table showing the difficulty level extrapolated from present figures: Date Difficulty Level --------------------------- 17/04/2013 9,121,259.40 01/05/2013 10,842,874.22 14/05/2013 12,889,439.52 ... I'm sorry but you can only claim any validity to your extrapolation if difficulty was predictable over time. It is not and so your whole story is cool, bro. Or otherwise please show why difficulty must progress along your projections. Title: Re: Analysis of Realistic $ Earnings From Butterfly Labs Mining Hardware Post by: organofcorti on April 16, 2013, 04:02:24 PM I have compiled the following table showing the difficulty level extrapolated from present figures: Date Difficulty Level --------------------------- 17/04/2013 9,121,259.40 01/05/2013 10,842,874.22 14/05/2013 12,889,439.52 ... I'm sorry but you can only claim any validity to your extrapolation if difficulty was predictable over time. It is not and so your whole story is cool, bro. Or otherwise please show why difficulty must progress along your projections. Difficulty *is*, to an extent, predictable. Title: Re: Analysis of Realistic $ Earnings From Butterfly Labs Mining Hardware Post by: mobodick on April 16, 2013, 04:07:04 PM [...] So forecasting difficulty levels is about as difficult as forecasting bitcoin prices! [....] Not really. Forecasting bitcoin prices is impossible to do with measurable accuracy. Forecasting the network hashrate and difficulty is possible to do with some accuracy. I do weekly forecasts here: http://organofcorti.blogspot.com.au/search?q=%22weekly+forecast%22 The four week forecast network hashrate has been quite accurate recently: http://4.bp.blogspot.com/-Gk0jhHcfa3c/UWuwBkD-2QI/AAAAAAAAHfU/NCMdvBnKVHE/s1600/NetworkForecast.2013-04-15.png (http://organofcorti.blogspot.com.au/search?q=%22weekly+forecast%22) You say quite acurate but in reality (the one you share with other people) the predictions are all overestimating by about 20%. I mean, i can predict without any mathy that hashrate will increase in the near future. But the question is, by how much and when in time. If your models cannot predict that then they are useless for the purpose. They don't add any information that could not have been obtained by simply knowing that ASICs wll be delivered. Title: Re: Analysis of Realistic $ Earnings From Butterfly Labs Mining Hardware Post by: mobodick on April 16, 2013, 04:10:43 PM I have compiled the following table showing the difficulty level extrapolated from present figures: Date Difficulty Level --------------------------- 17/04/2013 9,121,259.40 01/05/2013 10,842,874.22 14/05/2013 12,889,439.52 ... I'm sorry but you can only claim any validity to your extrapolation if difficulty was predictable over time. It is not and so your whole story is cool, bro. Or otherwise please show why difficulty must progress along your projections. Difficulty *is*, to an extent, predictable. But is that information better that the information you gain from knowing that BFL hasn't delivered yet? Because i've been waiting for a couple of days now for the hashrate to flatten while the models above keep thinking it will grow more fast. And they already overestimate points that are actually measured and disagrees with it by 20%. So the models say that reality is incorrect according to their predicions. Go figure. Title: Re: Analysis of Realistic $ Earnings From Butterfly Labs Mining Hardware Post by: mobodick on April 16, 2013, 04:14:49 PM I have compiled the following table showing the difficulty level extrapolated from present figures: Date Difficulty Level --------------------------- 17/04/2013 9,121,259.40 01/05/2013 10,842,874.22 14/05/2013 12,889,439.52 ... I'm sorry but you can only claim any validity to your extrapolation if difficulty was predictable over time. It is not and so your whole story is cool, bro. Or otherwise please show why difficulty must progress along your projections. Difficulty *is*, to an extent, predictable. You just need to take into consideration how often the prediction is informative. For one, what is the error rate of these models? If you don't know anything about the error you have no way of assessing the quality of the predicion. Effectively, these graphs are useless. Title: Re: Analysis of Realistic $ Earnings From Butterfly Labs Mining Hardware Post by: organofcorti on April 16, 2013, 04:15:17 PM [...] So forecasting difficulty levels is about as difficult as forecasting bitcoin prices! [....] Not really. Forecasting bitcoin prices is impossible to do with measurable accuracy. Forecasting the network hashrate and difficulty is possible to do with some accuracy. I do weekly forecasts here: http://organofcorti.blogspot.com.au/search?q=%22weekly+forecast%22 The four week forecast network hashrate has been quite accurate recently: [...] You say quite acurate but in reality (the one you share with other people) the predictions are all overestimating by about 20%. I mean, i can predict without any mathy that hashrate will increase in the near future. But the question is, by how much and when in time. If your models cannot predict that then they are useless for the purpose. They don't add any information that could not have been obtained by simply knowing that ASICs wll be delivered. I wrote The four week forecast network hashrate has been quite accurate recently. The average error for the four week forecast for the last 10 ten weeks is 1%, and the absolute error is 5%. I'm not sure what reality you share, but in mine a four week forecast with error that low is pretty good. If you're interested in alternate forecasts using estimated ASIC delivery dates and hashrates instead, I have that covered too: http://organofcorti.blogspot.com.au/search?q=%22ASIC+choices%22-canary Thats what I can do with my mathy. Title: Re: Analysis of Realistic $ Earnings From Butterfly Labs Mining Hardware Post by: organofcorti on April 16, 2013, 04:16:33 PM I have compiled the following table showing the difficulty level extrapolated from present figures: Date Difficulty Level --------------------------- 17/04/2013 9,121,259.40 01/05/2013 10,842,874.22 14/05/2013 12,889,439.52 ... I'm sorry but you can only claim any validity to your extrapolation if difficulty was predictable over time. It is not and so your whole story is cool, bro. Or otherwise please show why difficulty must progress along your projections. Difficulty *is*, to an extent, predictable. You just need to take into consideration how often the prediction is informative. For one, what is the error rate of these models? If you don't know anything about the error you have no way of assessing the quality of the predicion. Effectively, these graphs are useless. Read the posts before you criticise. All the data is there, previous errors, etc. The datasets are also available for you to check. Title: Re: Analysis of Realistic $ Earnings From Butterfly Labs Mining Hardware Post by: creativex on April 16, 2013, 04:20:59 PM While you both make some good points, I find organo's predictions to be a useful tool. While they have been overshooting the difficulty mark somewhat it's easy to use his projections and then adjust slightly as events unfold. ASICMiner is deploying hashes somewhat slower than they predicted and Avalon batch 1 took longer to get out the door than anticipated. Meanwhile BFL is still BFL.
Title: Re: Analysis of Realistic $ Earnings From Butterfly Labs Mining Hardware Post by: mobodick on April 16, 2013, 06:01:49 PM [...] So forecasting difficulty levels is about as difficult as forecasting bitcoin prices! [....] Not really. Forecasting bitcoin prices is impossible to do with measurable accuracy. Forecasting the network hashrate and difficulty is possible to do with some accuracy. I do weekly forecasts here: http://organofcorti.blogspot.com.au/search?q=%22weekly+forecast%22 The four week forecast network hashrate has been quite accurate recently: [...] You say quite acurate but in reality (the one you share with other people) the predictions are all overestimating by about 20%. I mean, i can predict without any mathy that hashrate will increase in the near future. But the question is, by how much and when in time. If your models cannot predict that then they are useless for the purpose. They don't add any information that could not have been obtained by simply knowing that ASICs wll be delivered. I wrote The four week forecast network hashrate has been quite accurate recently. The average error for the four week forecast for the last 10 ten weeks is 1%, and the absolute error is 5%. I'm not sure what reality you share, but in mine a four week forecast with error that low is pretty good. If you're interested in alternate forecasts using estimated ASIC delivery dates and hashrates instead, I have that covered too: http://organofcorti.blogspot.com.au/search?q=%22ASIC+choices%22-canary Thats what I can do with my mathy. Actually, you're right in that you can somewhat predict hashrate. But what your graphs also show is that if the action gets away from the mean your graphs lose predictive power. Due to all the recent movements now is an important time to know something about hashrate. And it is exactly now that your graphs are starting to diverge a lot. It's not difficult to predict that something will continue straight on when it is already going straight. What makes a model powerfull is when it can predict a change from the usual. Now that there is turmoil your model becomes increasingly clueless. How can you take a prediction seriously if it already diverges by 20% from a measured point and only seems to diverge more in the future? If your model gave you 1% untill now, wouldn't you say that it must be missing something realy realy big for it to give you so much deviation now? Title: Re: Analysis of Realistic $ Earnings From Butterfly Labs Mining Hardware Post by: mobodick on April 16, 2013, 06:04:39 PM I have compiled the following table showing the difficulty level extrapolated from present figures: Date Difficulty Level --------------------------- 17/04/2013 9,121,259.40 01/05/2013 10,842,874.22 14/05/2013 12,889,439.52 ... I'm sorry but you can only claim any validity to your extrapolation if difficulty was predictable over time. It is not and so your whole story is cool, bro. Or otherwise please show why difficulty must progress along your projections. Difficulty *is*, to an extent, predictable. You just need to take into consideration how often the prediction is informative. For one, what is the error rate of these models? If you don't know anything about the error you have no way of assessing the quality of the predicion. Effectively, these graphs are useless. Read the posts before you criticise. All the data is there, previous errors, etc. The datasets are also available for you to check. The other site seems mostly decent, i was criticizing the three graphs you posted and their obvious deviation from reality. Title: Re: Analysis of Realistic $ Earnings From Butterfly Labs Mining Hardware Post by: Marrs on April 16, 2013, 07:10:07 PM Here is a graph of historic difficulty (courtesy of bitcoin.sipa.be). http://bitcoin.sipa.be/speed-small-lin-ever.png Although organofconti has done a good job of predicting short term difficulty changes, I think it's unrealistic to extrapolate the short term trends far into the future. As this graph shows, there have been a few different regimes in the historical difficulty trends. 1. Only CPU mining (steady growth) 2. Initial GPU mining (sharp difficulty spike) 3. GPU mining common, FPGA mining available (steady growth) 4. Initial ASIC mining (sharp spike) - The current regime At each new technological step, the hash rate per dollar spent increased by an order of magnitude. FPGAs don't count as a technological leap, because they only incrementally improved the hash rate per dollar of TCO. Once ASICs become common, I expect the difficulty growth to level off to a steady rate, until the next major technological leap which increases hash rate by 10x per dollar (or more). ASICs 2.0 will probably not be that leap. Based on that, I think it's quite reasonable to predict the following regimes: 5. ASIC mining common (steady growth) 6. Initial New Technology (sharp spike) I think Regime 4 is likely to last through the summer. It's impossible to say how long Regime 5 will last, but I think first generation ASICs will remain profitable for the duration of Regime 5 and into the early stages of Regime 6, in the same way that GPUs from 2011 are still profitable. Title: Re: Analysis of Realistic $ Earnings From Butterfly Labs Mining Hardware Post by: shivansps on April 16, 2013, 08:08:01 PM ASIC will reduce trust on newcomers, its already hard to explain to a new guy that this is not a scam, try to tell it now you have to buy especialised hardware for it instead of just using any vga card, im sure that the income of new miners will reduce over the time, and swift over to Litecoin and other scrypt based altchains, and BTC will remain in the power the ones that are mining today.
Also there is other sha256 altchains to mine on the 5ghash unit, if i get a 5ghash unit from BFL today ill put it to mine PPC... or solo mine TRC, them exchanging for BTC or even LTC... Also especially on the 5ghash unit from BFL, thats for ones that cant affort the biggers ones like me, there is not other option, tell Avalon to produce 7200 5ghash units at 200 dolars instead of making stupid 600, 60ghash units at 7000 dolars, Avalon is harming the network more than helping it. And the chips they are selling will not reach market in form of working smaller units until the end of the year... Not to mention that ASICminer is not helping at all either. Title: Re: Analysis of Realistic $ Earnings From Butterfly Labs Mining Hardware Post by: polrpaul on April 22, 2013, 02:49:31 PM Do you really see Difficulty rising at a linear rate?
Why don't you try calculating Difficulty based on something slightly more predictable, like network hash rate? Title: Re: Analysis of Realistic $ Earnings From Butterfly Labs Mining Hardware Post by: mobodick on April 22, 2013, 04:17:43 PM At each new technological step, the hash rate per dollar spent increased by an order of magnitude. FPGAs don't count as a technological leap, because they only incrementally improved the hash rate per dollar of TCO. Once ASICs become common, I expect the difficulty growth to level off to a steady rate, until the next major technological leap which increases hash rate by 10x per dollar (or more). ASICs 2.0 will probably not be that leap. I don't agree that you only call GPU and ASIC a technological step. All new forms of mining are a technological step. ASICs are the end station in IC design at the moment. Nothing faster than ASICs. I think that now that we are on ASICS the growth will start alligning with the usual moore's curves of current tech. Which means about 2x better every 2 years or so. We will probably see some more spikes when the ASICs go to smaller processes but nothing shocking after that. Untill quantum computers destroy criytography, that is. Title: Re: Analysis of Realistic $ Earnings From Butterfly Labs Mining Hardware Post by: KS on May 05, 2013, 10:18:29 PM +1
Everyone who's spending 2500+ USD on a mining rig will just hop onto the ASIC bandwagon and it will be business as usual for "serious" miners....I don't think it will take long either (ppl might take longer to switch if ASICs are delivered slowly but they will switch if they intent to stay profitable). Title: Re: Analysis of Realistic $ Earnings From Butterfly Labs Mining Hardware Post by: Schrankwand on May 06, 2013, 09:31:55 PM I have compiled the following table showing the difficulty level extrapolated from present figures: Date Difficulty Level --------------------------- 17/04/2013 9,121,259.40 01/05/2013 10,842,874.22 14/05/2013 12,889,439.52 27/05/2013 15,322,288.88 09/06/2013 18,214,332.46 22/06/2013 21,652,242.00 05/07/2013 25,739,048.34 18/07/2013 30,597,229.13 31/07/2013 36,372,379.34 13/08/2013 43,237,574.67 26/08/2013 51,398,558.38 08/09/2013 61,099,907.29 21/09/2013 72,632,361.46 04/10/2013 86,341,537.41 17/10/2013 102,638,285.93 30/10/2013 122,011,004.83 12/11/2013 145,040,275.80 25/11/2013 172,416,263.88 08/12/2013 204,959,401.01 21/12/2013 243,644,973.60 03/01/2014 289,632,350.94 16/01/2014 344,299,730.35 29/01/2014 409,285,440.44 11/02/2014 486,537,040.22 24/02/2014 578,369,685.59 09/03/2014 687,535,512.33 22/03/2014 817,306,114.92 22/03/2014 971,570,593.08 22/03/2014 1,154,952,104.36 22/03/2014 1,372,946,415.71 22/03/2014 1,632,086,606.27 22/03/2014 1,940,138,857.49 22/03/2014 2,306,335,198.06 22/03/2014 2,741,650,178.95 You really think a difficulty of 2 Billion is realistic? I don't see it going that high by then. What what do i know. The GPU thing made it spike for a while then it kinda leveld off and even went down for a second. Let me argue the case why these numbers are completely bonkers. These numbers assume an 18% increase over the former month, steadily. This is an exponentially growing function. Bitcoins are generated in a steady fashion, meaning that the network adjust the difficulty to keep the hashrate in line with the time Blocks are mined. So, that means that if you are mining with 1% of the network and then later, 0.5% of the network, the difficulty will have to rise accordingly to reward you with the now fitting portion of the network rewards, not counting transaction fees. That means that if you were mining 36BTC at 1% of the network, it would mean you are at 18BTC at 0.5% of the network, per day. Now, this leads us to the coming table. The table that will consider that if we assume difficulty increases like that, it will correlate largely with the hashrate. The following table assumes an absolutey 100% linear correlation in hash rate and difficulty, which we will find, is the theoretical ideal, just never met because of variance of people starting and stopping their devices. I have used the number from above, because the talks of "Difficulty is 1 billion, get out of Bitcoin" people tended to annoy me. http://i42.tinypic.com/168sdg2.jpg If you think, people will invest a whopping 1.2 billion dollars in mining equipment and get that started by 2014, by my guest. If you think all the ASIC companies together will manufacture to the order of 500.000 50gh miners and get them sold, be my guest. If you think that this is absolutely bonkers, like me, lets assume something more reasonable. You can take the amount of money invested and pick one of the numbers that feels "right" for you. See how much money is flowing in bitcoin land and in miners' land. Title: Re: Analysis of Realistic $ Earnings From Butterfly Labs Mining Hardware Post by: cdog on May 07, 2013, 07:20:17 PM ^ Good post, interesting. But what about newer ASICs which are faster, cheaper, and more efficient in terms of mh/joule?
Title: Re: Analysis of Realistic $ Earnings From Butterfly Labs Mining Hardware Post by: Schrankwand on May 07, 2013, 07:24:06 PM ^ Good post, interesting. But what about newer ASICs which are faster, cheaper, and more efficient in terms of mh/joule? Not factored in of course. However not designed yet and I doubt delivered before February. Title: Re: Analysis of Realistic $ Earnings From Butterfly Labs Mining Hardware Post by: KS on May 07, 2013, 07:51:59 PM BFL won't ship 10.000 50GH/s ASICs and Avalon have shipped between 300 and 600 65GH/s ASICs.
Assuming BFL did ship 10K ASICs, that would still put us only in the 60-70 million range, according to the "Ripple table". Title: Re: Analysis of Realistic $ Earnings From Butterfly Labs Mining Hardware Post by: Schrankwand on May 07, 2013, 11:53:24 PM BFL won't ship 10.000 50GH/s ASICs and Avalon have shipped between 300 and 600 65GH/s ASICs. Assuming BFL did ship 10K ASICs, that would still put us only in the 60-70 million range, according to the "Ripple table". Good. At 64 million according to that table, I make 0.008BTC a day per GH. A 50gh miner therefore makes 0,4BTC in 24 hours, making me 12 BTC a month, meaning it goes break even in... 2 months. Come on guy, what the heck are you complaining about? :D Of course, being first to market would be more awesome, making 70BTC right now, breaking even in 14 days. I get that. But come one... 2 months 100% ROI. I rest my case here... and I believe in 30-40 million actually, not necessarily 60. Title: Re: Analysis of Realistic $ Earnings From Butterfly Labs Mining Hardware Post by: GodfatherBond on May 12, 2013, 08:26:54 PM Quote Let me argue the case why these numbers are completely bonkers. These numbers assume an 18% increase over the former month, steadily. This is an exponentially growing function. Bitcoins are generated in a steady fashion, meaning that the network adjust the difficulty to keep the hashrate in line with the time Blocks are mined. So, that means that if you are mining with 1% of the network and then later, 0.5% of the network, the difficulty will have to rise accordingly to reward you with the now fitting portion of the network rewards, not counting transaction fees. That means that if you were mining 36BTC at 1% of the network, it would mean you are at 18BTC at 0.5% of the network, per day. Now, this leads us to the coming table. The table that will consider that if we assume difficulty increases like that, it will correlate largely with the hashrate. The following table assumes an absolutey 100% linear correlation in hash rate and difficulty, which we will find, is the theoretical ideal, just never met because of variance of people starting and stopping their devices. I have used the number from above, because the talks of "Difficulty is 1 billion, get out of Bitcoin" people tended to annoy me. http://i42.tinypic.com/168sdg2.jpg If you think, people will invest a whopping 1.2 billion dollars in mining equipment and get that started by 2014, by my guest. If you think all the ASIC companies together will manufacture to the order of 500.000 50gh miners and get them sold, be my guest. If you think that this is absolutely bonkers, like me, lets assume something more reasonable. You can take the amount of money invested and pick one of the numbers that feels "right" for you. See how much money is flowing in bitcoin land and in miners' land. Great table, creates some useful perspective. Title: Re: Analysis of Realistic $ Earnings From Butterfly Labs Mining Hardware Post by: dwyer17 on November 27, 2014, 03:39:17 PM You really think a difficulty of 2 Billion is realistic? I don't see it going that high by then. What what do i know. The GPU thing made it spike for a while then it kinda leveld off and even went down for a second. And now it is 40,300,030,328 omg. |