|
Title: This chart doesn't make sense to me Post by: VolanicEruptor on August 24, 2013, 06:26:28 PM http://bitcoin.sipa.be/speed-thumbnail.png
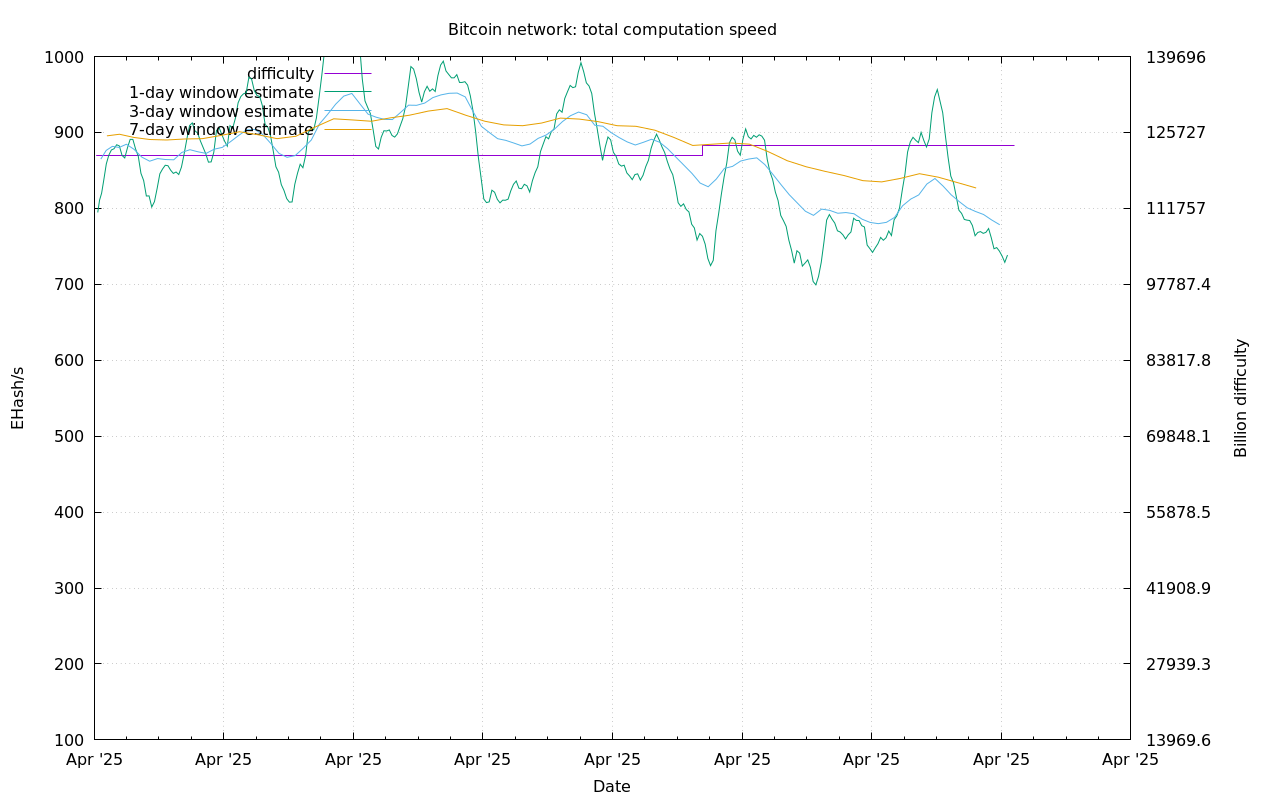
This doesn't really match up to the stats right now. Can anyone make sense of this? Title: Re: This chart doesn't make sense to me Post by: crazyates on August 24, 2013, 07:41:29 PM Rather than looking at the tiny lil thumbnail, why not look at the whole thing?
http://bitcoin.sipa.be/speed-lin-2k.png Network hashrate is approaching 600TH/s, and the difficulty just jumped from 50.8Million to 65.8Million a few hours ago. Title: Re: This chart doesn't make sense to me Post by: rolling on August 24, 2013, 11:54:31 PM http://bitcoin.sipa.be/speed-thumbnail.png This doesn't really match up to the stats right now. Can anyone make sense of this? What doesn't make sense? The blue line is the current target which is 65750060.15 difficulty or 470.66 TH/s. Where are you getting your stats? Title: Re: This chart doesn't make sense to me Post by: jlcooke on August 28, 2013, 02:41:07 PM http://bitcoin.sipa.be/speed-thumbnail.png This doesn't really match up to the stats right now. Can anyone make sense of this? These charts tell us the price of Bitcoins are not correlated to difficulty. Plain and simple. Supply and Demand have taken over and are keeping each other in check for now. Title: Re: This chart doesn't make sense to me Post by: jeffhuys on August 28, 2013, 03:20:10 PM The network speed fluctuates a LOT. Any idea why?
Title: Re: This chart doesn't make sense to me Post by: jlcooke on August 28, 2013, 03:25:33 PM The network speed fluctuates a LOT. Any idea why? Ah, I misunderstood. It varies because some people back out of mining, and other times they jump-in because they just made the dive into bitcoin. Or they got delivery of an ASIC and want use it quickly before it's worthless. If the price of BTC in their currency of choice is too low, they may give up. If it's high enough, they start mining again. There are many reasons for global hashrate fluctuations. Title: Re: This chart doesn't make sense to me Post by: yamancool63 on August 28, 2013, 11:05:24 PM Also luck is a huge one. Hardware reports one hashrate, but the "true" rate is the estimate based on the time it takes to solve blocks. Just like your CGMiner hashrate probably varies somewhat from what your pool reports, just my 2c here.
Title: Re: This chart doesn't make sense to me Post by: rolling on August 29, 2013, 01:55:14 AM The network speed fluctuates a LOT. Any idea why? The graphs show the "estimated" hash rate which is calculated with math using the time is takes to solve several blocks. There is no direct measurement of hashing power. It's just a calculation, so it shows the hash rate going up and down because math only matches reality over a longer term. There is "luck" involved in the short term. If they took the measurement over more blocks, it would be smoother. |