|
Title: Mayer multiple Post by: Crytptohack on February 27, 2018, 01:35:26 AM The average Mayer multiple is 1.47 which is a ratio either above or below the 200 day moving average. When it is mulitiple above the 200 dma, it can be seen as 'overbought' or over priced. when it is below the 200 dma, it can be seen as undervalued or 'oversold'.
With the recent high in December and the low in February, the 'Mayer multiple' has also reached a high and low. One question is, was it the low for 2018? BTC has not been around that long so there is not a lot of historical data. With the average at 1.47, it does make sense to accumulate when it is below the 200 dma if your a long term hodL'er or a longer term trader. On the chart below from OKcoin exchange, i listed the price, date, 200 dma price and the ratio. Interesting way to identify potential purchasing opportunities with BTC. https://i.imgur.com/DyDdyj6.jpg Title: Re: Mayer multiple Post by: cryptocrusher on February 27, 2018, 07:15:22 PM Sorry if I'm mistaken, TA is not my forte, but you did not state what the current Mayer multiple is?
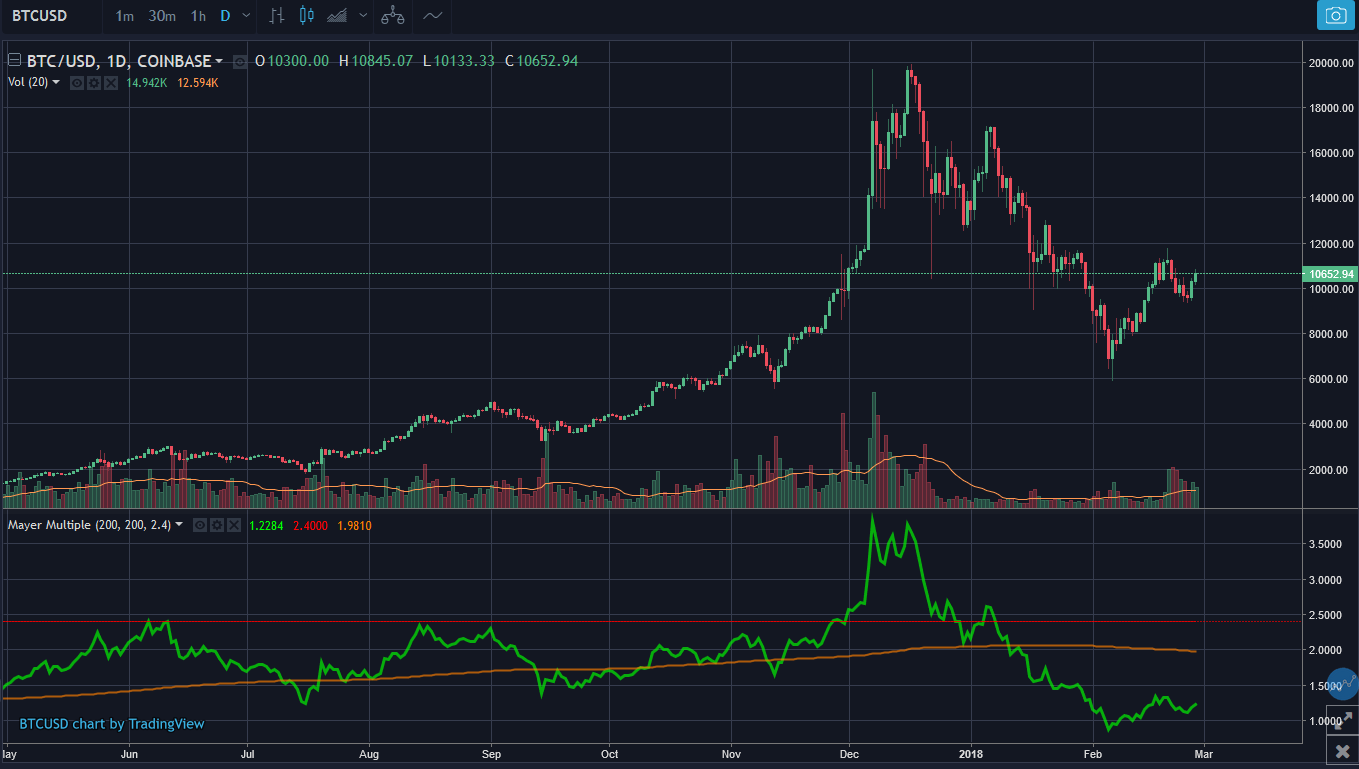
The theory is that anything under 1 is oversold and anything over 1 is overbought, would that not mean then that with an average of 1.47 that bitcoin has historically been very overbought? Title: Re: Mayer multiple Post by: Crytptohack on February 27, 2018, 07:34:48 PM Sorry if I'm mistaken, TA is not my forte, but you did not state what the current Mayer multiple is? The theory is that anything under 1 is oversold and anything over 1 is overbought, would that not mean then that with an average of 1.47 that bitcoin has historically been very overbought? I guess that I assumed that many here would have heard of the Mayer Multiple. You can do a search for Trace Mayer who has been a BTC advocate for quite some time. (At the start of his podcast Bitcoin Knowledge, it states he was purchasing when it was .25) What he is doing is just taking the price of BTC and comparing it to the price of the 200 day moving average. Based on the history of BTC, the average is 1.47. He finds potential buying opportunities when the price is lower than 1 which is was on Feb 6th. It has been as high as 8.2, once. There is a chart with all of the data on a excel spreadsheet on the investor podcast website. You can do a search for it. There are color codes next to the ratios where green is a potential buy and orange/red is overbought and a sell. If the price is a little over 1.47, it does not mean that it is overbought. It is just trading higher than the average historical price based on the 200 dma. Title: Re: Mayer multiple Post by: Denker on February 27, 2018, 07:39:48 PM Sorry if I'm mistaken, TA is not my forte, but you did not state what the current Mayer multiple is? The theory is that anything under 1 is oversold and anything over 1 is overbought, would that not mean then that with an average of 1.47 that bitcoin has historically been very overbought? No 1.47 is the average. Anything below 2.4 is a buy option. As soon as the multiple is above that level it can be seen as overbought! The green one is the mayer multiple. The red is the threshold of 2.4. The yellow line is the plot of the ratio Bitcoin price/200dma. So right now with a mayer multiple of 1.23 it is historically seen extremely attractive to buy as we are below the average of 1.47! http://fs1.directupload.net/images/180227/wq3qgh6o.png (http://www.directupload.net) Title: Re: Mayer multiple Post by: Warren Buffert on February 27, 2018, 07:49:13 PM The average Mayer multiple is 1.47 which is a ratio either above or below the 200 day moving average. When it is mulitiple above the 200 dma, it can be seen as 'overbought' or over priced. when it is below the 200 dma, it can be seen as undervalued or 'oversold'. With the recent high in December and the low in February, the 'Mayer multiple' has also reached a high and low. One question is, was it the low for 2018? BTC has not been around that long so there is not a lot of historical data. With the average at 1.47, it does make sense to accumulate when it is below the 200 dma if your a long term hodL'er or a longer term trader. On the chart below from OKcoin exchange, i listed the price, date, 200 dma price and the ratio. Interesting way to identify potential purchasing opportunities with BTC. https://i.imgur.com/DyDdyj6.jpg Very interesting, too bad we don't have too much data yet to look back on. Title: Re: Mayer multiple Post by: aso118 on February 27, 2018, 09:14:53 PM Sorry if I'm mistaken, TA is not my forte, but you did not state what the current Mayer multiple is? The theory is that anything under 1 is oversold and anything over 1 is overbought, would that not mean then that with an average of 1.47 that bitcoin has historically been very overbought? I guess that I assumed that many here would have heard of the Mayer Multiple. You can do a search for Trace Mayer who has been a BTC advocate for quite some time. (At the start of his podcast Bitcoin Knowledge, it states he was purchasing when it was .25) What he is doing is just taking the price of BTC and comparing it to the price of the 200 day moving average. Based on the history of BTC, the average is 1.47. He finds potential buying opportunities when the price is lower than 1 which is was on Feb 6th. It has been as high as 8.2, once. There is a chart with all of the data on a excel spreadsheet on the investor podcast website. You can do a search for it. There are color codes next to the ratios where green is a potential buy and orange/red is overbought and a sell. If the price is a little over 1.47, it does not mean that it is overbought. It is just trading higher than the average historical price based on the 200 dma. I think the reason the Mayer Multiple is above 1 (at 1.47) is because we have primarily seen the price appreciating over the long term. It would be interesting to see what the Mayer multiple was during the period between 2014 and 2016. After reaching the $20k peak in December 2017, we might be in for a long period of stagnant / low growth. Title: Re: Mayer multiple Post by: magneto on February 28, 2018, 01:44:30 AM Sorry if I'm mistaken, TA is not my forte, but you did not state what the current Mayer multiple is? The theory is that anything under 1 is oversold and anything over 1 is overbought, would that not mean then that with an average of 1.47 that bitcoin has historically been very overbought? I guess that I assumed that many here would have heard of the Mayer Multiple. You can do a search for Trace Mayer who has been a BTC advocate for quite some time. (At the start of his podcast Bitcoin Knowledge, it states he was purchasing when it was .25) What he is doing is just taking the price of BTC and comparing it to the price of the 200 day moving average. Based on the history of BTC, the average is 1.47. He finds potential buying opportunities when the price is lower than 1 which is was on Feb 6th. It has been as high as 8.2, once. There is a chart with all of the data on a excel spreadsheet on the investor podcast website. You can do a search for it. There are color codes next to the ratios where green is a potential buy and orange/red is overbought and a sell. If the price is a little over 1.47, it does not mean that it is overbought. It is just trading higher than the average historical price based on the 200 dma. I think the reason the Mayer Multiple is above 1 (at 1.47) is because we have primarily seen the price appreciating over the long term. It would be interesting to see what the Mayer multiple was during the period between 2014 and 2016. After reaching the $20k peak in December 2017, we might be in for a long period of stagnant / low growth. Yep. Since bitcoin isn't inflationary in nature, in fact potentially deflationary as an asset, and that the adopters are only going to increase over time and the fact that we have experienced multiple big pumps over the past few years, there is no surprise in that average being so high(if it's calculated by the relation of current price and 200 day moving averages). 1.23 seems like a very fair point to buy BTC, although you do have to take into account that 2017, especially the latter part of it, could be a historical anomaly and the moving average was artificially high. Regardless of this excellent piece of TA, bitcoin seems to be extremely attractive to buy right now. We have found a bottom at around $9-10k that will recover every time it hits, and we're not that far up yet. Could be profitable to accumulate now if you have the patience to hold for a few months and wait for the best opportunity. Title: Re: Mayer multiple Post by: cryptocrusher on February 28, 2018, 03:16:00 PM Sorry if I'm mistaken, TA is not my forte, but you did not state what the current Mayer multiple is? The theory is that anything under 1 is oversold and anything over 1 is overbought, would that not mean then that with an average of 1.47 that bitcoin has historically been very overbought? I guess that I assumed that many here would have heard of the Mayer Multiple. You can do a search for Trace Mayer who has been a BTC advocate for quite some time. (At the start of his podcast Bitcoin Knowledge, it states he was purchasing when it was .25) What he is doing is just taking the price of BTC and comparing it to the price of the 200 day moving average. Based on the history of BTC, the average is 1.47. He finds potential buying opportunities when the price is lower than 1 which is was on Feb 6th. It has been as high as 8.2, once. There is a chart with all of the data on a excel spreadsheet on the investor podcast website. You can do a search for it. There are color codes next to the ratios where green is a potential buy and orange/red is overbought and a sell. If the price is a little over 1.47, it does not mean that it is overbought. It is just trading higher than the average historical price based on the 200 dma. I'm sure many will have, just I am not one of the many. I'll definitely look some more in to it when I have some spare time. Sorry if I'm mistaken, TA is not my forte, but you did not state what the current Mayer multiple is? The theory is that anything under 1 is oversold and anything over 1 is overbought, would that not mean then that with an average of 1.47 that bitcoin has historically been very overbought? I guess that I assumed that many here would have heard of the Mayer Multiple. You can do a search for Trace Mayer who has been a BTC advocate for quite some time. (At the start of his podcast Bitcoin Knowledge, it states he was purchasing when it was .25) What he is doing is just taking the price of BTC and comparing it to the price of the 200 day moving average. Based on the history of BTC, the average is 1.47. He finds potential buying opportunities when the price is lower than 1 which is was on Feb 6th. It has been as high as 8.2, once. There is a chart with all of the data on a excel spreadsheet on the investor podcast website. You can do a search for it. There are color codes next to the ratios where green is a potential buy and orange/red is overbought and a sell. If the price is a little over 1.47, it does not mean that it is overbought. It is just trading higher than the average historical price based on the 200 dma. I think the reason the Mayer Multiple is above 1 (at 1.47) is because we have primarily seen the price appreciating over the long term. It would be interesting to see what the Mayer multiple was during the period between 2014 and 2016. After reaching the $20k peak in December 2017, we might be in for a long period of stagnant / low growth. Yep. Since bitcoin isn't inflationary in nature, in fact potentially deflationary as an asset, and that the adopters are only going to increase over time and the fact that we have experienced multiple big pumps over the past few years, there is no surprise in that average being so high(if it's calculated by the relation of current price and 200 day moving averages). 1.23 seems like a very fair point to buy BTC, although you do have to take into account that 2017, especially the latter part of it, could be a historical anomaly and the moving average was artificially high. Regardless of this excellent piece of TA, bitcoin seems to be extremely attractive to buy right now. We have found a bottom at around $9-10k that will recover every time it hits, and we're not that far up yet. Could be profitable to accumulate now if you have the patience to hold for a few months and wait for the best opportunity. Given that the supply of bitcoin will eventually only decrease it's fair to say it's definitely deflationary. From a pure economic point of view as long as adoption continues to increase then price will follow. 9k seems like the new bottom but it's only been tested once. Title: Re: Mayer multiple Post by: marcus_of_augustus on March 08, 2018, 10:29:08 PM Where's it at these days?
|