|
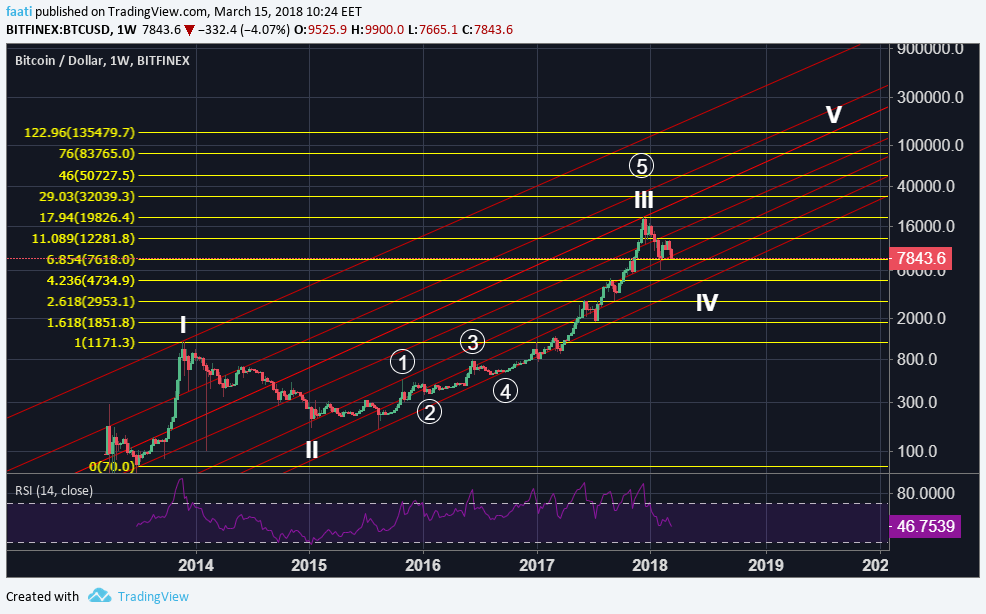
Title: What do you think about this chart? Post by: faatipoke on March 15, 2018, 09:33:27 AM I started thinking that this correction is more sever than I expected. I thought we were in small 4th correction and target was 50k usd. However now I see that we are some like in mid 2014. Please chech my analysis below and comment
https://i.hizliresim.com/lO8p2g.png Title: Re: What do you think about this chart? Post by: hase0278 on March 15, 2018, 12:46:45 PM I started thinking that this correction is more sever than I expected. I thought we were in small 4th correction and target was 50k usd. However now I see that we are some like in mid 2014. Please chech my analysis below and comment I also think that this correction was somehow a repeat of mid 2014 since the panic and the scenario that time is very similar(although it is a little bit different. By the way can I ask you to upload your analysis on another image hosting site? I can't check it since the site refuses connection either from my country or just a problem in my internet. Either way I can't see it even if it is embedded.https://i.hizliresim.com/lO8p2g.png Title: Re: What do you think about this chart? Post by: grimesrhymes on March 15, 2018, 02:42:55 PM Image doesn't display properly so maybe try somewhere else. It's so difficult to say if we will follow the trend of 2014. We're in one of the worst bear periods since then, arguably the worst. I have a feeling that we won't enter such a long bear period and that things will be at a much quicker rate this time around. I don't see the logical reason as to why we would have such a strong bear market right now given that crypto is only continuing to grow in popularity and understanding. Let's come back in a years time and then we will know.
Title: Re: What do you think about this chart? Post by: BrewMaster on March 15, 2018, 03:48:39 PM a lot of things are very different from 2014 (for good or worse) the market is so much bigger, a lot of different people from different countries are involved including the Wall Street bastards.
besides i don't think we can really compare situations and expect the same thing be repeated even if the circumstances were the same. Title: Re: What do you think about this chart? Post by: rlim475 on March 15, 2018, 04:31:59 PM So we're in line for $2k bitcoin :-\ before moving on to over $100k in a few years time. I would be willing to wager right now that at least one of those things is going to happen. There was a 1.5 year bear period in 2014 and 3 years between ATH's (I believe this was the longest gap in bitcoin's history). A bear period is needed to restore expectations and move funds from the weaker hands to the stronger hands but if we are going down the same path then it's going to be a complete decimation and I think that with the spotlight not very much on cryptocurrencies and bitcoin it would be unsurvivable. Anything more than a 6 month bear period right now (we're already nearly halfway through that) and I think that it really could be the end.
Disclaimer: I'm not saying this to spread FUD, I believe firmly in crypto and don't see that scenario happening, but if it does I do see it being final. Title: Re: What do you think about this chart? Post by: nydiacaskey01 on March 15, 2018, 06:01:57 PM a lot of things are very different from 2014 (for good or worse) the market is so much bigger, a lot of different people from different countries are involved including the Wall Street bastards. This is true it may look like a repeat but the players now are different. The countries are not paying attention to crytos back then but now, the government wants to regulate cryptos. They want a piece of the pie. Before its easy to trade, Buy Low, Sell High, nowadays, Buy Low, Sell Lower because of the fud and negative news about Cryptos.besides i don't think we can really compare situations and expect the same thing be repeated even if the circumstances were the same. Title: Re: What do you think about this chart? Post by: greensheep on March 15, 2018, 06:14:04 PM I started thinking that this correction is more sever than I expected. I thought we were in small 4th correction and target was 50k usd. However now I see that we are some like in mid 2014. Please chech my analysis below and comment https://i.hizliresim.com/lO8p2g.png We could also be in a scenario of 2013? Title: Re: What do you think about this chart? Post by: BillyBobZorton on March 15, 2018, 06:19:42 PM I started thinking that this correction is more sever than I expected. I thought we were in small 4th correction and target was 50k usd. However now I see that we are some like in mid 2014. Please chech my analysis below and comment https://i.hizliresim.com/lO8p2g.png We could also be in a scenario of 2013? No, the 2013 scenario cannot ever be repeated, never again. The circumstance was unique. Most of the coins were held in a single centralized exchange which was a disaster. This kind of disaster can never happen. 2018's crash is a joke compared to 2013. Bitcoin's fundamental are stronger than ever, back then even Antonopoulos was scared that it could be the end. Anyone that was around 2013 holding through the crash can't believe people is worried now. What we do have is a bunch of bitter Mt Gox era people that sold and miss the further moonings, and now all of these people are on a strong FUD campaign trying to get back to near MtGox levels to save face. That is literally all . Title: Re: What do you think about this chart? Post by: greensheep on March 15, 2018, 06:24:53 PM I started thinking that this correction is more sever than I expected. I thought we were in small 4th correction and target was 50k usd. However now I see that we are some like in mid 2014. Please chech my analysis below and comment https://i.hizliresim.com/lO8p2g.png We could also be in a scenario of 2013? No, the 2013 scenario cannot ever be repeated, never again. The circumstance was unique. Most of the coins were held in a single centralized exchange which was a disaster. This kind of disaster can never happen. 2018's crash is a joke compared to 2013. Bitcoin's fundamental are stronger than ever, back then even Antonopoulos was scared that it could be the end. Anyone that was around 2013 holding through the crash can't believe people is worried now. What we do have is a bunch of bitter Mt Gox era people that sold and miss the further moonings, and now all of these people are on a strong FUD campaign trying to get back to near MtGox levels to save face. That is literally all . What I actually meant is that the price rose end of 2013 after an early 2013 correction. To me the crash was 2014. Title: Re: What do you think about this chart? Post by: UnDerDoG81 on March 15, 2018, 06:53:21 PM As BTC was at $20k I was saying "this will end like 2014" people were telling "this time its different". We will see. I expect 2k ish in a few weeks/months. There is no more interest in Cryptos at the moment. Will it recover? Nobody knows. I never expected a recover after we hit $200. Then we´ve seen $20k.
Title: Re: What do you think about this chart? Post by: Eternu on March 15, 2018, 08:22:24 PM As BTC was at $20k I was saying "this will end like 2014" people were telling "this time its different". We will see. I expect 2k ish in a few weeks/months. There is no more interest in Cryptos at the moment. Will it recover? Nobody knows. I never expected a recover after we hit $200. Then we´ve seen $20k. What you said when price of bitcoin was $20k, was pure speculation. It would be same if I said "one day we will have unicorns (horses with one horn)". This time it is different, market for cryptos are much much bigger. Every day more and more people are joining crypto world. I believe that 2014. could not repeat, because things are not the same. But what I said doesn't prove that fall of bitcoin is not possible. I believe that this will pass, and Bitcoin will continue its path. And even if Bitcoin doesn't survive this, there will be some other crypto to succeed it. Title: Re: What do you think about this chart? Post by: darkangel11 on March 15, 2018, 08:42:55 PM So the first thing you should realize OP is the thing some of the posters have already mentioned: we are in completely different times. The value can drop and remain volatile, but there are some real life adoption factors that you just can't erase, like the opening of Japanese and Korean markets, where the adoption is much higher than in the rest of the world. That's why you can't begin your analysis the way you did from the 300s. Back then the price was simply jumping up from the bottom and would go to retest the 1k anyway. For the 5k we can thank Japan, while breaking 10k was mainly thanks to Wall Street coming in. As long as they are still in play we won't go to 3k or 1k again.
Title: Re: What do you think about this chart? Post by: crzy on March 15, 2018, 09:03:57 PM This might be a repeat of 2014 correction but the good thing is bitcoin can really have the potential to bounce back in the right time. I didnt expect this dump to happen again in the last quarter of this year, I know it will start to pump again that time.
Title: Re: What do you think about this chart? Post by: Slark on March 15, 2018, 09:17:21 PM It is no use to compare current market chart to older graphs just to point out some similarities - determining bitcoin's price is no simple matter processing technical analysis.
Current price is driven mostly by news - and since we are bombarded with negativity on a daily basis, it's no wonder that bearish sentiment is overwhelming now. The news of Google banning cryptocurrency ads is just one more nail in the coffin - do something like this happened in 2014? Title: Re: What do you think about this chart? Post by: figmentofmyass on March 15, 2018, 09:38:10 PM I started thinking that this correction is more sever than I expected. I thought we were in small 4th correction and target was 50k usd. However now I see that we are some like in mid 2014. Please chech my analysis below and comment not sure about that EW count---i get that the 5th of 3 is extended but i really don't love the proportions. wave 4 also must be pretty short in order to hold that trend. i think it'll change into something else. about the comparison to 2014..... lots of people saying this. maybe so, but in particular i would point out the already apparent difference in fractal. where is the big bull trap? if anything, this looks more like 2011, which would be much worse. anyway, my point is: be open-minded here. "history does not repeat itself, but it rhymes." Title: Re: What do you think about this chart? Post by: omonuyak on March 15, 2018, 09:43:41 PM I think bitcoin has been having a repeat of what has been happening before and after viewing this your analysis it became very clear that we are actually I a deep of what happened in 2014. Hope we recover very soon as we did in 2014? I just like technical analysis because it always explain what has happened before and if you can interpret it very well you will discover that think keep repeating itself.
Title: Re: What do you think about this chart? Post by: pooya87 on March 16, 2018, 04:36:25 AM As BTC was at $20k I was saying "this will end like 2014" people were telling "this time its different". We will see. I expect 2k ish in a few weeks/months. There is no more interest in Cryptos at the moment. Will it recover? Nobody knows. I never expected a recover after we hit $200. Then we´ve seen $20k. Lol. the increased activity of all the old FUD accounts, also the increased number of newbie accounts on bitcointalk which are speaking of doomsday, and on top of all that the increased media coverage of bitcoin and constant talk of how it is dropping, getting dumped, bubble, Mt Gox trustee dumping, banning,.... and a lot more show that there is in fact a huge increase of interest in bitcoin at the very least. Title: Re: What do you think about this chart? Post by: tokeweed on March 16, 2018, 08:43:06 AM There's a thing called the 'gambler's fallacy' that I think could apply here... Just because BTC did something in the past doesn't mean it will do it again in the future. It obv will make our assumptions biased.
Title: Re: What do you think about this chart? Post by: batang_bitcoin on March 16, 2018, 09:10:48 AM I started thinking that this correction is more sever than I expected. It's more severe than we ever thought because bitcoin reached $20,000 and this is the highest price that it went through so witnessing it to plummet is really giving us doubt.I thought we were in small 4th correction and target was 50k usd. We are thinking the same thing and I thought this will be the final wave for this correction but it seems it isn't. Title: Re: What do you think about this chart? Post by: Pursuer on March 16, 2018, 10:14:36 AM I started thinking that this correction is more sever than I expected. It's more severe than we ever thought because bitcoin reached $20,000 and this is the highest price that it went through so witnessing it to plummet is really giving us doubt.there is actually a very good point here. people often forget that the highest price was $20,000 and with current price you can say that bitcoin has lost 60% of its value and if you take the bottom which was reached a while back then you can see the dump was nearly -70% so yeah, we already had something like 2014 dump. the question is how much bigger should it become before the market makers decide that is enough? Title: Re: What do you think about this chart? Post by: Xardasim on March 16, 2018, 12:18:19 PM You should be okay, everything will be good. Bad news is coming out every week in the last 3 months and will continue to come out again. We should to improve this situation and increase our profit, because nothing growing in these days, if we HODL coins.
Title: Re: What do you think about this chart? Post by: Eternu on March 16, 2018, 02:17:18 PM You should be okay, everything will be good. Bad news is coming out every week in the last 3 months and will continue to come out again. We should to improve this situation and increase our profit, because nothing growing in these days, if we HODL coins. I think I understand what you wanted to say, despite your bad Englesh. Most of people think that they can become rich simply by holding their coins, and that was possible before. But now when the hype is gone, holding coins can only bring the price down. If transactions are not constant, price will start falling. And because of that, people will slowly lose their interest in bitcoin. Holders should understand this, and they should start using some portion of their coins. Because if we continue like this, we will lose even more money... instead of earning it. Title: Re: What do you think about this chart? Post by: harizen on March 16, 2018, 02:28:50 PM I started thinking that this correction is more sever than I expected. It's more severe than we ever thought because bitcoin reached $20,000 and this is the highest price that it went through so witnessing it to plummet is really giving us doubt.there is actually a very good point here. people often forget that the highest price was $20,000 and with current price you can say that bitcoin has lost 60% of its value and if you take the bottom which was reached a while back then you can see the dump was nearly -70% so yeah, we already had something like 2014 dump. the question is how much bigger should it become before the market makers decide that is enough? We must take note also of how much bitcoin has gained in the same span of time. People only care for it's price loss and disregarding the growth it was obtained on a short period of time. 2014 price crash also have different associated events why price crash happened. No it's definitely not like the 2014 dump for me. Really a big difference in many aspects and "trend". Title: Re: What do you think about this chart? Post by: carlisle1 on March 16, 2018, 02:48:14 PM You should be okay, everything will be good. Bad news is coming out every week in the last 3 months and will continue to come out again. We should to improve this situation and increase our profit, because nothing growing in these days, if we HODL coins. what do you mean nothing growing in this days If we Hold coins?there will be more thing happening if we will just hold our coins,the value will not drop rapidly because of this action,,i dont believe that 2014 chart is what happing now ,this is only correction and in just a months things will backo normal,hold on,hold stillTitle: Re: What do you think about this chart? Post by: batang_bitcoin on March 16, 2018, 11:43:38 PM I started thinking that this correction is more sever than I expected. It's more severe than we ever thought because bitcoin reached $20,000 and this is the highest price that it went through so witnessing it to plummet is really giving us doubt.there is actually a very good point here. people often forget that the highest price was $20,000 and with current price you can say that bitcoin has lost 60% of its value and if you take the bottom which was reached a while back then you can see the dump was nearly -70% so yeah, we already had something like 2014 dump. the question is how much bigger should it become before the market makers decide that is enough? We must take note also of how much bitcoin has gained in the same span of time. People only care for it's price loss and disregarding the growth it was obtained on a short period of time. 2014 price crash also have different associated events why price crash happened. No it's definitely not like the 2014 dump for me. Really a big difference in many aspects and "trend". Title: Re: What do you think about this chart? Post by: vintages on March 17, 2018, 01:52:15 AM In my own opinion, I do usally think that the chart is most times shouldn't be fully used to contantly looked to predict or believe the next bitcoin price or action because it sometimes clouds ones thought. Maybe 2014 event will take place again in a massive way or maybe not. We are yet to see Whatever this year has to offer for bitcoin, it might come to hit us when we least expect.
Title: Re: What do you think about this chart? Post by: pixie85 on March 17, 2018, 09:03:57 PM Unfortunately I can't say anything about the chart because it says incorrect image. The link must've broken or the image got deleted.
If you're trying to compare the current situation with 2014 it's similar but also different. Similar because both times we had a huge correction. Different because back then there was no adoption and much less people on the market. Title: Re: What do you think about this chart? Post by: grimesrhymes on March 18, 2018, 08:40:55 PM I started thinking that this correction is more sever than I expected. It's more severe than we ever thought because bitcoin reached $20,000 and this is the highest price that it went through so witnessing it to plummet is really giving us doubt.there is actually a very good point here. people often forget that the highest price was $20,000 and with current price you can say that bitcoin has lost 60% of its value and if you take the bottom which was reached a while back then you can see the dump was nearly -70% so yeah, we already had something like 2014 dump. the question is how much bigger should it become before the market makers decide that is enough? We must take note also of how much bitcoin has gained in the same span of time. People only care for it's price loss and disregarding the growth it was obtained on a short period of time. 2014 price crash also have different associated events why price crash happened. No it's definitely not like the 2014 dump for me. Really a big difference in many aspects and "trend". If we were to follow anything similar to 2014 it would mean the price has a long way to slide. Following 2014 crash the price fell about 85%. That would mean a price of $3000 which still seems a way away now. I don't believe that crypto is able to sleep for 3 years like it did after the 2014 crash, there's too much attention and interest now that whatever happens this time around is going to be in a much shorter period. We'll either recover in the next year or be completely wiped out. Title: Re: What do you think about this chart? Post by: figmentofmyass on March 18, 2018, 10:59:43 PM There's a thing called the 'gambler's fallacy' that I think could apply here... Just because BTC did something in the past doesn't mean it will do it again in the future. It obv will make our assumptions biased. sure, there's an element of that. but statistical truisms don't directly apply to markets. no two market conditions play out exactly the same. when it comes to markets and price fractals, i think of it more like history does not repeat itself, but it rhymes. if you've been trading this market for years and years, you start to notice conditions like historically similar fractals and volatility squeezes. those conditions form EV+ opportunities. while there is no guarantee that a fractal or squeeze will perform the same as it did historically, they probably do more than 50% of the time. that doesn't matter though. the important thing is that these patterns can provide discrete boundaries for entries, exits and stop losses. being a successful trader is more about risk/reward and bankroll management than predicting things correctly. Title: Re: What do you think about this chart? Post by: jtipt on March 19, 2018, 03:15:50 AM There's a thing called the 'gambler's fallacy' that I think could apply here... Just because BTC did something in the past doesn't mean it will do it again in the future. It obv will make our assumptions biased. Yes many people just assume that if a correction is looking like a past correction it will follow its footsteps. Each and every correction or bull run is unique for bitcoin, it may be similar to a previous one. Each time there are several factors which decide the trajectory of the price, for example in 2014 bitcoin had far less users than now, this a major factor. Title: Re: What do you think about this chart? Post by: eann014 on March 19, 2018, 05:04:56 AM I started thinking that this correction is more sever than I expected. I thought we were in small 4th correction and target was 50k usd. However now I see that we are some like in mid 2014. Please chech my analysis below and comment Yes, I don't thing bitcoin will reach $50k this year. We just have another dips and I think it is really a big dip this year, maybe better to do is just not to expect more with bitcoin this year. Expecting too much will just hurt us.https://i.hizliresim.com/lO8p2g.png Title: Re: What do you think about this chart? Post by: maydna on March 19, 2018, 07:30:12 AM I started thinking that this correction is more sever than I expected. I thought we were in small 4th correction and target was 50k usd. However now I see that we are some like in mid 2014. Please chech my analysis below and comment https://i.hizliresim.com/lO8p2g.png unfortunately, I cannot see the image but if I take a look at the market, we have a similar trend like a few years ago but I still not sure because the price is up and down too often. but maybe this is the way that bitcoin need to reach a new highest price for bitcoin and soon we can increase higher. but personally, I am not sure that the price has a new target at $50k because I think we still far far away from that price and maybe $20k-$25k is a realistic price for bitcoin in this year. Title: Re: What do you think about this chart? Post by: wxa7115 on March 19, 2018, 06:50:11 PM I started thinking that this correction is more sever than I expected. I thought we were in small 4th correction and target was 50k usd. However now I see that we are some like in mid 2014. Please chech my analysis below and comment The growth of bitcoin was really unexpected, but what was expected was in fact a huge decrease in the price, it was impossible to maintain a price so high for a long time so if your target is 50k then the only thing that I could say is that you will have to wait for a few years for to happen but we will need to get into another bubble, if you want to see 50k as a stable price it is likely you will need to wait a lot longer.https://i.hizliresim.com/lO8p2g.png Title: Re: What do you think about this chart? Post by: tinyhunter112 on June 11, 2018, 02:16:14 PM a lot of things are very different from 2014 (for good or worse) the market is so much bigger, a lot of different people from different countries are involved including the Wall Street bastards.
Title: Re: What do you think about this chart? Post by: logicgate on June 13, 2018, 08:19:33 PM You should be okay, everything will be good. Bad news is coming out every week in the last 3 months and will continue to come out again. We should to improve this situation and increase our profit, because nothing growing in these days, if we HODL coins. I think there is nothing to worry about if the price of bitcoin goes to decreases because it is normal for bitcoin, as it is a digital currency. The price of digital currencies varies within seconds I think we should be patient and in very small time interval the price of bitcoin will regain again because always its price increases when it is decreased and I think the same is happening again. |