|
Title: Daily price analysis BTC + ALTCOINS Post by: Dany44 on March 28, 2018, 10:13:24 AM Here will be the latest price analysis for BTC and altcoins (https://cryptodetail.com/category/altcoins).
We appreciate your opinion. Daily reviews are also placed on https://cryptocomes.com/pricewise (https://cryptocomes.com/pricewise) https://i.imgur.com/CuYXzTr.png (https://cryptocomes.com/pricewise) Title: Re: Daily price watch Post by: adaseb on March 28, 2018, 10:17:09 AM Thanks for the report.
I agree with your settlements. It seems that there might be another June 2017 repeat where all the alts get hammered while BTc breakouts. Only issue now is that the volumes are very low compared to before. Title: Re: Daily price watch Post by: Antgri on March 28, 2018, 10:36:41 AM Good report. It is many good news by different altcoins, but it is not always reflected in price. Title: Re: Daily price watch Post by: kolesozw on March 28, 2018, 10:36:56 AM Thanks for the report. I agree with your settlements. It seems that there might be another June 2017 repeat where all the alts get hammered while BTc breakouts. Only issue now is that the volumes are very low compared to before. OP's conclusions are good. My hopes are for Nov-Dec 2018 recovery after the summer vacations. About the volume, I think it's low because the prices are a lot lower. Of BTC and all alts. Title: Re: Daily price watch Post by: alexcowan on March 28, 2018, 11:46:51 AM Icon is looking good atm. Could see a bit of a rise as it is retesting break out zone. TA below
https://t.me/CryptoInMinutes What do you reckon? Title: Re: Daily price watch Post by: liseff3 on March 28, 2018, 03:32:28 PM With the existence of the results of analysis from the OP which is so detailed and very hit the target. Especially on the subject that is happening right now. Should we make as a consideration so that we aren't wrong in taking action.
NEO/USD NEOs chart is somewhat similar to Moneros, so the same general conclusions can apply. The asset looks slightly better than the market, trading above the boundary of the descending channel. It should be noted that unlike XMR, this boundary has been tested unsuccessfully a few times already. https://i.imgur.com/F3URdgj.png However, hope is kept alive by the huge initiative volume which helped the bulls raise the price by a whole $5, an outstanding result under falling market conditions. Investors clearly indicated their interest in the asset - now all that remains is to wait for the global reversal. For now, the key support for NEO is the mirror level of $54. We cant rule out a falling of the price slightly below this level, but given the support shown by buyers, we prefer not to be needlessly pessimistic. Source: https://cryptocomes.com/btc-stable-xmr-and-neo-encourage-investors-litecoin-crushed-by-negative-news The full support of the Chinese government and its citizens has made Neo grow more hyperactive and has a high resistance to the global decline. Title: Re: Daily price watch Post by: nsasuiteb on March 28, 2018, 04:15:20 PM BTC is stable, some altcoins rise. The worst one is ethereum for sure :'( I think this is difficult time to make decision regarding investment especially for new investors.
Title: Re: Daily price watch Post by: tora on March 28, 2018, 05:19:51 PM I noticed EOS has gained not only against other cryptos but also against fiat these last few days. It is being listed on more exchanges so perhaps that is giving it a boost.
Title: Re: Daily price watch Post by: Dany44 on March 29, 2018, 08:43:52 AM 03/29/18 No Reversal for BTC, No Love for LTC and XRP, but XMR is Looking Good
The middle of the week has passed, but the market is still undecided on the direction of further movement. Once again, we see a tendency of declining trading volumes, although some assets are behaving abnormally, as we will discuss below. It seems that the players are expecting some kind of call to action, but it wont appear out of nowhere either bull or bears will have to take the initiative. Market cap is stable despite varied altcoin activity For the third day in a row, the total capitalization of all crypto assets is fluctuating around $300 bln. Some altcoins continue growing just in the first hundred coins, there are five that have gained more than 20 percent in 24 hours. Overall, about half of the top 100 assets are green by the end of Wednesday. Bitcoin dominance (https://cryptodetail.com/bitcoin-technical-analysis) is still 45 percent, supported by a slow but steady squeezing of juices from assets with the highest capitalization. BTC/USD Our indications for Bitcoin remain relevant, but several new elements have emerged. First, at the beginning of Wednesday, the price finished forming a bullish wedge. The prices exit upward from the figure was accompanied by a significant increase in trading volumes. As a result, the price reached $8,100, and the bulls were already reaching for champagne - but the maneuver turned out to be false, once again. https://i.imgur.com/E3otI3g.png After some fluctuation, everything returned to normal, namely - the level of $7,850, a sort of magnet for the last few days. Yes, we see long shadows on hourly candles, and yes, price lows are in no hurry to be updated, but the fact remains - there are no clear signs for reversal yet. The key support for BTC remains the same - its the level of $7,600 - $7,660. Our recommendation to buy the asset at these prices with a short stop-loss remains in force. LTC/USD Litecoin just cant please investors, and no reasons for joy are foreseeable in the future. At the time of writing the asset is traded at $130, huddling near the support line and clearly trying to fall one level lower. The level of $125, which we wrote about yesterday, received another confirmation - if the rate of decline remains the same, it will coincide with the boundary of the mirror level, to which the price was sensitive as early as December 2017 (marked by an orange line). https://i.imgur.com/z240SN3.png In the case the "support" is broken, the bears goal of $115 is still relevant. Of course, such a decrease is possible only in case of negative Bitcoin influence, since the news of LitePay failure has already played out and no longer puts pressure on the asset. We will periodically return to the analysis Litecoin price, but more out of respect for one of the oldest altcoins. XMR/USD Monero is still clearly following along the parabolic trajectory that we indicated yesterday. There are almost no long red candles, while buyers showed themselves in full force yesterday. We see a huge purchase volume, confirming the interest of investors and, perhaps, the entrance of smart money into the position. We observed something like this on the NEO chart earlier. https://i.imgur.com/In45boD.png This pleasant picture of growth can be spoiled by the fall of Bitcoin, which is more than likely. Meanwhile, the level of $195, from where a large number of long positions was acquired, is a key one, but not the most reliable. Much more solid support is offered by $188, coinciding with the 0.786 Fibonacci retracement. If there is a top altcoin which is an attractive investment now from the point (https://cryptodetail.com/raiblocks-reborn-nano-bitcoin-future) of view of technical analysis - that coin is Monero. In the event that these decline targets are achieved, we recommend buying, with a stop-loss of course (in the current market situation, there is no other way). XRP/USD In the past few days, Ripple has not stood out in any way - the price didnt make any sudden leaps, trading volumes remain consistently low, the lateral support level is almost broken through. We expect a further price decrease to the level of $0.55. https://i.imgur.com/hm2H94f.png There is no talk of growth at this point. XRP has been in a downtrend for a long time and there have been no signs of reversal. Most likely, even after the beginning of global growth (which is sure to happen, one just needs to be patient), Ripple will be one of the coins trailing behind. We recommend that readers refrain from trading. The link: https://cryptocomes.com/no-reversal-for-btc-no-love-for-ltc-and-xrp-but-xmr-is-looking-good Title: Re: Daily price analysis BTC + ALTCOINS Post by: Cryptoprimes on March 29, 2018, 09:33:55 AM What can you say about fundamental reasons for current movement? What news are most dominant?
Title: Re: Daily price analysis BTC + ALTCOINS Post by: Welhell on March 29, 2018, 09:58:00 AM I think that is good. I was preoccupied with Forex, I was able to get there by technical analysis, but I do not know that this mechanism works in cryptocurrency units, because it is so easy to pump-dump here.
Title: Re: Daily price analysis BTC + ALTCOINS Post by: FrueGreads on March 29, 2018, 10:07:21 AM I really laugh with your opening post, as it couldn't be more accurate for the majority of speculators out there. I see you are actually going for a serious analysis of crypto markets and I respect that, because I usually try to do the same. The problem is that we just keep having so many "fake" traps that I really think there is a lot of manipulation going on. The trend is negative right now, and you can probably only play for short bounces. The market is not going to explode anytime soon in my opinion. We will continue seeing a down trend, followed by small bursts simulating recovery, that will just lead to another crash.
Not saying to sell bitcoin, because I won't be selling mine, jut saying that trading is very dangerous right now, in my opinion. From a fundamental point of view, there is not way for the market to keep this downtrend. Bitcoin is getting better so it just has to turn around in my opinion, but that will only happen with real adoption, and that will only happen when we start seeing good LN solutions out there. Title: Re: Daily price analysis BTC + ALTCOINS Post by: Cryptoprimes on March 29, 2018, 10:52:34 AM I really laugh with your opening post, as it couldn't be more accurate for the majority of speculators out there. I see you are actually going for a serious analysis of crypto markets and I respect that, because I usually try to do the same. The problem is that we just keep having so many "fake" traps that I really think there is a lot of manipulation going on. The trend is negative right now, and you can probably only play for short bounces. The market is not going to explode anytime soon in my opinion. We will continue seeing a down trend, followed by small bursts simulating recovery, that will just lead to another crash. Not saying to sell bitcoin, because I won't be selling mine, jut saying that trading is very dangerous right now, in my opinion. From a fundamental point of view, there is not way for the market to keep this downtrend. Bitcoin is getting better so it just has to turn around in my opinion, but that will only happen with real adoption, and that will only happen when we start seeing good LN solutions out there. I can remember that BTC (https://cryptodetail.com/10-ways-spend-your-bitcoin) raised in the moments when we didn't expect, and I am sure next time will be the same. What do you think? Title: Re: Daily price watch Post by: Cryptodetail on March 29, 2018, 02:44:35 PM I read tradingview today, we are getting closed to the turning point. Be ready they said. Should we? Title: Re: Daily price analysis BTC + ALTCOINS Post by: layoutph on March 29, 2018, 03:19:01 PM Hi Danny, I really like your charting, very well explained. I also admire the posted analysis in your blog. I guess I need to condition my self to become half bull and half bear.
I'll be watching your future posts, I am bullish by the way. Title: Re: Daily price analysis BTC + ALTCOINS Post by: Dany44 on March 30, 2018, 07:24:20 AM Hi Danny, I really like your charting, very well explained. I also admire the posted analysis in your blog. I guess I need to condition my self to become half bull and half bear. We try to do our best, the next review is comingI'll be watching your future posts, I am bullish by the way. Title: Re: Daily price analysis BTC + ALTCOINS Post by: Dany44 on March 30, 2018, 07:48:21 AM 03/30/18 Bears Take Market Down; BTC and XMR Struggle, ETH and NEO Share Unlucky Fate
Market is red, investors are blue. Bitcoin is down and altcoins are too We begin our end-of-week market review with a heavy heart. In the last few days, falling prices did not find support from the bulls at key levels, resulting in many assets updating lows of not just the March, but also the February correction. As is often the case in such situations, the activation of protective stop-losses placed by investors at purchase price levels accelerated the fall even more. Bitcoin dominance rises again as situation remains critical Despite the fact that recently the correlation between the main asset and some promising altcoins has been decreasing, in a critical situation Bitcoin continues to set the pace for the entire market. During Thursdays trading, the minimum price of BTC was A$6,660, which is 13 percent less than the previous day. Predictably, dominance grew - to 45.5 percent, which is a new record for 2018. Bitcoin Cash hurt by OKEX closure The rate of decline in the price of altcoins is largely in line with Bitcoin. In the top 10, average losses were in the same 12 - 15 percent range. Ethereum and Litecoin are the worst off, decreasing by 15 percent each and confirming our theory about their loss of investment potential. Bitcoin Cash lost 17 percent, affected by the closing of all trading pairs in BCH market on the OKEX exchange. EOS is still doing better than the rest, its price falling just by 6 percent. BTC/USD Given the scale of the fall, as well as the proximity to the minimums of the previous correction, we are compelled to switch to the daily price chart. The main cause for concern is the breaking of the long-term uptrend, formed back in July 2017. Bitcoin buyers showed some activity near this important level of support, but it was not enough to initiate a reversal yet. https://i.imgur.com/VfIadew.png In the end, the fall was stopped only by the mirror level from Feb. 5 - the day preceding the culmination of the global correction. Today, bulls have a chance to form a reversal candle hammer trend. The ideal scenario in this case - a foothold above the boundary of the ascending channel and testing the level of $7,650, which coincides with the 0.786 Fibonacci retracement. However, so far we do not see a surge in buyer activity, so we can not view this scenario as the default one. In case of continued decline of the fall, the target for bulls today is $5,900- $6,000, coinciding not only with the strong mirror level, but also with the 1.618 Fibonacci retracement. In any case, until there is confirmation of the turnaround, we strongly recommended that readers refrain from trading. ETH/USD A month ago, it was hard to imagine the asset with the second largest capitalization falling even to $500, and today it is trading at $380. It seems that if there is no global market reversal in the very near future, we will see Ethereum at $300 - fair price during the second half of 2017. https://i.imgur.com/Xfllepm.png At the time of writing, the price almost broke the long-term uptrend, which is a very dangerous sign for investors. Given further development of the negative tendency, in free fall ETH will easily reach the nearest significant mirror level $350. A positive scenario would involve gaining a foothold above the boundary of the ascending channel, with subsequent testing of the $450 level. Medium-term investors should start thinking about increasing long positions no earlier than the price reaches this value. XMR/USD Very often, assets that hold up better than the market during a global decline, there comes a critical moment when fear prevails and investors begin to actively record losses before they get too big. But Moneros situation does not look like panic sales. The coin is trading at a price of $163 near the mirror level and the 0.786 Fibonacci retracement. https://i.imgur.com/RSvRlpx.png The key support for XMR today is $150 - the price has rebounded from this level six times already. With a high degree of probability, buyers will meet the asset at this level. In case of a market reversal, the growth targets will be $175 and $190, respectively. NEO/USD NEO is not doing well. At press time, the coin is trading at $49, which is already slightly lower than the previous minimum, and significantly lower than the minimum of the February correction. It seems that due to decreased interest in ICOs, the asset is suffering a fate similar to its older brother Ethereum. https://i.imgur.com/5QzC3gm.png If there is no quick rebound, then the price will break the long-term ascending channel. In this case, the decline targets are $42 and $36, with the possibility of a brief stop at the boundary of the mirror level, marked in red. There is no sense calculating growth scenarios for NEO at the moment, but the key level for bulls is now $60. The link: https://cryptocomes.com/bears-take-market-down-btc-and-xmr-struggle-eth-and-neo-share-unlucky-fate (https://cryptocomes.com/bears-take-market-down-btc-and-xmr-struggle-eth-and-neo-share-unlucky-fate) Title: Re: Daily price analysis BTC + ALTCOINS Post by: entebah on March 30, 2018, 09:26:40 AM What can you say about fundamental reasons for current movement? What news are most dominant? Media continues to ban the advertising of ICO and various cryptocurrency products. google, twitter and then linkedin will do it.then some whales in Japan continue to sell bitcoin so that Bitcoin prices continue to decline. Title: Re: Daily price analysis BTC + ALTCOINS Post by: Cryptoprimes on March 30, 2018, 03:04:12 PM What can you say about fundamental reasons for current movement? What news are most dominant? Media continues to ban the advertising of ICO and various cryptocurrency products. google, twitter and then linkedin will do it.then some whales in Japan continue to sell bitcoin so that Bitcoin prices continue to decline. Don't worry guys, let's wait for more? ;) Title: Re: Daily price analysis BTC + ALTCOINS Post by: entebah on March 31, 2018, 01:34:56 PM What can you say about fundamental reasons for current movement? What news are most dominant? Media continues to ban the advertising of ICO and various cryptocurrency products. google, twitter and then linkedin will do it.then some whales in Japan continue to sell bitcoin so that Bitcoin prices continue to decline. Don't worry guys, let's wait for more? ;) this convinced me that they all agreed to make a bad situation to monopolize the price. everyone stays, let's fight this false news. Title: Re: Daily price analysis BTC + ALTCOINS Post by: Dany44 on April 02, 2018, 09:04:57 AM 04/02/18 Reversal is Delayed: BTC and ETH Update Lows, XMR Fights Against Trend
No fun on April Fools Day. Bitcoin updates local price minimum, accompanied by the other assets The beginning of another spring month did not precipitate a full-fledged arrival of spring to the crypto-currency market. The agonizing yearning for warmth must go on, the sky is still covered with clouds, and Bitcoin price continues to update local lows, encountering no significant resistance on the way. Even some of the altcoins which were blooming like early spring flowers last week do not show any attempts to go against the market (with one exception). BTC dominance sets new records as altcoins fall faster The total capitalization of cryptocurrencies fell to $260 bln, which corresponds to the values of mid-November 2017 - the time before BTC and altcoins went on their crazy rollercoaster ride. In the top 10 assets, nothing interesting is going on - for most positions, prices went down an average of 5 percent. During the weekend, Bitcoin had reached a minimum of $6,430, and at the time of writing, it is fluctuating around $6,900. Its dominance continues to set yearly records and by Monday increased by another two tenths, to 45.7 percent. Verge is the only asset to beat the market The exception that we mentioned above is Verge. In 24 hours, the price of the asset grew by 20 percent, which is an absolute record among all cryptoassets. The interest of buyers is being encouraged by the CEOs announcement of a mysterious partnership, the details of which will be disclosed on April 17. Will developers be able to meet community expectations? We will find out in 2 weeks. BTC/USD Before proceeding to a detailed analysis, we would like to examine the enlarged Bitcoin graph on the daily price chart. Three important facts emerge: BTC is in a long-term downtrend since December 2017, the uptrend line constructed on the September 2017 and February 2018 lows was broken, and the trend which was formed back in July 2017 is being tested right now. https://i.imgur.com/04ezoJB.png On the four-hour chart, we see that the price is squeezed between two uptrends, but Bitcoin has no reliable support anymore. Just to maintain the current levels, buyers must keep prices above $7,000 today, and to transition go growth, they will have to storm $7,200. https://i.imgur.com/CKog5tp.png So far, nothing is indicating that the bulls have enough strength for the push. The situation is exacerbated by the proximity of the boundary of the downtrend, which is acting as a resistance. In the course of the day, Bitcoin is likely to trade in the range of $7,000 - $6,600, but the repeated breaking of the boundary of the lower uptrend will confirm the bulls weakness and allow the bears to begin moving toward $6,000. The Fibonacci grid, indicating a value of 1.618 at $6,110, is just one of the possible constructions based on local triggers, and all of them will point to the zone of the previous February low, so the goal of the sellers remains obvious. ETH/USD Ethereum continues to outpace the market in the rate of decline - last Sunday the price dropped to $360. The rebound amounted to just 5 percent, and by press time the asset is trading at $380. Confirming its love for triangles, ETH is once again forming a figure of technical analysis, the full activation of which will lead the bears to $315. https://i.imgur.com/NGzOCyy.png This level coincides with the mirror resistance formed at the time when ICOs were in their heyday, and Ethereum was relatively young and promising. Despite numerous attempts (5 of them), bulls could not break the boundary of the descending channel, which indicates their extreme weakness. On the way to $315, the price will encounter a few more supports, the main one being at the level of $330. In order to stay afloat, buyers have to keep the price above $390, and then gain a foothold at $415. For now, this seems practically unattainable. XMR/USD Monero buyers do not cease to impress us with their perseverance and ability to find resources to support the asset at a crucial moment. While most of the coins have updated local lows of the end of last week, the price of XMR went right instead of down - not a bad result in a falling market. https://i.imgur.com/SXaMUFZ.png In the event of a reversal, the laterally traded range of $160 - $180 can be a great starting point for price growth to $200. However, since the market is showing no signs of reversal, we continue to view this zone as support. In the context of further decline, the target remains the same - $150, coinciding with the minimum of the February correction. NEO/USD The indications that we used in the March 30 review not only remain relevant, but confirm our previous conclusions. The downtrend line, for lack of any better application, became the support for the price of NEO. It was from this line that NEO rebounded on Sunday when Bitcoin reached its minimum value. We believe that buyers can count on this support going forward. https://i.imgur.com/P7Ujk4f.png The mirror level of $42, on the contrary, lost some of its strength, and the closer the downtrend line approaches it, the less value it will have for supporting the price. Therefore, the next target after breaking through the trend could be $40. Hypothetically, in case of growth, the main resistance still the level of $50. We cannot change our opinion about the attractiveness of NEO for medium-term investments until the price gains a hold above the boundary of the previous upward trend (green line). Source: https://cryptocomes.com/reversal-is-delayed-btc-and-eth-update-lows-xmr-fights-against-trend (https://cryptocomes.com/reversal-is-delayed-btc-and-eth-update-lows-xmr-fights-against-trend) Title: Re: Daily price analysis BTC + ALTCOINS Post by: Cryptoprimes on April 02, 2018, 02:15:19 PM Yeah I feel we are close to new "crazy rollercoaster ride" ::)
Title: Re: Daily price analysis BTC + ALTCOINS Post by: Cryptodetail on April 02, 2018, 05:46:04 PM Hey guys.
I've read today that thousands of tiny but identical orders were opened, which keep against growth at the market. And it's the work of the whales. They have a lot of money to invest so this process will continue for a while. And then fast-moving reverse will begin. What do you think? Title: Re: Daily price analysis BTC + ALTCOINS Post by: Dany44 on April 03, 2018, 08:11:41 AM Hey guys. I've read today that thousands of tiny but identical orders were opened, which keep against growth at the market. And it's the work of the whales. They have a lot of money to invest so this process will continue for a while. And then fast-moving reverse will begin. What do you think? it makes sense. Let's wait a bit Title: Re: Daily price analysis BTC + ALTCOINS Post by: Dany44 on April 03, 2018, 08:19:51 AM 04/03/18 BTC Price Leaves Danger Zone, LTC Still Kicking, XRP Abandoned by Investors
Dont be fooled: early signs of market reversal could be just another bears trap By the beginning of Tuesday, the situation on the cryptocurrency market remains uncertain. Despite the fact that Bitcoin - the indicator of investor sentiment - is hovering near a key level with murky prospects, no tension or panic is evident in the media or on the charts. It seems that market participants have learned to accept the things they cannot change, and are now patiently waiting for a sign to either buy or sell, without showing any initiative. Market indicators are stable, no sign of rapid change Most positions show a slight increase in price, but after updating their lows over the weekend - this is no more than preparation for possible growth. We also find confirmation in key market indicators: the total capitalization grew just by $5 bln to $365 bln, Bitcoin dominance is consistently over 45.5 percent. Top 10 altcoins remain calm, while Verge shows surprising growth The top altcoins followed the main assets growth, increasing 1 to 3 percent. Stellar and Cardano are ahead of the market with increases of 8 and 5 percent, respectively. Beyond the top 10, there is more activity: VeChain grew an impressive 25 percent, NEM and BNB - by 10 percent. Yesterdays leader Verge not only maintained its position, but also capitalized on its achievements, adding another 13 percent. BTC/USD Bulls managed to fulfill the task that we set before them yesterday - not just to keep the price at $7,000, but to make an attempt at $7,200. Theres more good news - almost all of Monday, Bitcoin price lazily dragged along the boundary of the descending channel, but was finally able to overcome it at the end of the day. Now, the main resistance for buyers remains the range of $7,200 - $7,300. https://i.imgur.com/KQaARKb.png (https://cryptocomes.com/btc-price-leaves-danger-zone-ltc-still-kicking-xrp-abandoned-by-investors) As is often the case, good news is followed by bad news, and we do have some. The main issue of concern is growth without volume. The amount and size of transactions is incomparable to what we saw over the weekend. Since April 1, the bears have not shown their influence. Because of this, we are under the impression that big players let go of the price for a while, letting the little guys enjoy the market game. If buyers manage to hold the price above $7,200 today, with or without significant volumes, and if we see some real action at this level, then we can start discussing a possible trend change. In this case, the next target for bulls will be the range of $7,500 - $7,700. Until then, the downtrend scenario remains relevant, $ 6,000 is still calling the bears, although their task is becoming much more difficult. LTC/USD Despite Litecoin creators cruel treatment (https://cryptocomes.com/litepay-goes-under-leaving-egg-on-charlie-lees-face-and-questions-unanswered) of his offspring, there is still life in the asset. At press time, LTC price is $120, while the days minimum value was $110. On the chart, we see the realized "double bottom" figure, which allowed buyers to confidently push off the support line. https://i.imgur.com/cErNgJ2.png (https://cryptocomes.com/btc-price-leaves-danger-zone-ltc-still-kicking-xrp-abandoned-by-investors) Further lateral movement led to a timid break of the boundary of the nearest descending channel. If Bitcoin goes up, the first buyer target will be the level of $130, which gets a double confirmation in the form of the 0.382 Fibonacci extension and the mirror resistance. But if the main asset continues on the path to $6,000, Litecoin price is likely to form a triple bottom at the level of $110 and then, if there is no rebound, sellers will move on to the psychological target of $100. XRP/USD During the weekend, the price of Ripple fell to $0.45 - this is the minimum value since mid-December 2017. The problem with volumes is even more crucial for XRP than for Bitcoin. The last surge in buyer activity was in the beginning of February 2018, and since then investor interest has been falling steadily. This is indicated by the volume profile: for several weeks, the price has been below the last level with a significant amount of transactions - $0.62, and buyers have not made any attempts at an upward break. https://i.imgur.com/HAAX432.png (https://cryptocomes.com/btc-price-leaves-danger-zone-ltc-still-kicking-xrp-abandoned-by-investors) In case of reversal, the first major target for buyers is the range $0.59 - $0.62, which is located between the 0.5 and 0.618 values of the Fibonacci expansion and coincides with several mirror levels. With a high degree of probability, the bulls will not be able to get any further on the first attempt. With negative developments, the rate is unlikely to drop significantly, because XRP has suffered more than most other assets. If buyers are unable to form a double bottom from the level of $0.45, we believe the pain limit of investors to be at $0.4. Source: https://cryptocomes.com/btc-price-leaves-danger-zone-ltc-still-kicking-xrp-abandoned-by-investors Title: Re: Daily price analysis BTC + ALTCOINS Post by: Cryptodetail on April 03, 2018, 01:04:32 PM No any significant news and BTC raises again ::) Sometimes I think it's only media fault. But of course we need to praise bulls efforts.
Title: Re: Daily price analysis BTC + ALTCOINS Post by: Jating on April 03, 2018, 01:54:55 PM OK. This is want I've been calling in the last couple of days as far as bitcoin is concern. Major resistance for me is still at $7100-$7200 but since it has been broken today at $73++ the next goal will be $7700. We have growth around $500 in the last couple of days so we really don't know if the whales is just letting go of the small players getting some minor profit or its just a beginning of a bull run or another trap.
So I still to an extend worry as the bears as still on the surrounding just playing around and not going to hibernate. If we go towards around $7700-$8K it will be a good sign that we might be consolidating for a future run. But if it doesn't hold, expect another minor dip. Its gonna be exciting how investors will react in the next couple of days, so just be very attentive of minor movement in the next 24-48 hours. Title: Re: Daily price analysis BTC + ALTCOINS Post by: Cryptodetail on April 03, 2018, 04:25:17 PM OK. This is want I've been calling in the last couple of days as far as bitcoin is concern. Major resistance for me is still at $7100-$7200 but since it has been broken today at $73++ the next goal will be $7700. We have growth around $500 in the last couple of days so we really don't know if the whales is just letting go of the small players getting some minor profit or its just a beginning of a bull run or another trap. So I still to an extend worry as the bears as still on the surrounding just playing around and not going to hibernate. If we go towards around $7700-$8K it will be a good sign that we might be consolidating for a future run. But if it doesn't hold, expect another minor dip. Its gonna be exciting how investors will react in the next couple of days, so just be very attentive of minor movement in the next 24-48 hours. Thank you for such a valuable advice. So, holding hands on sell button? Title: Re: Daily price analysis BTC + ALTCOINS Post by: Dany44 on April 04, 2018, 07:50:10 AM 04/04/18 Litecoin Outperforms Bitcoin, Monero and NEO on Standby
A local uptrend, but no reversal yet. Market is green for the third day running, while balance of forces remains fragile By the middle of the week, most crypto assets remain green just like the day before, showing growth that in some cases reached double digits. Communities are actively supporting their favorite projects, chasing up the price of individual coins by 20 (Verge, Lisk), 30 (Dragonchain), and 40 (Ardor) percent. A wave of light euphoria has swept the market, but while there are some occasions for joy, losing one's head (https://cryptocomes.com/fractals-and-jackals-in-the-cryptocurrency-market) at this moment is very dangerous. Unreasonable euphoria can play a cruel joke on investors For the second day in a row, the bulls are enjoying continued success, but lets first look at the chart (Bitcoins, for example) and then look truth in the eye- bears have not yet mounted an active resistance. This is not because the market ran out of sellers, they are just waiting for the right moment to open short positions. Over 24 hours, the total capitalization increased by $15 bln, to $275 bln. Bitcoin dominance, on the contrary, fell by five tenths and is now 45 percent, which indicates that funds are starting to be transferred from the main asset to the altcoins. The top 10 coins are led by the struggling Litecoin, which gained nine percent, followed by Ripple with an increase of eight percent. We analyzed the situation with Ripple in yesterday's review (https://cryptocomes.com/btc-price-leaves-danger-zone-ltc-still-kicking-xrp-abandoned-by-investors), given the extent of the dip, this growth leaves us somewhat cold. The remaining assets gained an average of two to three percent, including Bitcoin. BTC/USD During the previous day's trading, Bitcoin price rose to $7,500, with a subsequent relatively slight fallback to the level of $7,250. Once again, we want to emphasize that growth remains quite organic for now, which means that big players (https://cryptocomes.com/between-manipulators-and-the-forces-of-nature-how-bitcoin-market-works) have not influenced the price yet. This theory finds confirmation in trade volumes, which continue to decline. https://i.imgur.com/QaSbx9A.png Today, first and foremost buyers need to maintain achieved positions, namely, not to let prices drop below $7,240. This is the point of intersection for the most significant mirror level in the past three weeks and the 0.786 Fibonacci retracement. If the buyers battle mission is not completed, then it is highly likely that Bitcoin, and the rest of the market with it, will resume its decline... For continued growth, first the bulls need to overcome the boundary of the nearest descending channel. The key point on the chart is the intersection of the last boundary of the global descending channel, the ascending channel and the strong mirror level. It would seem that this arrangement is lacking some Fibonacci harmony value, but it is there- 0.5 of the leverage from March 21 to April 1. The price expression of this point is $7,840, and the bulls need to be there by April 6. In case of an upward break, we will be able to confirm the formation of a new growth trend, but until then the markup speaks for itself, Bitcoin is still in a state of decline. XMR/USD Yesterday, Monero made an elegant enough exit from another descending channel, the break occurred in the context of good volumes, which once again confirms buyer interest. Now the boundary of the channel acts as support, and due to its gentle slope, the bulls have a better chance of not losing the initiative. https://i.imgur.com/h5pY7R0.png Thanks to the positive mood in the market, XMR reached $190 (we wrote about this goal earlier), then came up against the 0.786 Fibonacci retracement. In case of continued growth, the next target is still $200- it receives double confirmation. In a negative scenario, in addition to the support mentioned above, there is the level of $175 which coincides with the minimum from March 18. With a high degree of probability, buyers will make an effort to protect the level. NEO/USD The past two days brought temporary relief to NEO investors. The main achievement of buyers is returning the price to the global growth trend. However, given the precariousness of the situation and the proximity of the trend boundary, the price can tumble down at any moment. In this case, the nearest more or less reliable support is at $45. The last line of defense for the bulls is the mirror support-resistance level formed in the middle of December 2017. https://i.imgur.com/EJhTqbT.png NEO has fewer prerequisites for growth than for decline, but if the celebration in the market continues, the bulls first target will be the range of $58-$60, which could coincide with the upper boundary of the downward channel acting as resistance. Given the uncertainty in the market, we still recommend that readers refrain from buying this asset. LTC/USD Our markup on Litecoin remains relevant, and the applied levels are executed with high accuracy. Despite all the misadventures, yesterday Litecoin buyers found the strength to support the asset, resulting in the price reaching $136. However, due to the lack of confirmation of the global reversal, this height could not be maintained. https://i.imgur.com/vx9UxCz.png At the time of writing, the correction continues and the sellers are clearly going for $125. We described the further goals for the bears yesterday- they are $110 and $100 in case Bitcoin moves toward $6,000. A temporary stop will be made at $120. No matter how hard the Litecoin community is trying, the asset does not look like an attractive investment yet. Source: https://cryptocomes.com/litecoin-outperforms-bitcoin-monero-and-neo-on-standby Title: Re: Daily price analysis BTC + ALTCOINS Post by: ajochems on April 04, 2018, 10:07:10 AM Here will be the latest price analysis for BTC and altcoins. We appreciate your opinion. Daily reviews are also placed on https://cryptocomes.com/pricewise (https://cryptocomes.com/pricewise) https://i.imgur.com/CuYXzTr.png (https://cryptocomes.com/pricewise) Thanks you very much. I had plan to sell the bitcoin at this price due to some further reduction.But your report give some trust to hold the bitcoin . I hope the price of bitcoin will reach some maximum value soon .And I will get some dollars for that. Title: Re: Daily price analysis BTC + ALTCOINS Post by: ericshareworld on April 04, 2018, 11:37:48 AM Thanks for the report. :obut I don't really care daily prices
Title: Re: Daily price analysis BTC + ALTCOINS Post by: Dany44 on April 05, 2018, 07:40:40 AM What is Trading and Cryptocurrency Trading (https://cryptodetail.com/category/crypto-trading), Their Main Features
https://cryptocomes.com/sites/default/files/styles/912x570/public/2018-06/photo_2018-05-24_14-57-11.jpg?itok=VkX3mZvG Crypto trading and its features, the difference between trading and investing, trading tips Trading is an operation where one party buys something from the other party in exchange of money. We do trading in our everyday life when we purchase foodstuff, clothes or even services. This concept is also used for the financial markets where traders and investors buy and sell several types of assets and derivatives. Market participants purchase stocks i.e. for lower price and wait until their cost rises to sell them. The more the price rises from the purchase level, the more profit you can get. This is how it works in general. Nowadays almost everybody can open an account with a special company, named broker (or find a cryptocurrency exchange) and start trading. Blockchain innovations allowed users to start speculations on their own (without any intermediate) as traders are able to enter special exchanges and to place orders to gain money on the price difference. We are going to cover such subjects as history, basics, principles, examples, pros and cons of trading in this introducing article. History of trading First exchanges were established in Europe in XVI century. Their main goal was to provide merchants with marketplaces and the governments with the opportunity to place bonds. Trading with stocks and shares developed later as the response to growing commercial needs and companies expansion. Such notion as trader appeared first with the establishment of London Stock Exchange in the end of the XVII century. Meanwhile, stock trading appeared in Asia one century later. Rice exchange in Japan started to operate in XVII century. This period and geographical location are both interesting for traders as Japan is the home country for Munehisa Homma, who developed his famous Japanese candlestick method, allowing speculators to both read the price properly and to forecast future fluctuations. Currency markets are younger. Forex appeared after the fall of the Bretton Woods system as European countries refused to support gold standard (a system, where currencies were linked directly to gold). Cryptocurrency trading emerged in early 2010s when first exchanges started their activities. Small retail traders and investors were enabled to start trading in the end of 1980s with the appearance of margin trading. In the early 1980s some British dealing companies began to offer services to those individuals who had lower capitals. In 1986, most central banks accepted this trading mechanism and allowed almost unlimited opportunities for people to speculate and to invest in different types of financial assets. What is the difference between trading and investing? There is a big difference between those two notions. The main task of investors is to gain profits gradually, by purchasing and holding assets until their price growths. They also buy stock to get dividends. Trading, on the other hand, involves more frequent buying and selling of assets as speculators aim to generate returns from the price difference. There is one more thing to pay attention to. Investors have less performance than traders. The first group may be content with 10 percent of annual profit when the second group may have about 10 percent monthly. Nowadays this line between traders and investors is almost invisible especially within the cryptocurrency industry. Investors there are long-term (or position) traders while traders are speculators holding their positions for hours or days. Find more on topic https://cryptocomes.com/what-is-trading-and-cryptocurrency-trading-their-main-features Title: Re: Daily price analysis BTC + ALTCOINS Post by: Dany44 on April 06, 2018, 07:50:44 AM 04/06/18 Short Break for Investors as Bitcoin, Litecoin, Monero (https://cryptodetail.com/how-buy-monero-xmr-and-whats-reason-it), NEO Prices Freeze
Bitcoin critical support still holds, but the future is uncertain. The market is frozen by indecision All that the market could achieve by the end of the week is a continued state of uncertainty and indecision about taking the initiative, shown both by bulls and bears. Nevertheless, the data of technical analysis indicates that on Friday and over the weekend the situation can evolve more rapidly and, possibly, dramatically. Market capitalization grew by a tiny $5 bln in the course of the day , and the assets are exhibiting multidirectional movement. Most of the growth is in altcoins: in the first 100, of special note are Tron (plus 35 percent) and Ontology (plus 30 percent) which, by the way, has been growing steadily, even against the market, since the launch of the project. In the top ten, EOS distinguishes itself once again, gaining 10 percent. Crypto not welcome in India Despite the success of individual coins, the general trend does not leave any room for doubt. The news about the alleged ban of cryptocurrencies in India added fuel to the fire. Later, it turned out that actually, it was not a ban (https://cryptocomes.com/reserve-bank-of-india-cracks-down-on-digital-currencies-calls-for-regulated-entities-to-cut-ties), but some restrictions imposed by the Central Bank of India on individuals and legal entities that deal with cryptocurrencies. The markets reaction was not too acute, but this news is a clear example of the new wave of FUD that we spoke about yesterday. BTC/USD Bitcoin spent the last 24 hours in lateral movement within a small price range from $6,600 to $6,900, and at the time of writing its trading exactly in the middle - at $6,750. Reduced volatility has led to the creation of an equilateral triangle which should be resolved soon. The price nearly reached the apex of the triangle, once again confirming the lack of initiative in the market - usually, such triangles are already activated at three quarters of their height. https://cryptocomes.com/sites/default/files/inline-images/Pic01_20.PNG Taking into account that BTC has not been able to break away from the boundary of the ascending channels, as well as the general downward trend, we assume that the price will exit down from the triangle. The first decline target is $6,600, then $6,000 and then - according to the scenario that we described just yesterday. There is still a chance to push off the current values and take an excursion upward, in which case the goal range will be squeezed between the 0.618 and 0.786 Fibonacci extensions and the price levels of $7,150 - $7,300. It is important to understand that slight local growth in the current situation does not negate the possibility of further decline. LTC/USD Litecoin continues to loiter on the bottom, with an increasing risk of making that bottom even deeper. On Thursday, the volatility of the asset decreased significantly, as did trading volumes. Now its a hostage of the situation, and does not have any independency. It doesnt look any better or worse than the market, but given previous successes (https://cryptocomes.com/litepay-goes-under-leaving-egg-on-charlie-lees-face-and-questions-unanswered), its not attractive to investors. https://cryptocomes.com/sites/default/files/inline-images/Pic02_19.PNG The range of LTC fluctuations on Thursday was only $5 - the price chart practically stretched into one long thread. Some resistance from above is given by $120, below there is $110 and the boundary of the descending channel as support. A local Bitcoin reversal could help its little brother reach up to $130, but there are no signs of that for now. In case of decline, all bear targets remain relevant: after breaking through the support, we can expect a fall to the region of $100. NEO/USD NEO is in a situation that is very similar to Litecoin, so let's be brief. Lateral trading can either become a good springboard for growth or a future resistance in case the price goes even lower. The activation of the global wedge (red convergent trend lines) doesnt look realistic at this point. https://cryptocomes.com/sites/default/files/inline-images/Pic03%20%281%29_0.PNG The key NEO support is at the level of $42 - $43, and the intermediate support is at $45. Under the less likely growth scenario, the first target for bulls is located at the 0.5 Fibonacci expansion - exactly $50. Further, buyers will encounter resistance in the form of the boundary of the ascending channel, which can be difficult to overcome. XMR/USD Monero looks somewhat better than LTC and NEO, but only due to the fact that the price is not contained by the nearest descending parallel channel. The buyers deserve no credit for this, however - XMR just fell out of it, without volumes or enthusiasm. https://cryptocomes.com/sites/default/files/inline-images/Pic04_5.PNG The level of $160 seems to be a good aid for investors: the price has rebounded from it 3 times already, although the next storm in the Bitcoin Sea will have no trouble punching a few holes in this support. Now, as before, the bottom is at $150 - its enough to look at the chart and observe the powerful mirror level to confirm the truth of this. In case of descending to these depths, we expect a worthy response from the buyers, and encourage our readers to consider purchasing this asset. Source: https://cryptocomes.com/short-break-for-investors-as-bitcoin-litecoin-monero-neo-prices-freeze Title: Re: Daily price analysis BTC + ALTCOINS Post by: Dany44 on April 09, 2018, 08:50:44 AM 04/09/18 BTC Tries to Escape Critical Level, NEO Skyrockets, Monero Deserves Some Rest
Buyers take initiative while bears rest over the weekend. The market is up, at least for now Over the past weekend, the depressed cryptocurrency market was slightly enlivened not so much by trading volumes, which are still insufficient for a change or a solid confirmation of the trend, but by the news cycle. Although there was some surge in buyer activity, its still not enough for the radical change that everyone is waiting for, without actually making any effort to hasten it. George Soros changes mind about Bitcoin The main newsmaker was George Soros, who previously spoke of Bitcoin as a bubble that he does not want to deal with. Time goes by, people change (even at 87 years old), and the Soros fund is beginning to trade in cryptocurrency. Ethereums April Fools The second person who has been in the spotlight of the crypto community for the past few days is Vitalik Buterin. It seems that there was some truth in the April Fools joke (https://cryptocomes.com/ethereums-buterin-jokingly-suggests-capping-ether-supply-later-says-its-actually-good-idea) about putting a hard cap on Ethereum, or at least these measures are being actively discussed by developers. Usually, deflation mechanisms that are built into assets with a hard cap increase the asset price over time. Well see how this innovation (if it is implemented) will affect the price of Ethereum. By the beginning of the new week, the total market capitalization is $270 bln, which is $15 bln more than on Friday, April 06. Bitcoin dominance decreased slightly and is 44.7 percent. In the top 10, NEO is leading with a gain of 13 percent, followed by Ethereum with 6 percent, and the rest of the assets increased by an average of 2 to 3 percent during the day. BTC/USD Bitcoin buyers managed to bring about a small miracle at the weekend and keep the price above two important supports. However, let's not be deceived - this was possible only because the bears did not show any serious resistance. In any case, at the time of writing the price is $7,100, which is $500 more than at the end of last week. https://cryptocomes.com/sites/default/files/inline-images/Pic01_09.04.PNG The key resistance today is the range of $7,200 - $7,300. If the bulls manage to surmount it, a potential trend reversal will begin to take shape. Above, the price will encounter the upper boundary of the last parallel descending channel, which is a serious obstacle to growth. Support levels that should help buyers succeed are $6,900, where the boundary of one of the parallel channels intersects with the 0.382 value of the Fibonacci grid, and $6,800, represented by the boundary of the long-term ascending channel. The previous four-hour candle (https://cryptocomes.com/cryptotips-how-to-read-candlestick-charts) is green and filled out with good volumes, which can instill confidence in investors and lead to further purchases during the day. Whether this is enough to break the global downward trend - we will find out very soon. ETH/USD Revival in the camp of Ethereum developers has breathed life into the asset and we finally see a slight increase in volumes. In addition, it should be noted that the $360 - $365 zone has become a support, which is looking quite reliable for now.. https://cryptocomes.com/sites/default/files/inline-images/Pic02_09.04.PNG A figure resembling a saucer has been formed on Ethereums price chart. The logic of this formation is that of reversal, however, for its activation, substantial purchases are required at the level of $415. In this case, a local turnaround can help the asset reach the $440 zone, where it will encounter the heavy thundercloud of a strong resistance in the form of a mirror level, a strong 0.382 Fibonacci level and the boundary of one of the parallel channels. Such bastions are not taken on the first try, so a price fallback is to be expected. How strong this fallback will be, and how buyers and sellers will respond to it, will determine the further prospects of Ethereum. NEO/USD What Ethereum buyers have yet to accomplish, the fans of its Chinese brother have already achieved - the NEO chart can be used as a visual aid for beginning traders on the topic of "figures of technical analysis." We see a fully activated saucer: the breaking through the neck of the figure has caused a phenomenal increase in volumes comparable to the purchases of February 6 and March 18 corrections. https://cryptocomes.com/sites/default/files/inline-images/Pic03_09.04.PNG The bulls will have difficulty keeping the pace that has been set - although NEO had demonstrated rapid growth in a short time earlier, for that to happen the market needs to fulfill certain prerequisites. If the price gains a foothold above $55, where the asset is trading at the moment, we can expect lateral movement during the course of the day with an average high of $58. This will allow the bulls to draw a nice flag and move on to storm $60 - $62. However, if the price falls back from the current values, we expect a correction with the testing of the 0.236 Fibonacci level, corresponding to $53. At the moment, NEO looks better than the rest of the market, but its essential to remain vigilant - Bitcoin remains undecided on the direction of its movement. XMR/USD The Monero chart resembles NEO again, but so far we cant see either the exit from the figure or the volumes. Its an alarming sign that buyers did not show activity even after the break through the parallel descending channel. Although, in the past two weeks XMR has often performed better than the market and now deserves a bit of rest. https://cryptocomes.com/sites/default/files/inline-images/Pic04_09.04.PNG The sellers were not able to lower the price below $160 and now it has become a support with triple confirmation. Given a stable Bitcoin, the price of Monero should not fall so low, but this level should be kept in mind. While the asset is trading above that - theres nothing to worry about. In case of continued ascending movement, the next bull target is $190, where a double top will be formed. In addition, the level coincides with the 0.382 Fibonacci extension, and therefore will be difficult to overcome. The link: https://cryptocomes.com/btc-tries-to-escape-critical-level-neo-skyrockets-monero-deserves-some-rest Title: Re: Daily price analysis BTC + ALTCOINS Post by: MAJICOIN on April 09, 2018, 09:48:11 AM Analysis is very helpful to me and now the people are following these reports that through this way we can make profit like if we check the trading sites regularly then we will come to the point that which time is good to buy the bitcoin and other altcoin for the future and through this we can expect the future growth of different altcoins for me it is the best way to check the coins history.
Title: Re: Daily price analysis BTC + ALTCOINS Post by: Dany44 on April 10, 2018, 07:30:19 AM 04/10/18 Market Down Again, No Surprises from BTC and ETH, Hard Times for LTC and XRP
Bears didnt take long to recover. The market is red again with Bitcoin struggling close to support line, while Litecoin and Ripple are in trouble. Having let the young bulls feed on the cryptocurrency pastures for the weekend, on Monday the bears came out of their dens and showed the market who is (still) the boss. Two days of upward movement were corrected literally within two hours, and investors were left with deceived hopes, again. We have repeatedly warned our readers about remaining cautious - in the context of a global downtrend, any local successes may turn out to be a trap. As a result, the market lost about $10 bln, and the total capitalization by the beginning of Tuesday is $260 bln. Bitcoin dominance is declining for the second day - this time, to 44.3 percent. Verge emerges on the market surface again Despite the fact that the most assets are in the red, some projects continue to push against the trend. Primarily, these are our old acquaintances Verge (with an increase of 18 percent) and Ontology (plus 14 percent). They were joined by Golem, growing by 12 percent, Mixin, with an impressive increase of 45 percent (which looks more like a pump) and Polymath with 25 percent of growth. Coins from the top 10 are moving in harmony today: the decrease was 3 - 6 percent for all assets. BTC/USD Yesterday, the bulls failed to achieve the goals that were assigned to them through technical analysis, and as a result Bitcoin could not hold on to the hard-won levels. A 10-day maximum sale volume forced the price down to $6,620, once again testing the strength of the ascending channels. One of them (formed in the middle of July 207) was easily broken, the second (from March 2017) is holding for now - and Bitcoin ended up in a trap. https://cryptocomes.com/sites/default/files/inline-images/Pic01_22.PNG If buyers are able to escape this trap within a few hours, then today we can expect lateral trading from current values to the levels of $7000 - $7100. The price is inside the parallel descending channel again, the boundary of which creates an additional obstacle. At the same time, the chart is showing a fully formed bearish flag, the activation of which will point toward $6000, if the sellers lower the price below the yellow support line. The situation remains uncertain. ETH/USD Another Bitcoin drop prevented Ethereum buyers from fully activating the saucer figure. The price reached $430, which is $10 less than the goal from yesterday's review, and began the correction. The good news is that the depth of the drop was only $30, which inspires some optimism given the weakness displayed by ETH investors earlier. https://cryptocomes.com/sites/default/files/inline-images/Pic02_20.PNG The crossing of the 0.236 values of two Fibonacci grids clearly indicates the key level for Ethereum, from which the most significant movements will occur - this level is $415. Transition to confident growth is possible only after the price gains a confident foothold above that. In the negative scenario, $360 is still a serious support - investors will certainly do their best to protect it. LTC/USD From the point of view of both technical and fundamental analysis, Litecoin looks entirely unattractive for investment at the moment. Its enough to look at the chart to see this. LTC is inside a long-term descending channel and there is no hint of impending change. Not only is the price dangerously close to the critical level of support, the trading volumes fail to confirm any interest from buyers. https://cryptocomes.com/sites/default/files/inline-images/Pic03_20.PNG In addition to all the troubles, the chart shows a forming figure that distantly resembles head and shoulders, the activation of which takes the price to $90. We dont expect such a dramatic development, but neither can we rule it out. At a more conservative estimate, the target for bears is the range of $100- $105. Our recommendation to refrain from trading Litecoin is still in force. XRP/USD The current situation with Ripple is so similar to Litecoin that the same conclusions can be applied to both. The price of XRP is also clinging to the critical support, the chart also shows the formation of something similar to "head and shoulders," trading volumes are more than modest. https://cryptocomes.com/sites/default/files/inline-images/Pic04_6.PNG There are no hints of growth, while the targets of a possible further decline are very clear: if $0.45 does not hold, the bears will aim for the range of $0.42 - $0.4. Its unadvisable to even think about entering long positions, until there are at least some positive signs - about which we will happily inform our readers, of course. The link: https://cryptocomes.com/market-down-again-no-surprises-from-btc-and-eth-hard-times-for-ltc-and-xrp Title: Re: Daily price analysis BTC + ALTCOINS Post by: Cryptoprimes on April 10, 2018, 01:06:10 PM We should wait till Soros and Rockefeller go shopping 8)
Title: Re: Daily price analysis BTC + ALTCOINS Post by: Dany44 on April 11, 2018, 08:17:24 AM 04/11/18 Bitcoin Price Not Moving, Ethereum and NEO Climbing With Investor Support
Ethereum and NEO prepare a springboard for further growth while Bitcoin rests at $6,800. The market remains calm, and yet unpredictable As we have seen several times now, uncertainty is the markets favorite state in the middle of the week. The prices of the main asset and the top altcoins are once again stuck at a crossroads, giving no signals for further growth or decline. Market players are beginning to get used to low volatility and are losing their vigilance, for which they are likely to be punished at the most unexpected moment. Altcoins draining funds away from the main asset The total capitalization of all assets has not changed: it is $265 bln, which is only $5 bln more than the previous day. For the cryptocurrency market (https://cryptocomes.com/between-manipulators-and-the-forces-of-nature-how-bitcoin-market-works), such a small fluctuation can practically be attributed to statistical error. Bitcoin dominance, on the other hand, deserves notice, coming down to 43.7 percent by Wednesday. This indicator has been falling for three days running, which points to the flow of capital away from the main asset. The logic of investors is simple here - its called entertain yourself. When the market is calm, attention can be shifted to the search for promising altcoins. BTC/USD For almost two weeks, Bitcoin has been in a lateral movement within the narrow range of $6,400-$7,500. Several relatively strong bursts of activity among sellers and buyers brought trading volume and fortified this level. On the left trading profile, we see that the fair price for the period since Jan. 15 is still at $8,250, but the current range has already risen to second place in terms of the number of transactions and is likely to become a new basis for further movement. https://cryptocomes.com/sites/default/files/inline-images/Pic01_23.PNG Bitcoins daily price change was just around $200- ranging from $6,650-$6,900, so our prediction from yesterday was correct. Buyers hesitated on getting out of the trap and were able to overcome the resistance only by the second half of the day, having no strength left to increase their success. We are not expecting much activity from the opposing parties today, either. Its probable that in the course of the day the ascending channels will be tested- at least the green one, but if the decline touches on the yellow also, we may see Bitcoin at $6,500 again. Today's local maximum is unlikely to be more than $7,000, which coincides with the value of the 0.5 Fibonacci expansion, or $7,150, where buyers will be greeted by the 0.618 value of the same grid. https://cryptocomes.com/sites/default/files/inline-images/Pic02_21.PNG If nothing extraordinary happens, the uncertainty should be resolved by April 14-15. At that time, Bitcoin might fall out of the long-term descending channel which is likely to trigger purchases. Until then, the chances remain of seeing Bitcoin at $6,000. ETH/USD For the second day in a row, Ethereum is doing better than the market and pleasing connoisseurs of technical analysis with beautiful figures. Today, its a "cup with a handle," which often forms as a result of an unsuccessful activation of the "saucer." In order to bring the figure into action, buyers need to break through the "neck" line at $435. This does not look like an impossible task, but it requires favorable conditions - at the very least, Bitcoin must hold above the levels of its supports. https://cryptocomes.com/sites/default/files/inline-images/Pic03_21.PNG In case of the figures activation, the target of the bulls is $475 and the boundary of the descending channel. However, this is a fairly optimistic scenario. More probable is a continued lateral trade at the level of the 0.236 Fibonacci expansion and a rebound down from the neck line. The most important thing in the current uncertain situation is that Ethereum has a safe margin of decline to the level of the local minimum of $360, which means investors will be able to wait out Bitcoins drop if its not too steep. NEO/USD We noticed that recently NEO and Ethereum, being assets of the same type, are moving together. Today, once again, NEO is showing results that are similar to its big brother. The initial purchase volume, which we saw on Monday, continues to influence the price- the interest of buyers has subsided somewhat but remains consistently high compared to last week. https://cryptocomes.com/sites/default/files/inline-images/Pic04_7.PNG The immediate goal for the bulls is $58- it coincides with the 0.382 Fibonacci extension and the mirror level. To achieve it, the boundary of the parallel descending channel, which stopped growth the last time, will have to be overcome. If this is accomplished, then even a double top at the level of the previous local maximum is unlikely to help the bears hold back the onslaught. Just like Ethereum, NEO is gathering a reserve of resilience in case the heavyweight Bitcoin gives the market a cold shower again. The level of $44-$45 is a relatively reliable support for the asset, and the price is moving away from it more and more. The link: https://cryptocomes.com/bitcoin-price-not-moving-ethereum-and-neo-climbing-with-investor-support Title: Re: Daily price analysis BTC + ALTCOINS Post by: Dany44 on April 12, 2018, 07:50:40 AM 04/12/18 Altcoins Grow With Litecoin, Ripple and EOS Leading the Race; Bitcoin Lags Behind
Bitcoins lateral movement gives chance for altcoins to show themselves. LTC and XRP are on rise, EOS surges. While the first half of Wednesday was filled with doubt and caution, by the end of the day there was a breakthrough, all positions were in the green, trading volumes increased many-fold and the market was filled with euphoria again. This time, Bitcoin was not the catalyst- its price practically hasnt changed since yesterday. In our opinion, this was how tension in the minds of investors was released- through the fear of losing profit, as altcoins seemed to reach bottom and had no plans to fall further. As a result of the efforts of active buyers, capitalization increased by $12 bln and is now $277 bln, while Bitcoin dominance plummeted to 42.7 percent, continuing the trend and confirming yesterday's conclusions. For a little while, the lateral movement of the main asset allowed altcoins to spread their wings. Another airdrop boosts a coins price Former unity is gone from the top 10- the coins are growing without any regard for their neighbors. Todays absolute leader is EOS, growing by 50 percent- an incredible feat for a top asset! This growth was sponsored by the news about the upcoming airdrop of eosDAC tokens for all EOS holders with the support of the large Korean exchange Upbit. Notably, the trading volumes of EOS in Korea (https://cryptocomes.com/seoul-mayor-mulls-over-citywide-cryptocurrency-for-south-korean-capital) are especially high, comprising nearly half of the global amount. In second place at todays rally is NEO, with a gain of 10.5 percent, followed by Cardano with 8.5 percent, and Ripple - somewhat unexpectedly- in fourth place with seven percent. The remaining assets show more moderate growth of four to six percent. Bitcoin is the outsider today- an increase of 1.5 percent is laughable compared to the success of other coins. BTC/USD In the previous review, we predicted a lateral movement for Bitcoin on Wednesday, with highs around $7,000-$7,150, and we were right. Our attention was caught by a figure that does not appear in textbooks on technical analysis, but clearly has some power over the price - let's call it the "fish head." It seems that the situation should be resolved in the course of today, more specifically- in its second half. https://cryptocomes.com/sites/default/files/inline-images/Pic01_24.PNG Given the proximity of the $7,000-$7,150 range, which is a resistance in view of the presence of mirror levels, as well as the strong 0.5 and 0.618 Fibonacci expansion values, a false break through the figure is possible. Although considering the bullish sentiment in the market, the fallback is unlikely to be significant. For now, most indicators are suggesting that Bitcoin will move upward, but we cant forget about the treachery of bears who have interrupted growth more than once before. If buyers manage to overcome gravity and break out of the lateral trade, today we may see a test of the boundary of the long-term ascending channel, and then a sprint toward $7,500 where another resistance awaits. In case of a negative scenario (we are watching for the break of the figure!), the fall to previously indicated targets remains in force, although it becomes less likely given buyer excitement. EOS/USD For almost three weeks, EOS was resting at the level of $6, preparing, as it turned out, for explosive growth. The surge was only slowed down by the mirror level at $9.2. Three more days remain until the airdrop, so we are likely to see another upward sprint. https://cryptocomes.com/sites/default/files/inline-images/Pic02_22.PNG In the context of the current situation, its not quite accurate to discuss bull targets - the ongoing events are more like panic purchases, rather than cold calculation and purposeful actions. However, the set of supports and resistances hasnt gone anywhere. At the moment, we see the maximum price in the range of $10-$10.5, which is constrained by the mirror level on one side, and the 2.618 Fibonacci expansion on the other. The next growth spurt will be difficult to implement without a small fallback. With a high degree of probability, EOS will make a recovery stop in the region of $8. Its difficult to predict how much the price of EOS will fall after the conclusion of the airdrop- it all depends on the state of the market on Sunday. Its possible that those $8 will become the fair price for the asset for a period of time. In any case, we recommend that EOS investors remain cautious and closely follow the events on Sunday. It is advisable to set stop-loss orders at just below $8, or partially book profit upon reaching $10. XRP/USD Yesterday, Ripple returned to the ranks of assets that draw the interest of investors- this is indicated by the significant initial purchase volume. The last time when we saw such activity was in early March. As a result, XRP almost reached the level of $0.56, where the 0.382 Fibonacci retracement value is located. https://cryptocomes.com/sites/default/files/inline-images/Pic03_22.PNG The nearest growth target, with multiple confirmations, is $0.59, followed by $0.62. No descending channels are pressing down on the price anymore, so everything depends only on the zeal of bulls and the love of investors. The worst is over for Ripple, since the critical support level ($0.45) has been left far below. Cautious purchases will not be in conflict with common sense. LTC/USD Once again, many parallels can be drawn between the graphs of Litecoin and Ripple, so we will keep this brief. We also see a surge in buyer activity, confirming that despite all adversity, Litecoin cannot be completely discounted. https://cryptocomes.com/sites/default/files/inline-images/Pic04_8.PNG In case of continued ascending movement, the main task of the bulls will be breaking through the boundary of the descending channel and the cementing of the $120 level, after which they can try for $130-$132. Protection is provided by the support zone in the narrow range of $109-$112. It will hold up in any scenario, except that of Bitcoin traveling towards $6,000. Despite the enlivening in Litecoin trading, we still recommend that readers avoid active purchases and direct their attention to other assets. The link: https://cryptocomes.com/altcoins-grow-with-litecoin-ripple-and-eos-leading-the-race-bitcoin-lags-behind Title: Re: Daily price analysis BTC + ALTCOINS Post by: Dany44 on April 13, 2018, 08:47:40 AM 04/13/18 Bitcoin, Ethereum, Ripple Benefit From Market Growth, Monero Needs Support
A mysterious buyer saves Bitcoin from another drop, initiating market reversal. Ripple and IOTA lead the growth Let's commit this date to memory: April 12, 2018. Perhaps it will go down in history as the day when a powerful upward trend was born in the cryptocurrency market, carrying the assets up to new, previously unexplored heights. But even if this does not happen, it has been a long time since weve seen such unpredictable and dramatic trading. For those who missed it, well give a brief description of the bacchanalia that transpired, peppering the story with some authoritative commentary. Deus Ex Machina saves the day At the beginning of the day, Bitcoin was not doing very well. The figure that we analyzed in yesterdays review was punctured downward, technical indicators and graphical analysis suggested that a further fall is not only possible but probable. Altcoins joined the main asset in the dreary outlook. But, at exactly 11 a.m. (UTC) a mysterious buyer appeared on the playing field and began to buy up Bitcoin at the market price of $6,800. He lit a green candle the likes of which we have not seen since November 2017. As a result, Bitcoin price grew by $1000 in a half hour, and the market moved to a new existential logic. It seems that the price of $6,800 turned out to be a comfortable one for a big investor. At the same time, the temptation to buy lower could have played a cruel joke on him - if Bitcoin dropped to $6,600 again, dragging it out of that hole would have been much more difficult. Market cap surges 10 percent Market capitalization has grown rapidly by more than 10 percent and currently stands at $337 bln. Of course, all members of the top 10 grew in relation to the dollar, but the best results are shown by IOTA (plus 25 percent), Cardano (plus 19 percent) and Ripple (plus 16 percent). Among outsiders today was EOS with a modest 4.5 percent increase and Litecoin with an increase of eight percent. While EOS deserves a rest after yesterday's rally, the same cannot be said of Litecoin. BTC/USD Without exaggeration, the huge purchase volume helped Bitcoin easily overcome the important resistance at the $7,500 level, which has now become a support. Perhaps in the near future, we will see a retest of this mark, but so far it is not limiting growth, and neither is the descending channel that has been left far behind. https://cryptocomes.com/sites/default/files/inline-images/Pic01_13.04.PNG The price is forming a beautiful bullish flag, indicating a target of $9,200. A realistic view of the situation does not allow us to rely on such a scenario: on the way down, the Bitcoin submarine gathered a lot of passengers who were suffering losses and dreaming of an exit that was at least equal to the price of purchase. At the same time, we see a well-formed gently inclined upward trend, in which the price can continue to move for some time. In this case, a correction to $7,500 will be logical. As we did yesterday, we are closely watching the prices exit from the figure. An upward activation will allow the bulls to go for $8,300-$ 8,500, while a downward break will lead prices to the nearest support level. ETH/USD Despite the false downward break of the "cup with a handle" figure, further developments turned out to be positive for investors. Assisted by the explosive growth of the rest of the market, Ethereum reached its first goal of $475, fell back a little, and after several attempts broke the boundary of the long-term descending channel. Encouraged by their success, the bulls did not stop and continued to push the price to the level of 0.618 Fibonacci expansion - $500. https://cryptocomes.com/sites/default/files/inline-images/Pic02_13.04.PNG The next buyer target is $540, but as in the case with Bitcoin, we do not expect an immediate continuation of rapid growth. In our opinion, a retest of the boundary of the descending channel, or at least of the $475 level coinciding with the value of 0.5 Fibonacci expansion, would be quite appropriate. XMR/USD Unlike other assets, Monero will encounter a few more parallel descending channels on its growth path before the downtrend will release this coin from its embrace. One obstacle was respectably overcome yesterday, the next is at the level of $200. https://cryptocomes.com/sites/default/files/inline-images/Pic03_13.04.PNG Similar to the Bitcoin graph, we see a bullish flag with a $215 target. As often happens, this goal finds several confirmations at once - the mirror level and the boundary of the last parallel descending channel. After passing this milestone, nothing will hold XMR back. Given a negative development, we could see a fallback to the nearest support - $180, where it will be sensible to consider acquiring the asset for the medium term. XRP/USD In the course of the prolonged correction, Ripple suffered more than many other coins, so it is not surprising that in the absence of negative fundamental news (as in the case of Litecoin), it is recovering faster than the market. https://cryptocomes.com/sites/default/files/inline-images/Pic04_13.04.PNG On Thursday, XRP price exceeded the targets we set yesterday and almost reached $0.67. Overcoming this mark is a key factor for continued growth - it's a mirror resistance level, which confirmed the significance on Feb. 2 when the trading volume for Ripple was at its maximum, as well as the point of intersection of the values of 0.786 and 0.236 of two Fibonacci extensions. If the bulls can break it, the next target is at $0.72. Since we expect a slight price fallback for most assets, we will also designate a level for Ripple: with a high degree of probability it is $0.59, which coincides with the 0.5 value on the Fibonacci grid. The link: https://cryptocomes.com/bitcoin-ethereum-ripple-benefit-from-market-growth-monero-needs-support Title: Re: Daily price analysis BTC + ALTCOINS Post by: Dany44 on April 16, 2018, 08:05:37 AM 04/16/18 Growth Trend Continues For Bitcoin and NEO, Litecoin and Monero Struggle
New week- new trend? Bitcoin and NEO reach local maximums over the weekend but are likely to require a recharge Another trading week begins, and we cant wait to find out what news it will bring for investors. Perhaps it's time for a local correction? Or will we see a continuation of the trends that started last week? This scenario, at any rate, would fully satisfy the bulls- during the weekend, the market continued to climb almost without fallbacks and Bitcoin price increased to $8,460. Explosive growth slows down The total capitalization has almost reached the level of $340 bln, which is $10 bln more than on Friday. The increase is due both to Bitcoin and to the top altcoins, as well as some coins of the second tier. Unlike on Friday and Saturday, by the beginning of Monday, we are not seeing 30-40 percent rockets for individual assets. In the overwhelming majority of cases, average daily growth rates do not exceed five to seven percent. Bitcoin dominance has not changed over the weekend and is 42 percent, another confirmation that the market growth is balanced, without disproportion between the main asset and altcoins. BTC/USD The young growth channel, which we pointed out in our Friday survey, received several confirmations and one extension. Now, it is constrained from the top by the mirror level, which can be not only horizontal but also inclined. Movement in this channel allowed the price to reach the target range of $8,300-$8,500 quite easily, followed by a fallback to $8,000 which the buyers met with equanimity. https://cryptocomes.com/sites/default/files/inline-images/Pic01_25.PNG The main task for the bulls now is to close out the day no lower than the previous 24-hour candle- that is, at the same level of $8,000. If the expectation becomes drawn out and the parties show hesitation now when Bitcoin is trading at $8,100, the initiative can move into the paws of the bears. In this case, a correction to the range of $7,400-$7,600 is possible, which will not cancel the growth scenario. We believe that Bitcoin will continue to move in the upper register of the ascending channel today. The immediate goal of the bulls is the resistance zone at $8,600, followed by $9,000-$9,200, where the really heated battle will unfold. While our views on the situation remain bullish, a possible local fallback can be viewed as an opportunity to build up long positions, which is what we recommend to our esteemed readers as well. LTC/USD Unlike its parent, Litecoin has not yet formed an ascending channel which could be relied upon. Instead, we see a cascade of rising minimums that are forming a section of a parabola. Even the news about partnership (https://cryptocomes.com/litecoin-has-another-crack-as-crypto-card-teams-up-with-tenx-sees-promising-price-spike) with the TenX payment system could not help the asset- the memory of LitePays failure is still fresh in investors minds, and they are hesitant to fall for the same trick twice. https://cryptocomes.com/sites/default/files/inline-images/Pic02_23.PNG During the weekend, the maximum price was $134, which was followed by a correction to the 0.236 Fibonacci grid level. A decline to the 0.382 level of the same grid, which is $125, is not compulsory, but permissible. Even in that case, Litecoin will continue to build a basis for further growth. A more significant price drop wont break the current picture of technical analysis but will indicate an extreme buyer weakness. As for growth targets, the first is $137, which coincides with a powerful mirror resistance level. In case of overcoming that- its on to the region of $150. However, it is essential to understand that Litecoin can achieve its goals only under the conditions of full market growth. At the moment, the asset cant swim against the current. XMR/USD Once again, Moneros chart reminds us of Litecoin- the main conclusion here is the same: bulls have not yet managed to form an ascending channel. At the same time, we see periodic bursts of purchases, not accompanied by strong subsequent fallbacks, which may indicate that big players are entering long positions. https://cryptocomes.com/sites/default/files/inline-images/Pic03_23.PNG A slight correction to the level of $190 completely fits into the logic of continued growth, but its best not to let sellers go lower- in that case, the lateral trading figure will be broken. On the other hand, for a strong price increase, there are two obstacles- the boundary of a long-term descending channel and a zone of strong resistance at $208-$220. At the moment, Monero is at a crossroads, and we recommend that readers avoid hasty investment decisions. NEO/USD Compared with other assets, NEO is demonstrating the most confident growth. On the chart, we see a clear growth channel, in which the price has been moving for 10 days straight. At the same time, the steepness of the channel imposes certain demands on the bulls, which will not be easy to fulfill. Therefore, we believe that in the near future the channel will be broken downward. https://cryptocomes.com/sites/default/files/inline-images/Pic04_9.PNG In this case, a correction to the 0.5 value of the Fibonacci grid is possible- into the mirror-level region of $62.4. While bullish sentiment prevails on the market, we dont see any reason for the price of NEO to fall lower than that. In the assets analysis, the easiest thing to see is the perspective growth target- its clearly visible at $80. Just how quickly it will be reached is a much more complicated question, but we believe that it will not happen in the next two days. As stated above, today we expect a minor correction and horizontal trading in the range of $62-$70. The link: https://cryptocomes.com/growth-trend-continues-for-bitcoin-and-neo-litecoin-and-monero-struggle Title: Re: Daily price analysis BTC + ALTCOINS Post by: rumexx on April 16, 2018, 08:34:21 AM Every thing is still speculation but one thing is so sure is that whatever affect bitcoin will affect altcoins either positively or negatively. Let us wait and see at least for the past 5 days prices has been stable.
Title: Re: Daily price analysis BTC + ALTCOINS Post by: timbereagle on April 16, 2018, 08:39:38 AM Today and Tomorrow is a bit critical for BTC and ALt prices. 16th April (USA last Tax day) 17th April (BTC contracts deadline). Therefore we can expect some wild swings like 400 USD.
However I expect higher prices by end of the week. Title: Re: Daily price analysis BTC + ALTCOINS Post by: Bitcoincole on April 16, 2018, 08:51:20 AM Today and Tomorrow is a bit critical for BTC and ALt prices. 16th April (USA last Tax day) 17th April (BTC contracts deadline). Therefore we can expect some wild swings like 400 USD. However I expect higher prices by end of the week. The price is still unpredictable to happen and besides there is no connection between USA tax Day into the swinging of price value of bitcoin and alts currency because its a decentralized currency as cryptocurrency. In addition to that i always monitor the flow of chart so that i can give myself an analysis on the trends must go on. Title: Re: Daily price analysis BTC + ALTCOINS Post by: timbereagle on April 16, 2018, 09:07:06 AM Today and Tomorrow is a bit critical for BTC and ALt prices. 16th April (USA last Tax day) 17th April (BTC contracts deadline). Therefore we can expect some wild swings like 400 USD. However I expect higher prices by end of the week. The price is still unpredictable to happen and besides there is no connection between USA tax Day into the swinging of price value of bitcoin and alts currency because its a decentralized currency as cryptocurrency. In addition to that i always monitor the flow of chart so that i can give myself an analysis on the trends must go on. basic: price is related with speculation. If most of traders speculate price will be higher because of some event, price will rise. It is not related with result or nature of event. It is about expectation management and speculation. Title: Re: Daily price analysis BTC + ALTCOINS Post by: Dany44 on April 17, 2018, 08:48:08 AM How to Trade Cryptocurrencies
Eight steps to start cryptocurrency trading (https://cryptodetail.com/category/crypto-trading) and how to avoid common mistakes Almost everyone has heard about Bitcoin, altcoins and the opportunities that they offer not only to those, who own them but also to those, who speculate or invest in cryptocurrencies. The number of traders is growing every day and the beginners want to know how to trade cryptocurrencies and to earn money in this industry. We have decided to create a guide for crypto traders with a step-by-step explanation of how to begin and what to do. Step 1. Find an exchange The first thing every trader has to do before starting his or her career is to choose a place where to place orders (to buy and to sell cryptocurrencies). There are several exchanges nowadays offering services to different types of investors. How to find a good one? We are going to write a separate guide, but here we give you some key points. What aspects are important to pay attention to before creating an account? They are the following: 1. Reputation of an exchange. When you find one, look for more information about its activities and reputation. Read traders testimonials. However, do not forget, that those testimonials may be bought by exchange or its competitors. 2. Security level. Early exchanges like MT.GOX and the others had very poor security levels allowing hackers to breach their systems and to stole traders money. Nowadays many websites use hot and cold wallets, multisig and other serious methods to ensure the safety of investors funds. 3. Trading conditions. This is an important factor as exchanges offer different commission plans for depositing and withdrawals, as well as for inner trading transactions. Some websites have no inner commissions at all (like Cobinhood, for example). 4. Depositing and withdrawal methods. There are two main types of exchanges. First offers Bitcoin, Ethereum and several popular coins along with fiat money. You can use banking cards and some electronic payment methods to deposit and withdraw from there. Second offers hundreds of altcoins, but as for depositing and withdrawal, you can use cryptocurrencies only. 5. Trading platform. Some websites offer Tradingview platforms with different types of analysis tools like indicators, lines, channels, Fibo and the others. On the other hand, some exchanges offer simple and primitive trading terminals with Japanese candlesticks and timeframes. There are no analysis tools there. 6. Order types. Professional investors prefer websites with different types of orders including limit, stop losses, take profits and the others. 7. Verification procedure. Privacy is the key advantage of the crypto industry. However, the majority of exchanges require verification. Recommendation: Before you take the final decision to start trading with one or another website, try to contact their support service. Pay attention to how fast and complete the answers are. Step 2. Create an account When the first step is done, meaning you have found an appropriate exchange, your next step is to create an account. Almost all exchanges have a simple sign up procedure. You need to create a login, provide an email address and a password. Registering procedure comprises email confirmation. Some websites recommend installing two-factor authentication in order to increase account safety level. Recommendation: You may be asked to complete the account verification procedure in order to remove the restrictions. We strongly recommend providing the exchange with correct personal data as you will be required to send your ID documents scan copy. Step 3. Choose your coins Bitcoin is not the only one nowadays. There are hundreds of different altcoins that you may invest in or speculate on. Professional traders advice to choose a couple of coins to start. The wide range of cryptos is good for diversification. However, beginners are recommended learning more about each asset they are going to buy, especially when they are going to invest. Why is this necessary? First, when you plan to buy a cryptocurrency in order to hold it for a long time, you need to understand what is behind its price. Every coin is not simply a currency, but a project using some technology and offering some benefits to the users. Ethereum, e.g., is a platform for developing decentralized applications and smart contracts. The last serve to conduct any kind of business without intermediaries. Monero is a secure and untraceable cryptocurrency, allowing users to conduct transactions with a high level of anonymity. In order to understand whether it is a good idea to invest in this or that coin, you need to analyze whether it is promising or not. Every project has its own website and whitepaper, which are a kind of a presentation. Moreover, you can find detailed coins reviews on our website, which facilitates forecasting procedure. Second, you need to compare the price of the chosen cryptocurrency with its perspectives with regard to its technology. Some coins may grow for no apparent reasons. There are risks of a pump & dump manipulations in this case. Such cryptocurrency is not for long-term investors as once manipulators reach their goals, they will dump coin and its price is likely to fall towards the initial levels (before the pump and dump strategy was launched). As for traders who speculate on coins in short term, they also need to learn more information about the cryptocurrencies they are going to trade. However, as they buy and sell currencies within a couple of hours or days, they are better to pay more attention to technical analysis. Find more on topic https://cryptocomes.com/how-to-trade-cryptocurrencies Title: Re: Daily price analysis BTC + ALTCOINS Post by: Dany44 on April 18, 2018, 08:11:09 AM 04/18/18 Monero and Ripple Ready to Surprise Investors, While All Eyes are on Bitcoin
Monero and Ripple are getting ready to please investors, but Bitcoin could ruin those plans. The psychology of the market is a curious thing. A week ago, Bitcoin at $7,900 seemed like a heaven-sent miracle, and today this price for the main asset is making players if not panicked, then certainly discontented and irritated. Its understandable: when you are expecting a sharp rebound, and instead get a prolonged flat, plans for quick enrichment must be adjusted. But the market is a living organism where something is always happening. Its full of opportunity for those who are prepared to seek and wait. Capital redistributed within the market Capitalization of all cryptocurrencies is $325 billion, completely unchanged since yesterday. Bitcoin dominance, however, has fallen to 41.3 percent, which indicates an active redistribution of capital within the market. For the first time in a long while, we are seeing a lack of unity in the top 10: half of the assets are red, half are green. Bitcoin and Cardano are showing the worst results - their prices have decreased by about 2 percent. Stellar and Litecoin are in the lead today, with an increase of 10 percent and 3.5 percent respectively. BTC / USD The yellow line of resistance, which we applied to the markup yesterday, has confirmed its significance: after several unsuccessful attempts to break it, Bitcoin price went to test the nearest level of the Fibonacci retracement. The $7,800 mark is holding for now, but the lack of good purchase volumes and the formation of a bearish flag are hinting at a possible capitulation. https://cryptocomes.com/sites/default/files/inline-images/Pic01_26.PNG The formed head and shoulders figure, whose neck line has already been broken, also fits into the scenario of further decline for Bitcoin price. The dimensions of the figure indicate the target of $7,500, which coincides with a strong mirror level from April 3 and is located in the middle of the $7,400 - $7,600 range that we mentioned previously. The activation of this figure is only one of the possible scenarios, and finding a foothold above $8,000 during the day will call into doubt a deeper correction - but for now, it seems like a logical development. LTC/USD In the past two days, Litecoin has been feeling more confident than the rest of the market. The reason for this - being listed on the Korean (https://cryptocomes.com/huobi-launches-new-crypto-exchange-in-south-korea-operating-201-trading-pairs) stock exchange Korbit. Thanks to this news, the asset is seeing trade volumes that inevitably lead to a change in price. Indeed, it increased by 11 percent, but disappointment with Bitcoin's lack of growth seeped into the Litecoin investor camp as well - the result, a correction to the 0.382 value of the Fibonacci grid. https://cryptocomes.com/sites/default/files/inline-images/Pic02_24.PNG On the chart, we see a formed ascending channel, similar to the channels of other assets. At the time of writing, its lower boundary is at $130 - we will take this value as the minimum that is acceptable for a safe continuation of growth. Bitcoins approach to $7,500 may well force Litecoin price lower, but then the channel will be broken and it will be necessary to start all over again. We suspect that the surge in volumes and the sharp increase in the price of Litecoin will not last long, and everything will return to normal after the excitement of the assets exchange listing passes. The perspective target is still $150, coinciding with the 0.618 Fibonacci expansion, but first there needs to be some trading in the range of $135 - $143. XMR/USD What the Litecoin investors still have to do, Monero fans are doing right now: the first thing that catches the eye on the chart is the lateral trade in the range of $190 - $205. Because of it, the price has formed a beautiful bullish flag, which is practically resting against the boundary of a long-term descending channel. Of all the possible scenarios of preparing for the break through a strong resistance, this is the most effective one. https://cryptocomes.com/sites/default/files/inline-images/Pic03_24.PNG Given the bulls success, $220 will become the target with a triple confirmation (dimensions of the figure, the mirror level, the Fibonacci grid). Confident readers can try to trade from the break in the boundary of the channel, with a stop-loss order in case of a false break. As for the correction scenarios, the level of $190 is stll looking like a reliable support for buyers. XRP/USD Ripple is showing us another bullish figure. Its an isosceles pendant, and the target of its full activation - $0.88. The maximum activation time for this formation is by the middle of the day on April 20, but we believe that the break will happen sooner. If only half of the figures height is realized, which happens quite often, a more modest target is $0.75. https://cryptocomes.com/sites/default/files/inline-images/Pic04_10.PNG Unfortunately for holders of long positions, the price can pierce the figure downwards - a lot depends on the state of Bitcoin during the decisive moment for Ripple. In this case, a fall back to $0.60 is possible, so short-term investors should consider stop-loss orders on the lower facet of the triangle. The link: https://cryptocomes.com/monero-and-ripple-ready-to-surprise-investors-while-all-eyes-are-on-bitcoin Title: Re: Daily price analysis BTC + ALTCOINS Post by: ahoenk on April 18, 2018, 09:31:10 AM That is the best chart analityc so far. Well..sometimes we need to take the price not very seriouse the picture made my day. I bet that chart is newbie chart or people chart who used laverage in bitmex. Of course they will get fucked if they trade with laverage.
Title: Re: Daily price analysis BTC + ALTCOINS Post by: waitforme on April 18, 2018, 09:35:06 AM In the image you post I realize that investors prefer to become less profitable investors than to become winners. The market went down trying to minimize losses, the market went up and put confidence in it when buying and then cut back losses as it goes down. Investors are trying to put their money into a black hole.
Title: Re: Daily price analysis BTC + ALTCOINS Post by: Dany44 on April 19, 2018, 09:03:26 AM 04/19/18 Volume Surges for Monero and NEO, Bitcoin and Ethereum Gathering Strength
Rise and shine, cryptomarket! Altcoins fortify the growth trend, while Bitcoin trails behind. The week has gotten over the hump, and the price of Bitcoin has gotten over the critical level of resistance, once again giving the market some for a continued uptrend. But hopes and illusions are dangerous allies, especially when dealing with a market where manipulation is flourishing, and big players keep trying to drive the guppies into a net. We dont want to intimidate readers, and there is no questioning the trend. All we want to emphasize - always evaluate events critically and do not succumb to suggestion. Capitalization rises as Bitcoin makes room for altcoins Unlike Bitcoin, which is keeping afloat but not showing any outstanding results yet, altcoins have become the principal drivers of market growth. Over 24 hours, capitalization has increased by almost $25 bln to $348 bln, which is the best growth indicator since last week, when a mysterious buyer helped the market out of the crisis. Bitcoin dominance is rapidly declining and has reached 40 percent. Stellar and Bitcoin Cash outperform growing market As many as 4 assets from the top ten are showing double-digit growth numbers. Stellar is leading with an increase of 20 percent, boosted by the news of a partnership with an international payment software provider Novatti group. It is followed by Bitcoin Cash (plus 16 percent), which has gotten some attention from CNBC. The third place on the pedestal is shared by Ripple and NEO - both grew by 11 percent in 24 hours. BTC/USD Despite repeated breaks through $8,000, buyers still managed to keep the main asset from falling, which reduced the likelihood of correction here and now. We are also noting an increase in trade volumes. They may be quite modest for now, but judging by the shape of the candles, these are real trades that confirm the interest of a large number of participants, rather than solo performances of a few major players. https://cryptocomes.com/sites/default/files/inline-images/Pic01_19.04.PNG The minimum goal for buyers is to hold the mirror level of $8,200, where Bitcoin is trading at press time. This is followed by the previous local high of $8,450, which coincides with the 0.382 value of the Fibonacci extension. If this level can be approached, overcoming it should pose no difficulty. And finally, the maximum goal - the testing, and possibly a break through the boundary of the ascending channel, coinciding with another level of lateral trading - $8,700. Never forgetting about caution, we continue to consider the scenario of a local correction in case of another price fall below $8000. The decline targets indicated in yesterdays review remain relevant. Any more-or-less significant correction of Bitcoin can put the markets altcoin festivities in question. But investors dont seem to be planning to draw back, so today the scenario of decline is less probable than the scenario of growth. ETH/USD Compared to other altcoins, Ethereum is looking pale for the last two days, but the devil is in the details and, despite first impressions, investors have not been wasting time. First of all, without any unnecessary fuss, the range $490 - $530 has been traded, now becoming a a launching pad for further price movement. Second, the ascending channel received another confirmation. https://cryptocomes.com/sites/default/files/inline-images/Pic02_19.04.PNG The price is attempting to leave the completed figure, the dimensions of which are pointing to the perspective target of $615. The path to Olympus is a long one, and the bulls will encounter a number of obstacles, which are also intermediate targets - $550, formed by the 0.382 value of the Fibonacci expansion and $580, confirmed by the closest significant mirror level. A fallback from the current positions by breaking downward through the ascending channel is possible but unlikely. In that case, buyers will find support in the range of $480 - $490. XMR/USD Yesterday's forecast for Monero was exactly on point, and the bulls target of $220 was executed with high accuracy. However, even we underestimated the amount of capital that flowed into the asset after leaving the long-term descending channel. Thanks to the strong support of investors, on Wednesday the price went up to $230, where it remains now. https://cryptocomes.com/sites/default/files/inline-images/Pic03_19.04.PNG On the way, Monero broke through the ascending channel, and now, to build its extension, it will take a bit more time and data. The asset continues to look better than the market, the perspective goal is at $260, where the bulls will certainly meet with a rebuff. It is quite likely that before continuing the climb, investors will be obliged to take a little break - the range $220 - $ 230 is perfectly suitable for this purpose. NEO/USD Unlike Monero, NEO is behaving very predictably, so we can be brief. The gently inclined ascending channel which we outlined yesterday remains relevant - the price is testing its upper boundary, but there are not enough resources to break through yet. https://cryptocomes.com/sites/default/files/inline-images/Pic04_19.04.PNG However, growing volumes confirm the interest of investors, so growth is very likely to continue. The nearest target - $80 - is confirmed by a strong mirror level. If the bulls need more space for a running start, a slight fallback to the region of $68- $70 is possible - but it does not pose any threat to the current positive situation. The link: https://cryptocomes.com/volume-surges-for-monero-and-neo-bitcoin-and-ethereum-gathering-strength Title: Re: Daily price analysis BTC + ALTCOINS Post by: wack slacker on April 19, 2018, 09:41:59 AM Many thanks for your analysis. I've bookmarked your browser toolbar. Can you analyze some other crypto? I want to have the results of Boscoin, Nuls and ADA analysis. Thank you!
Title: Re: Daily price analysis BTC + ALTCOINS Post by: Dany44 on April 19, 2018, 10:05:43 AM Many thanks for your analysis. I've bookmarked your browser toolbar. Can you analyze some other crypto? I want to have the results of Boscoin, Nuls and ADA analysis. Thank you! Nice to hear it! we try to analyse the performing of the leading cryptocurrencies now but also will add some new coins to our daily analysis Title: Re: Daily price analysis BTC + ALTCOINS Post by: Dany44 on April 20, 2018, 08:03:24 AM 04/20/18 Ethereum, Ripple and Litecoin Reach Growth Targets, While Bitcoin Hesitates
Bitcoin consolidates around $8,000, giving investors some time to enjoy altcoin growth The market is growing, Bitcoin is not. This short phrase is enough for an exhaustive description of the current situation. If you just look at the price of the main asset, growth is not apparent: most investors expected a reprise of the winter scenario when Bitcoin set the direction of the movement initially and altcoins entered the game a month later. Now we see the opposite situation and, most likely, the profits earned on the growth of other assets will eventually become fuel for the heavyweight Bitcoin. Internal resources for growth cant last forever Meanwhile, the primary cryptocurrency is losing ground: while the market capitalization grew by another $20 bln in 24 hours (up to $360 bln), BTC dominance fell to 38.5 percent. One and a half percent is a record daily decline in this indicator since the beginning of the year. This leads us to believe that growth is supported in large part by money which is already in the market, rather than an inflow of "fresh blood." When the last signs of FUD (which are already fading out) finally give way to a positive informational background, we will see another rally, funded by the resources of new investors. BTC/USD Bitcoin has not yet earned back the love of investors, the best confirmation of which in the cryptocurrency market are, of course, volumes- they remain at an average level. Therefore, the buyers only managed to fulfill the minimum goal set for yesterday, keeping the price above $8,200. At $8,380 there is a mirror resistance level, which exerts more pressure on the asset than we expected. After overcoming this level and breaking the double top pattern, the bulls can test their strength in reaching the next target range of $8,600-$8,700. https://cryptocomes.com/sites/default/files/inline-images/Pic01_27.PNG Keeping in mind the presence of a manipulator in the market, the price movements described above could be called small potatoes, although out of respect to the oldest asset, the official term is organic growth. At any moment, we could see a long green candle (like the one that turned the market around on April 12), or a red one with a length of $500-$700. During the weekend, the prospective target for buyers is the interval of $9,200-$9,300, coinciding with a strong mirror resistance level. However, it is quite likely that some investors will decide to book profits at the psychological mark of $9,000. In case of negative developments, Bitcoin can fall back to the nearest resistance at $7,800-8,000. We also continue to keep in mind the level of $7,500, but the likelihood of reaching it has diminished since yesterday even more. ETH/USD As we expected, the prolonged lateral trading in the range $490-$530 ended with Ethereums growth to the first of its short-term goals - $580. The error was less than one percent, as the previous day's high was in fact $588, followed by the expected fallback. https://cryptocomes.com/sites/default/files/inline-images/Pic02_25.PNG With the bullish sentiment still prevalent on the market, the depth of the fallback should not be too great- according to our estimates, buyers will find support at the 0.382 value of the Fibonacci grid, at $555, and the minimum price in the near future should not fall below $530. Even in that case, the ascending channel will not be broken. The next target for the bulls has not changed- it's $615, and under favorable circumstances, it can be reached within the next few days. XRP/USD We invite our readers (especially those, who follow our recommendations) to celebrate- another goal has been executed with perfect accuracy. By the end of the week, Ripple has reached $0.75 and $0.86 and now deserves a break for the weekend. For continued growth, the asset will probably need to stay at lower levels for a bit. https://cryptocomes.com/sites/default/files/inline-images/Pic03_25.PNG It is possible that after breaking the ascending channel, the price will form a bullish pennant when it is retested. This will allow for the continuation of upward movement, with the goal clearly visible now at $0.95. However, the asset is already looking overbought, so the correction to the range of $0.79-$0.77 is more likely. Growing volumes confirm that Ripple is not forgotten, and investors can expect to see good profits in the medium term. LTC/USD We conclude our review with the chart of Litecoin, which did not fail us and has gracefully moved through the ascending channel to the $150 mark. In accordance with market law, the asset must now cool down a bit, and it will be doing so around $142. https://cryptocomes.com/sites/default/files/inline-images/Pic04_11.PNG Given certain fundamental problems, in the context of a Bitcoin correction, its younger brother is risking a test of lower levels and the boundary of the ascending channel. In price terms, this is $137. And if the market continues to grow, then the next stop, theoretically, can be at $160. Let's not forget that Litecoin is a dependent asset and does not possess the self-sufficiency of Ripple, for example. So, if our readers really want to trade it, they must carefully monitor the situation in the market as a whole. The link: https://cryptocomes.com/ethereum-ripple-and-litecoin-reach-growth-targets-while-bitcoin-hesitates Title: Re: Daily price analysis BTC + ALTCOINS Post by: noah tall on April 20, 2018, 12:10:46 PM These seem great, you can check out the analysis after the day and see what did what. You should probably have better platform (website, reddit, chat etc) to compact these into one place instead of open forum which is difficult to track of. I would definetly suggest telegram for one.
Title: Re: Daily price analysis BTC + ALTCOINS Post by: Dany44 on April 23, 2018, 08:04:48 AM Bitcoin Trading For Beginners: Trade Bitcoin Like a Profi
Bitcoin trading, how to find best opportunities, factors, affecting Bitcoins price Bitcoin is the first cryptocurrency ever, which attracts many traders and investors nowadays. This coin appeared in 2009 and was a kind of a miracle for that period. However, traders and investors paid almost no attention to it. Nowadays, Bitcoin trading is very popular due to the opportunities that it gives to investors. The price for a coin has reached almost $20,000 by the end of 2017 as a huge number of investors have bought this cryptocurrency. Later, the price declined below $10,000. However, the interest for Bitcoin is high in the moment of writing and this tendency is likely to grow in future. With this huge uptrend, many beginner traders and investors want to buy the first cryptocurrency, but they make many mistakes that result in losses. We are going to describe Bitcoin trading for beginners in this article. What are the main factors that influence Bitcoin price In order to buy BTC, you need first to learn the main factors that may affect its price. However, before you do this, you have to understand that cryptocurrencies have some specifics that distinguish them from traditional fiat money. Quote The main difference is that they are all decentralized. Traditional currency price depends on central banks policies meaning those financial institutions may affect quotes by simply changing their decisions on interest rates, for example. As for cryptocurrencies, there is no a single body nor issuing them neither controlling their volume. The good news here is that you need no traditional analysis tools to predict Bitcoins price. There is no central banks meeting to follow or economic data to monitor. The bad news is that you need to pay attention to demand and supply in order to forecast Bitcoins price which is not sometimes an easy task to complete. As for the supply, it is limited by the nature of this system. The total volume of Bitcoins is 21 mln units. It is to mention also that new coins appear by means of a so-called mining (when miners solve several math problems in order to validate transactions and support systems integrity and safety). This is a clear advantage of Bitcoin as its price is likely to grow in future due to the fact that the supply is limited. Once the total volume will be reached, there will be no further emission of coins. The demand for Bitcoins depends on several factors including the possibility of using coins to conduct transactions between individuals and legal entities and cryptocurrencys investment attractiveness. Key factors that affect Bitcoins demand Lets have a closer look at what can influence cryptocurrencys demand. The first aspect is its effectiveness as a mean of payment. In other words, you need to understand what are the advantages of Bitcoin as compared to traditional currencies. Quote It is to mention that BTC has met several problems during the past year. The rise of its popularity resulted in a decrease of transactions speed and time and increase of its costs. This lack of scalability has made several users to pay attention to other coins such as Ethereum for example, which have no such issues. Traders and investors need to know that Bitcoins transactions may cost above $5-10. However, even if you pay this amount to miners, there is no guarantee, that your transaction will be executed in the nearest future as other users may offer even higher rates. Transactions privacy This is one of the most significant Bitcoins advantages. There is no financial monitoring of such transfers meaning nobody except you and sender/recipient know all the details of a transaction. The good news here is that you can use it for different purposes including commercial operations. The bad news is that this privacy prevents Bitcoin from being widely officially accepted by governments. There are countries that allow their citizens to use cryptos, but their number is limited. In addition, there is no general idea how to regulate Bitcoin and altcoins as means of payment and how to describe them. This prevents coins from being easily integrated into an international financial system. The number of legal entities ready to accept Bitcoin In 2009, Bitcoin was a kind of a game as there was no a single shop ready to accept Bitcoin as a mean of payment. However, things have changed and nowadays, some companies offer an opportunity for buyers to use Bitcoin and even several altcoin to pay for goods and services. Quote However, Bitcoin still loses the competition to traditional money because of many factors including high transaction fees, low operational speed etc. There is one more thing to pay attention to. Bitcoins price is volatile meaning it may grow or fall for a couple of thousands of USD in several days. Why this aspect is negative for adoption of cryptos as payment mean? Lets suppose one online shop has sold some goods for one BTC (the price of Bitcoin was $9,000). In the next couple of days, BTCs quotes went downwards and reached $7,000 level meaning this online business has lost around $2,000. In order to prevent those losses, businesses have to stay in direct contact with exchanges in order to convert Bitcoins into fiat money. Find more on topic https://cryptocomes.com/bitcoin-trading-for-beginners-trade-bitcoin-like-a-profi Title: Re: Daily price analysis BTC + ALTCOINS Post by: Dany44 on April 24, 2018, 10:04:34 AM 04/24/18 Bitcoin, Litecoin and NEO Promptly Reach Bullish Targets; Ethereum Overachieves
Bulls run into their targets like they are red flags - Bitcoin and altcoins are rising By the beginning of Tuesday, the upward bullish trend has found a long-awaited development, and the goals we had indicated for a number of assets last week have finally come true. According to the rules of the game, now the market needs to cool down before continuing the movement, but the bulls seem to be on a roll and may take some time to slow their pace. Market cap sees $25 bln cap spike with bulls success Capitalization of the market has crossed over the round quadricentennial mark in the past 24 hours and is now at $425 bln. Bitcoin dominance, which stayed at 38 percent most of the previous day, has given way by 0.5 point, to 37.5 percent. Bitcoin Cash continues to attract the flow of capital and the attention of investors, growing by another 20 percent after a slight fallback. Another Bitcoin fork emerges Bitcoin Cash is joined by another hard fork of the main asset, Bitcoin Gold, which showed an impressive growth of 30 percent over 24 hours. Dash concluded Monday with a more modest, but still respectable result - an increase of 15 percent. The coin is in 12th place among assets by capitalization, and Monero is right next to it, in 13th. This proximity will make it interesting to see which of the privacy coins will win the love and the money of investors. The rest of the top altcoins show moderate results of 4 to 7 percent. BTC / USD Yesterday's Bitcoin activity could exhaust any trader - several times, the asset approached the realization of a bearish wedge pattern. It was barely kept from going under to the dangerous support level of $8,800, where buyers could lose their nerve, turning into sellers. However, by the end of the day, with double the average volume, the bulls were able to push Bitcoin one level higher into the price range of $9,100 - $9,300. https://cryptocomes.com/sites/default/files/inline-images/1_0.jpg The next target for bulls is represented by the level of $9,500, and given that someone big and powerful is obviously keeping Bitcoin from falling, we are not ruling out the possibility that this target will be reached within a day or two. On the other hand, the price has pushed up against the boundary of another ascending channel, which is giving additional resistance. Therefore, we believe that today and possibly tomorrow, the asset will be trading inside the ABC triangle, after which we will either see the bulls goals achieved, or a correction toward the range of $8,600 - $8,400. We recommend that our readers actively protect their profits with the help of stop-loss orders. ETH / USD Last week, Ethereum not only did not lag behind the market, but often outperformed it, so the overall growing trend allowed it to achieve the goal of $615 without much difficulty, where an attempt was made to bring the price down. But the buyers did not leave the asset to be torn apart by the bears, and followed up by reaching the mark of $670. Ethereum practically pushed up against the boundary of the ascending channel, which is already steep enough to just break upward through it. Therefore, we expect lateral trading with a possible fallback to $630. The next goal for short-term investors is suggested by the value of fair price since the beginning of December and the 0.618 Fibonacci expansion - it's $ 690 - $700. After reaching the mark, we can see a trend change, not necessarily to a downtrend, but perhaps to a more gently sloped one. The medium-term goal of $800 already looms on the horizon, but it is too early to predict how it will be reached. LTC / USD Though slower than its closest neighbors in the top 10, Litecoin is still growing steadily, reaching $160 yesterday. Its channel is more gently sloped and wider than Ethereums, so it has a larger margin for lateral trading - which is what we are expecting today. https://cryptocomes.com/sites/default/files/inline-images/3_1.jpg After that, another spurt to $170 is likely, where Litecoin will meet a very strong resistance. The situation is aggravated by the passage through the target price of the inclined mirror level of support-resistance, indicated by the green line. So, after reaching this mark, we expect the price to fall back at least back to $160, at most to $150 with the subsequent formation of a new movement logic. NEO/USD Two ascending NEO channels with different slopes have formed a single channel, limited not by straight lines, but rather by curved ones - this channel has determined the assets movement for almost 20 days. The maximum price was recorded at $79.3, so well consider our target of $80 to be reached. https://cryptocomes.com/sites/default/files/inline-images/4_0.jpg Further developments can be very rapid. The volume profile tells us that above $80 and up to $100, the volume of sales and purchase transaction was not significant, which means that buyer and seller interest is not concentrated in that range. In any case, we determine $100 to be the next target for bulls. To achieve this, NEO will probably have to gather strength in the range of $70 - $80, and the price minimum in case of correction will be at $66. The link: https://cryptocomes.com/bitcoin-litecoin-and-neo-promptly-reach-bullish-targets-ethereum-overachieves Title: Re: Daily price analysis BTC + ALTCOINS Post by: Dany44 on April 25, 2018, 08:14:50 AM EOS Trading for Beginners: How to Trade EOS Profitable
EOS trading, how to find best entry points, comparing EOS with Ethereum Trading cryptocurrencies is not as easy as it may seem. However, those who have appropriate knowledge are able to invest in cryptos profitably. In this EOS Trading Guide for Beginners we are going to provide you with necessary information about the project, coin and its specifics. We are also going to compare EOS with its closest competitor Ethereum. Quote EOS is a blockchain platform for dApps. The idea behind this system is to provide users with best known practices allowing businesses and private persons to benefit from high level of security and computing support. One of the main advantages of this platform is that it will allow users to conduct thousands transactions per second. This level of scalability is out of range for Bitcoin and even Ethereum nowadays. The aim of the team is to create a complete operating system for decentralized applications giving the opportunity to user to benefit from high level of security, server hosting and cloud storage. EOS trading. The main features of the project Before an investor or trader puts his or her money into this coin, it is necessary to learn the main features of this system. Quote One of the main specifics of this network is its high security level. All users accounts have different permission levels. There were several updates of the system allowing users to store their data off the blockchain. There are also some features helping EOS clients to restore access to their compromised and recover stolen accounts. Another great feature of EOS is its scalability performance. There is no doubt that future of cryptocurrencies as payment method depends not only on security of data transfer, but also on how fast the transaction may be executed. Bitcoin and Ethereum use PoW consensus method, which is criticized by the crypto community nowadays. EOS uses another method, which focuses on transaction instead of the state of the whole system. This allow to significantly increase the speed of message exchange within the network up to one million per second. EOS team and coins Before trading EOS or investing in this coin, one need to learn more information about the projects team. The system is created by Block One company, led by Dan Larimer. This person is famous in crypto industry as he was founder of Bitshares and Steemit. As for EOS coins they are listed on most of major trading places and have medium liquidity level as compared to other cryptos. EOS is on the fifth place in the list of market capitalization according to coinmarketcap in the moment of writing. Comparing EOS and Ethereum Once you have decided to trade EOS or hodl it, you need to know the closest competitor of this project. EOS is designed to create dApps and smart contracts meaning its rival is Ethereum. Despite all the similarities that EOS have with Ethereum, those projects are not the same and this information is important for traders and investors in order to understand whether to put money in EOS or not. Target audience Many investors think that EOS and Ethereum are the same but they have different target audience. EOS adepts think that this platform will be more decentralized as it uses Proof of Stake consensus mechanism as compared to Ethereum, which works on Proof of Work. EOS is supposed to be the host of different decentralized applications that would high costs if run on Ethereum platform. There is no transaction fee within the EOS network. Technical differences EOS team aims at overcome scalability, functionality and usability issues that Ethereum has currently. To do this, developers have implemented delegated Proof of Stake protocol, which helps to eliminate the bottleneck that Ethereum network has currently. Another reason to use it is the ability to freeze the network and to fix broken applications without affecting other accounts. Quote EOS has chosen this DPoS mechanism to add more democracy into their network meaning no party will be able to consolidate enough coins (PoS) or computing power (PoW) to control the whole network. Additionally, EOS team expects the system to process 1,000 operations per second and to increase this number in future up to 100,000 transactions. However, Ethereum developers also work on scalability as they seek to introduce Casper technology, an update that will help the network to be more scalable. As you may see, there are several differences between EOS and Ethereum and it is not clear whether the first is able to beat the second. Find more on topic https://cryptocomes.com/eos-trading-for-beginners-how-to-trade-eos-profitable Title: Re: Daily price analysis BTC + ALTCOINS Post by: Dany44 on April 26, 2018, 08:44:58 AM 04/26/18 Bitcoin, Ethereum and NEO Hold Up Against Bears, Ripple Faces Unpleasant Surprise
Enough or not enough? That is the question. Correction may continue as Bitcoin is in no hurry to bounce back. Yesterdays correction did not come as a surprise to us - nor, hopefully, to our readers, nor, it seems, to most market players. Bulls and bears have been preparing for this event in advance - there was no panic or haste in their actions, and behavior of most asset prices was predictable. Now, when the technical indicators have cooled, and the overbuying of coins subsided, upward movement can continue inside the global growth trend which has maintained its boundaries. This is what buyers expected - but could it be that the market has no surprises in store? EOS and Bitcoin Cash look better than the market As a result of todays events, capitalization was once again thrown beyond the $400 bln mark, which has become the Rubicon dividing global growth and market decline. With few exceptions, all positions are in negative territory, with losses of 8 percent for Bitcoin, and 9 to 12 percent for altcoins. EOS is looking better than the market, becoming the most hyped asset of the month - its price fell only by 2.8 percent. Interestingly, this is echoed by Bitcoin Cash, whose crazy rally did not end in catastrophe. It seems that the patrons of the coin are seriously intent on proving to the market that Bitcoin's main rival is not an empty prospect. BTC/USD At the moment, Bitcoins minimum price since the beginning of the correction was $8,670 - that is, the decline stopped between the first and the second goal, of which we spoke yesterday. Next, we see two possibilities of development. Given the shape of the last four-hour candle (hammer pattern), it can be assumed that the next candle will be green. In that case, we will expect growth at least to $9,050, and then, possibly, to $9,200. After that, it would be good to test the upper green channel and if it holds, to begin recovery. This scenario seems the most logical. https://cryptocomes.com/sites/default/files/inline-images/Pic01_29.PNG But who says that manipulators (who have repeatedly revealed themselves during the past two weeks) will allow events to unfold as they are expected to? For this eventuality, we have prepared a scenario with lateral trading inside the wedge either above or below the boundary of the green channel, the formation of a figure similar to head and shoulders, a breakthrough at point 1, testing of the 0.382 level of the Fibonacci retracement, and finally an arrival at our second target, $8,400. The next few hours will tell where the price will move and whether correction will continue. ETH / USD In Ethereum trading, events took a rather dramatic turn. On one hand, we have to give their due to the buyers who were able to keep the asset inside the growth channel which, given its steep incline, was not an easy task. Judging by the above average trade volumes, investors need Ethereum alive and well. On the other hand, despite all efforts, the price is still rather close to the boundary of the channel, and to make it worse, below the 0.236 Fibonacci level, which is an additional resistance. https://cryptocomes.com/sites/default/files/inline-images/Pic02_27.PNG With an eye on Bitcoin, which is hesitating with some indecision, we are betting on a break through the channel. Further, the most likely scenario would be a testing of the previous local minimums at the $600 mark first, and then a descent to the 0.382 value of the Fibonacci grid, which coincides with a strong mirror level of $575. In case of stronger negativity, we allow a further decline to the next target of the bears - $535, but this is unlikely for now. If the market does provide such an opportunity, it would be a waste not to take advantage and grow long positions in Ethereum at an attractive price. NEO / USD Unlike Ethereum (https://cryptodetail.com/how-buy-ethereum-and-convert-cash), NEO has already fallen out of all possible channels (even the exotic curved one). Before a full recovery, the asset will have to overcome the $75 mark, which is where the resistance is now. Although, this will become a problem only in case of a prolonged lateral movement by Bitcoin. https://cryptocomes.com/sites/default/files/inline-images/Pic03_27.PNG Potential areas of further decline in case of negative developments are $69 - at the level of previous lows - and then $64, which coincides with the mirror level and the 0.5 value of Fibonacci retracement. Near the second goal lies the boundary of the long-term descending channel, the breaking of which will be actively resisted by buyers with a likelihood approaching 100 percent. Lets not forget about the $60 mark, important for NEO, but for now such success for the bears does not look realistic. XRP / USD We saved the Ripple chart for dessert. With just one glance, the eye is drawn to the red candle with a huge lower shadow reaching to $0.50. This is how the collection of stop-losses looks on the Bitfinex exchange. When a protective order for a substantial sum is triggered and there is no nearby purchase order for a similar volume of assets, the price gets dragged down, catching other stop-losses in a chain reaction. This continues until the snowball is shattered against the impassable buy wall, which in the case of Ripple was exactly at $ 0.50, and then bounces back almost to initial values. https://cryptocomes.com/sites/default/files/inline-images/Pic04_13.PNG Interestingly, this pattern is not repeated on other stock exchanges - it is more typical for Bitfinex. However, lets leave the shortcomings of algorithms on the conscience of Bitfinex developers. For us, this means that a big player has left Ripple and is not going to defend his position. On the other hand, despite these events, prices barely decreased, which indicates that other players are gaining interest in the asset. The nearest resistance for Ripple is at $0.85, and it will be difficult to overcome without a general positive atmosphere. As for possible targets for further correction, they are represented by the set of $0.77 (again), then $0.73 - 0.75 (the boundary of the ascending channel) and, finally, $0.71. We believe that the latter will be reached only in the context a strong negative development in the market. The link: https://cryptocomes.com/bitcoin-ethereum-and-neo-hold-up-against-bears-ripple-faces-unpleasant-surprise Title: Re: Daily price analysis BTC + ALTCOINS Post by: Dany44 on April 27, 2018, 08:57:02 AM 04/27/18 Bitcoin, Ethereum and Monero Fight Off Bears While Litecoin Retreats
Guess what? Another surprise! The market defies expectations as Bitcoin rises to $8,325. The deviousness of the market as a whole and of its individual subjects is limitless. Yesterday we had the opportunity to observe how the money gets taken away from traders who forgot about caution and risk management. Manipulators, with the eager assistance of exchange bots, twisted prices this way and that, directing them according to their own wishes and against market orders. As a result, correction was replaced by growth, and the crowd, having expected (not without grounds) a further decline in cryptocurrency prices, rushed to increase long positions again. Capitalization bounces around as Bitcoin dominance stays still The total capitalization of the market continues to leap back and forth around the key mark and amounts to $416 bln by the beginning of Friday. Bitcoin dominance surprises us with its stability - it has not deviated from 38 percent for several days now. The absolute majority of the top 10 coins grew by 4 to 6 percent. Stellar, having grown by 20 percent, is in the vanguard today, justifying its logo in the shape of a rocket. Its followed by IOTA with a more modest, but still above average, increase of 12 percent. BTC / USD Despite all the stars in the sky of technical analysis that aligned in favor of further correction, in the second half of past day we saw a sudden price jump to the level of $9,325, coinciding with the boundary of the parallel ascending channel. At the same time, the chart clearly shows that in the course of 24 hours trading volumes for sales remained consistently higher than for purchases. Why was this the case? We were following the trades closely and we know the answer! https://cryptocomes.com/sites/default/files/inline-images/Pic01_30.PNG It seems that the exchanges are on a course to sustain the value of the main asset in spite of market sentiment. We are primarily thinking of Bitfinex here, but were sure its true to some extent for other exchanges as well. As soon as a large Bitcoin lot was sold, an exchange bot would rush in and fill the remaining void with a string of minimum purchases, bringing the price back to the original value. One can only imagine the pain this must have caused to traders who parted with long positions. The market is turning out to be a veritable Wild West! As for potential further price movement, two options are possible. The chart shows the formation of a bullish flag, the full-fledged activation of which can bring prices to the level of previous local highs at $9,650 - $9,750. For today, this would be enough for the bulls. At the same time, we may be dealing with a false upward price exit. Even though the bearish wedge was broken, point 1 can still serve as the door to further correction. In this case, yesterday's review, with all of its indicated goals,will not lose relevance. At present, the key level is located at $9,200. If the bulls (or manipulators) manage to hold the price above it, then the first scenario is more likely - otherwise, the second. ETH / USD Ethereum investors can breathe a sigh of relief: the asset did not embarrass them and survived the correction with dignity. Even if we see a second wave of price declines, the coin has formed a margin of safety which will allow it to stay inside the growth channel for some time. The markup that we placed earlier also remains in force. https://cryptocomes.com/sites/default/files/inline-images/Pic02_28.PNG The boundary of the ascending channel remains the most important support for Ethereum. If during continued correction it is broken through, the next support for buyers is at the 0.236 level of the Fibonacci grid and coincides with $630. This is followed by the 0.382 value of the same grid and the price $575. Considering how well the asset is holding up, our third correctional targe of $535 becomes increasingly more illusory. As with Bitcoin, the growth scenario is currently limited by the previous high at the level of $710. LTC / USD Unlike Ethereum, Litecoin has left the ascending channel and, given the turmoil in the market, it will have a difficult time returning there. At the time of writing, the asset is trading at an equilibrium price of $150 and is ready to follow in the direction where its commander Bitcoin will point. https://cryptocomes.com/sites/default/files/inline-images/Pic03_29.PNG The diligence with which the remaining fans of Litecoin protected the level of $145, coinciding with the 0.382 value of the Fibonacci retracement, deserves respect. Long lower shadows of candles indicate a decisive stance, but that wont help the asset if Bitcoin updates previous local lows. In such a case, the next, and very likely last, stop on the way down will be the level of $137, although the possibility of reaching $130 cannot be completely ruled out. XMR / USD Its been a while since weve examined the Monero chart, but nothing critical has taken place in the meanwhile. The return to the previous ascending channel while most assets have fallen out of theirs - or just barely holding on - is a good sign. https://cryptocomes.com/sites/default/files/inline-images/Pic04_14.PNG In the event of negative developments, the targets for bears are $245 near the 0.382 value of the Fibonacci retracement and $230, although the arrival at that mark is very questionable. More likely, buyers will try to hold the price at the level of $245 as long as possible, with the hope that Bitcoins drop (if it happens at all) will not go too far. It is too early to discuss growth targets - to begin with, Monero needs to reach its previous highs at the level of $300. The link: https://cryptocomes.com/bitcoin-ethereum-and-monero-fight-off-bears-while-litecoin-retreats Title: Re: Daily price analysis BTC + ALTCOINS Post by: Dwarf42 on April 27, 2018, 09:39:50 AM Here will be the latest price analysis for BTC and altcoins. You can see that today the market has started to be much more vibrant than yesterday, it can be seen that the day after the girl bitcoin has recovered to $ 9300 and the current time is showing signs I believe you can completely buy and trade altcoin at this time. There are so many altcoin are recovering very strong and are pump very strong price, you make a clear investment plan to be able to control their capital.We appreciate your opinion. Daily reviews are also placed on https://cryptocomes.com/pricewise (https://cryptocomes.com/pricewise) https://i.imgur.com/CuYXzTr.png (https://cryptocomes.com/pricewise) Title: Re: Daily price analysis BTC + ALTCOINS Post by: Dany44 on April 30, 2018, 09:09:53 AM Ethereum Trading Guide for Beginners
Ethereum trading, main features of ETH, how to become professional trader and investor Ethereum is a platform for decentralized applications. The concept of this system was offered by Vitalik Buterin in 2014. Canadian developer positioned his project as an alternative Blockchain system with brand new tools for developers around the World. This is a complete Ethereum trading guide for beginners, which will help you to understand how to buy this crypto and what are the main aspects that influence Ethereums price. Why Ethereum looks attractive for traders and investors This system has wider tools as compared to Bitcoin. Main Ethereums idea is to provide businesses as well as individuals with reliable tools for transactions and their activities. Quote One of the most interesting feature of this network is smart contract. It helps parties to cooperate without mediators. Those smart contracts are autonomous and are executed automatically once parties meet all conditions, written in this digital agreement. Ethereum has better scalability than Bitcoin meaning the higher speed of transactions and their lower fees. The project has an open source nature allowing businesses to create their own Blockchains. The key factors to influence Ethereums price Ethereum is a decentralized network with no governmental body to supervise it or to affect coins price. There is no regulatory authority as compared to traditional markets where central banks have the right to issue currencies and to affect them by their decisions. Quote The only thing that matter here is the supply and demand. The higher the last is, the more expensive coins will be. Ethereums price has grown significantly since the first day but because of lack of liquidity, Ethereum remains volatile. Cryptocurrencies trading is not an easy trip to do. You need to monitor several aspects in order to take a decision as they influence demand, which is crucial for Ethereums price. Here they are: Experts opinion This is one of the main factors that affect ETHs cost. Those experts may be famous investors or developers from cryptocurrency community. Their comments are very important for traders and may result in huge price changes. It is to mention that Vitalik Buterins view is also a key factor that may influence Ether price. Quote In addition, Ethereums cost is vulnerable to opinion towards the crypto industry in general. When some famous investors such Warren Buffet make statements related to coins, their price may rise or fall depending on the nature of comments. Please, notice that Buffet is strongly negative towards this industry in general in the moment of writing. Deployment of technology Ethereum is more than just a cryptocurrency as this platform allows users to make contract and create dApps (decentralized applications). This is one of the key factors of Ethereums success. The wider this technology will be spread, the more users it will attract and the more investments Ethereum will get in future. This may positively affect ETHs price. Ethereums popularity grows as this technology attracts attention of both businesses and consumers. Smart contracts, for example, offer the opportunity to conduct transactions without mediators. How do they work? Quote Lets see a simple example. A person wants to purchase some goods in an online shop. Before the appearance of smart contracts, buyers had to pay in advance and depended on banks. Smart contracts offer the opportunity to exclude all mediators between the business and its clients as they include all conditions of a transaction. Lets say a buyer purchase a keyboard online. He does all the necessary steps on the website. The funds, necessary to complete the transaction are frozen within the Smart contract, which includes the price of this keyboard, and the delivery conditions. Once the buyer receives the keyboard, he confirms the transaction and his funds are transferred to online shop. Events and investors moods Every professional trader and investor has seen at least one huge price drop irrespective of the market they trade. There was significant price falls on stock markets during 2008-2009 crisis period, provoked by investors panic and rumors. Quote In order to make Ethereums trading successful, you need to monitor all important events and predict investors reaction to them. Lets say there are rumors that US government is going to strengthen measures towards exchanges. What will happen in this case with cryptocurrencies? They will likely to drop as such rumors lead to panic. All bans and restrictions lead to fears and result in downtrends. However, when there are positive events, Ethereums price goes upwards. Technology uniqueness One of the main factors of Ethereums success is uniqueness of the technology. As we had mentioned it before, this system was created not only to support the inner cryptocurrency or to allow user to conduct faster and cheaper transactions as compared to Bitcoin, but also to provide businesses with wide range of tools to create different applications and to use smart contracts. Find more on topic https://cryptocomes.com/ethereum-trading-guide-for-beginners Title: Re: Daily price analysis BTC + ALTCOINS Post by: Dany44 on May 01, 2018, 08:27:39 AM Mayday Distress: Bitcoin Falls Below $9,000 Dragging Down Ethereum, Litecoin
https://cryptocomes.com/sites/default/files/styles/912x570/public/2018-05/smile_0.jpg?itok=kK5roACt Mayday, Mayday! The market spirals down as Bitcoin nosedives to $9,000. The last month of spring begins, and today we would like to look back on how expectations have been changing in the market since the beginning of the year. At first, investors assumed that given the intense media attention to cryptocurrencies, the correction would be brief and the new growth spurt will follow in February. This did not happen. Then, realizing that the decline is getting drawn out, many prepared themselves for Bitcoins fall to $4,500. And again, the players were deceived in their expectations. Finally, after the trend reversal was confirmed, buyers bet on Bitcoin as the guiding star that would lead the entire market to a brighter future. But the altcoins took over the spotlight. What does this all mean? Only that the cryptocurrency market does not lend itself to a medium term forecast in the classical sense (several months). A confident discussion of the potential of Bitcoin and other assets in the long term, also, can only be attempted by Mr. McAfee, perhaps. On the other hand, short term technical analysis never loses its relevance. Fortunately for our readers, that is exactly what we know how, and love, to do. A reckoning day for EOS and NEO By Tuesday, market capitalization fell 7 percent, down to $409 bln. Bitcoin dominance almost returned to its stable 38 percent. The overwhelming majority of positions have turned red, with the only exception in the top 10 being TRON, with a growth of 3 percent compared to yesterday. EOS is doing worst of all, falling by 16 percent, although thats hardly a surprise. It is followed by NEO with minus 10 percent, and the third place from the bottom is shared by Stellar and Bitcoin Cash, which declined by 9 percent within the day. Needless to say, it was these four coins that especially pleased investors for the past two weeks. Well, the hour of reckoning has come. BTC / USD As we predicted yesterday, Bitcoin investors could not take the pressure of a prolonged lateral trade, so by the end of Monday the rate of the cryptocurrency started creeping down slowly, having fallen out of the ascending channel formed in mid-April. In addition, on the chart we see the formation of a narrow descending channel, which can become a haven for the price of the main asset in the next few days. https://cryptocomes.com/sites/default/files/inline-images/Pic01_8.png The immediate target of the decline is the range of $8,800 - $8,750. To those readers who agreed with our opinion from yesterday's review and opened a short position, in the hope of making a profit on the fall, we recommend reducing the position at least by half at this level. The second goal, which we have been mentioning for some time, is in the range of $8,400 - $ 8,500. Its achievement is quite realistic, unlike, for example, $8,100, which also fits into the current picture, but might not be reached. This is related to the fact that investors will attempt to direct profits earned on altcoins mostly into Bitcoin, which will provide additional support to the asset. ETH / USD Like Bitcoin, Ethereum could not hold on to the ascending channel. The hopeful news is that, unlike Bitcoin, it has not yet formed a descending channel, having rebounded from the nearest support in the form of the 0.236 Fibonacci correction at $630. https://cryptocomes.com/sites/default/files/inline-images/Pic02_31.PNG The next support coincides simultaneouA more negative situation as compared to Ethereum is explained by the fact that Litecoin has reached the 0.382 value of the Fibonacci retracement already. Therefore, any additional weakness of the main asset will push Litecoin to a lower level - $135. Buyers will have to work hard to hold this level, but they do not have any other choice - if the mirror support-resistance is broken, then the prospects for Litecoin are not at all rosy. XRP / USD Among all assets discussed today, Ripple is still doing best of all. The growth channel has been tested, but not broken, although we are under no illusion about its reliability in case of Bitcoins continued correction. Among negative points, there is the decline of trading volumes which began after the events on the exchange that we addressed on April 26.sly with the next mark on the Fibonacci grid, and with a solid mirror level at $575. We believe that achieving the second goal coincides with Bitcoins decline to $8,400 - $8,500. A deeper correction of the main asset could theoretically open the door leading Ethereum to $535, but this scenario is not the primary one at the moment. https://cryptocomes.com/sites/default/files/inline-images/Pic04_17.PNG LTC / USD We have not reviewed the Litecoin chart for some time, but were not particularly surprised by the nearly complete absence of significant changes. The asset left the ascending channel a week ago and since then has been trading in the narrow range of $145 - $155, showing a flatter movement than even Bitcoin. https://cryptocomes.com/sites/default/files/inline-images/Pic03_32.PNG The nearest support, with a double confirmation in the form of a mirror level and a 0.382 value of the Fibonacci correction, is close by at $0.77. Further, there are the levels $0.70 and, as an extreme possibility, $0.65. However, we doubt that the latter will be reached. Most likely, despite the fears associated with the bugs (or malicious intent) of Bitfinex, investors will show increased interest in Ripple already at $0.70. The link: https://cryptocomes.com/mayday-distress-bitcoin-falls-below-9000-dragging-down-ethereum-litecoin Title: Re: Daily price analysis BTC + ALTCOINS Post by: Alex077 on May 01, 2018, 11:38:59 AM I think that the course will rise to 25k, but then it will drop to 13-14 ... Bitcoin and the entire market cryptocurrency have already begun to grow, and now the price is at 9000, in a week it's going to be 10 000. I think it will be around 13- 14 by September without bad news and then continue to grow to 25 in late November.
Title: Re: Daily price analysis BTC + ALTCOINS Post by: Dany44 on May 02, 2018, 08:23:37 AM 05/02/18 Bitcoin, EOS and Ripple Recover From Small Correction, Monero Sinks
Volatility stays low despite expectations, Bitcoin, EOS and Ripple bounce back as neither buyers nor sellers make their move Just as for seafarers any kind of wind is better than dead calm, for a cryptotrader any fluctuation in prices is better than stability, on which, with all effort and skill, it is difficult to make any profit. We are talking specifically about crypto trading, because in traditional markets, low volatility is the norm, and margin trading, where the risk/return ratio is easily regulated by changing the size of the long or short position, is actively used to compensate for small adjustments in trading pairs. For the cryptocurrency market, this approach can be disastrous, because low volatility here is an exception to the rule, a temporary trend. No one knows when it will end- in a day or in a month. Therefore, we are getting the impression that players vigilance is being relaxed deliberately, since weve seen the whales change Bitcoin price by as much as $1,000 in a day, and the lesser the capitalization of an asset, the easier it is to manipulate its value. Stronger inverse correlation between market cap and Bitcoin dominance By the middle of the week, market capitalization has grown to $420 bln. Recently, another trend has formed: market growth is accompanied by a decrease of Bitcoin dominance (today down to 36.5 percent), which confirms the conclusion that altcoins are the driving force. On the other hand, altcoins can lose value as quickly as they gain it, so $20 bln fluctuations in capitalization go by unnoticed and have virtually no effect on the price of the top 10 assets. Today, also, changes in the prices of top coins are insignificant, with average gains of three to five percent. EOS has grown the most after a rapid restart, increasing by 12 percent, followed by Cardano and Stellar with nine percent. After 24 hours, Bitcoin is still dawdling at $9,000, while TRON finished its growth stage and has lost a modest 1.5 percent so far. BTC/USD During the previous days trades, before returning to initial values, Bitcoin reached our first decline target- the minimum was $8,818, well consider an $18 error acceptable. Seller pressure was contained by the boundary of the descending channel, which received another confirmation as a result. Now, if the channel continues to be relevant, a new bear attack will take the prices below $8,700. https://cryptocomes.com/sites/default/files/inline-images/Pic01_02.05.PNG The moment of truth on the chart could be defined by the points of intersection of the young descending and long-term ascending channels. Depending on speed of movement, they are marked by numbers one and two respectively. In case the first scenario is realized, the breakthrough to the second decline target $8,400-$8,500, with a subsequent rebound and return above the boundary of the ascending channel becomes obvious. But in case of reaching point two, there may be no downbreak, more than that, an upward breakthrough the formed triangle may give an impulse for new purchases and cancel the scenario of further correction. EOS/USD As we expected on Monday, after the fallback EOS continued to trade in the range of $17-$ 20, and the minimum price since the beginning of the week was $16. Buyer support was provided by the nearest level of Fibonacci retracement- 0.236. For now, trading volumes remain high, but yesterday the lions share of transactions was made up by sales, so in the upcoming days we may see a slight decrease of investor interest in the asset. https://cryptocomes.com/sites/default/files/inline-images/Pic02_02.05.PNG Due to the spasmodic movement of the price, there is still not enough data for building channels according to the rules of technical analysis. Therefore, we cheated a bit and built an ascending channel on the basis of the mirror level, to which the price of the asset was previously sensitive. Today we expect a decrease in the volatility of trades with an equilibrium price of $18. Meanwhile, the previously mentioned range of $17-$ 20 is unlikely to be expanded. It is still best to refrain from purchases. XRP/USD A stable Bitcoin continues to give Ripple the opportunity to please investors. The ascending channel has held, and the price has formed some margin of safety. Until Bitcoin marches on to conquer the second decline target, this margin should be sufficient. https://cryptocomes.com/sites/default/files/inline-images/Pic03_02.05.PNG The situation is complicated somewhat by the approach to the boundary of the descending channel. Its intersection with the ascending channel forms a triangle, which will be resolved within 24 hours at the most. We do not exclude the possibility that it might be activated upwards, taking prices to the level of $0.88-$0.9. The set of decline targets at $0.77 and $0.70 remains relevant, but the probability of their attainment, especially the second one, has slightly decreased since yesterday. XMR/USD There is still no cause for joy in the Monero camp. Its true that the support of $230-$235 has held, but trade volumes are not indicating any enthusiasm from buyers, and the asset itself continues to move in the lower register of the descending channel. https://cryptocomes.com/sites/default/files/inline-images/Pic04_02.05.PNG In the course of the day, we expect a repeat test of $235. If it does not hold (especially in case of negative developments on Bitcoin), the possibility of a decline to the range of $213-$220 will be higher. In this case, correction will reach the 0.618 value of the Fibonacci grid, and if even at this level investors remain indifferent, we will have to reconsider the attractiveness of the asset for the medium term. Nevertheless, the huge amount of capital that came into Monero on April 18 is still there, and will certainly be defended- there is no reason to panic at the moment. The link: https://cryptocomes.com/bitcoin-eos-and-ripple-recover-from-small-correction-monero-sinks Title: Re: Daily price analysis BTC + ALTCOINS Post by: Dany44 on May 03, 2018, 08:10:59 AM 05/03/18 Fresh Capital Inflow Helps Crypto Market Grow, Altcoins Feed Off Bitcoin
Bitcoin wants to break free: $9,000 is left behind, but a strong resistance lies ahead. Altcoins have some time to grow https://cryptocomes.com/sites/default/files/styles/912x570/public/2018-05/photo_2018-05-03_10-14-10.jpg?itok=XKj1WDiL After a short pause, the celebrations in the altcoin camp continues. By the beginning of Thursday, we can see moderate growth for all assets, with the exception of only a few coins including Verge, TRON and Stellar, but even those fell back just a few percent. This growth looks forced- its difficult to move upward for a long time without fallbacks, heavy coins feel the gravity more, but a trend is a trend and has to be reckoned with. And what about Bitcoin? It seems that the father has become a blood donor for the children- its dominance makes up 35.9 percent at the time of writing. Since the beginning of the year, Bitcoin has already lost more than 10 percent of the market share. However, there is no doubt that it will eventually return all losses, redeeming the altcoins debt with interest. Here is the remarkable part- despite the drop in dominance, Bitcoin price itself has been growing slowly over the last 24 hours. From this discrepancy, we conclude that the market is not just stewing in its own juices, but has new players with fresh capital. IOTAs turn to get some positive news hype Thanks to this, total capitalization has grown by another $20 bln and now amounts to $440 bln, which is a record since the beginning of March. Among the top 10 coins, Bitcoin Cash has shown the best results with an increase of 13 percent, boosted by the news of being added to the London Block Exchange, and is followed by IOTA which has displaced TRON in ninth place. The coin grew an impressive 20 percent aided by the announcement of IOTA Ecosystem- a home for developers and members of the projects community. BTC/USD In the context of a generally positive mood, Bitcoin is growing as well, although it would make more sense if it fell. Buyers are not allowing the assets price to fall significantly, but its far from setting local records. It is hard to say right now whether this is a plan by some higher powers that need a stable Bitcoin to guarantee altcoin growth. In any case, the descending channel has been broken. We left just its upper boundary on the chart- most likely, we will see testing of this mirror level. https://cryptocomes.com/sites/default/files/inline-images/Pic01_32.PNG On the new markup, first of all, we draw the readers attention to the ABC triangle, the activation of which will determine the future fate of not only Bitcoin but the entire market. While prices are inside the triangle, we do not advise any purchase-sale transactions- this should only be done if one of the triangle facets is broken. In the course of the day, we are likely to see a test of the upper facet at the level of $9,300-$9,350. If the resistance proves to be strong enough, Bitcoin will be testing the opposite side at $8,900 where the former descending channel will remind us of itself. If the bears persevere, the set of decline targets $8,800 - $ 8,560 - $ 8,400 will become relevant. They all correspond to values of the Fibonacci grid, as well as to mirror levels. In the case of the triangle breaking upward, the nearest prospective target, aside from the previous local maximum at $9,750, will be $10,500. BCH/USD The surge in purchase volumes over the past 24 hours confirms investors' interest in Bitcoin Cash. Having formed the "double bottom" figure with a minimum of $1,230, the asset began the next growth stage and is attempting to overcome the previous high at $1,580. We believe that lateral trading will move to the upper level, which will become the launching pad for further movement. https://cryptocomes.com/sites/default/files/inline-images/Pic02_32.PNG The prospective goal of bulls is clearly seen at $1,800: it is confirmed by the mirror level, and by the 1.618 value of the Fibonacci extension, and by the boundary of the symmetrical figure, which suggests itself as the zone for the new lateral trading. The triple confirmation inspires confidence, but let's not forget that Bitcoin Cash trading is playing crypto on hard mode. Moreover, as usual, a lot depends on the original Bitcoin. In case of negative developments, a fallback to the level of $1,300 is possible. Therefore, once again, we recommend that readers refrain from trading until the situation becomes clear. ETH/USD Ethereum buyers have attained an important achievement- the price was returned to the long-term ascending channel, formed in early April. Now, in case of correction, a price drop to $535 looks unlikely, but $575 remains possible. In order to stay within the channel, the bulls will need to do their best. Because of its steep slope, slowing down is not permissible, so Ethereum investors need to pray for continued Bitcoin growth. https://cryptocomes.com/sites/default/files/inline-images/Pic03_34.PNG In the case of a continued upward movement, the prospective target that we indicated earlier, $800, gets closer. For greater accuracy, we constructed a Fibonacci extension and got a target range of $780-$800. At the moment, Ethereum is looking better than the market, trading volumes remain stable. In case of correction, we recommend increasing long positions. XRP/USD Storm clouds are beginning to lift over Ripple investors. However, while the price is in the lower register of the ascending channel, it is premature, just as in the case of Ethereum, to say that the threat has passed completely. The safe margin of movement from the current price of $0.87 is insignificant - only $0.02, while the critical level coincides with the 0.382 value of the Fibonacci retracement and the intersection of the ascending and the descending channels. https://cryptocomes.com/sites/default/files/inline-images/Pic04_18.PNG In addition to the immediate growth target of $0.96-$1, the Fibonacci expansion points to a prospective target of $1.085, but its a hefty 25 percent away, so its attainment in the next few days is extremely unlikely. We believe that until the end of the weekend, the trading range will be $0.85-$ 0.92, at best. The link: https://cryptocomes.com/fresh-capital-inflow-helps-crypto-market-grow-altcoins-feed-off-bitcoin Title: Re: Daily price analysis BTC + ALTCOINS Post by: margert on May 03, 2018, 09:33:13 AM Here will be the latest price analysis for BTC and altcoins. The market has been showing signs of recovery in the last few days, and you have noticed that bitcoin and altcoin prices have been increasing steadily in recent days and are showing signs of improvement. According to my analysis, the bitcoin price will probably continue to rise and reach $ 11000 in the coming days.We appreciate your opinion. Daily reviews are also placed on https://cryptocomes.com/pricewise (https://cryptocomes.com/pricewise) https://i.imgur.com/CuYXzTr.png (https://cryptocomes.com/pricewise) Title: Re: Daily price analysis BTC + ALTCOINS Post by: jsrenthourse on May 03, 2018, 09:38:21 AM Here will be the latest price analysis for BTC and altcoins. I believe that at this point if you are holding altcoin then you should take the bitcoin out, as my analysis, the price of bitcoin will probably increase very strongly today so you should get rid of bitcoin to be able to tell Be profitable and increase profits. The market is volatile and difficult to predict. Therefore, it is very difficult to trade, so you should have a specific plan to delineate the risk.We appreciate your opinion. Daily reviews are also placed on https://cryptocomes.com/pricewise (https://cryptocomes.com/pricewise) https://i.imgur.com/CuYXzTr.png (https://cryptocomes.com/pricewise) Title: Re: Daily price analysis BTC + ALTCOINS Post by: Dany44 on May 04, 2018, 08:05:50 AM 05/04/18 Bitcoin Bulls Gain Confidence, Litecoin and NEO Grow, Monero Falls Behind
https://cryptocomes.com/sites/default/files/styles/912x570/public/2018-05/bull_4.jpg?itok=zj_IqiL0 Bitcoin achieves previous local maximum. Litecoin and NEO react positively, while Monero investors are still in despair By the end of the first week of May, the market has returned to its normal state: assets are regaining independence and no longer moving up and down synchronously, Bitcoin and altcoins are compelled to fight for the attention of investors who are investing funds with a great deal of caution. As we expected, the phase of unrestrained growth for altcoins is over for now, while Bitcoins lateral movement continues (despite yesterday's achievements of bulls). The number of both long and short margin positions is falling, which means that exchanges will be less aggressive in using bots for price manipulation. Although, the market still needs a shepherd- a big player who will indicate the direction of movement, especially for Bitcoin. On the other hand, the price of most altcoins has arrived at a comfortable value for holders- less than Januarys, perhaps, but enough for respectable portfolios. Movement of top 10 assets becomes multidirectional Market capitalization has grown to $450 bln in the course of the day. The $10 bln gain can be attributed to the price increase of Bitcoin. The main question at the moment- will these funds remain with the main asset or will they be dispersed among altcoins? Out vote goes for the first version. For the first time in a long while, we see multidirectional movement among the top 10 coins. The old-timers Bitcoin, Ethereum, Ripple and Litecoin all show gains, and IOTA joins them from the less traditional assets. Other altcoins are at a loss, with EOS doing worse than others with a decline of seven percent. BTC/USD The break through the triangle happened earlier than we expected, and the prices were not given a chance to test the level of $8,900. Even now, after updating the previous local maximum (the new one is $9,780), we do not discount the possibility of correction. Despite the obvious growing trend, we can only be confident that Bitcoin has left the lateral trading after it gains a foothold above the psychologically significant mark of $10,000. https://cryptocomes.com/sites/default/files/inline-images/Pic01_04.05.PNG Readers who bought Bitcoin after the upward break in the triangle can be congratulated, but they should not lose vigilance- the market will certainly try to take this profit away. The price has already been corrected to 0.786 of the old Fibonacci grid, and may even go down further, to the value of 0.618 and the price of $9,350, respectively. The equilibrium price in the lateral trade is $9,200, coinciding with the correction level of 0.5 and the intersection of the already broken facet of the triangle and the ascending channel. Such points of accumulated interest often act as magnets for the price, but it is unlikely to be reached today. Prospects for further growth after a quick bullish run also remain vague, but the targets are clearly seen. The closest is $10,200, the next one is indicated by the mirror level and the 1.618 value of the Fibonacci extension- $10,500. The days key mark is at $9,550, if the price gets a hold above it, the scenario of further growth is more likely, otherwise- the scenario of correction. LTC/USD Despite a growth dynamic resembling Bitcoins, which becomes evident when comparing charts, the situation for Litecoin investors is less optimistic (though recently, that always seems to be the case). If the main asset was able to overcome its previous high, its younger brother has formed a classic "double top with the potential for further correction. https://cryptocomes.com/sites/default/files/inline-images/Pic02_04.05.PNG The nearest correction level is 0.236, coinciding with the price of $152, and Litecoin will almost definitely not fall below $144. Immediate growth is also unlikely, but over a few days, the price may reach $175, which is indicated by the activation of the potential flag. Above, Litecoin will face the most powerful mirror resistance level, which has more than once held back growth- it is marked in green on the chart. We recommend close monitoring of the assets approach to this level. XMR/USD We dont have any good news for Monero investors today. The asset is experiencing difficulties with rising above the $260 level, which has turned into a resistance. Young bull calves (we cant quite call them mature bulls) were able to push the price out of the descending channel for a short time, but could not hold the position. https://cryptocomes.com/sites/default/files/inline-images/Pic03_04.05.PNG But even if success favored the horned ones, the parallel expansion of this channel a little bit higher would certainly foil plans for further growth. Because of this, we predict that the asset will once again test the level of $230, where buyers should try their hardest to support the coin. We dont see any prospects of rapid growth for Monero - at best, the bulls can expect a test of the previous local high- $300. The medium-term goal of $340, which we marked on the chart, can be kept in mind, but there are no reasons to count on its rapid achievement. NEO/USD We are definitely liking NEOs chart: the asset is slowly but confidently moving in the ascending channel, without sudden ups or downs. In addition, confidence in the assets future is boosted by the huge initial purchase volume which we observed at the end of April. Active purchases started from the level of $80, which means that it will serve as a support in case of a negative development. https://cryptocomes.com/sites/default/files/inline-images/Pic04_04.05.PNG The medium-term prospective target for NEO remains the same- it is $105. However, some interference can be seen from the mirror level, similar to the one on the Litecoin chart. It is likely that the price will rebound from it, without reaching the designated goal directly. Depending on the growth rate, this can happen in the range of $98-$102. The link: https://cryptocomes.com/bitcoin-bulls-gain-confidence-litecoin-and-neo-grow-monero-falls-behind Title: Re: Daily price analysis BTC + ALTCOINS Post by: Dany44 on May 08, 2018, 08:54:07 AM Positive Monday For Bitcoin Price, LTC, NEO, Monero Still Negative
https://cryptocomes.com/sites/default/files/styles/912x570/public/2018-05/bull_7.jpg?itok=c1YZ1qS8 Bitcoin price still has some room for further growth until the closest resistance level Bitcoin is starting the week positively as bulls got a momentum. The Bitcoin price still has some room for further growth until the closest resistance level. Litecoin and NEO follow almost the same scenario. As for Monero, the cryptocurrency seems to remain under pressure. BTC/USD https://lh3.googleusercontent.com/lCK_zSPJ94EA-nwzLAzskcz1_2pTJj8XTRhO2nGEopcxpoXgReR-SNtCCQubnwn22vDF3MFRyTtzzzVpINihrx95aM9hj9VZfyIYjt1s6Luc3Wi1UOnAPJ03viWon3JAsiykIi4X BTC/USD still goes upwards on the Daily chart as it fluctuates along the upside trend line and is testing it today. Depending on the results of this testing, BTC/USD is likely to either fall below the trend line, looking for a major support line, which lies around 7,000 area or to resume its growth towards the resistance line, which is close to 11,500 level. Generally, BTC/USD price fluctuates within a large horizontal channel established by the above-mentioned support and resistance levels. There are no candlestick signals currently. https://lh3.googleusercontent.com/_mgh1PqONGbnP9IB7iPFhMqklRlZX2Yty5etgWVBCMshCiATQMxp5t4dqoJxgswTVToAMtZAQomdQA_x6w7PNtZWFvaK2pd4KFZBe-GD0O0fR4ak-FZaZ3BT9IPI3mMAYW5HjJOQ As for the Ichimoku indicator, Bitcoin price went above the upper side of the cloud demonstrating bulls commitment to change the tendency and reach the closest resistance line in the medium term. However, BTC price returned to the upper Ichimoku cloud line in order to test it (which is natural for this kind of indicator). If the line resists and gives support to Bitcoin price, bulls will probably have a good chance to reach their mid-term goals. Otherwise, bears have a chance to gain momentum again. https://lh5.googleusercontent.com/xr-jj0zsvauXn7Yu_3TsXFh8E-gdPlyi0bsxI2_6gCKUnm2DMnMRFOPIxS-PvhHxl3qbgJhyyNFa9x9Zgal7fuDG-fprXcAyv20K0jFGxLtkMLDsupnC0Hv-tRZIsjaumsGfF9bF As for the hourly chart, BTC/USD still has the same direction, going along the upside trend line. There were two chances yesterday to open short-term long positions from the trend line. Bitcoin price has a correction now as we can see the Shooting Star candlestick pattern. We expect the correction last until the upside trend line, where BTC price is able to reverse again towards the resistance line, which is close to the 9,500 area. https://lh5.googleusercontent.com/4H4lbcu7sl34Px5Fy_mZ1SUFGxaYq2nZUuhnOAbGwj3nD-fShmlhNZy0lbwFvGc0MODMd5QCGydXwQTfWio9FqSlPmuUFoTYcFhoaclyJsMUlu7LijB5NxP5bP1MpiMnhh59u0BT As for the Ichimoku indicator, BTC/USD is below its cloud but is likely to meet it today. If Bitcoin price enters the cloud, there will be opportunities to trade from its borders (channel trading). LTC/USD https://lh3.googleusercontent.com/5WAJFgltDjp4hvWOEU1b4S6B6rqH1YqTjHDj8Q8k47kg54HoS0UhCU-I8coWYoP5IUdWd5n4R0oeVCckgBEtBwVLxGFO6h-NdZkxnJlhh2erYOO3C5buOVN4lkrB8XQ1w_vL-yVr Litecoin goes the same direction as Bitcoin does, but Litecoin price is close to the resistance line. Bulls were trying to assault the resistance at 180.00 last week, but they had no luck and enough power to break through this line. Litecoin price jumped off 180.00 and went towards the upside trend line, where it stays now, waiting for bulls and bears to take active steps. If LTC price breaks through 180.00, the next midterm target will be close to 240.00 area. https://lh4.googleusercontent.com/PZvlWllTm1mwyCMkyNODFQoFCT8IcKkYpKetIPw52TN_QSqyaHpOMpJOAU5x4iq3Z97iQHxWe8TWdjcPZEL8RL6vqNsKfevstneCqeE45tgPUr2aTe2As8kuJ-GdSr49E647c85k As for the Ichimoku indicator, Litecoin price resides within the cloud and rejected its upper side. Now it has two ways- to go downwards and to test the lower side or try the upper side again (the trend line may support bulls and help them to stop the correction, which is clearly seen on the chart at the moment). https://lh6.googleusercontent.com/FcttIqsrCthZ_x4SDEharJvGFs5sUWIEdKJW86kqF0B7Cm5jQ9vOxqegfYsnFEPqsYdhph62JDuID0r8OCwuRlbgDIWHSKkyEvCApXFuq3t8tcCw00lpmhh80xG4t9P6LADtTvOR The situation is favorable for short-term bulls as LTC price goes along the upside trend line and rejected it twice already. However, there is a high probability for a downside correction now, which is able to aim the upside trend line. The closest target for LTC/USD on the hourly chart is 171 area, where the resistance line lies. https://lh3.googleusercontent.com/Esh2HRVJE55KA2cwbqHw1HoeZkRlq4yaqA4c0RZdACrb21sRofEmCve5UFa0FTi0XnRmBhfuCFjKYmfkRzrOlBROP4C67_HTcA_RmHBIQgqxLOMd3ripjZtA5LRQ7kx4KRBuaH7b When we look at the Ichimoku indicator, we can see that the bulls still try to break the situation and to gain momentum. However, LTC/USD fluctuates below the cloud, which means that bears still have some power. We expect the currency pair to reach the Ichimoku cloud today and to test its lower line. Take a look at analysis on XMR/USD and NEO/USD HERE (https://cryptocomes.com/positive-monday-for-bitcoin-price-ltc-neo-monero-still-negative) Title: Re: Daily price analysis BTC + ALTCOINS Post by: Dany44 on May 08, 2018, 06:25:59 PM All the reviewed cryptocurrencies went downwards in the second half of the day, marking the inability of bulls to gain momentum. The bears resume their market domination and seem to have enough power to develop this midterm downside tendency further towards the closest local support areas, which will be described here (https://cryptocomes.com/bitcoin-litecoin-monero-neo-to-develop-their-midterm-decline-bulls-frustrated)
Title: Re: Daily price analysis BTC + ALTCOINS Post by: Dany44 on May 10, 2018, 09:12:03 AM 05/10/18 Crypto Bulls Launch Counterattack, BTC, LTC, XMR, NEO Change Tendency
https://cryptocomes.com/sites/default/files/styles/912x570/public/2018-05/bull_3.jpg?itok=oBZlLVWg Cryptocurrencies finally seem to change their mood, offering buyers the opportunity to take initiative BTC/USD, LTC/USD, XMR/USD, NEO/USD have managed to make significant upside movements during the American and Asian trading sessions. Bulls seem to take control over the market. Midterm downside tendencies were broken as Bitcoin, Litecoin, Monero and NEO prices are rising above the descending trend lines. The situation looks promising for the buyers and they can develop their success in the next several hours. BTC/USD https://lh4.googleusercontent.com/1QKzc9x5reTliJfBxjHYzUcfUyA7UJXIHBp4QXprxmqvKpBhwSYXzVbPsw4YqkJW9ZucV16IYgYL_eVNPG-o3pEd3s4AIM62QYSzhh1jlrwXTny4Z5dwTico0_p7SEgGWWNSp3dTcBIc2MgvIw Bitcoin has started a correction yesterday, which is looking like a complete reversal. BTC price is now above the descending trend line, alerting traders to the possibility of significant short and midterm changes. BTC/USD has entered the Ichimoku cloud during the American and Asian sessions. It is still there and is testing the upper boundary of the formation. As we can see, there was one Shooting Star during the Asian session, which led the currency pair to a brief decline towards the lower boundary of the Ichimoku cloud. We now have two more Shooting Stars which are able to drive BTC price to the lower side of the formation, as there is a sort of channel trading now, which is natural for such situations when the price is within the Ichimoku cloud. The lower boundary of the Ichimoku cloud coincides with the $9,200 support line. If Bitcoin price goes there, BTC/USD will test this line and we advise readers to look for candlestick signals close to the support area. If the candles indicate reversal, the price will probably rebound from the support and go upwards. If there are no signals and BTC price falls below the support, BTC/USD will probably move to meet the descending trend line. There is another scenario, where Bitcoin fails to fall towards the support area and breaks through the upper boundary of the Ichimoku cloud without any further correction. Then, it is going to test the $9,440 area. https://lh5.googleusercontent.com/QLj3Rrrh69vuTr6hNx5btUanlZp-Hc72yEl2j0fe2CNCvQdMx2tjxzZiL6Qp-YNKv4Ub-92IKfCnanQgIFnZ9KQ-_Z31jYCJXvuRfylX667lXdhHrPUoS2HTnZcp47j38eDWtutGyOfGAR3d6g As for the daily chart, the midterm picture had no significant changes. However, we can see that the upper boundary of the Ichimoku cloud held BTC price above the formation and there is probability for the development of an upside tendency. LTC/USD https://lh5.googleusercontent.com/yGyOBhQYH_x-PjpJIGR5XL5qhkVGWqrfiXFSj-JCHdvnVx3kqjBXKhZYewlYZ6U9R3A8R43JODwh0GefsBExwhYQtxkXYbz8nGFO8YWXn7vphdXNlgIjfKxO8AfNUs6VDlFrjIgXpPVyMY7j2A Litecoin followed Bitcoin in its upside tendency as LTC/USD jumped over the descending trend line during the Asian session. LTC price is now close to the lower side of the Ichimoku cloud. If Litecoin tests it successfully, there are more chances for the cryptocurrency to develop its upside tendency. The Ichimoku cloud is rather thin there and Litecoin price will probably meet no significant resistance. The next level to pay attention to in this case is the $165 resistance line. Another possible scenario is where the bears try to take the initiative. They will attempt to drive LTC/USD lower until the descending trend line, at least. However, this scenario is not the primary one, as bulls are getting stronger and the situation looks promising for them. https://lh5.googleusercontent.com/9vIGosifehFlQFyBPQUizMx9ZABj_BGbcglHTzvLl4v64BJDzff1qE7sGUaaRV886PhuxKamdLPk4AzSCEx_VPa0opS8e0Yz44qQ2kx7tcZTuMvJiIeBprni968GA1LTMgxo5EBVnwAvlRx6yg LTC price is still below the ascending trend line on the daily chart, but it fails to reach the lower boundary of the Ichimoku cloud. There are some signs that LTC/USD will be able to return above the ascending trend line. If this happens, Litecoin will test the upper boundary of the Ichimoku cloud at midterm. Check more details on XMR/USD and NEO/USD pairs HERE (https://cryptocomes.com/crypto-bulls-launch-counterattack-btc-ltc-xmr-neo-change-tendency) and also post review HERE (https://cryptocomes.com/pricewise) Title: Re: Daily price analysis BTC + ALTCOINS Post by: jsrenthourse on May 10, 2018, 10:22:33 AM Here will be the latest price analysis for BTC and altcoins. I believe that at the moment you should trade altcoin, can see that the price of bitcoin in today are showing signs of sideways after recovering to $ 9300 level. I think that with a market that is fluctuating constantly and it is difficult to predict the current time, trading day by day is the safest and least risky. Make a trade plan that will maximize your profits and risk your business.We appreciate your opinion. Daily reviews are also placed on https://cryptocomes.com/pricewise (https://cryptocomes.com/pricewise) https://i.imgur.com/CuYXzTr.png (https://cryptocomes.com/pricewise) Title: Re: Daily price analysis BTC + ALTCOINS Post by: Dany44 on May 11, 2018, 08:51:24 AM 05/11/18 Bears Regained Crypto Markets Control, Midterm Outlook for Bitcoin, Litecoin, Monero, NEO Negative
https://cryptocomes.com/sites/default/files/styles/912x570/public/2018-05/bear_5.jpg?itok=gn4FVa-N Bitcoin, Litecoin, Monero and NEO have reached new lows during the US and Asian sessions BTC/USD, LTC/USD, XMR/USD, NEO/USD declined sharply yesterday meaning the end of a deep correction, started Thursday. Bears established new lows confirming they are still in the game and have total control over the markets. There are signs of a short-term correction that is likely to start within the next couple of hours. However, the midterm outlook is negative as almost all of the reviewed currency pairs stay below their midterm descending trend lines. The currency pairs may fall even deeper after this correction. We advise looking for clear candlestick signals in order to take meaningful decisions. BTC/USD https://cryptocomes.com/sites/default/files/inline-images/image1_11.05.jpg The currency pair started to fall during the American and continued the downside tendency within the Asian session. There was a Flag pattern in the middle of this short-term downtrend. Bitcoin is currently close to the support line (8,886 area) and the descending trendline testing both of them. Bears had no difficulties to cross the Ichimoku cloud during the US session with a long body candlestick. Bitcoin price is far from the formation currently signaling temporary changes in moods. There was a reversal signal a couple of bars ago (reversed Hammer). Bulls are able to start a correction at least. The closest target for it is the resistance line at 9,035 area. BTC price can reach this level in a couple of hours. Another scenario for Bitcoin is to develop its downside tendency. Bears will break the ascending scenario in this case as BTC price will fall below the descending trend line. https://cryptocomes.com/sites/default/files/inline-images/image2_11.05.jpg The situation is still unclear on the daily chart as BTC price has entered the Ichimoku cloud opening an opportunity for bears to push Bitcoin even further towards the lower border of the Ichimoku cloud at midterm. LTC/USD https://cryptocomes.com/sites/default/files/inline-images/image3_11.05.jpg There was a bad day for Litecoin bulls as well as LTC/USD started to decline during the American session and developed the local downtrend during the Asian session. LTC price crossed the lower border of the Ichimoku cloud, the support line, residing at 154.14 area, and the descending trend line, confirming the temporary change of trend. The situation is intriguing currently as LTC/USD is likely to start a correction (we have a Hammer candlestick pattern) and to test the descending trend line from below. If bulls succeed, they have an opportunity to regain initiative and to test the closest resistance line at 154.14 area. If they fail to cross the descending trend line, LTC price will probably fall below the support line at 146.29 area. Cryptocurrency is far from the Ichimoku cloud now signaling bears are dominating the market for the moment. If LTC/USD stays below the descending trend line, the currency pair will confirm its midterm downside tendency. https://cryptocomes.com/sites/default/files/inline-images/image4_11.05.jpg The currency pair still stays within the Ichimoku cloud on the daily chart and seems to aim the lower border of the formation at midterm. There are no clear signals currently and we advise to midterm and long-term traders to wait until the price finds support and demonstrates any signal in order to open positions. Check more details on XMR/USD and NEO/USD pairs HERE (https://cryptocomes.com/bears-regained-crypto-markets-control-midterm-outlook-for-bitcoin-litecoin-monero-neo-negative) and also post review HERE (https://cryptocomes.com/pricewise) Title: Re: Daily price analysis BTC + ALTCOINS Post by: Dany44 on May 14, 2018, 08:00:52 AM 05/14/18 Bullish Hopes Are Broken Again As Bitcoin, Litecoin, Monero And NEO Decline on Monday
https://cryptocomes.com/sites/default/files/styles/912x570/public/2018-05/bear_1.jpg?itok=Zzo7QBwu Weekend bullish scenario seems to end up as the currency pairs move downwards Bullish scenario progressed on weekend after a true fiasco on Friday as all the reviewed currency pairs declined significantly, establishing new local lows. However, the situation has changed on Saturday as all the reviewed currency pairs were able to move higher and to form a kind of an uptrend. On Monday we see the contrary picture as all the allies go downwards, breaking levels and trend lines. It seems like bears want to remind bulls who is in control of the markets currently. BTC/USD https://cryptocomes.com/sites/default/files/inline-images/image1_14.05.jpg Bitcoin has broken through the short term descending trend line on Friday and retested it later. Then BTC/USD jumped off this trend line and started to grow slowly with wide range fluctuations allowing to earn both bulls and bears. We have drawn an ascending trading line, which supported the price during the weekend. The currency pair entered the Ichimoku cloud on Sunday and even reached its upper border. Bitcoin has tested it and the resistance level at 8 694. Later, bears have taken control again and pushed the currency pair lower for another correction. Bitcoin has tested the ascending trend line and crossed it meaning the end of this short-term upside tendency. It has also broken through the support line at 8,528 area. The currency pair has reached the next support line at 8,372 are in the moment of writing. Bears make attempts to cross it. There are two scenarios here. The first one means BTC price will jump off this 8,372 support line area and reverses towards the resistance area at 8 528. However, bulls will have to deal with another obstacle- the lower border of the Ichimoku cloud. If successful, they will be able to test the resistance. The other scenario for Bitcoin is the breakout of the current support area at 8,372 with the development of local downtrend. https://cryptocomes.com/sites/default/files/inline-images/image2_14.05.jpg Lets have a look at the daily chart. Here the situation remains unchanged as the price stays still within the Ichimoku cloud in the middle of the formation. Bulls were trying to counterattack but in the moment of writing the candlestick bearish. It is better to wait until it forms to make any conclusions. LTC/USD https://cryptocomes.com/sites/default/files/inline-images/image3_14.05.jpg Litecoin follows Bitcoin as the price has crossed the descending trend line on Saturday and then went slightly upwards along a new local ascending trend line that we have drawn recently. LTC/USD managed to cross the upper border of the Ichimoku cloud unlike Bitcoin but then started to decline. Litecoin has broken through the ascending trend line recently and is testing the support area at 138. Litecoin price shifted even lower this line but returned above later meaning the breakout was false. LTC price resides below the Ichimoku cloud as bears control the market for the moment. There are two possible scenarios here. Litecoin will reject the support area and go through the Ichimoku cloud (which is thin here) to test the local ascending trend line from below and then to reach the resistance area at 147. If LTC/USD fails to jump off the support area, it is able to develop the downtrend towards Fridays lows and the midterm descending trend line. https://cryptocomes.com/sites/default/files/inline-images/image4_14.05.jpg As for the daily chart, Litecoin has reached the lower border of the Ichimoku cloud and jumped off it meaning there is an opportunity for bulls to gain initiative. However, it is better to wait until todays candlestick forms as it is bearish now. Check more details on XMR/USD and NEO/USD pairs HERE (https://cryptocomes.com/bullish-hopes-are-broken-again-as-bitcoin-litecoin-monero-and-neo-decline-on-monday) and also post review HERE (https://cryptocomes.com/pricewise) Title: Re: Daily price analysis BTC + ALTCOINS Post by: Dany44 on May 15, 2018, 08:21:51 AM 05/15/18 Bitcoin, Litecoin, Monero, NEO Prepare For Significant Moves as Bears Try Holding Prices Down
https://cryptocomes.com/sites/default/files/styles/912x570/public/2018-05/bear_7.jpg?itok=fTNgLhiH Cryptocurrencies are consolidating as significant fluctuations expected The situation remains unchanged since our last review as the currency pairs volatility is low. BTC/USD, LTC/USD, XMR/USD, NEO/USD restored yesterday but failed to develop their progress as bears still make attempts to hold the price and to push it down. BTC/USD https://lh6.googleusercontent.com/mrlciQacz2bexY_xbxItGD9MkPeUsVDZFZ574Qv014c_UPdbF_xmU8G-CqeDwOShRMw9K9X5C6lUkF6HPePL4Hsu930jsO0N_-_OUMacKHpYtKfC9ZaVQiV4umkmS66mccs5zdq5w-k Bitcoin demonstrated no significant fluctuations during the late American and Asian session. The currency pair jumped above the local ascending trend line within the American session and tested it later. Here lies the support area at $8,695 which also holds BTC/USD from declining below. Bitcoin reached the resistance area at $8,890 during the late US-Asian session. However, the Bitcoin price retreated sharply meaning bulls have not enough power to develop their progress. The currency pair is higher the Ichimoku cloud meaning bulls have the initiative in the moment of writing this review. There are no candlestick signals currently and it is better to wait for them in order to take further actions. Possible scenarios for BTC/USD are the following: 1. Bitcoin will try to jump off the ascending trend line and the support area at 8,695 targeting the next resistance area 8,890, which the cryptocurrency reached during the late American session. There may be another test. 2. BTC/USD will cross the support area at 8,695 and fall towards the higher border of the Ichimoku cloud. The next target, in this case, will be the support area at 8,528. However, the Ichimoku cloud may be an obstacle on the way. 3. The next scenario is neutral meaning there will be no significant fluctuations. And BTC price will stay close to current levels or move along the local ascending trend line without leaving it. https://lh6.googleusercontent.com/KJJZoxJ1E0hf_M1zRo5vRUtgesHkvEk1Yew2CqUR-OlBJkc2_KGg_ZtJbFGYPHjq2rIFdWwsHOiAjvacdHPJ73-xbKDwHZrpiCBZF6M2krmd2CeOpAB4_fQ71MP1DClOja8efgYiZ3Y BTC/USD still remains inside the Ichimoku cloud and goes towards the upper border of the formation. It seems like the situation is going to change in the nearest future. If Bitcoin leaves the Ichimoku cloud from above, there may be a sharp upside momentum. LTC/USD https://lh3.googleusercontent.com/jXU2MlDMdxm7ZXMgj_zO5NQPEt3p8k8HLeEFfHEqgJdYFGZrRPl_TtUtsgNwxPgEnI4D65hlPxdQED_GEu1hCfoSr-FkUox_X7qIdMWh3Kiqag-BUeHaQoRNLv2PPV8qUOWEJloyp98 Litecoin went above the ascending shorterm trend line during the late American-Asian session but failed to develop its progress. LTC price almost reached the resistance area at 153 level but then we have seen a Shooting Star reverse candlestick pattern. Litecoin returned to 146 support area where it fluctuated until the moment of writing this review. Litecoin price is above the Ichimoku cloud meaning bulls have initiative currently. There is no candlestick pattern at the moment. Possible scenarios for LTC/USD are the following: 1. LTC price will target the resistance area at 153 and reach it. Then, LTC/USD will test it and further progress will depend on the results of those actions. 2. Litecoin will jump off the resistance area at 146 (where it fluctuates currently) and fall towards the support area at 138. However, there is the Ichimoku cloud on the way, which may prevent bears from pushing LTC/USD lower. 3. LTC price remains close to the current levels or move slowly around the local ascending trend line. https://lh5.googleusercontent.com/hj9IPWrOXOxmsPFxSbObr7XX-21D-5HrPZUdZ-sJ_MHFNiElcpqD3B1WJCS2oTRWm6oM2RKX4k_bRKaP09xWyr_rXmtVBA8oj-HyNCwL7L-E9vlXhjRkidAXf41TAtrhob-Cl-sm-2g As for the daily chart, the situation is the same as yesterday. Litecoin price remains within the Ichimoku cloud. But it jumped off the lower side of the formation meaning there are chances for bulls to drive it towards the upper border of the Ichimoku could at least. Check more details on XMR/USD and NEO/USD pairs HERE (https://cryptocomes.com/bitcoin-litecoin-monero-neo-prepare-for-significant-moves-as-bears-try-holding-prices-down) and also post review HERE (https://cryptocomes.com/pricewise) Title: Re: Daily price analysis BTC + ALTCOINS Post by: Dany44 on May 16, 2018, 03:04:20 PM 05/16/18 Zcash Leader of the Day, Other Cryptos Lose Momentum
https://cryptocomes.com/sites/default/files/styles/912x570/public/2018-05/smile_1.jpg?itok=6a_y0ZqN Zcash is up, Bitcoin, Ethereum hang on while Bytecoin, Bitcoin Cash, Stellar, NEO drop Cryptocurrencies from Top 20 market capitalization show negative dynamics as a whole except Zcash, who is the true winner in the past 48 hours. Zcash will be listed at Gemini exchange (https://cryptocomes.com/zcash-booming-on-back-of-winklevoss-support-as-need-for-privacy-soars) (the brainchild of twin Winklevoss) as the company received the appropriate approval from NYSDFS. The cryptocurrency surged significantly following this event on Monday. Gemini became the first exchange to accept Zcash as an asset for trading. Winklevoss brothers think that Zcash is promising due to its privacy, which is the main advantage of the cryptocurrency as compared to Bitcoin. ZEC/USDs price increased by 47 percent on Monday. The cryptocurrency still develops its progress as it added another 2.34 percent in the moment of writing. Meanwhile, all top 20 cryptocurrencies declined. Bitcoin has lost 5.65 percent in the past 24 hours. Ethereum suffered almost the same losses as the price declined 5.22 percent in the same period. Bytecoin is the loser of the day as it declined for 11.71 percent in the past 24 hours. The general fundamental background seems to be positive as police found nothing wrong during its investigation at Upbit exchange. It should be reminded that South Korean police had a raid at Upbit headquarters last week (https://cryptocomes.com/audit-reveals-no-wrongdoing-by-south-korean-crypto-exchange-upbit). This event resulted in a sharp decline of nearly $50 mln in market capitalization as investors had fears about the exchanges activities. The most important event currently is the Consensus 2018 Conference (https://cryptocomes.com/consensus-watch-whos-saying-what-at-consensus-2018), which attracted not only Blockchain experts and adopters, but also some officials including the Head of St.Louis Federal Reserve James Bullard. The Conference has not been without sensations as Vitalik Buterin refused to participate there. Those events seem to have no significant influence on fluctuations currently. However, they may affect prices later. ZEC/USD https://lh3.googleusercontent.com/GX7BWSik4GAEtdx5VOEcMQAPov1_4BKFrTbMCdEyskByKdKTwm-5KSz4Mp3hhys2gqCaMNoAYjajLc8UUwHZ4mSKp0ET6inNAWcDR8H0prjOR2ipWzee0A0wq6s3nHmYP9SJwkE6rmoARiKWzg Zcash has reached its all-time highs on Tuesday as ZEC price almost touched the 390 level. Then, we had a correction towards the support area at 325. The volatility is still very high as many market participants are interested in this coin. Technically, ZEC price is testing the resistance area at 366 in the moment of writing this review. Depending on the results, ZEC/USD may have the following possible scenarios: 1. ZEC price will break through the resistance line and go higher, establishing new all-time highs. 2. Zcash will start to decline towards the support area at 325. However, there are two obstacles on the way the Ichimoku clouds higher border and the ascending trend line. 3. ZEC/USD will stay at the same levels without significant fluctuations. https://lh3.googleusercontent.com/Cmw7dcH8HIAKszcyolHsGf1v8DJjwyyejIfjbixYqwale7V1QxPqbzmThq4UJsTofCTkZfWW7xP7b9lN34oHKeFZ9H1-QTu2SEVYs8Op9zbQjamk6iNXrJbAV0VEQzXVoTHgsXeszpKrbqgNNg As for the daily chart, ZEC/USD looks pretty good there as ZEC price has left the Ichimoku cloud with momentum and continues to rally. Zcash is above the ascending trend line but may correct towards it in the nearest future. BTC/USD https://lh5.googleusercontent.com/bUjp-2TYJhhVf3Of-hrWZtQO-_BJLK-Cbr9uWUhdO5ThpBbPtC_9U_-DUjwbrOBDXm1qgp2Xj-327fu18Mak64Ccnrc_1PYzCmGbOZRNx8CYcbLobfNPIH6TdlSudKTDdiml8Q0n9GnAOjwGzg Bitcoin jumped off its newly established support area at 8,130 and tested the resistance area at 8,366. BTC price is above the level at the moment of writing, but it is early to say whether BTC/USD has already crossed this level or not. There are no candlestick signals currently. Bitcoin price is far from the Ichimoku cloud but makes attempts to meet the indicator in the nearest future. The possible scenarios for BTC/USD are the following: 1. Bitcoin will cross this $8,366 area and move further upwards to the next resistance area, which lies at $8,527. 2. BTC/USD will decline from the current 8,366 level towards the newly established local lows at $8,130. 3. The currency pair will stay close to the current level without significant changes. https://lh5.googleusercontent.com/rcqXtm-Hw2BfxTTcc5oDtr9eS9ehCRqHZ0IhmsH5ofX8r4GmcTCc9_sw81s_4EppCmIBL01S6sPg4Pq6vnJQIg4Jx8Zocor6hfqKQu3oJBw7WMAd6-y0yx2Jonj3PVtHFFvVXwcPNT-pYoK-fQ Bitcoin stays within the Ichimoku cloud on the Daily chart. BTC price has almost reached the lower border of the formation and seems to have chances to change the direction. ETH/USD https://lh4.googleusercontent.com/3Lue2k2nQsYJ7_4qE1MxjZZLD_sPfn9yRXv2OPDjhOQ__Rp8mjyTTThcIX_YMr2IVd4OWr8xbB_P116kXYg7aSyfYD7rvqNgJmVle5_T8lnnMiw0RvWYw7W_tfgFEQTcRJ5ICbXzL5IwE8fDzQ Ethereum crossed the support area at 695 today, but its further decline was limited as the price managed to make a half distance to the next support area and reversed. ETH/USD crossed the 695 resistance area from below and jumped over the line, developing progress. Ethereum is close to the lower border of the Ichimoku cloud and it seems like bulls want to test it and to go higher. The possible scenarios for the currency pair are the following: 1. ETH/USD will break through the lower border of the Ichimoku cloud and move higher, towards its upper side, then test it and move towards the resistance level at 730. 2. Ethereum will decline towards the support area at 695 to test it. If successful, bears will have a chance to develop their progress towards the next support area at 663. 3. The currency pair will have no significant fluctuations and will stay close to the current levels. https://lh6.googleusercontent.com/FWSHD4rUCBbqqY04q2JHp0-mGJZoPHGolrzrZuSPY2tZYZEiZ4MmFKPESGUf7Qi9L9XBiRnWefUlnoBU9xRX3OsNjtQLmYaB5CszFFqdywPB6BISmPLwe4g47LaF56M2N8BQDohnOHowvPuGQA ETH/USD is fluctuating above the Ichimoku cloud meaning bulls are still in control of the situation on the Daily chart. However, Ethereum stays below the ascending trend line. BCN/USD https://lh5.googleusercontent.com/JZNJ7AbLCGoeWKBqOZ6RUB3YMQ8SkJqu4v3s0pBStyaa2RLuv5SyQTeF_XNtSt7sp9_cyGDnnScDei8BA4jYkMWcPQb66LvXALN1UUalerpRJKOTgxUIUCHMtuqkQcxsNoupiKH_TfhBOlySKw Bytecoin is a true loser of the day from the top 20 as it declined 11.71 percent in the past 24 hours. Nevertheless, bulls seem to take the initiative in their hands as the managed to move BCN/USD higher and the currency pair is above the descending local trend line currently. Bytecoin is above the support area at 0,0100. BCN price is below the Ichimoku cloud as well. The possible scenarios for BCN/USD are the following: 1. The currency pair will develop its progress until the next resistance area at 0.0111 where the resistance line coincides with the lower border of the Ichimoku cloud. If bulls are able to cross them both, BCN/USD will have a chance to go towards the next resistance area at 0.0124. 2. Bytecoin will reach the next resistance level at 0.0111 and jump off it (or start to decline from the current levels). The next support area is 0.0100. The currency pair will meet the descending trend line there. 3. Bytecoin will stay close to the current levels with no significant fluctuations. https://lh3.googleusercontent.com/FhiQwYV69dBbeEuhHRx2XM_ViXpnqZDQ7ieK-qoj1w9J2c7cRK99Ab17tQypm2-m6OgoM6stwPHlbvX_Z_PORHS_1mq-aYTqaIow70MzKJWj0HdZ0LpJHKT21AkfwwMlbrliZ2icEBYY9Ejqug Bytecoin is above the ascending trend line as bulls are still in control of the situation. However, BCN/USD arouse the suspicions as its fluctuations currently are similar to Pump&Dump strategy. Check more details on BCH/USD, XLM/USD and NEO/USD pairs HERE (https://cryptocomes.com/zcash-leader-of-the-day-other-cryptos-lose-momentum) Title: Re: Daily price analysis BTC + ALTCOINS Post by: Dany44 on May 17, 2018, 03:05:54 PM 05/17/18 EOS and Tron Are Leaders, Bitcoin, Ethereum in Green Area
https://cryptocomes.com/sites/default/files/styles/912x570/public/2018-05/crypto%20speed.jpg?itok=fd3SWNVu EOS and TRON are the winners of the day, Bitcoin, Ethereum, Zcash also look positive as they mostly grow The top 20 looks much better today as almost all cryptos are within the green area. The leaders of the day are EOS and Tron as they have added nearly seven percent for the past 24 hours. Bitcoin and Ethereum have added 0.53 percent and 1.33 percent consequently. The general atmosphere seems to be positive today as almost all coins are in the green. As for the fundamental background, it is neutral today. Several interesting events may attract traders and investors interest. The Consensus 2018 Conference (https://cryptocomes.com/consensus-watch-whos-saying-what-at-consensus-2018) is still holding. Krakens co-founder Jesse Powell said that they are going to register with the SEC (US markets watchdog). He stated that Kraken is going to receive a license as a broker-dealer. Another event to pay attention to is the ongoing debate around cryptocurrencies status in the Russian Federation (https://cryptocomes.com/russias-digital-law-bill-not-aimed-at-legalizing-crypto-payments). The appropriate law was introduced to parliament a month ago. However, local media suggests that there will be no crypto legalization. The main goal of the bill is to establish a legal basis for digital transactions and rights. BTC/USD https://lh6.googleusercontent.com/HaUpa_ekTL55F8Z6VacsAd057pYvYwDVgJ7vY7FshiFSv1zGQlJODmahUCZ5NVHdSxyLXFYyZI6JEc-AqDoQ9Np7pYaal-ebdU0pr7JeK1zHo1L_SOVf8dx7Ue2xna4ou5AbUiqhG-A Bitcoin has tested the support area at $8,128 yesterday again and jumped off the level. BTC price went towards the resistance area at $8,365 and tested it. There were several attempts to break it through and to move higher. BTC/USD has even tested the lower border of the Ichimoku cloud but failed to penetrate inside the formation. Bitcoin stays below the $8,365 resistance area currently and seems to aim the support area at $8,128. The possible scenarios for BTC/USD are the following: 1. The currency pair will reach the support area at $8,128 and will test it. BTC/USD will develop its downside progress or jump off this area, depending on the results of testing. 2. BTC/USD will start to grow from current levels and reach the resistance area at $8,365. BTC price will jump over the resistance area and develop its upside tendency or will jump off this level and reverse. 3. Bitcoin is also able to stay without significant changes close to the current levels. https://lh6.googleusercontent.com/rP-5CcDCsxsmWXpQSW5twvexENfKgAA7C51V7n5LirQvr3CSDA9lcWIKi1xpfWuMQ8eg9Bq-a1kH-9Nopm2IRL7TNUsqJ6cddmBERoDu7kBEjUj0ydkIJRAY1UTdWS0p2qpUvFwCw-c As for the daily chart, there are no significant changes in the situation as BTC/USD still stays within the Ichimoku cloud. ETH/USD https://lh5.googleusercontent.com/hLv_PB3I778FCBlc3Q7b3C6aLROKb_EXWFbbH_ehHeq5108c28l0k8OPcTn-dfpThq9TwrvNQY9F6hPbcKLoTNWknUxEg5aUKsInSk4h3nZn52KSOGN8wPAwxwiqtDTRUelnGUkEPp8 Ethereum is above the support area at $695 and is testing the lower border of the Ichimoku cloud currently. ETH/USD fluctuated below this area yesterday, but bulls have managed to cross it. ETH price established new local highs there, but refused to go higher and went to test the support area at $695. The possible scenarios for the currency pair are the following: 1. Ethereum will break through the Ichimoku cloud aiming at the closest resistance area at $730. However, bulls will have an obstacle on their way meaning they have to overcome the higher border of the Ichimoku cloud in order to reach their next goals. 2. EHT/USD will test the support area at $695 and jump over it. Bears will have an opportunity to push the currency pair even lower, towards the next support area at $663. 3. ETH price will stay without significant changes close to the current levels. https://lh6.googleusercontent.com/iRirhH2HA3eygufMjUMrE3_hpjTyZTckLnj31pVweRcmqpossKgXz7PIyeiMZBVIf9TYdL-4RhL9mQFxuF85MUg5CObPlwDH-_61AW-dH6H7FIOfyIxpqJS2pQFSsvJ4yKt5HPWc1cg As for the daily chart, Ethereum stays above the Ichimoku cloud, meaning bulls are still in control of the situation. However, there is no local tendency here as ETH price establishes new highs or lows. EOS/USD https://lh4.googleusercontent.com/RvhizqkhW5lvXu-o-J8Pu71JkNYuW5dSNle0XqdimPf-4XmucEZgeFM7HNmADmjO2MVnUIK4bjXGanrSayQq2DW3ITjNP0133p8OrNnMg4h1couHhos5lMD_y0erc0FhHAgpdSWh8JM EOS is one of todays leaders as it added nearly seven percent for the past 24 hours. The currency pair started from the support area at $11.98 and went sharply upwards, breaking through the resistance and the Ichimoku cloud. However, after a strong local upside tendency, EOS/USD seems to have a pretty deep correction. The currency pair is testing the higher border of the Ichimoku cloud, which coincides with the current support area at $13.05. The possible scenarios for EOS are the following: 1. The currency pair will jump off the support area at $13.05 and go towards the next resistance area at $14.23. There, EOS price is able to both break through the level of jump off the resistance line depending on the results of testing. 2. EOS/USD will break through the support area and start to decline towards the next support area at $11.98. There is one obstacle on the way in this case the lower border of the Ichimoku cloud. 3. EOS price will stay close to the current level ($13.05) without any significant changes. https://lh6.googleusercontent.com/wqbRp7XW-VaYn1q3Vb5sl2aFxtBfet4rW_8jsnL74dR5VDmx2VpEniyTrbZ8IqVPYEz8T8YDUIxbpG0klb7xi5Yg_QtqL8S0_IuSU3H_x_4pUnUhPBmVtlu2uamd6-UpfNQuEaRmdJo As for the daily chart, EOS stays within the range, limited between the two levels- $11.71 and $16.23. EOS price is close to the Ichimoku cloud. However, the formation is thin here and do not play a significant role as an indicator. TRON/USD https://lh5.googleusercontent.com/j7p0FCcJVkRNs0Qg4O66WrUbVau9rMW5pNDE4Qm666us_ZS9j7RK83Psh2kaZrA-jkEQxQtDOFIZt8IVJGQ-km8hjZLCQZOnjIylRAifeBNS3nJ12morK020_wi5r8jC7q_MaJt09gg Tron is another leader for today as it adds about seven percent for the past 24 hours. The currency pair started from the support area at $0.063 yesterday and managed to cross the resistance area at $0.068 and the Ichimoku cloud. Tron price has almost reached the next resistance area at $0.074, but bulls were unable to drive TRON/USD there and retreated. Tron is currently testing the support area at $0.063 and the higher border of the Ichimoku cloud with is close to the current levels. The possible scenarios for the currency pair are the following: 1. TRON/USD will jump off this support area at $0.068 and go towards the next resistance area at $0.074. There everything will depend on the results of testing. 2. The currency pair will break through the support line here and start to decline towards the next support area at $0.063. However, bears will have to cross the Ichimoku cloud in order to reach their targets. 3. Tron will stay close to the current levels without significant changes and with low volatility. https://lh3.googleusercontent.com/pd5Nr6pnvL1FcYfyr0Mm21C6h-tS340LF17vRjKnbD-kFP9WpQzTLcaJQrY7-amNA2I1WS6JMhmJyKU5kGjp_1pbfl2TwxPf5srTCLg-EYn-PtCUONzcLxnEnNdZNBATY1qR3xAY_z8 As for the daily chart, Tron fluctuates inside a horizontal channel, formed by two levels- $0.070 as resistance and $0.055 as a support area. Tron price is not far from the Ichimoku cloud and is likely to meet it in a couple of weeks or even earlier. Check more details on ZEC/USD, XRP/USD and LTC/USD pairs HERE (https://cryptocomes.com/eos-and-tron-are-leaders-bitcoin-ethereum-in-green-area) Title: Re: Daily price analysis BTC + ALTCOINS Post by: Pokemoon on May 17, 2018, 08:17:58 PM The market has been hinting at recuperation over the most recent couple of days, and you have seen that bitcoin and altcoin costs have been expanding relentlessly lately and are hinting at change. As indicated by my investigation, the bitcoin cost will presumably proceed to rise and reach $ 11000 in the coming days.
Title: Re: Daily price analysis BTC + ALTCOINS Post by: Dany44 on May 18, 2018, 09:32:35 AM The market has been hinting at recuperation over the most recent couple of days, and you have seen that bitcoin and altcoin costs have been expanding relentlessly lately and are hinting at change. As indicated by my investigation, the bitcoin cost will presumably proceed to rise and reach $ 11000 in the coming days. Sounds really good if so! Title: Re: Daily price analysis BTC + ALTCOINS Post by: Dwarf42 on May 18, 2018, 09:59:22 AM Here will be the latest price analysis for BTC and altcoins. You can see that bitocin prices in recent days are constantly falling sharply, now reaching the $ 7900 level and as I see, after this milestone bitcoin price will rise again. That's why you can start to buy bitcoin and goo altcoin at this time. Make the plan as accurate and follow the discipline as you plan it. I am sure you will succeed.We appreciate your opinion. Daily reviews are also placed on https://cryptocomes.com/pricewise (https://cryptocomes.com/pricewise) https://i.imgur.com/CuYXzTr.png (https://cryptocomes.com/pricewise) Title: Re: Daily price analysis BTC + ALTCOINS Post by: Dany44 on May 18, 2018, 12:39:12 PM Sure, let's stay optimistic ;D
Title: Re: Daily price analysis BTC + ALTCOINS Post by: Dany44 on May 18, 2018, 02:11:21 PM 05/18/18 IOTA, DASH Biggest Losers of Day As Bitcoin Price Sinks Under $8,000
https://cryptocomes.com/sites/default/files/styles/912x570/public/2018-05/price%20all.jpg?itok=3ALBqrB5 Cryptocurrency market suffered losses, the greatest losers are IOTA and DASH; BTC dips below $8,000 The top 20 cryptos are within the red area today. The losers of the day are IOTA and Dash as they have declined by 7.62 percent and 7.12 percent consequently. The others demonstrate negative tendencies as well. As for the fundamental background, it remains neutral. There are some interesting news, that may attract investors attention. South Korean Customs Service is going to apply a Blockchain system to check all kind of shipments (https://cryptocomes.com/south-korea-tests-blockchain-based-customs-platform). This software is under testing currently. In order to develop the system, South Korean Customer Service has employed companies from Singapore and Vietnam. Another important news comes from Bitfine (https://cryptocomes.com/bitfinex-demands-tax-info-that-can-circulate-to-other-countrys-tax-authorities)x. They have announced that users will be required to provide their tax information. The received data will be transferred to British Virgin Islands. The problem here is that this statistics may become available for clients countrys tax authorities later. BTC/USD https://lh5.googleusercontent.com/CvAFOa_qacxYYzi41RSEF0khRF5Hry6KQelnpiE8Y8HuxaasXf0DI3C-aUKtOpD2oqg1PkRk81xtdQFkqcwMNhige76HCjKW1Dob-oTDAy-3B3gEazZCYNyNXbI9C0_V2Xrbpc52EFq1s49RMg Bitcoin established new local lows on the Hourly chart yesterday. However, bears were unable to develop their progress as a correction started from the support area at $7,941. BTC price has tested this area twice and jump off it, aiming the closes resistance area at $8,128. BTC/USD stays here currently and tests this level from below. Bitcoin price is far below the Ichimoku cloud meaning bears are domination the market. We have drawn a local descending trend line, which prevents Bitcoin from moving higher in the moment of writing. The currency pair has lost 1.98 percent in the past 24 hours. The possible scenarios for the currency pair are the following: 1. Bitcoin will break through the resistance area at $8,128 and continue to grow towards the next resistance area at $8,366. However, bulls will have to enter the Ichimoku cloud in order to reach the next goals. 2. BTC/USD will jump off the current resistance area at $8,128. The currency pair will likely to decline towards the next support area at $7,941. 3. The currency pair will stay close to the current level without significant changes. https://lh3.googleusercontent.com/mbfHEY8n75_nD9EhqjSDXCfkKVKlZ8IEXaP9hTF23yqauf4xOZPgWukeyvForbwbU2bnRQtg_E2X8YHYqycmDnvW2xz7EkWNcLrU3uXOGpEmqmphIRFL7eK0Yg8S7uK-OHEIaKYqCDAc9hHd7A Bitcoin has almost left the Ichimoku cloud on the daily chart but there is no momentum meaning it will test the indicator again. The situation remains unclear as there are no signs of any tendency currently. LTC/USD https://lh3.googleusercontent.com/6F5KvPVAavU5MP10LEAdK8ol7TSPYx1o8F9sqfgF7Oep3JCODaR6CCqkq3RiCuZciPi0RduTJy8bA3rhFo9mv39xjJfM2OJDKZM6NZjI3K-YoplWgFXf0nrBnjJqLhGJOPm9krE7XjXD5DoySw The currency pair declined yesterday and reached new lows. Litecoin jumped off the support area at $129.41 and went towards the next resistance, which resides at $134.34. However, LTC/USD failed to reach it. Litecoin is still trying to move higher, but it seems like bears are on guard currently preventing bulls from driving the currency pair higher. Litecoin has lost 3.87% in the past 24 hours. LTC price is far below the Ichimoku cloud meaning bears are controlling the market. The possible scenarios for LTC/USD are the following: 1. LTC price will reach the next resistance area at $134.34 and to test it. There is a high probability that Litecoin will meet the descending local trend line (red) there. If successful, bulls will be able to drive LTC/USD even higher, above those lines. 2. Litecoin will move towards the closest support area at $129.41 in order to test it. If successful, bears will push the currency pair even lower. 3. There will be no significant changes and LTC price will stay close to the current levels. https://lh6.googleusercontent.com/4d68BIOoofrU1iGmEhTdSl3i57zlhiDb8EuqV6FNQVCVfe2zAYTk7ajmSR2yM9NFoleWlm5dNCOFG6xNZWt8B860JLvWSQNuCragwo-LaKPCruU6sVzi1AADxVkmlke-JA62AJf0WtEYxhdMQA Litecoin has left the Ichimoku cloud on the Daily chart but there is no momentum and the currency pair seems to test the lower border of the Ichimoku cloud in the nearest future. ETH/USD https://lh4.googleusercontent.com/PmY8Xqlv7S3DwhCm1i4mAL9_-WiBOCZd_O34MAMCl62KA0snJiYqGh9QdmYk7hp6nFIwA8NbHCDHBsGEu9ChgHyQfAunNYG2wzEyRvNSOrlCZzzSd1-LjwxKQJxX8r_9ZApIIoYrcghHmgzx1w The currency pair declined yesterday and reached the support area at $663.14. Ethereum jumped off this level and started to grow today. TETH price is somewhere in the middle between two levels currently. We have drawn a local descending trend line (red), which prevents ETH/USD from moving higher. Ethereum price is below the Ichimoku cloud meaning bears are in control of the market. Ethereum has lost 2.72 percent in the last 24 hours. The possible scenarios for ETH/USD are the following: 1. The currency pair will reach the local descending trend line and test it. If successful, buyers will be able to develop the progress and to reach the next resistance area at $695.52. 2. Ethereum will reverse towards the closest support area at $663.14. The bears will try to cross the level and to push ETH/USD lower. 3. There will be no significant changes in the next several hours. https://lh6.googleusercontent.com/ldOJs_NkC4zcETIk65U_80HI3unoai296Q5SyYh7MAwWAt9ETDAeXgt7aXO4qzClVsqSlyKFLQac9UVN2VAdWWRDFr_oHXNJNN6PLg3l1SfrgYileAwjrXbLeiZsI56XWpSJCIEeXz7pXOwfrw Ethereum still fluctuates above the Ichimoku clouds as bulls control the situation. There is no midterm trend currently as the price stays within a narrow horizontal channel. ZEC/USD https://lh3.googleusercontent.com/wmls_xw66HUbTipL7LEPwmGiQrsKpEdtezutAj0s96J_xlGWepG_XdhiOgFQV8j3umUWUl1-aa2XCQ-aT1xlWb9XNnwZp1DWYULIXZXAPnzXFDQYcWDkIUbpIwXfZZ_ss47RVnjjn-N2KTIsmQ The currency pair reached the support area at $306.71 during the Asian session. Zcash jumped off it later and moved higher. The currency pair has broken through the next resistance area at $325.54 and managed to develop its progress. Bulls seem to drive ZEC/USD towards the next resistance area at $366.51, but there is an obstacle on their way as the price is still below the lower border of the Ichimoku cloud. Zcash declined 1.90 percent in the last 24 hours. The possible scenarios for ZEC/USD are the following: 1. Zcash will cross the Ichimoku could and reach the next resistance area at $366.51. There is the local ascending trend line close to that area and ZEC/USD is able to reach it in this case. If the price jump over this line, Zcash will restore the uptrend on the hourly chart. 2. ZEC/USD will jump off the lower border of the Ichimoku cloud and move towards the closest support area at $325.54. 3. ZEC price will stay close to the current levels without significant changes. https://lh5.googleusercontent.com/UVJYJjQnqtgy6yYsPMea-8kRsOBsFxCNhTgeoduqXVUl1UnX2zSunmUe9fggAk8LiGwuvYKTfEaGC3KfNqLYmes2oAhlvz1mRSlUabQ08KmRq2nqbjZAoz3_lSL33F6zV28oslFe3iqMkHMTsQ Zcash jumped off the support area and the higher border of the Ichimoku cloud on the daily chart. However, the midterm situation still remains unclear. Check more details on IOT/USD, XRP/USD and DASH/USD pairs HERE (https://cryptocomes.com/iota-dash-biggest-losers-of-day-as-bitcoin-price-sinks-under-8000) Title: Re: Daily price analysis BTC + ALTCOINS Post by: Dany44 on May 21, 2018, 01:54:28 PM 05/21/18 Cardano, Neo Lead, BTC, BCH in Green, Zcash Losing Positions
https://cryptocomes.com/sites/default/files/styles/912x570/public/2018-05/bull_3918.JPG?itok=oET9oxK2 ADA/USD and NEO/USD are the winners of the day. Zcash is losing its position Crypto traders seem to be optimistic in the beginning of a new week as the majority top 20 coins is within the green area on Monday except Zcash, which loses momentum currently. Fundamental background is neutral as there is no important news, which is able to increase volatility or establish any tendency. BTC/USD https://cryptocomes.com/sites/default/files/inline-images/image1_21.05.jpg The currency pair took off the red local descending trend line on Friday and went upwards. Bitcoin has broken through the Ichimoku cloud and managed to move even higher. We have drawn a green ascending trend line which support the uptrend currently. BTC/USD has double tested the resistance area at $8,526 but still fluctuates below this level. BTC price is far from the Ichimoku cloud meaning bulls are controlling the market. Bitcoin added 2.49 percent in the past 24 hours. The possible scenarios for the currency pair are the following: 1. BTC/USD will test the resistance area at $8,526 again and if successful, bulls will drive the currency pair even higher above this level. The next resistance area lies at $8,715 area. 2. Bitcoin will decline towards the green ascending trend line. If bears are successful, BTC/USD will develop its downside progress towards the support area at $8,369. Otherwise, BTC price will jump off this trend line and move towards the resistance area at $8,526. 3. The currency pair will stay here, fluctuating around the current resistance area at $8,526. https://cryptocomes.com/sites/default/files/inline-images/image2_21.05.jpg As for the daily timeframe, BTC/USD jumps into the Ichimoku cloud again meaning the situation remains unclear. Nor bulls neither bears are ready to take control over the market. LTC/USD https://cryptocomes.com/sites/default/files/inline-images/image3_21.05.jpg Litecoin has added its modest 0.77 percent in the past 24 hours. However, as for the situation in general, LTC/USD seems to be more optimistic than on Friday as LTC price is above the red descending trend line and moves along the green ascending trend line. Currently, LTC/USD tests this line and has an opportunity to move below it towards the Ichimoku cloud. The possible scenarios for LTC/USD are the following: 1. Litecoin will develop its downside progress and reach the Ichimoku cloud. LTC price will likely break it through as the indicator is thin here. LTC/USD will reach the next support area at $134.36 in this case and will test this level. 2. The currency pair will return above the green ascending trend line and go even higher towards the closest resistance area at $138,35 to test it. 3. Litecoin will stay here without significant changes. https://cryptocomes.com/sites/default/files/inline-images/image4__21.05.jpg The currency pair is below the Ichimoku cloud on the daily timeframe. However, LTC price tests the lower border of the indicator. Nor bulls neither bears are in control over the market currently. ETH/USD https://cryptocomes.com/sites/default/files/inline-images/image5_21.05.jpg Ethereum follows the other allies as the price moves along the green ascending trend line. The cryptocurrency has added 0.61 percent in the past 24 hours. ETH/USD jumped off the red descending trend line on Friday and shows bullish moods since. The currency pair is far above the Ichimoku cloud meaning buyers are controlling the market. The possible scenarios for the currency pair are the following: 1. ETH/USD will develop its local downside tendency towards the higher border of the Ichimoku cloud to test it. Bears will have an opportunity to test the closest support area at $696.07 if successful. 2. Ethereum will reverse and jump over the green ascending trend line on the Hourly chart. Buyers will drive the currency pair even higher towards the closest resistance area at $731.22 in this case. 3. There will be no significant changes and the currency pair will stay close to the current levels. https://cryptocomes.com/sites/default/files/inline-images/image6_21.05.jpg As for the daily chart, there are no significant events to discuss here. However, ETH price remains above the Ichimoku cloud meaning buyers are dominating the market. XRP/USD https://cryptocomes.com/sites/default/files/inline-images/image7_21.05.jpg Ripple has added nearly two percent in the past 24 hours and seems to be optimistic in the beginning of a new week XRP/USD jumped over the red descending trend line on Friday and started to move along a new ascending trend line aspiring to develop an upside tendency. XRP price is far above the Ichimoku cloud meaning buyers are controlling the market. The possible scenarios for XRP/USD are the following: 1. The currency pair will break through the green ascending trend line and move towards the higher border of the Ichimoku cloud. Once bears are successful in crossing it, they will be given a chance to develop their progress targeting the closest support area at $0.6631. 2. XRP/USD will jump off the green ascending trend line and go higher. The closest resistance area is close to the prices current position and it will likely be crossed with no difficulties. The next target will be at the next resistance area at $0.7094. 3. Ripple will stay close to the current levels with no significant changes. https://cryptocomes.com/sites/default/files/inline-images/image8__21.05.jpg As for the daily chart, XRP/USD goes under the Ichimoku cloud, but there is no clear med term tendency currently. Check more details on ZEC/USD, ADA/USD and NEO/USD pairs HERE (https://cryptocomes.com/cardano-neo-lead-btc-bch-in-green-zcash-losing-positions) Title: Re: Daily price analysis BTC + ALTCOINS Post by: Dany44 on May 22, 2018, 01:52:25 PM 05/22/18 Bitcoin, Ethereum, Ripple, Litecoin Bearish, Lisk Smashed Down
https://cryptocomes.com/sites/default/files/styles/912x570/public/2018-05/photo_2018-05-22_15-49-04.jpg?itok=GqZfyW6L (https://cryptocomes.com/bitcoin-ethereum-ripple-litecoin-bearish-lisk-smashed-down) The main four feels negative today as BTC/USD, ETH/USD, XRP/USD and LTC/USD lose nearly 2-4% The currency pairs are red as top 20 cryptos have bearish moods today. The main loser for today is Lisk, which has lost nearly eight percent in the past 24 hours. The fundamental background is neutral as there is no events to influence the quotes significantly. However, general bearish moods may be explained by the investors disappointment with the results of Consensus 2018 Conference. BTC/USD https://cryptocomes.com/sites/default/files/inline-images/btc%20hourly_0.jpg Bitcoin has lost nearly three percent in the past 24 hours. The currency pair, in general, seems to hold its downside tendency despite the fact that it demonstrates signs of a deep correction currently. We have redrawn the red descending midterm trend line as the situation changes all the time. Lets have a look at the situation within the Fibo retracement formation. https://cryptocomes.com/sites/default/files/inline-images/btc%20hourly%201.jpg BTC price jumped off $8,559 area (resistance) and moved lower, breaking through several Fibo and support levels. The ascending green trendline was crossed without any difficulties meaning bulls had no power to hold this upside tendency. BTC/USD continues to fall as it has broken through the next support area at $8,380 and approached the closest support area at $8,184. The possible scenarios for Bitcoin are the following: 1. BTC price will develop its downside progress and reach the support area at $8,184. It coincides with the Fibonacci retracement 0.618 level. If sellers successfully test this support, Bitcoin price will likely to fall even deeper towards the next retracement level (0.786). 2. Bitcoin will start to grow from the current level or from the closest support area at $8,184 targeting the closest 0.5 retracement level. If buyers are successful, they will have a chance to drive the currency pair even higher, towards the next 0.382 retracement level at least. The next resistance target is at the $8,380 area. 3. There will be no significant changes in price and BTC/USD will stay close to the current levels. ETH/USD https://cryptocomes.com/sites/default/files/inline-images/eth%20hourly.jpg Ethereum still holds bearish moods in the midterm. ETH/USD has lost nearly four percent in the past 24 hours. ETH price is above the midterm red descending trend line, but is not far from it. ETH/USD seems to have a deeper correction to the global midterm downside tendency. Ethereum price will fall even deeper this correction will be confirmed. https://cryptocomes.com/sites/default/files/inline-images/eth%20hourly%201.jpg Lets have a closer look at what is happening within the Fibonacci retracement indicator. ETH price is close to 0.5 retracement level currently. It has broken through several retracements and important levels including the green ascending trend line as buyers had no power to hold the uptrend. Ethereum price has also crossed two levels- $715.92 and $696.74. ETH/USD fluctuates close to the 0.5 retracement level in the moment of writing. The possible scenarios for ETH/USD are the following: 1. Ethereum will jump off the 0.5 retracement level and run towards the closest retracement support at 0.618. If successful, sellers will have an opportunity to push ETH/USD even deeper towards the closest support area at $677.06. In the event that they are able to break through this level, sellers will likely to push the currency pair towards $660.85 support area, which coincides with one retracement level. 2. ETH price will jump over 0.5 retracement level and run towards the next closest resistance area at $696.74. If successful there, bulls will have an opportunity to drive ETH/USD further upside towards 0.236 retracement area. 3. The currency pair will fluctuate close to the current levels without significant changes. XRP/USD https://cryptocomes.com/sites/default/files/inline-images/xrp%20hourly_0.jpg The currency pair has lost nearly three percent in the past 24 hours. It seems that XRP/USD has ended its midterm downside tendency as it fluctuates with no clear direction currently. Ripple has left the red descending trend line and the green ascending one. XRP price seems to stay within a horizontal channel in the moment of writing. https://cryptocomes.com/sites/default/files/inline-images/xrp%20hourly%201.jpg Lets see closer what is happening inside the Fibonacci retracement. XRP price is close to 0.618 retracement in the moment of writing and seems to jump off this level. The closest support area is at $0.6608. Ripple has broken the support area at $0.6914 and several retracement levels since it has ended is upside correction to the bigger midterm downtrend. The possible scenarios for XRP/USD are the following: 1. The currency pair will run towards the closest support area at $0.6608, which coincides with 0.768 Fibonacci retracement level and test those areas. If successful, bears will be able to push XRP/USD even lower, towards the next retracement level at least. The next closest support is at $0.6428. 2. Ripple will run towards the 0.618 retracement level again. This one will be tested and if successful, bulls will have an opportunity to drive XRP/USD even higher towards 0.5 and 0.382 retracements. The closest resistance level lies at $0.6914 and coincides with 0.236 retracement area. 3. There will be no significant price changes in the nearest future and the currency pair will stay close to the current levels. Check more details on LTC/USD and LSK/USD pairs HERE (https://cryptocomes.com/bitcoin-ethereum-ripple-litecoin-bearish-lisk-smashed-down) Title: Re: Daily price analysis BTC + ALTCOINS Post by: Dany44 on May 23, 2018, 01:55:13 PM 05/23/18 Bulls Frustrated as Bitcoin, Ethereum, Ripple, Litecoin in Red, Bytecoin Days Loser
https://cryptocomes.com/sites/default/files/styles/912x570/public/2018-05/bull_sad.jpg?itok=mrKAzzxT The majors suffer significant losses, Bytecoin is the loser of Wednesday Sellers seem to regain initiative as the majors suffer significant losses. Bitcoin has lost nearly five percent in the past 24 hours. The loser of today is Bytecoin, as the cryptocurrency has lost more than 17 percent in the past 24 hours. The fundamental background is neutral, however, some events may push the currencies further downside. One of the most important news for today is the launch of Operation Crypto Sweep (https://cryptocomes.com/us-canada-and-china-crack-down-on-ico-and-crypto-fraud) in US and Canada, which aims to prevent ICO frauds. The main tool of this operation is education meaning governments are going to provide citizens with information about scams, which may lead investors to losses. The similar operation is launched in China as well. Beijing was the first to ban ICOs. The local IFCERT (National Internet Financial Risk Analysis Technology Platform) is looking for scams and has uncovered more than 400 ICO frauds already. As for neutral news, the whole crypto community celebrates a so-called Bitcoin Pizza Day (https://cryptocomes.com/bitcoin-pizza-day-celebrated-around-the-world). This is a historical date for all BTC users as on May 22, 2010 programmer Laszlo Hanyecz bought two pizzas using Bitcoins. BTC/USD https://cryptocomes.com/sites/default/files/inline-images/btc%20hourly_1_23.05.jpg The general picture on the hourly chart demonstrates that sellers still have control of the situation. BTC price is close to the midterm descending trend line. BTC/USD is likely to develop its downside progress in the midterm as there are no signs of a global reverse. The currency pair establishes new local lows. The correction towards the higher border of the Fibonacci retracement seems to be ended. https://cryptocomes.com/sites/default/files/inline-images/btc%20hourly_2_23.05.jpg Lets have a closer look at what is going on within the Fibonacci retracement indicator. Bitcoin price has chosen a bearish scenario and declined below the one retracement level. Bitcoin has lost nearly five percent in the past 24 hours. The currency pair is below the midterm descending trend line meaning sellers have full control over the market. The possible scenarios for BTC/USD are the following: 1. Bullish scenario (nearly 60 percent probability). The currency pair will run upwards to test the descending midterm trend line and higher, towards one retracement level, which coincides with the support area at $7,948. If successful, bulls will be able to drive BTC/USD even higher towards the next 0.786 retracement level and the closest resistance area at $8.137. 2. Bearish scenario (nearly 30 percent probability). The currency pair will resume declining from current level or after testing the red midterm descending trend line. The closest target is the support area at $7,816. The next will be 1.618 retracement level. However, we will have another support area at $7,739 on the way. 3. Neutral scenario (nearly 10% of probability). There will be no significant changes in price today and BTC price will stay close to the current levels. The first bullish scenario means a deeper correction that is likely to happen as Bitcoin has suffered significant losses in the past 24 hours. ETH/USD https://cryptocomes.com/sites/default/files/inline-images/eth%20hourly3_23.05.jpg Ethereum has lost over ten percent in the past 24 hours. The currency pair holds bearish moods in midterm as ETH price is below the midterm descending trend line (red). There was an upside correction, but ETH/USD seems to resume its downtrend as the currency pair establishes new local lows. https://cryptocomes.com/sites/default/files/inline-images/eth%20hourly%204_23.05.jpg Lets have a closer look at the situation within the Fibonacci retracement indicator. The currency pair has chosen the bearish scenario on Tuesday and ETH price declined below the red descending midterm trend line and below the one retracement level. ETH/USD has tested the trend line from below but failed to break it through and jumped off it. The possible scenarios for ETH/USD are the following: 1. Bullish scenario (nearly 60% probability). The currency pair will go towards the closest one retracement level to test it. If successful, buyers will be able to drive ETH/USD towards the descending midterm trend line, which is not far from the closest resistance area at $641.43. The next resistance level will be at $664.59. 2. Bearish scenario (nearly 30% probability). The currency pair will resume its decline from current levels or the 1.618 retracement level. The closest support to break is $615.51. 3. Neutral scenario (nearly 10% probability). The currency pair will stay here without significant price changes. The bullish scenario means a deeper correction to the general downside tendency that may be seen on the hourly chart. We think that this general downside tendency is likely to progress in the nearest future. XRP/USD https://cryptocomes.com/sites/default/files/inline-images/xrp%20hourly5_23.05.jpg Ripple seems to resume its downside tendency as the currency pair is close to the red midterm descending trend line. XRP/USD has lost nearly nine percent in the past 24 hours. The currency pair has ended its upside correction as it touched $0.7022 resistance area and is likely to develop its downside progress in the nearest future. https://cryptocomes.com/sites/default/files/inline-images/xrp%20hourly%206_23.05.jpg Lets have a closer look at what is going on within the Fibonacci retracement. The currency pair has broken through one retracement level, which coincides with $0.6504 support area. It is currently testing the red midterm descending trend line from above as well as the support area at $0.6073. We are close to the 1.618 retracement level as well. The possible scenarios for XRP/USD are the following: 1. Bullish scenario (nearly 60% probability). The currency pair will jump over 1.618 retracement level and move higher towards the next resistance, which is at $0.6504. Here lies the initial point one of the Fibo retracement. 2. Bearish scenario (nearly 30% probability). The currency pair will resume its downside tendency from the current level and will test the closest support area at $0.6073 as well as the red descending trend line. 3. Neutral scenario (nearly 10% probability). Ripple will stay here without significant price changes. The bullish scenario means a deeper correction to the global midterm downside tendency which is still actual. Check more details on LTC/USD and BCN/USD pairs HERE (https://cryptocomes.com/bulls-frustrated-as-bitcoin-ethereum-ripple-litecoin-in-red-bytecoin-days-loser) Title: Re: Daily price analysis BTC + ALTCOINS Post by: Dany44 on May 24, 2018, 03:05:29 PM 05/24/18 Bitcoin, Ethereum, Ripple Are Red Again, Zcash Days Loser
https://cryptocomes.com/sites/default/files/styles/912x570/public/2018-05/smile_2.jpg?itok=Aaam9KUG Bitcoin shows no mercy for buyers and hodlers. Other cryptos follow the same scenario Nearly six percent down! This is the result of Bitcoins fluctuations in the past 24 hours. Ethereums losses were even bigger as Buterins brainchild declined by nearly nine percent. What is going on with the crypto market and why both traders and investors are unable to change the situation currently? We think that there are three main reasons for that. The first one is a generally negative mood as cryptocurrencies resemble a snowball now, rolling down a mountain. It becomes bigger and bigger and market players seem to be frustrated as they see no starting point to support coins. The second reason is as easy as ABC. The South Korean government (https://cryptocomes.com/south-korea-considers-licensing-bitcoin-exchanges) wants to get its hands on traders pockets as they want to receive information about those who conduct transactions. The fight between exchanges and the South Korean government is still on and nobody knows who is going to be a winner. Anyway, we dont think that regulators will retreat. This fact provokes fears among market players and gives bears support. Finally, the next thing we want your attention to be attracted to is the Consensus 2018 Conference (https://cryptocomes.com/consensus-watch-whos-saying-what-at-consensus-2018), which results were disappointing. If we take a look at historical data, Consensus helped Bitcoin to add nearly 70 percent during the conference and additional 138 percent two months after the event last year. However, this year the situation was different as Bitcoin went down during the event and seemed to develop this negative tendency several days after the doors of Consensus 2018 were shut down. Bitcoin (BTC/USD) price analysis 24.05 The currency pair still develops its negative midterm tendency as BTC price is below the red descending trend line. Bulls seem to be smashed down. Buyers attempted to start a correction yesterday, but it was limited by $7,739 resistance area. BTC/USD has crossed 1.618 retracement level later and established local lows. Total losses in the past 24 hours are 6.04 percent. https://cryptocomes.com/sites/default/files/inline-images/btc%20hourly_1.jpg Lets take a closer look at what is happening down there. Bitcoin has reached resistance area at $7,739 on Wednesday, but buyers failed to develop this upside correction as BTC price jumped off this area and resumed its downside tendency. BTC/USD has established new local lows at support area $7,475. Later BTC/USD developed its downside progress and the price reached new local lows. The possible scenarios for the currency pair are the following: 1. Bullish correction. BTC/USD will run towards the closest resistance area at $7,475 to test it. If successful, buyers will have an opportunity to develop Bitcoins correction targeting 1.618 retracement level. 2. Bearish scenario. Bitcoin will reach $7,475 and reverse there or will start to decline from current levels towards new local lows. Ethereum (ETH/USD) Price Analysis 24.05 https://cryptocomes.com/sites/default/files/inline-images/eth%20hourly1.jpg The currency pair started a correction on Wednesday and almost reached the closest resistance area at $615.51. However, buyers were unable to drive ETH/USD higher as bears regained control over the market. Sellers pushed Ethereum lower towards 2.618 retracement level and managed to jump over it as ETH/USD fluctuates below this line in the moment of writing. The possible scenarios for ETH/USD are the following: 1. Bearish scenario. ETH price seems to end testing 2.618 retracement level from below and is able to resume its downside tendency in the nearest future. Targets are below the long spike that we had several hours ago. 2. Bullish scenario seems to be unreal at the moment as the market is still under pressure. However, we could give around 10 to 20 percent that ETH/USD would be able to start growing from the current levels. Ripple (XRP/USD) Price Analysis 24.05 https://cryptocomes.com/sites/default/files/inline-images/xrp%20hourly2.jpg XRP/USD had a bullish correction yesterday but buyers were unable to drive the currency pair over 1.618 retracement level. XRP price declined later towards the red midterm descending trend line, but failed to cross it as well, showing nor bulls neither bears had the power to change the situation. It is a kind of horizontal channel now that you can use by catching its borders. XRP price is currently close to the resistance area at $0.6073. What are the possible scenarios for XRP/USD in the next several hours? 1. Bullish correction. The currency pair will break through the resistance area at $0.6073 and move towards the closest 1.618 retracement level. If successful, buyers may develop the correction even higher, targeting one retracement level. 2. Bearish scenario. XRP/USD will test 1.618 retracement level and reverse downwards there or start off declining from the current levels targeting 2.618 retracement level. Check more detailed charts and analysis on ADA/USD and ZEC/USD pairs HERE (https://cryptocomes.com/bitcoin-ethereum-ripple-are-red-again-zcash-days-loser) Title: Re: Daily price analysis BTC + ALTCOINS Post by: Dany44 on May 25, 2018, 01:24:13 PM Bears Tired as Bitcoin, Ethereum, Ripple in Green: Price Analysis, May 25
https://cryptocomes.com/sites/default/files/styles/912x570/public/2018-05/bear_1_0.jpg?itok=Xafr9tjD (https://cryptocomes.com/bears-tired-as-bitcoin-ethereum-ripple-in-green-price-analysis-may-25) Cryptos breathe fresh air as Bitcoin and altcoins are in green Friday Sellers seem to lose their momentum as all the majors from the top 20 feel much better today. It is still not a complete reversal as negative moods prevail the markets. However, we can see a deeper correction and even a horizontal consolidation is possible. What is going on within the crypto industry currently? The majors are still under the pressure as bulls are hesitating. However, bears seem to be tired meaning there is no clear direction currently. The disappointment from Consensus 2018 conference goes away gradually as we have several important meeting on the way including BlockShow Europe (https://cryptocomes.com/blockshow-europe-2018), which is to take place in Berlin (Germany) on May 28, 2018 as well as Blockspot Conference Latin America (https://cryptocomes.com/blockspot-conference-latin-america), which will take place in Sao Paolo on the same day. Technically, bears are still building their downtrend Great Wall and bulls seem to be unable to break it currently. Ethereum has added nearly four percent in the past 24 hours. Ripple was more modest as this crypto grew by nearly two percent. The first coin had almost no price changes in the past 24 hours. Bitcoin (BTC/USD) Price analysis, May 25 https://cryptocomes.com/sites/default/files/inline-images/btc_hourly_2.jpg (https://cryptocomes.com/bears-tired-as-bitcoin-ethereum-ripple-in-green-price-analysis-may-25) Bitcoin still holds negative moods in general and BTC price is below the red descending trend line on the hourly chart. BTC/USD went on correction yesterday and reached this trend line. However, buyers are still unable to make a difference. We think that this negative tendency is likely to prevail in general in the next several days. https://cryptocomes.com/sites/default/files/inline-images/btc_hourly_1_0.jpg (https://cryptocomes.com/bears-tired-as-bitcoin-ethereum-ripple-in-green-price-analysis-may-25) Lets have a closer look at what is happening on the hourly chart within the Fibonacci retracement graphic tool. BTC price is still below the red descending mid-term trend line. BTC/USD reached the trend line yesterday within a correction, but bulls were unable to change the situation significantly as Bitcoin goes down for the last several hours. BTC/USD has reached the closest resistance area at $7,565, which coincides with 1.618 retracement level but failed to develop its upside progress. The possible scenarios for BTC/USD are the following: 1. Orange scenario (bearish). BTC price will develop its current downside tendency without any correction. Bitcoin will likely establish new hourly local lows in this case. 2. Red scenario. (bullish correction). The currency pair is going to reach the red descending midterm trend line and jump off it. 3. Green scenario (deeper bullish correction). Bitcoin will follow the red scenario first. If buyers are successful in breaking through the red descending midterm trend line, they will be able to develop upside progress targeting 1.618 retracement level, which coincides with $7,565 resistance area. Ethereum (ETH/USD) Price Analysis, May 25 https://cryptocomes.com/sites/default/files/inline-images/eth_hourly.jpg (https://cryptocomes.com/bears-tired-as-bitcoin-ethereum-ripple-in-green-price-analysis-may-25) The currency pair is still below the red midterm descending trend line meaning sellers still control the situation. However, bulls are trying to counter-attack and to develop a correction at least. Will sellers Great Wall prevent bulls from going higher? ETH/USD has negative moods generally and this scenario seems to be impossible in short and midterm currently. https://cryptocomes.com/sites/default/files/inline-images/eth_hourly_1.jpg (https://cryptocomes.com/bears-tired-as-bitcoin-ethereum-ripple-in-green-price-analysis-may-25) Lets see what is happening within the Fibonacci retracement tool. Ethereum is testing the closest resistance area at $596.06. It had a correction on Thursday according to our expectations, but buyers were unable to go higher stopped by the red midterm descending trend line. The possible scenarios for the currency pair are the following: 1. Green scenario (deeper bullish correction). The currency pair will cross the current resistance area at $596.06 and move higher towards the red descending trend line. If successful, buyers will be able to break through this trend line and to target the closest resistance area at $626.66, which coincides with 1.618 retracement level. 2. Red scenario (bearish). The currency pair will jump off the resistance area at $596.06 and move towards the closest support area at $566.90 coinciding with 2.618 retracement level. If they test this area successfully, sellers will be able to break it though targeting new local lows, established on Wednesday. 3. Orange scenario (neutral). The currency pair will follow the red scenario until the support area at $566.90 but instead of breaking it though, ETH/USD will jump off this horizontal line targeting the resistance area at $596.06. Ripple (XRP/USD) Price Analysis, May 25 https://cryptocomes.com/sites/default/files/inline-images/xrp_hourly.jpg (https://cryptocomes.com/bears-tired-as-bitcoin-ethereum-ripple-in-green-price-analysis-may-25) Ripple is one of the few currencies that is currently above the red descending midterm trend line. XRP/USD had a correction started on Wednesday, but it was not a deep one as the currency pair still has negative moods. Midterm tendency is still downside. https://cryptocomes.com/sites/default/files/inline-images/xrp_hourly_1.jpg (https://cryptocomes.com/bears-tired-as-bitcoin-ethereum-ripple-in-green-price-analysis-may-25) Lets have a closer look at what is happening within the Fibonacci retracement graphic tool. XRP price has reached the closest resistance area at $0.6216 in the past few hours and seems to jump off it as buyers are still unable to break it through. The next possible target for XRP/USD is the closest support area at $0.5914. The possible scenarios for XRP/USD are the following: 1. Red scenario (bearish). The currency pair will fall to the closest support area at $0.5914 and break through this level aiming the next 2.618 retracement level. 2. Orange scenario (neutral). XRP/USD will follow the red scenario first, but then will jump off the closest support area at $0.5914 and move towards the closest resistance area at $0.6216, which coincides with 1.618 retracement area. Ripple will jump off those lines targeting the support area at $0.5914. 3. Green scenario (bullish correction). XRP price will follow red and orange scenarios first but will break through 1.618 retracement level, which coincides with $0.6216 targeting one retracement level coinciding with $0.6515 resistance area. Take a look at Litecoin (LTC/USD) and IOTA (MIOTA/USD) Price Analysis, May 25 (https://cryptocomes.com/bears-tired-as-bitcoin-ethereum-ripple-in-green-price-analysis-may-25) Title: Re: Daily price analysis BTC + ALTCOINS Post by: Dany44 on May 28, 2018, 02:26:36 PM Bitcoin, Ethereum, Ripple, EOS Start This New Week in Red: Price Analysis, May 28
https://cryptocomes.com/sites/default/files/styles/912x570/public/2018-05/bull%26bear_2_0.JPG?itok=vKxMtu5O (https://cryptocomes.com/bitcoin-ethereum-ripple-eos-start-this-new-week-in-red-price-analysis-may-28) Red again: cryptos start this week in negative area, establishing new local lows The cryptocurrency market is still unable to stand up after a shocking knockout. There were some positive attempts on Friday, but the price stood neutral during the weekend and started to decline on Monday. There is still no news to awake cryptos as they continue to slide down their trend lines like snakes. We have two conferences on the way- Blockchain & Bitcoin Conference Australia (https://cryptocomes.com/blockchain-bitcoin-conference-australia) as well as Bitcoin meetup (https://cryptocomes.com/bitcoin-meetup-with-presentations). The last to take place in San Francisco, US. Those events may cause some positive changes, but it is still too early to analyze them. Regardless this general negative scenario that is unfolding now in the crypto market, there is some positive news coming from different regions regarding the expansion of cryptocurrencies into the real economy. Bitcoin is now accepted by Stormy Daniels (https://cryptocomes.com/adult-website-stormydanielscom-now-accepts-cryptocurrency) adult website and may be used to pay utility bills in the Czech Republic (https://cryptocomes.com/czech-republic-utility-provider-to-accept-bitcoin). As for Ripple, this crypto is now available for Stock app users (https://cryptocomes.com/ripple-makes-its-way-into-apple-stocks-app). Bitcoin (BTC/USD) Price Analysis, May 28 https://cryptocomes.com/sites/default/files/inline-images/btc%20hourly_28.05.jpg (https://cryptocomes.com/bitcoin-ethereum-ripple-eos-start-this-new-week-in-red-price-analysis-may-28) Bitcoin is still unable to get off the ground as BTC price continues to slide down the trend line establishing new lows. There are no significant losses in the past 24 hours as BTC/USD falls less than two percent. https://cryptocomes.com/sites/default/files/inline-images/btc%20hourly%201_28.05.jpg (https://cryptocomes.com/bitcoin-ethereum-ripple-eos-start-this-new-week-in-red-price-analysis-may-28) The currency pair managed to cross the descending trend line on Friday and followed the green scenario. BTC/USD reached 1.618 retracement level, which coincides with $7,565 resistance area. However, later Bitcoin resumed declining and reached the descending trend line. The possible scenarios for BTC/USD are the following: 1. Red scenario (bearish). The currency pair will break through the support area at $7,199 and move below it developing downside tendency. 2. Orange scenario (neutral). BTC/USD will jump off the current support area at $7,199 and move upwards targeting the closest resistance area at $7,565, which coincides with 1.618 retracement level. 3. Green scenario (bullish correction). The currency pair will go towards $7,565 resistance area and break it through aiming the next resistance area at $7,949. We think that neutral scenario has more chances to develop. However, bullish correction towards $7,949 is also possible. Ethereum (ETH/USD) Price Analysis, May 28 https://cryptocomes.com/sites/default/files/inline-images/eth_28.05.jpg (https://cryptocomes.com/bitcoin-ethereum-ripple-eos-start-this-new-week-in-red-price-analysis-may-28) ETH/USD has lost over eight percent in the past 24 hours. It is still below the descending trend line meaning bears dominate the market. There is even not a single sign for future reverse as ETH price is unable to cross this midterm trend line. https://cryptocomes.com/sites/default/files/inline-images/eth_1_28.05.jpg (https://cryptocomes.com/bitcoin-ethereum-ripple-eos-start-this-new-week-in-red-price-analysis-may-28) Lets have a closer look at what is happening on the hourly chart within the Fibo retracement. ETH price jumped off 3.618 retracement level several hours ago and seems to start a bullish correction now. ETH/USD followed orange scenario and reached $596.08 resistance area. However, later the price declined towards the support area at $566.90. The possible scenarios for ETH/USD are the following: 1. Red scenario (bearish). The currency pair will go towards 3.618 retracement level and break it through. 2. Orange scenario (neutral). Ethereum will go towards the descending trend line and the closest resistance area at $566.90. Once this area reached, ETH/USD will reverse downwards. 3. Green scenario (bullish correction). The currency pair will reach 2.618 retracement level and red descending trend line, break the through and go higher aiming at the closest resistance area at $596.08. The neutral scenario has better chances to develop. Ripple (XRP/USD) Price Analysis, May 28 https://cryptocomes.com/sites/default/files/inline-images/xrp_28.05.jpg (https://cryptocomes.com/bitcoin-ethereum-ripple-eos-start-this-new-week-in-red-price-analysis-may-28) Ripple has lost nearly six percent in the past 24 hours. The currency pair is above the descending trend line, but bulls still seem to be unable to change the situation significantly as XRP price continues to slide down. https://cryptocomes.com/sites/default/files/inline-images/xrp_hourly_1_28.05.jpg (https://cryptocomes.com/bitcoin-ethereum-ripple-eos-start-this-new-week-in-red-price-analysis-may-28) Lets have a closer look at the situation on the hourly chart. Ripple followed the orange scenario during the weekend but started this new week with a serious decline. XRP/USD managed to fall towards 2.618 retracement and established a new local low. Possible scenarios for Ripple are the following: 1. Red scenario (bearish). Ripple will develop its downside progress targeting new local lows. 2. Orange scenario (neutral). XRP price will run towards the closest resistance area at $0.5914. XRP/USD is likely to reverse afterwards. 3. Green scenario (bullish correction). XRP/USD will reach the closest resistance area at $0.5914 and cross it targeting the next 1.618 retracement area, which coincides with $0.6216 resistance area. The neutral scenario seems to have better chances on Monday. Take a look at EOS (EOS/USD) and Zcash (ZEC/USD) Price Analysis, May 28 (https://cryptocomes.com/bitcoin-ethereum-ripple-eos-start-this-new-week-in-red-price-analysis-may-28) Title: Re: Daily price watch Post by: arthotdog on May 28, 2018, 02:55:19 PM Icon is looking good atm. Could see a bit of a rise as it is retesting break out zone. TA below What altcoin do you mean is looking good ATM yesterday?https://t.me/CryptoInMinutes What do you reckon? Maybe your basis is Just delayed thats why you think altcoins not affected,checking the altcoins now they are almost dead,and striving to live.. I am hoping that this will stop this weekends because if not,our folio is dead Title: Re: Daily price analysis BTC + ALTCOINS Post by: deonyx on May 28, 2018, 03:16:03 PM Bitcoin is not a respecter of no man's words as BTC has totally denied all technical analysis and heading towards whichever direction that it chooses to follow.
Title: Re: Daily price analysis BTC + ALTCOINS Post by: rumexx on May 28, 2018, 04:38:58 PM Good daily report with an incisive analysis for each day. I will be working with this site(https://cryptocomes.com/pricewise) to do my analysis and forecast. Thanks for such information.
Title: Re: Daily price analysis BTC + ALTCOINS Post by: Dany44 on May 29, 2018, 07:40:31 AM Good daily report with an incisive analysis for each day. I will be working with this site(https://cryptocomes.com/pricewise) to do my analysis and forecast. Thanks for such information. you're welcome!Title: Re: Daily price analysis BTC + ALTCOINS Post by: Dany44 on May 29, 2018, 03:04:36 PM Bitcoin, Ethereum, Ripple Still Falling, Cardano Surprisingly Grows: Price Analysis, May 29
https://cryptocomes.com/sites/default/files/styles/912x570/public/2018-05/photo_2018-05-29_14-46-01.jpg?itok=62py-u8h (https://cryptocomes.com/bitcoin-ethereum-ripple-still-falling-cardano-surprisingly-grows-price-analysis-may-29) Bitcoin and other major cryptocurrencies are still looking for support while Cardano surprisingly rises There is two news today both bad and good. The bad one is that Bitcoin, Ethereum, Ripple are still going down without any sign of a reversal. The good one is that they have slowed down their downside tendencies. However, no one can say for how long. Psychologically, the crypto industry is still bearish. There is no a single event to help bulls to break this negative tendency. Bears continue to dig themselves deeper into the ground, establishing new lows almost every day. As for crypto news, there are some interesting events to mention. The South Korean Bithumb (https://cryptocomes.com/bithumb-south-korean-exchange-bans-trading-in-11-countries) exchange has banned traders from 11 Non-Cooperative Countries and Territories including Iraq, Iran, Bosnia and Herzegovina, Tunisia, Trinidad and Tobago, Vanuatu, Yemen and others. The other interesting event for the cryptocurrency community is that six companies in Japan (https://cryptocomes.com/6-japanese-firms-launch-crypto-exchanges-on-tokyo-stock-exchange) have opened crypto exchanges on the Tokyo Stock Exchange. The fundamental outlook, however, is still negative. Hodlers and buyers are still waiting for some good news to come. Bitcoin (BTC/USD) Price Analysis, May 29 https://cryptocomes.com/sites/default/files/inline-images/btc%20hourly_2.jpg (https://cryptocomes.com/bitcoin-ethereum-ripple-still-falling-cardano-surprisingly-grows-price-analysis-may-29) Bitcoin is still going along the red midterm descending trend line and shows no sign of recovery. The currency pair established new lows on Monday meaning sellers still have control over the market. BTC/USD seem to aim at $6,510 in midterm. https://cryptocomes.com/sites/default/files/inline-images/btc%20hourly%201_0.jpg (https://cryptocomes.com/bitcoin-ethereum-ripple-still-falling-cardano-surprisingly-grows-price-analysis-may-29) Lets have a closer look at what is going on the hourly chart. BTC price has jumped below the $7,199 support area and is trading there currently. Bitcoin has chosen the red scenario (bearish) on Monday. BTC/USD slides down along the red midterm descending trend line. Possible paths for Bitcoin are the following: 1. Red scenario (bearish). BTC/USD will continue to fall without any significant correction or after a correction towards the closest resistance area at $7,199. The closest targets for BTC/USD are 2.618 retracement level and the support area at $6,943. 2. Orange scenario (neutral). Bitcoin will jump over the closest resistance area at $7,199 and move higher targeting the next resistance area at $7,565, which coincides with 1.618 retracement level. Once those targets are reached, BTC/USD will reverse towards $7,199. 3. Green scenario (bullish correction). There are still chances that buyers will be able to make a kind of a correction. BTC price will reach $7,565 and move higher targeting the $7,949 resistance area, which coincides with one retracement level. Ethereum (ETH/USD) Price Analysis, May 29 https://lh4.googleusercontent.com/HgUIJG6FlfUVzECvk0ikl4nQEtZK5fFmn-R6hQjb79XJCyLr7sc9ai_uewLvpF7M9Xen0zs_y0RZRcHJ7UsvfxrBwNviCfSp4YLwyjtTX3msn1sd2vdHm0JU03tHPvXVqIolUBPU (https://cryptocomes.com/bitcoin-ethereum-ripple-still-falling-cardano-surprisingly-grows-price-analysis-may-29) Ethereum has lost nearly two percent in the past 24 hours, meaning the currency pair slows down its downside tendency. There is a possibility of a bullish correction. However, ETH price still stays below the descending trend line and we have a general downside tendency. Midterm outlooks still negative. The price is able to reach $453.24 support area at least. https://lh3.googleusercontent.com/xiFOdeJFeCm2BSsGJymavJcArJaENf5ahUkkRZNR3JYSEbTh977sFvfYWOkkeV0qNXxtPHgyQeN2P90nvTjfXKlT7nFHu3VT9_1yftnGh8PWu3rc1EUL-jMkIVKW9VBVY3jreexI (https://cryptocomes.com/bitcoin-ethereum-ripple-still-falling-cardano-surprisingly-grows-price-analysis-may-29) Lets have a closer look at ETH/USDs hourly chart situation. The currency pair has reached the support area at 3.618 retracement level and has fallen back from there. It seems that Ethereum goes towards the closest resistance area at $566.90, which coincides with 2.618 retracement level. The possible scenarios for ETH/USD are the following: 1. Red scenario (bearish). The currency pair will fall from the current levels or from $566.90 towards 3.618 retracement level and then lower, towards 4.236 retracement level, which coincides with $473.39 support area. 2. Orange scenario (neutral). This one is similar to a red variation, but ETH price will not break through 3.618 retracement level and jump off it. 3. Green scenario (bullish correction). ETH price will follow the orange scenario until $566.90 resistance area and then will break it through targeting $596.08 resistance area. Ripple (XRP/USD) Price Analysis, May 29 Ripple has left the midterm descending trend line, but we have drawn another short-term one as the currency pair still follows a downside tendency. XRP/USD has lost over two percent in the past 24 hours. Ripples downtrend slows down, but it is still in place meaning bears control the market. Midterm outlook still negative. The currency pair is able to reach $0.5000. https://lh5.googleusercontent.com/EwbmZgNFRdkg8dPxbaMU1p75IBb3cyLPbOvLTmI3ukquhFHw4SDpa0_Yq17kstJtvoxjpKRsVSHlginRtinf7GltDWYUPNRn7mBlXwK_2qG0RRhLrssC5SFamID5VjkOTCURSL-Y (https://cryptocomes.com/bitcoin-ethereum-ripple-still-falling-cardano-surprisingly-grows-price-analysis-may-29) Lets have a closer look at the hourly chart situation. XRP/USD has reached new lows on Monday and touched $0.5444 support area. The currency pair jumps off this level later and crossed 2.618 retracement level as a part of the bullish correction. The possible scenarios for XRP/USD are the following: 1. Red scenario (bearish). The currency pair will jump off $0.5914 resistance area and move lower aiming at 2.618 retracement level. The second target for the bears lies at $0.5444 support area. 2. Orange scenario (neutral). XRP/USD will rise towards $0.6216 and reverse towards the current support area at $0.5914. 3. Green scenario (bullish correction). The currency pair will move towards $0.6216 and cross this resistance area aiming the next one, which lies at $0.6515. Take a look at EOS (EOS/USD) and Cardano (ADA/USD) Price Analysis, May 29 (https://cryptocomes.com/bitcoin-ethereum-ripple-still-falling-cardano-surprisingly-grows-price-analysis-may-29) Title: Re: Daily price analysis BTC + ALTCOINS Post by: bummm on May 29, 2018, 06:48:46 PM Curious. It is always interesting to read somebody's predictions and compare them with your own. I suppose that this year, Bitcoin can climb the 25K hill.
Title: Re: Daily price analysis BTC + ALTCOINS Post by: Dany44 on May 30, 2018, 02:31:40 PM Crypto Markets in Green, Bitcoin, Altcoins in Correction Mood: Price Analysis, May 30
https://cryptocomes.com/sites/default/files/styles/912x570/public/2018-05/fork.jpg?itok=gdBcSx3H (https://cryptocomes.com/crypto-markets-in-green-bitcoin-altcoins-in-correction-mood-price-analysis-may-30) Bitcoin and other major cryptocurrencies are in correction on Wednesday. Bytecoin is days leader Crypto market is in green on Wednesday. All coins from the top 20 are in correction having positive moods. Is it a complete reverse or just a bullish correction on the eve of an even greater decline? We dont think that the crypto industry has changed its mind and reversed with no significant reason. It seems to be a correction as market players are bored of this downside tendency already. They wanted some air to breathe. However, there is one important event that is to be mentioned. South Korea is ready to reverse ICOs ban (https://cryptocomes.com/south-koreas-national-assembly-proposes-to-reverse-ico-ban). This event is important for the whole industry and is one of the reasons for the current correction. As for other news, there are no important ones to affect the markets significantly. However, we would like you to pay attention to the following aspects. First, Chinese security Giant 360 has found vulnerabilities in EOS system (https://cryptocomes.com/eos-platform-vulnerabilities-detected-by-360-chinese-internet-security-giant) that lead to possibilities of execution of arbitrary code on any EOS node. This event had almost no impact on EOS as the cryptocurrency added nearly 10 percent on Tuesday-Wednesday. Bitcoin (BTC/USD) Price Analysis, May 30 https://cryptocomes.com/sites/default/files/inline-images/xrp_hourly_2.jpg (https://cryptocomes.com/crypto-markets-in-green-bitcoin-altcoins-in-correction-mood-price-analysis-may-30) Bitcoin has started a bullish correction finally. BTC price is above the midterm descending trend line. The goals at $6,510 are still actual, but they may be reached after a correction only. However, fundamental factors like ICOs ban reverse in South Korea may break midterm downside scenario. https://cryptocomes.com/sites/default/files/inline-images/btc_hourly_1_1.jpg (https://cryptocomes.com/crypto-markets-in-green-bitcoin-altcoins-in-correction-mood-price-analysis-may-30) Lets have a closer look at BTC/USD within Fibonacci formation. The currency pair follows the orange scenario in the moment of writing. BTC price has crossed $7,199 area on Tuesday and reached the resistance area at $7,565, which coincides with 1.618 retracement level. What are the possible ways for Bitcoin in the next 24 hours? 1. Orange scenario. BTC price will jump off the current resistance area at $7,565 and move towards the support area at $7,199. If sellers will be able to break this support area out, there is a possibility of red scenario below $7,199. 2. Green scenario (deeper bullish correction). Bitcoin will cross $7,565 resistance area and move higher targeting one retracement level, which coincides with the next resistance area at $7,949. We think that Bitcoin is likely to develop its correction on Wednesday. Ethereum (ETH/USD) Price Analysis, May 30 https://cryptocomes.com/sites/default/files/inline-images/eth_hourly_4.jpg (https://cryptocomes.com/crypto-markets-in-green-bitcoin-altcoins-in-correction-mood-price-analysis-may-30) Ethereum added over seven percent in the past 24 hours as the currency pair has started a bullish correction finally. ETH/USD has crossed the midterm descending trend line and fluctuates above it. The currency pair is still in the downtrend, but this bullish correction may be deeper depending on levels that ETH price will approach and cross. https://cryptocomes.com/sites/default/files/inline-images/eth_hourly_1_1.jpg (https://cryptocomes.com/crypto-markets-in-green-bitcoin-altcoins-in-correction-mood-price-analysis-may-30) Lets get down to Fibonacci and see what perspectives ETH/USD has in the nearest future (in the next 24 hours, to be more exact). The currency pair jumped off 3.618 retracement level on Monday-Tuesday and moved towards 2.618 retracement level, which coincides with $566.90 resistance area. What are the possible ways for ETH/USD in the next 24 hours? 1. Red scenario (bearish). The currency pair will end the correction close to the current level and reverses downwards targeting the red midterm descending trend line and 3.618 retracement level (which is the closest support area currently). 2. Orange scenario (neutral). Ethereum will move towards the closest resistance area at $596.08 and reverse there to reach 2.618 retracement area. This is a neutral scenario as the price will stay within the current range. 3. Green scenario (bullish correction). Ethereum will reach $596.08 resistance area, cross it and run higher, towards 1.618 retracement level, which coincides with $626.66 resistance area. Ripple (XRP/USD) Price Analysis, May 30 https://cryptocomes.com/sites/default/files/inline-images/xrp_hourly_0.jpg (https://cryptocomes.com/crypto-markets-in-green-bitcoin-altcoins-in-correction-mood-price-analysis-may-30) Ripple has added more than eight percent in the past 24 hours meaning the crypto is in a deeper correction currently. XRP/USD has successfully tested another local descending trend line and fluctuates above in the moment of writing. https://cryptocomes.com/sites/default/files/inline-images/xrp_hourly_1_1.jpg (https://cryptocomes.com/crypto-markets-in-green-bitcoin-altcoins-in-correction-mood-price-analysis-may-30) Lets see what is going on the hourly chart within the Fibonacci retracement indicator. XRP price has crossed $0.5914 resistance area and even tested it from the above. Bulls were able to hold their lines and to move XRP/USD even higher towards $0.6216, which coincides with 1.618 retracement level. That we see now is the attempt to test this level again. Lets look through the possible ways for XRP/USD: 1. Red scenario (bearish). XRP/USD will move towards $0.5914 and cross this area targeting 2.618 retracement level. The red scenario is also possible via Orange one (meaning XRP/USD will reach $0.6216 again, jump off it and then fall below $0.5914). 2. Orange scenario (neutral). Ripple will retest $0.6216 resistance area and reverse downwards targeting $0.5914 support area. 3. Green scenario (bullish correction). XRP/USD will break through $0.6216 resistance area targeting $0.6515 resistance area, which coincides with one retracement level. Take a look at EOS (EOS/USD) and Bytecoin (BCN/USD) Price Analysis, May 30 (https://cryptocomes.com/crypto-markets-in-green-bitcoin-altcoins-in-correction-mood-price-analysis-may-30) Title: Re: Daily price analysis BTC + ALTCOINS Post by: Dany44 on June 01, 2018, 02:44:40 PM Bitcoin, Ethereum, Ripple in Green, IOTA Days Leader: Price Analysis, June 1
https://cryptocomes.com/sites/default/files/styles/912x570/public/2018-06/photo_2018-06-01_14-43-37.jpg?itok=JhSy27dj (https://cryptocomes.com/bitcoin-ethereum-ripple-in-green-iota-days-leader-price-analysis-june-1) EOS loses a little, IOTA grows, cryptocurrencies across the board are being in green All the major cryptos from the top 20 are in a positive mood on Friday, but in general, there is no clear tendency currently as fluctuations are neutral. Cryptocurrencies seem to stop or to pause (which sounds better here) their downtrend for a while. However, what we see now on the charts looks like a correction and not a reversal. The fundamental background is neutral in the moment of writing as there are no news to affect the industry significantly. However, some interesting facts we have gathered here. Despite the fact that almost all cryptos are green, EOS looks weak as Qihoo 360 has found security problems that lead to some losses. However, EOS still holds its positions generally as the system will transfer to mainnet (https://cryptocomes.com/eos-loses-momentum-ahead-of-mainnet-due-to-voting-issues) on June 2, 2018. As for the general picture, cryptocurrencies still need some good news to start the uptrend. They remain neutral and seem to be in correction to the previous downtrend. Bitcoin (BTC/USD) Price Analysis, June 1 https://cryptocomes.com/sites/default/files/inline-images/btc_hourly_4.jpg (https://cryptocomes.com/bitcoin-ethereum-ripple-in-green-iota-days-leader-price-analysis-june-1) The currency pair started a correction this week and added around one percent on Friday. BTC/USD has jumped over the descending trend line and moved higher meaning bulls have finally found their support point. https://cryptocomes.com/sites/default/files/inline-images/btc_hourly_1_4.jpg (https://cryptocomes.com/bitcoin-ethereum-ripple-in-green-iota-days-leader-price-analysis-june-1) Lets have a closer look at the current situation within the Fibo retracement graphic tool. The currency pair still tests 1.618 retracement level, which coincides with the $7,565 resistance area. It stays within a horizontal channel with no clear direction. However, we have lower lows meaning the currency pair forms a kind of an ascending triangle, which is able to burst upwards. The possible ways for BTC/USD are the following: 1. Red scenario (bearish). The currency pair will move towards the closest support area at $7,199 to test it. If successful, sellers will be able to push BTC/USD even lower. 2. Orange scenario (neutral). BTC/USD will move towards the closest support at $7,199 to test this line. However, bears will be unable to penetrate through this area and will retreat as BTC price will go upwards targeting the closest resistance area at $7,565. 3. Green scenario (bullish). Bitcoin will jump over $7,565 and run higher targeting one retracement level, which coincides with the $7,949 resistance area. Ethereum (ETH/USD) Price Analysis, June 1 https://cryptocomes.com/sites/default/files/inline-images/eth_hourly_5.jpg (https://cryptocomes.com/bitcoin-ethereum-ripple-in-green-iota-days-leader-price-analysis-june-1) Ethereum has added nearly two percent in the past 24 hours. However, the situation currently is still far from being positive as ETH price has difficulties to grow. ETH/USD is above the descending trend line currently meaning buyers have a chance to change the game. https://cryptocomes.com/sites/default/files/inline-images/eth_hourly_1_2.jpg (https://cryptocomes.com/bitcoin-ethereum-ripple-in-green-iota-days-leader-price-analysis-june-1) Lets zoom a bit to the Fibo retracement tool. ETH price shows low volatility today. It is close to the support area at $566.90. ETH/USD has broken through the descending trend line on Wednesday. Ethereum makes attempts to run higher since but still needs more power. What are the possible ways for ETH/USD? 1. Red scenario (bearish). ETH/USD will break through the current support area at $566.90 and move lower targeting the next support area at 3.618 retracement level. 2. Orange scenario (neutral). Ethereum will jump off the current support area at $566.90 and move higher towards the next resistance area at $596.08. ETH/USD will reverse there to move lower (flat fluctuations). 3. Green scenario (bullish). The currency pair will reach $596.08 resistance area and move higher towards $626.66 resistance area, which coincides with 1.618 retracement level. Ripple (XRP/USD) Price Analysis, June 1 https://cryptocomes.com/sites/default/files/inline-images/xrp_hourly_3.jpg (https://cryptocomes.com/bitcoin-ethereum-ripple-in-green-iota-days-leader-price-analysis-june-1) The currency pair added nearly one percent in the past 24 hours. The volatility is low and there are no drivers currently to affect XRP price significantly. However, XRP price is above two descending trend lines (midterm and short-term) meaning chances for the price to rise are higher. https://cryptocomes.com/sites/default/files/inline-images/xrp_hourly_1_2.jpg (https://cryptocomes.com/bitcoin-ethereum-ripple-in-green-iota-days-leader-price-analysis-june-1) Ripple has reached the resistance area at $0.6216, which coincides with 1.618 retracement level. There were several tests, but bulls were unable to cross this line. The price jumped off $0.6216 again and moves towards the closest support area at $0.5914 in the moment of writing. What are the possible ways for ETH/USD? 1. Red scenario (bearish). Ripple will reach the closest support area at $0.5914 and cross it targeting the next support at 2.618 retracement level. 2. Orange scenario (neutral). The currency pair will jump off the closest support area at $0.5914 and mover higher towards 1.618 retracement level, which coincides with $0.6216 resistance area. There, XRP price will reverse again to run lower (meaning flat channel trading). 3. Green scenario (bullish). The currency pair will reach the closest support area at $0.5914 (or start from the current levels) and then will reverse upwards targeting $0.6216 and the next resistance area at $0.6515. Take a look at EOS (EOS/USD) and IOTA (IOTA/USD) Price Analysis, June 1 HERE (https://cryptocomes.com/bitcoin-ethereum-ripple-in-green-iota-days-leader-price-analysis-june-1) Title: Re: Daily price analysis BTC + ALTCOINS Post by: Dany44 on June 04, 2018, 01:48:45 PM Bitcoin, Ethereum, EOS Uncertain, NEO Days Loser: Price Analysis, June 4
https://cryptocomes.com/sites/default/files/styles/912x570/public/2018-06/neo%20bitcoin%20etherium%20eos.jpg?itok=24LH2OjS (https://cryptocomes.com/bitcoin-ethereum-eos-uncertain-neo-days-loser-price-analysis-june-4) Bitcoin, Ethereum and EOS look uncertain while NEO loses nearly five percent Bitcoin and its rivals seem to change their tendencies as they continue to establish new higher highs and higher lows. This positive mood means that corrections go on as there are no significant fundamental drivers to change the situation. Market participants seem to be tired of those midterm downtrends and make cautious attempts to buy cryptos expecting that those corrections will give support for buyers and they will be able to develop progress. As for news, there are some interesting facts related to EOS and other cryptocurrencies. The debates between EOS and Qihoo continue (https://cryptocomes.com/qihoo-ceo-debunks-eos-shortselling-ahead-of-mainnet-launch-june-2) as Daniel Larimer, EOS developer, accused Qihoo 360 security in a malicious move against the cryptocurrency, which lead to EOS downtrend. Qihoo 360 founder and CEO Zhou Hongyi denies any malicious intentions underlying that bugs were fixed even before the report. Another interesting event that is worth our attention is the announcement of the worlds largest venture capital fund by Binance exchange (https://cryptocomes.com/binance-crypto-exchange-launches-1-bln-fund-for-blockchain-projects). The main target of this unit is to provide investments to startups and other Blockchain funds. Bitcoin (BTC/USD) Price Analysis, June 4 https://cryptocomes.com/sites/default/files/inline-images/btc_04.06.jpg (https://cryptocomes.com/bitcoin-ethereum-eos-uncertain-neo-days-loser-price-analysis-june-4) The currency pair has lost nearly two percent in the past 24 hours but this time there is nothing to worry about. As we can see, BTC/USD goes along the short-term ascending trend line jumping over one resistance area after another. Technically and fundamentally, this is a correction still as there are no positive drivers to change the tendency. However, those who have bought earlier, already gained some profits. https://cryptocomes.com/sites/default/files/inline-images/btc1_04.06.jpg (https://cryptocomes.com/bitcoin-ethereum-eos-uncertain-neo-days-loser-price-analysis-june-4) Lets have a closer look at BTC/USD. The currency pair has jumped over the resistance area at $7,565 during the weekend and managed to test another resistance area at $7,734. BTC price declined towards the ascending trend line later. BTC/USD is testing this trend line, which coincides with $7,565 support area and 1.618 retracement level currently. The probable ways for Bitcoin are the following: 1. Red scenario (bearish). The currency pair will break through the trend line and move lower targeting two closest support areas at $7,341 and $7,199. 2. Orange scenario (neutral). The currency pair will stay between support area at $7,565 and resistance are at $7,734. This horizontal channel may be larger including the next resistance area at $7,949. 3. Green scenario (bullish). The currency pair will move upwards directly breaking through resistance areas at $7,734 and $7,949. Ethereum (ETH/USD) Price Analysis, June 4 https://cryptocomes.com/sites/default/files/inline-images/eth_04.06.jpg (https://cryptocomes.com/bitcoin-ethereum-eos-uncertain-neo-days-loser-price-analysis-june-4) Ethereum seems to have recovered in general as it goes along is short-term ascending trend line meaning bulls have finally found support and try to drive ETH/USD higher. However, the currency pair having lost nearly two percent in the past 24 hours as bears make attempts to counter-attack. This upside run is nothing more than a correction still as fundamentally there are no reasons for Ethereum to change its trend. Anyway, traders can benefit from this correction. https://cryptocomes.com/sites/default/files/inline-images/eth_1_04.06.jpg (https://cryptocomes.com/bitcoin-ethereum-eos-uncertain-neo-days-loser-price-analysis-june-4) Lets have a closer look at the hourly chart. ETH price tries to break through the green ascending trend line and tests the closest support area at $596.08. ETH/USD ran higher during the weekend and established new local highs at $626.66, which coincides with 1.618 retracement level, but then buyers retreated allowing sellers to start a local bearish correction. The possible ways for ETH/USD are the following: 1. Red scenario (bearish). The currency pair will break through the trend line and the closest support area at $596.08 and move lower targeting the next support area at $566.90, which coincides with 2.618 retracement level. 2. Orange scenario (neutral). ETH price will reach the closest resistance area at $626.66 and jump off it moving towards the green ascending trend line. Horizontal channel for the neutral scenario is limited by support area at $596.08 and resistance area at $626.66. 3. Green scenario (bullish). ETH/USD will cross $626.66 resistance area and run higher targeting $662.39 resistance area. Ripple (XRP/USD) Price Analysis, June 4 https://cryptocomes.com/sites/default/files/inline-images/xrp_04.06.jpg (https://cryptocomes.com/bitcoin-ethereum-eos-uncertain-neo-days-loser-price-analysis-june-4) The currency pair seems to restore as XRP price reached the end of Fibonacci retracement on the weekend. However, later, XRP/USD jumped off this resistance area at $0.7013 and moved lower targeting the green ascending trend line. Ripple added less than one percent in the past 24 hours due to the local bearish correction that we can see on the Hourly chart currently. https://cryptocomes.com/sites/default/files/inline-images/xrp_1_04.06.jpg (https://cryptocomes.com/bitcoin-ethereum-eos-uncertain-neo-days-loser-price-analysis-june-4) Lets have a closer look at the hourly chart. Ripple followed the other allied currencies and managed to establish new local highs. We have drawn this local red ascending trend line, which is under bombardment in the moment of writing as XRP/USD is trying to breach it. The possible ways for the currency pair are the following: 1. Red scenario (bearish). Ripple will break through the ascending trend line and the closest support area at $0.6515 and develop its downside progress targeting $0.6216 support area, which coincides with one retracement level. 2. Orange scenario (neutral). The currency pair will move towards 0.618 retracement level and then decline to the current support area at $0.6515. 3. Green scenario (bullish). XRP/USD will cross all Fibonacci retracement level and reach $0.7013 resistance area at least. Take a look at EOS (EOS/USD) and NEO (NEO/USD) Price Analysis, June 4 (https://cryptocomes.com/bitcoin-ethereum-eos-uncertain-neo-days-loser-price-analysis-june-4) Title: Re: Daily price analysis BTC + ALTCOINS Post by: FalcoonRed on June 04, 2018, 02:20:25 PM btc and altcoin are red but ethereum even more red, i do not understand with ethereum.
Title: Re: Daily price analysis BTC + ALTCOINS Post by: Dany44 on June 05, 2018, 02:12:58 PM Bitcoin, Ethereum, EOS, Ripple, NEO Return to Downtrend: Price Analysis, June 5
https://cryptocomes.com/sites/default/files/styles/912x570/public/2018-06/stairs_red.jpg?itok=XF1FvQSq (https://cryptocomes.com/bitcoin-ethereum-eos-ripple-neo-return-to-downtrend-price-analysis-june-5) Bitcoin, Ethereum and EOS lose momentum, the top 15 cryptos are in red today Crypto coins seem to return to their downtrends again as almost all the top 20 cryptocurrencies have lost some positions in the past 24 hours. There is no evident reason for them to fall and those downside tendencies may be part of local downward corrections. As for interesting news, Vitalik Buterin (https://cryptocomes.com/vitalik-buterin-ethereum-scalable-to-millions-of-transactions-per-second), Ethereums founder has revealed that his project is able to process 100 mln transactions per second. He explained that sharding along with Plasma (second layer) will allow the Ethereum network to solve scalability problems. Another interesting thing to pay attention to is that Ripple has announced plans to donate $50 mln (https://cryptocomes.com/ripple-donates-50-mln-to-boost-blockchain-and-cryptocurrency-adoption)to conduct research works and to accelerate cryptocurrencies adoption. Bitcoin (BTC/USD) Price Analysis, June 5 https://cryptocomes.com/sites/default/files/inline-images/btc_05.06.jpg (https://cryptocomes.com/bitcoin-ethereum-eos-ripple-neo-return-to-downtrend-price-analysis-june-5) Bitcoin seems to return to the downside tendency as BTC price has lost almost two percent in the past 24 hours. BTC/USD managed to establish a temporary upside tendency during the weekend, which was a part of an upside correction. However, on Monday BTC/USD started to decline. https://cryptocomes.com/sites/default/files/inline-images/btc_1_05.06.jpg (https://cryptocomes.com/bitcoin-ethereum-eos-ripple-neo-return-to-downtrend-price-analysis-june-5) Lets have a closer look at what is going on the hourly chart. Bitcoin has broken through the red ascending trend line and moved lower meaning it has stopped its local uptrend (part of an upside correction). However, BTC/USD jumped off $7,341 support area, which prevents the currency pair from further downside tendency. The possible ways for BTC/USD are the following: 1. Red scenario (bearish). The currency pair will break through the closest support area at $7,341 and move lower targeting the next support area at $7,199. 2. Orange scenario (neutral). BTC/USD will stay within the current range between the resistance area at $7,565 and the support area at $7,341 jumping off both levels. 3. Green scenario (bullish). Bitcoin will cross the closest resistance area at $7,565 and move higher, targeting the next resistance area at $7,734. Ethereum (ETH/USD) Price Analysis, June 5 https://cryptocomes.com/sites/default/files/inline-images/eth%20%281%29.jpg (http://) Ethereum followed the other allies and went downwards on Monday after the weekends rally, which was a part of an upside correction to the midterm downtrend. ETH/USD has lost more than two percent in the past 24 hours and is able to develop this negative tendency in the nearest future. If the upside correction is done, ETH/USD will likely to develop its downside progress. https://cryptocomes.com/sites/default/files/inline-images/eth_1.jpg (http://) Lets have a closer look at what is happening on the hourly chart. ETH/USD has reached $626.66 resistance area during the weekend but was unable to cross it. The currency pair has started a short-term downside correction on Monday, which looks like the downtrend in the moment of writing as ETH/USD has broken through the green ascending trend line. Ethereum was stopped at $566.90 support area, which coincides with 2.618 retracement level. What are the possible ways for ETH/USD? 1. Red scenario (bearish). The currency pair will break through $566.90 and move lower targeting $540.69 support area. 2. Orange scenario (neutral). ETH/USD will test the closest resistance area at $596.08 and jump off it targeting the closest support area at $566.90. The currency pair will stay within this range with no significant fluctuations. 3. Green scenario (bullish). Ethereum will break through the resistance area at $596.08 and move higher targeting the next resistance area at $626.66, which coincides with 1.618 retracement level. Ripple (XRP/USD) Price Analysis, June 5 https://cryptocomes.com/sites/default/files/inline-images/xrp.jpg (https://cryptocomes.com/bitcoin-ethereum-eos-ripple-neo-return-to-downtrend-price-analysis-june-5) Ripple moved downwards on Monday meaning this upside correction, which was developing during the weekend has come to an end. The currency pair has lost more than one percent in the past 24 hours but bulls still make attempts to reverse the price. XRP/USD failed to leave the Fibonacci retracement during the weekend meaning buyers are still unable to change the situation in their favor. https://cryptocomes.com/sites/default/files/inline-images/xrp_1.jpg (https://cryptocomes.com/bitcoin-ethereum-eos-ripple-neo-return-to-downtrend-price-analysis-june-5) Lets see closer whats happening on the hourly chart within the Fibonacci tool. Ripple has breached the green ascending trend line and moved lower. XRP/USD is currently above the support area at $0.6515, which coincides with one retracement level. The following ways for Ripple are the following: 1. Red scenario (bearish). The currency pair will move towards the closest support area at $0.6515 and cross it targeting the next support area at $0.6216. 2. Orange scenario (neutral). XRP/USD is going to fluctuate within the range, limited by the resistance 0.786 retracement level and the support area at $0.6515. 3. Green scenario (bullish). Ripple will cross 0.786 retracement level and several other retracement levels targeting $0.7013 resistance area. Take a look at EOS (EOS/USD) and NEO (NEO/USD) Price Analysis, June 5 (https://cryptocomes.com/bitcoin-ethereum-eos-ripple-neo-return-to-downtrend-price-analysis-june-5) Title: Re: Daily price analysis BTC + ALTCOINS Post by: Dany44 on June 06, 2018, 01:26:21 PM Bitcoin, Ethereum, EOS (https://cryptodetail.com/eos-coin-token-sale-over-whats-next) Return to Upside Correction: Price Analysis, June 6
https://cryptocomes.com/sites/default/files/styles/912x570/public/2018-06/photo_2018-06-06_15-11-12.jpg?itok=sps5t1tV (https://cryptocomes.com/bitcoin-ethereum-eos-return-to-upside-correction-price-analysis-june-6) Holy Top 20 is in green Wednesday, technical factors rule the markets The Holy Top 20 is green Wednesday (except Lisk naturally, which has shown the negative dynamics in the past 24 hours), which means that cryptocurrencies have returned to their correction paths. Is there something important to make investors and traders change their bearish moods? Obviously, nothing to pay attention to. This correction is a technical aspect that has no fundamental basis currently. However, nobody is able to predict whether there will be no reasons for growth tomorrow. Anyway, those who have already bought cryptos in the beginning of their corrections are happy now as cryptocurrencies have deeper corrections than initially expected. As for news, there is nothing to affect the industry, but we would like to mention Steve Wozniaks interview, in which he stated that Bitcoin will become the global crypto in 10 years (https://cryptocomes.com/steve-wozniak-hopes-bitcoin-turns-into-single-global-coin). Bitcoin (BTC/USD) Price Analysis, June 6 https://cryptocomes.com/sites/default/files/inline-images/btc.jpg (https://cryptocomes.com/bitcoin-ethereum-eos-return-to-upside-correction-price-analysis-june-6) Bitcoin continues its correction to the downtrend, which generally looks like wide flat fluctuations. BTC/USD has added almost two percent in the past 24 hours. However, Bitcoin remains under the green ascending trend line, meaning the correction momentum is lost already. https://cryptocomes.com/sites/default/files/inline-images/btc_1.jpg (https://cryptocomes.com/bitcoin-ethereum-eos-return-to-upside-correction-price-analysis-june-6) Lets get closer to the current situation. BTC/USD has reached the support area at $7,341 on Tuesday, but jumped off this level later and managed even to cross the closest resistance area at $7,565. The currency pair has tested the green ascending trend line from below, but buyers were unable to drive Bitcoin higher. The possible ways for BTC/USD are the following: 1. Red scenario (bearish). The currency pair will break through the closest support area at $7,565 and move lower targeting the next support area at $7,341. 2. Orange scenario (neutral). Bitcoin will stay within the range, limited by the resistance area at $7,734 and the support area at $7,565 without significant price changes. 3. Green scenario (bullish). BTC/USD will move towards the closest resistance area at $7,734 and break it through targeting the next resistance area at $7,949. This scenario includes also the probability for Bitcoin to jump over the green ascending trend line. Ethereum (ETH/USD) Price Analysis, June 6 https://cryptocomes.com/sites/default/files/inline-images/eth.jpg (https://cryptocomes.com/bitcoin-ethereum-eos-return-to-upside-correction-price-analysis-june-6) Ethereum has added almost two percent in the past 24 hours but ETH price is still below the green ascending trend line. The situation looks like ETH/USD is in correction in general, but the latest fluctuations show that the currency pair is in a large flat with no clear direction. https://cryptocomes.com/sites/default/files/inline-images/eth_1_0.jpg (https://cryptocomes.com/bitcoin-ethereum-eos-return-to-upside-correction-price-analysis-june-6) Lets see closer what is happening inside the Fibonacci retracement. ETH/USD has reached 2.618 retracement level on Tuesday but failed to hold it as ETH price went upwards. Ethereum has crossed the closest resistance area at $596.09 later. The currency pair stays above this level currently, below the ascending trend line. What are the possible ways for Ethereum? 1. Red scenario (bearish). The currency pair will break through the closest support area at $596.08 and run lower targeting the next support area at $566.90. 2. Orange scenario (neutral). ETH/USD Will stay within the current horizontal range, limited by the resistance area at $626.66 and the support area at $596.08 without any significant changes. 3. Green scenario (bullish). The currency pair will break through $626.66 resistance area targeting the next one at $662.39. This scenario includes also situation when ETH/USD jumps over the ascending trend line. Ripple (XRP/USD) Price Analysis, June 6 https://cryptocomes.com/sites/default/files/inline-images/xrp_0.jpg (https://cryptocomes.com/bitcoin-ethereum-eos-return-to-upside-correction-price-analysis-june-6) Ripple looks better than allies as the currency pair develops its upside correction. It is close to the boundary of Fibonacci retracement tool and may breach it in the nearest future. However, XRP/USD still stays below the green ascending trend line. https://cryptocomes.com/sites/default/files/inline-images/xrp_1_0.jpg (https://cryptocomes.com/bitcoin-ethereum-eos-return-to-upside-correction-price-analysis-june-6) Lets have a closer look at whats happening on the hourly chart. The currency pair had a deep downside correction on Monday and Tuesday but managed to cross $0.6515 and several retracement levels. XRP/USD failed to jump over the green ascending trend line, but was close to it. Ripple seem to establish a bullish flag currently meaning the currency pair will be able to develop its upside tendency. What are the possible ways for XRP/USD? 1. Red scenario (bearish). The currency pair will cross 0.786 retracement level and the support area at $0.6515, which coincides with one retracement level targeting the next support area at $0.6216. 2. Orange scenario (neutral). The currency pair will stay between 0.5 and 0.786 retracement levels without significant price changes. 3. Green scenario (bullish). XRP/USD will develop its upside tendency targeting the upper boundary of the Fibonacci retracement, which coincides with the resistance area at $0.7013. Take a look at EOS (EOS/USD) and NEO (NEO/USD) Price Analysis, June 6 (https://cryptocomes.com/bitcoin-ethereum-eos-return-to-upside-correction-price-analysis-june-6) Title: Re: Daily price analysis BTC + ALTCOINS Post by: eann014 on June 06, 2018, 01:44:44 PM That's a good analysis though this is really happening most of the time and we cannot deny the fact that we lose some of our capital because of our wrong decisions and making panic selling which really makes us lose lots of money/bitcoin. Still hoping that this year that our bitcoins and altcoins will go up again even if not too high as our last ATHs. Good amount of bitcoin like $15k would be good enough.
Title: Re: Daily price analysis BTC + ALTCOINS Post by: Dany44 on June 06, 2018, 02:46:39 PM That's a good analysis though this is really happening most of the time and we cannot deny the fact that we lose some of our capital because of our wrong decisions and making panic selling which really makes us lose lots of money/bitcoin. Still hoping that this year that our bitcoins and altcoins will go up again even if not too high as our last ATHs. Good amount of bitcoin like $15k would be good enough. Totally agree! Though hope on 1M $ by 2020 as John McAfee predictedTitle: Re: Daily price analysis BTC + ALTCOINS Post by: vishudda on June 06, 2018, 03:27:47 PM The major reason behind the bitcoin price fall might be because of the news spreaded these days. I guess Crypto Ban is the major cause, the media people comes with the Ban news everytime, Google, FB, Bing search ban and many more. Crypto whales who holds the bitcoins sells out and the price declines. Hope we see the rise of the price again as end of 2017 and early 2018.
Title: Re: Daily price analysis BTC + ALTCOINS Post by: charlotte04 on June 06, 2018, 03:45:16 PM Here will be the latest price analysis for BTC and altcoins. We appreciate your opinion. Daily reviews are also placed on https://cryptocomes.com/pricewise (https://cryptocomes.com/pricewise) https://i.imgur.com/CuYXzTr.png (https://cryptocomes.com/pricewise) I really appreciate your information that you have given us. Not long for now and Bitcoin will pump accordingly and slowly. We just have to wait and see. Title: Re: Daily price analysis BTC + ALTCOINS Post by: Dany44 on June 07, 2018, 02:10:36 PM Bitcoin, Ethereum, Ripple, NEO Make New Highs, EOS at Some Loss: Price Analysis, June 7
https://cryptocomes.com/sites/default/files/styles/912x570/public/2018-06/photo_2018-06-07_16-52-57.jpg?itok=ZoU1Hfd2 (https://cryptocomes.com/bitcoin-ethereum-ripple-neo-make-new-highs-eos-at-some-loss-price-analysis-june-7) BTC/USD and the others establish new highs meaning the correction is still on. EOS loses a little Cryptocurrencies from the top 20 continue to establish new highs except EOS, which was unable to grow in the past 24 hours. This means that technical correction continues without any fundamental basis. What are the reasons for this correction? First of all, traders and investors learn more about charts and how to read them. They have seen the support areas for different cryptos and started to buy them increasing positive volumes. The second reason is that the others have seen BTC and its rivals to grow in the past several days and they also place long orders hoping to purchase cryptos at their lows as they think the whole industry is oversold in the moment of writing. As for the interesting news, there is almost nothing to pay attention to except Vitalik Buterins statements on Blockchain technology. Famous Canadian programmer and Ethereums CEO has mentioned that Blockchain is unsuitable for governmental voting (https://cryptocomes.com/vitalik-buterin-makes-his-position-clear-blockchain-unsuitable-for-government-voting). Bitcoin (BTC/USD) Price Analysis, June 7 https://cryptocomes.com/sites/default/files/inline-images/btc_2.jpg Bitcoin has added more than one percent in the past 24 hours meaning the currency pair still continues its upside correction. However, BTC/USD was unable to breach the green ascending trend line from below. https://cryptocomes.com/sites/default/files/inline-images/btc_1_1.jpg Lets have a closer look at what is going on the hourly chart. The flag pattern failed to develop as BTC price went through the support area at $7,565 on Wednesday. However, BTC/USD returned above this level later and continued to grow. Bitcoin has reached the next resistance area at $7,734 on Wednesday. What are the possible way for Bitcoin? 1. Red scenario (bearish). The currency pair will move towards the closest support area at $7,565 and break it through targeting the next support area at $7,341. 2. Orange scenario (neutral). Bitcoin will stay within the range limited by the support are at $7,565 and the closest resistance area at $7,734. 3. Green scenario (bullish). BTC/USD will test the closest resistance area at $7,734 and break through this level targeting the next resistance area at 7,949. Ethereum (ETH/USD) Price Analysis, June 7 https://cryptocomes.com/sites/default/files/inline-images/eth_0.jpg Ethereum has added more than one percent in the past 24 hours and established new local highs. However, the currency pair is still in correction. It is too early to say that we have a reverse of a midterm downside tendency. https://cryptocomes.com/sites/default/files/inline-images/eth_1_1.jpg Lets see closer what is going on the hourly chart. Ethereum formed a Flag pattern yesterday but declined later, breaking this formation. However, ETH/USD has managed to move higher again as it has found support at $596.08. There is another bullish flag currently on the hourly chart. ETH price is below the green ascending trend line. The possible ways for Ethereum are the following: 1. Red scenario (bearish). ETH/USD will move towards the closest support area at $596.08 and break through it targeting the next support area at $566.90. 2. Orange scenario (neutral). Ethereum will stay within the current range, limited by the support area at $596.08 and the closest resistance area at $626.66 without significant price changes. 3. Green scenario (bullish). The currency pair will break through $626.66 targeting the next resistance area at $662.39, which coincides with the one retracement level. Ripple (XRP/USD) Price Analysis, June 7 https://cryptocomes.com/sites/default/files/inline-images/xrp_2.jpg Ripple has added almost two percent in the past 24 hours as the currency continues its upside correction to the midterm downtrend. XRP/USD has established new local highs but we cant say currently that the correction has ended and we have a clear upside tendency as Ripple still fluctuates within the Fibonacci retracement tool. https://cryptocomes.com/sites/default/files/inline-images/xrp1.jpg Lets see closer what is going on within the Fibonacci retracement. The currency pair managed to test 0.786 retracement level, but was unable to break it out and reversed there. XRP/USD went upwards later on Thursday and reached 0.382 retracement level. It stays close to this position in the moment of writing. The possible ways for XRP/USD are the following: 1. Red scenario (bearish). Ripple will move downwards through several retracement levels targeting 0.786. 2. Orange scenario (neutral). XRP/USD will stay within the horizontal range, limited by 0.382 and 0.236 retracement levels without any significant price changes. 3. Green scenario (bullish). Ripple will grow targeting $0.7013 resistance area, which coincides with zero retracement level. Take a look at EOS (EOS/USD) and NEO (NEO/USD) Price Analysis, June 7 (https://cryptocomes.com/bitcoin-ethereum-ripple-neo-make-new-highs-eos-at-some-loss-price-analysis-june-7) Title: Re: Daily price analysis BTC + ALTCOINS Post by: jems on June 07, 2018, 03:58:28 PM it's almost like me where I'm always wrong in making a decision to buy or sell, maybe I often talk that we need to learn from mistakes but in fact it's very difficult to do.
Title: Re: Daily price analysis BTC + ALTCOINS Post by: asyakashi on June 07, 2018, 11:57:09 PM it's almost like me where I'm always wrong in making a decision to buy or sell, maybe I often talk that we need to learn from mistakes but in fact it's very difficult to do. sounds stressed. this is an emotional battle.and the winner is the one who can control it. do not let the chart affect you and let your beliefs play. just HOLD ;D Title: Re: Daily price analysis BTC + ALTCOINS Post by: Dany44 on June 08, 2018, 02:25:58 PM Bitcoin, Ethereum, Ripple, Neo Lose Momentum, EOS Trying to Restore: Price Analysis, June 8
https://cryptocomes.com/sites/default/files/styles/912x570/public/2018-06/photo_2018-06-08_17-39-38.jpg?itok=Mh2wPQFL (https://cryptocomes.com/bitcoin-ethereum-ripple-neo-lose-momentum-eos-trying-to-restore-price-analysis-june-8) Bitcoin and the other cryptos lose their momentum, EOS is still holding its positions The top 20 cryptocurrencies are in downside correction on Friday as there is still nothing new in this industry, which may affect coins and lead to big and serious movements. All cryptos are influenced by technical aspects currently. As for interesting news, we suggest paying attention to Carbon Blacks report (https://cryptocomes.com/11-bln-in-cryptocurrency-stolen-this-year-so-far-cybersecurity-report), which says that criminals have almost no difficulties to steal cryptocurrencies from users. According to the latest data, hackers are able to use over 10,000 marketplaces in order to steal digital money. Another interesting thing to pay attention to is the launch of EOS mainnet (https://cryptocomes.com/eos-mainnet-may-fire-away-within-hours)as the last tests seem to end. The cryptocurrency shows bullish tendencies as investors and traders are looking forward to seeing the release of this update. Bitcoin (BTC/USD) Price Analysis, June 8 https://cryptocomes.com/sites/default/files/inline-images/btc_3.jpg Bitcoin has lost less than one percent in the past 24 hours. The currency pair is still in upside correction to the previous downtrend, but this week, BTC/USD shows no significant fluctuations. Bitcoin is still below the green ascending trend line. https://cryptocomes.com/sites/default/files/inline-images/btc_1_2.jpg Lets have a closer look at what is going on the hourly chart. The currency pair has reached $7,734 previously but failed to hold this level or to run higher and went downwards. BTC/USD has touched $7,565 again and fluctuates there in the moment of writing. The possible ways for BTC/USD are the following: 1. Red scenario (bearish). The currency pair will break through $7,565 support area and move lower, targeting the next support area at $7,341. 2. Orange scenario (neutral). BTC/USD will stay within the current range, limited by the support area at $7,565 and the resistance area at $7,734. 3. Green scenario (bullish). The currency pair will run towards $7,734 and break it through targeting the next resistance area at $7,949. Ethereum (ETH/USD) Price Analysis, June 8 https://cryptocomes.com/sites/default/files/inline-images/eth_2.jpg Ethereum has lost less than one percent in the past 24 hours. The currency pair develops its correction to the previous downtrend. However, ETH/USD seems to lose its momentum, as it fluctuates within a horizontal range this week. https://cryptocomes.com/sites/default/files/inline-images/eth_1_2.jpg Lets have a closer look at what is happening on the hourly chart. Ethereum fluctuated within the range on Thursday. ETH/USD stays close to the support area at $596.08. What are the possible ways for Ethereum? 1. Red scenario (bearish). ETH/USD will break through the support area at $596.08 targeting the next support area at $566.90. 2. Orange scenario (neutral). The currency pair will move towards the closest resistance area at $626.66 and jump off this area, targeting support at $596.08. 3. Green scenario (bullish). Ethereum will grow towards $566.90 resistance area and break it through targeting the next resistance area at $662.39. Ripple (XRP/USD) Price Analysis, June 8 https://cryptocomes.com/sites/default/files/inline-images/xrp_3.jpg Ripple has lost almost two percent in the past 24 hours. The currency pair continues its upside correction to the previous downtrend, but it is below the green ascending trend line. It seems like XRP/USD has lost momentum currently. https://cryptocomes.com/sites/default/files/inline-images/xrp_1_1.jpg Lets have a closer look at what is going on the hourly chart. XRP/USD failed to break through 0.5 retracement level and reversed downwards. Ripple fluctuates close to 0.786 retracement level in the moment of writing. The possible ways for XRP/USD are the following: 1. Red scenario (bearish). The currency pair will break through the closest support area at 0.786 retracement level and run lower, targeting the next support area at $0.6519. 2. Orange scenario (neutral). XRP/USD will stay within the current range limited by the resistance at 0.618 and the support at 0.786 retracement level. 3. Green scenario (bullish). Ripple will jump over the resistance at 0.618 retracement level and move higher targeting 0.382 retracement level. Take a look at EOS (EOS/USD) and NEO (NEO/USD) Price Analysis, June 8 (https://cryptocomes.com/bitcoin-ethereum-ripple-neo-lose-momentum-eos-trying-to-restore-price-analysis-june-8) Title: Re: Daily price analysis BTC + ALTCOINS Post by: Dany44 on June 12, 2018, 08:40:29 AM Bitcoin, Ethereum, Ripple, EOS, NEO in Correction: Price Analysis, June 12
https://cryptocomes.com/sites/default/files/styles/912x570/public/2018-06/photo_2018-06-12_11-21-09.jpg?itok=cwzxJRMm (https://cryptocomes.com/bitcoin-ethereum-ripple-eos-neo-in-correction-price-analysis-june-12) Bitcoin and altcoins are correcting on Tuesday, investors still have fears The currency pairs from the top 20 are correcting on Tuesday after a serious decline during the weekend. We have mentioned in our last review from June 11 that the requirements from CFTC to offer transactions data to the US regulatory body was one of the reasons for this significant downside momentum. However, buyers have found ground on Monday as cryptocurrencies have stopped to decline and started to consolidate. Investors and traders still have fears as the price is unable to make a deeper correction in the moment of writing. As for the interesting news, Israeli regulators (https://cryptocomes.com/crypto-asset-regulation-getting-serious-in-israel) want to ensure protection to cryptocurrency investors and aspire to establish necessary regulatory measures. They want to prevent frauds as well. Bitcoin (BTC/USD) Price Analysis, June 12 https://cryptocomes.com/sites/default/files/inline-images/btc_6.jpg (https://cryptocomes.com/bitcoin-ethereum-ripple-eos-neo-in-correction-price-analysis-june-12) The currency pair added more than one percent in the past 24 hours. Bitcoin has stopped to decline after a huge downside momentum. However, BTC/USD is unable to make any significant correction by the moment of writing meaning buyers still hesitate to make serious steps. https://cryptocomes.com/sites/default/files/inline-images/btc_1_4.jpg (https://cryptocomes.com/bitcoin-ethereum-ripple-eos-neo-in-correction-price-analysis-june-12) Lets have a closer look at the currency pair. BTC price has retested the closest support area at $6,718 on Monday but was unable to run lower. Bitcoin has reached the closest resistance area later on Monday, but bulls had no opportunities to make even a fake breakout. The possible ways for the currency pair are the following: 1. Red scenario (bearish). Bitcoin will break through the closest support area at $6,718 and run lower targeting the next support area at $6,510. 2. Orange scenario (neutral). BTC/USD will stay within the current range, limited by the support area at $6,718 and the resistance area at $6,943. 3. Green scenario (bullish). The currency pair will break through the closest resistance area at $6,943 and run higher targeting the next resistance area at $7,181. Ethereum (ETH/USD) Price Analysis, June 12 https://cryptocomes.com/sites/default/files/inline-images/eth_6.jpg (https://cryptocomes.com/bitcoin-ethereum-ripple-eos-neo-in-correction-price-analysis-june-12) The currency pair has lost less than one percent in the past 24 hours but if we look at the hourly chart we can see that ETH/USD is in correction currently. The currency pair had significant losses during the weekend but stopped its decline on Monday. However, buyers are still hesitating to make serious steps. https://cryptocomes.com/sites/default/files/inline-images/eth_1_4.jpg (https://cryptocomes.com/bitcoin-ethereum-ripple-eos-neo-in-correction-price-analysis-june-12) Lets see whats going on the hourly chart. The currency pair has tested 3.618 retracement level on Monday but failed to break it through and reversed. ETH/USD ran towards the closest resistance area at $540.69 later. However, buyers were unable to touch this level. The possible ways for Ethereum are the following: 1. Red scenario (bearish). The currency pair will break through the 3.618 retracement level and move lower, targeting new local lows, established during the weekend. 2. Orange scenario (neutral). ETH/USD will stay within the current price range, limited by the support area at 3.618 retracement level and the resistance area at $540.69 without significant price changes. 3. Green scenario (bullish). Ethereum will break through the resistance area at $540.69 and run higher targeting the next resistance area at $566.90. Ripple (XRP/USD) Price Analysis, June 12 https://cryptocomes.com/sites/default/files/inline-images/xrp_5.jpg (https://cryptocomes.com/bitcoin-ethereum-ripple-eos-neo-in-correction-price-analysis-june-12) The currency pair added more than one percent in the past 24 hours. Ripple had significant losses during the weekend, but stopped its downside tendency on Monday and started a correction. However, buyers are still hesitating as the price remains close to Mondays levels. https://cryptocomes.com/sites/default/files/inline-images/xrp_1_3.jpg (https://cryptocomes.com/bitcoin-ethereum-ripple-eos-neo-in-correction-price-analysis-june-12) Lets have a closer look at what is going on the hourly chart. The currency pair has tested $0.5643 twice on Monday but was unable to break it through. XRP/USD has tested the closest resistance area at $0.5914 later. XRP price stays close to this area in the moment of writing. The possible ways for XRP/USD are the following: 1. Red scenario (bearish). Ripple will break through the closest support area at $0.5643 and run lower targeting the next support area at $0.5444 (local lows). 2. Orange scenario (neutral). The currency pair will stay within the current range, limited by the resistance area at $0.5914 and the support area at $0.5643 without significant changes. 3. Green scenario (bullish). XRP/USD will break through the resistance area at $0.5914 and run towards the next target at $0.6216. Take a look at EOS (EOS/USD) and NEO (NEO/USD) Price Analysis, June 12 (https://cryptocomes.com/bitcoin-ethereum-ripple-eos-neo-in-correction-price-analysis-june-12) Title: Re: Daily price analysis BTC + ALTCOINS Post by: Dany44 on June 13, 2018, 01:13:18 PM Bitcoin, Ethereum, Ripple, EOS, NEO Continue to Sink: Price Analysis, June 13
https://cryptocomes.com/sites/default/files/styles/912x570/public/2018-06/pricewise_13.06.18.jpg?itok=AKrUWGhQ (https://cryptocomes.com/bitcoin-ethereum-ripple-eos-neo-continue-to-sink-price-analysis-june-13) Bitcoin and altcoins continue to go down; investors still have fears on CFTC decision Investors still have negative moods and it is not clear whether they are going to change their mind in the nearest future. There are no positive events as well. The currency pairs are likely to develop their downside tendencies in this situation. As for the interesting news, Upbit exchange (https://cryptocomes.com/upbit-exchange-pays-out-those-reporting-scams-and-frauds) is going to reward those who will report scams and frauds. This plan is working already as 10 schemes of fraudulent were reported in the past several months. Another important thing to pay attention to is EOS voting (https://cryptocomes.com/eos-voting-continues-but-not-enough-to-launch-the-mainnet-big-wallets-withhold-from-participating), which is still on the way. In order to finish this procedure, 150 mln tokens are required. Bitcoin (BTC/USD) Price Analysis, June 13 https://cryptocomes.com/sites/default/files/inline-images/btc_13.06.jpg (https://cryptocomes.com/bitcoin-ethereum-ripple-eos-neo-continue-to-sink-price-analysis-june-13) Bitcoin has lost more than four percent in the past 24 hours. The currency pair continued to decline meaning buyers have no support currently to change the situation. BTC/USD is correcting in the moment of writing but there is a Flag pattern on the hourly chart, which indicates on the probability of further Bitcoin decline. https://cryptocomes.com/sites/default/files/inline-images/btc%201_13.06_0.jpg (https://cryptocomes.com/bitcoin-ethereum-ripple-eos-neo-continue-to-sink-price-analysis-june-13) Lets see closer what is going on the hourly chart. BTC/USD has established new lows on Tuesday as the currency pair has reached $6,510 support area. Sellers are unable to push it lower, but there are no signs of a reverse as well. The possible ways for Bitcoin are the following: 1. Red scenario (bearish). The currency pair will break through the support area at $6,510 and run lower, targeting the next support at 3.618 retracement level. 2. Orange scenario (neutral). Bitcoin will stay within the current range, limited by the support area at $6,510 and the resistance area at $6,718 without significant price changes. 3. Green scenario (bullish). BTC/USD will break through the resistance area at $6,718 targeting the next resistance area at $6,943. Ethereum (ETH/USD) Price Analysis, June 13 https://cryptocomes.com/sites/default/files/inline-images/eth_13.06.jpg (https://cryptocomes.com/bitcoin-ethereum-ripple-eos-neo-continue-to-sink-price-analysis-june-13) Ethereum has lost almost seven percent in the past 24 hours. The currency pair develops its downside tendency that started during the weekend. ETH/USD goes downwards in the moment of writing meaning buyers are still unable to find any support. https://cryptocomes.com/sites/default/files/inline-images/eth%201_13.06.jpg (https://cryptocomes.com/bitcoin-ethereum-ripple-eos-neo-continue-to-sink-price-analysis-june-13) Lets have a closer look at the Hourly chart. ETH/USD had a correction on Tuesday and reached $500.36 resistance area. However, buyers were unable to develop their progress and the price went downwards. Ethereum has reached the closest support area at $473.39. The possible ways for ETH/USD are the following: 1. Red scenario (bearish). The currency pair will break through the current support area at $473.39 and move lower, targeting the next support area at $453.24. 2. Orange scenario (neutral). The currency pair will stay within the current range, limited by the support area at $473.39 and the resistance area at $500.36. 3. Green scenario (bullish). Ethereum will break through the resistance area at $500.36, targeting the next resistance area at 3.618 retracement level. Ripple (XRP/USD) Price Analysis, June 13 https://cryptocomes.com/sites/default/files/inline-images/xrp_13.06.jpg (https://cryptocomes.com/bitcoin-ethereum-ripple-eos-neo-continue-to-sink-price-analysis-june-13) The currency pair has lost almost six percent in the past 24 hour. Ripple seems to develop its downside tendency, started on weekend. XRP/USD corrected on Tuesday, but resumed downtrend later. The currency pair develop its downside tendency in the moment of writing. https://cryptocomes.com/sites/default/files/inline-images/xrp%201_13.06.jpg (https://cryptocomes.com/bitcoin-ethereum-ripple-eos-neo-continue-to-sink-price-analysis-june-13) Lets have a closer look at what is going on the hourly chart. The currency pair has reached the resistance area at $0.5643 on Tuesday but buyers were unable to hold this level as XRP/USD retreated later and reached the support area at $0.5444. Ripple is testing this level in the moment of writing. The possible ways for XRP/USD are the following: 1. Red scenario (bearish). Ripple will break through the support area at $0.5444 and move lower, targeting the next support area at $0.5088. 2. Orange scenario (neutral). The currency pair will stay within the current range, limited by the resistance area at $0.5643 and the support area at $0.5444. 3. Green scenario (bullish). XRP/USD will break through the closest resistance area at $0.5643 and run higher, targeting the next resistance area at $0.5914. Take a look at EOS (EOS/USD) and NEO (NEO/USD) Price Analysis, June 13 (https://cryptocomes.com/bitcoin-ethereum-ripple-eos-neo-continue-to-sink-price-analysis-june-13) Title: Re: Daily price analysis BTC + ALTCOINS Post by: Dany44 on June 15, 2018, 11:18:12 AM Bitcoin, Ethereum, Litecoin, EOS Bounce Back, Ripple, NEM Hovering: Price Analysis, June 15
https://cryptocomes.com/sites/default/files/styles/912x570/public/2018-06/photo_2018-06-15_11-36-29.jpg?itok=cpPpxyHf (https://cryptocomes.com/bitcoin-ethereum-litecoin-eos-bounce-back-ripple-nem-hovering-price-analysis-june-15) Bitcoin and most altcoins bounce back after a sharp fall, have positive outlooks in short-term Bitcoin and altcoins develop their corrections and establish new local highs. It is hard to say now whether this tendency is mid-term or short-term as experts have different opinion on the reasons of this huge downtrend that we can see in midterm. Some experts think that this significant crypto market decline is the result of 2017s cryptocurrencies hype and now the price is trying to find its balance. Another opinion about this huge downtrend is that the US regulatory body, CFTC requires transactions data from major US cryptocurrency exchanges. Anyway, the general situation in this industry indicates on the probability of further decline of all cryptos. Bitcoin (BTC/USD) Price Analysis, June 15 https://cryptocomes.com/sites/default/files/inline-images/image2_2.jpg (https://cryptocomes.com/bitcoin-ethereum-litecoin-eos-bounce-back-ripple-nem-hovering-price-analysis-june-15) Bitcoin added more than one percent in the past 24 hours. The currency pair bounced back the support area at 3.618 retracement level and started its upside tendency this week. BTC/USD established new highs on Thursday/Friday. https://cryptocomes.com/sites/default/files/inline-images/image5_0.jpg (https://cryptocomes.com/bitcoin-ethereum-litecoin-eos-bounce-back-ripple-nem-hovering-price-analysis-june-15) Lets get closer to the current situation on the hourly chart. The currency pair ran upwards on Thursday and jumped over the resistance area at $6,510. BTC/USD moved higher later and reached $6,718. However, Bitcoin failed to break through this level. The possible ways for Bitcoin are the following: 1. Red scenario (bearish). The currency pair will test the support area at $6,510 and if successful, Bitcoin will develop its downside move targeting the next support at 3.618 retracement level. 2. Orange scenario (neutral). BTC/USD will stay within the current range, limited by $6,718 resistance area and $6,510 support area. 3. Green scenario (bullish). Bitcoin will test the resistance area at $6,718 and move higher, targeting the next resistance at $6,943. Ethereum (ETH/USD) Price Analysis, June 15 https://cryptocomes.com/sites/default/files/inline-images/image10_0.jpg (https://cryptocomes.com/bitcoin-ethereum-litecoin-eos-bounce-back-ripple-nem-hovering-price-analysis-june-15) The currency pair has added more than four percent in the past 24 hours. Ethereum develops its upside corrective movement. The currency pair has found support on Wednesday and established new highs on Thursday. ETH/USD still has a positive outlook in short term. https://cryptocomes.com/sites/default/files/inline-images/image6_1.jpg (https://cryptocomes.com/bitcoin-ethereum-litecoin-eos-bounce-back-ripple-nem-hovering-price-analysis-june-15) Lets see closer what is going on the hourly chart. The currency pair has broker through the resistance area at $500.36 and moved higher. However, ETH/USD failed to reach the next resistance area at $540.69 and returned to $500.36. The possible ways for Ethereum are the following: 1. Red scenario (bearish). The currency pair will break through the current support area at $500.36 and move lower, targeting the next support at $473.39. 2. Orange scenario (neutral). Ethereum will stay within the current price range, limited by the resistance area at $540.69 and the support area at $500.36. 3. Green scenario (bullish). ETH/USD will test the resistance at $540.69 and if successful, will go higher, aiming at the next resistance area at $566.90. Ripple (XRP/USD) Price analysis, June 15 https://cryptocomes.com/sites/default/files/inline-images/image8_0.jpg (https://cryptocomes.com/bitcoin-ethereum-litecoin-eos-bounce-back-ripple-nem-hovering-price-analysis-june-15) The currency pair has lost less than one percent in the past 24 hours. Ripple develops its upside correction currently but fails to grow significantly as the currency pair fluctuates almost on the same levels on Friday as compared to Thursday. https://cryptocomes.com/sites/default/files/inline-images/image7_0.jpg (https://cryptocomes.com/bitcoin-ethereum-litecoin-eos-bounce-back-ripple-nem-hovering-price-analysis-june-15) Lets see closer what is going on the hourly chart. The currency pair has reached the resistance area at $0.5643 on Thursday, but failed to develop the progress and retreated towards the support area at $0.5444. Ripple stays there currently. The possible ways for Ripple are the following: 1. Red scenario (bearish). The currency pair will break through the support area at $0.5444 and move lower aiming at the next support area at $0.5088. 2. Orange scenario (neutral). Ripple will stay within the current range, limited by the resistance area at $0.5643 and the support area at $0.5444. 3. Green scenario (bullish). XRP/USD will rise towards the resistance are at $0.5643 and break it through. The next step for XRP/USD is to target the next resistance area at $0.5914. Take a look at EOS (EOS/USD) and NEM (XEM/USD) Price Analysis, June 15 (https://cryptocomes.com/bitcoin-ethereum-litecoin-eos-bounce-back-ripple-nem-hovering-price-analysis-june-15) Title: Re: Daily price analysis BTC + ALTCOINS Post by: btc78 on June 15, 2018, 11:36:28 AM Bitcoin, Ethereum, Litecoin, EOS Bounce Back, Ripple, NEM Hovering: Price Analysis, June 15 Seems like the growth is too slow than the fall,but lucky were back in greenhttps://cryptocomes.com/sites/default/files/styles/912x570/public/2018-06/photo_2018-06-15_11-36-29.jpg?itok=cpPpxyHf (https://cryptocomes.com/bitcoin-ethereum-litecoin-eos-bounce-back-ripple-nem-hovering-price-analysis-june-15) Bitcoin and most altcoins bounce back after a sharp fall, have positive outlooks in short-term Bitcoin and altcoins develop their corrections and establish new local highs. It is hard to say now whether this tendency is mid-term or short-term as experts have different opinion on the reasons of this huge downtrend that we can see in midterm. Some experts think that this significant crypto market decline is the result of 2017s cryptocurrencies hype and now the price is trying to find its balance. Another opinion about this huge downtrend is that the US regulatory body, CFTC requires transactions data from major US cryptocurrency exchanges. Anyway, the general situation in this industry indicates on the probability of further decline of all cryptos. Bitcoin (BTC/USD) Price Analysis, June 15 https://cryptocomes.com/sites/default/files/inline-images/image2_2.jpg (https://cryptocomes.com/bitcoin-ethereum-litecoin-eos-bounce-back-ripple-nem-hovering-price-analysis-june-15) Bitcoin added more than one percent in the past 24 hours. The currency pair bounced back the support area at 3.618 retracement level and started its upside tendency this week. BTC/USD established new highs on Thursday/Friday. https://cryptocomes.com/sites/default/files/inline-images/image5_0.jpg (https://cryptocomes.com/bitcoin-ethereum-litecoin-eos-bounce-back-ripple-nem-hovering-price-analysis-june-15) Lets get closer to the current situation on the hourly chart. The currency pair ran upwards on Thursday and jumped over the resistance area at $6,510. BTC/USD moved higher later and reached $6,718. However, Bitcoin failed to break through this level. The possible ways for Bitcoin are the following: 1. Red scenario (bearish). The currency pair will test the support area at $6,510 and if successful, Bitcoin will develop its downside move targeting the next support at 3.618 retracement level. 2. Orange scenario (neutral). BTC/USD will stay within the current range, limited by $6,718 resistance area and $6,510 support area. 3. Green scenario (bullish). Bitcoin will test the resistance area at $6,718 and move higher, targeting the next resistance at $6,943. Ethereum (ETH/USD) Price Analysis, June 15 https://cryptocomes.com/sites/default/files/inline-images/image10_0.jpg (https://cryptocomes.com/bitcoin-ethereum-litecoin-eos-bounce-back-ripple-nem-hovering-price-analysis-june-15) The currency pair has added more than four percent in the past 24 hours. Ethereum develops its upside corrective movement. The currency pair has found support on Wednesday and established new highs on Thursday. ETH/USD still has a positive outlook in short term. https://cryptocomes.com/sites/default/files/inline-images/image6_1.jpg (https://cryptocomes.com/bitcoin-ethereum-litecoin-eos-bounce-back-ripple-nem-hovering-price-analysis-june-15) Lets see closer what is going on the hourly chart. The currency pair has broker through the resistance area at $500.36 and moved higher. However, ETH/USD failed to reach the next resistance area at $540.69 and returned to $500.36. The possible ways for Ethereum are the following: 1. Red scenario (bearish). The currency pair will break through the current support area at $500.36 and move lower, targeting the next support at $473.39. 2. Orange scenario (neutral). Ethereum will stay within the current price range, limited by the resistance area at $540.69 and the support area at $500.36. 3. Green scenario (bullish). ETH/USD will test the resistance at $540.69 and if successful, will go higher, aiming at the next resistance area at $566.90. Ripple (XRP/USD) Price analysis, June 15 https://cryptocomes.com/sites/default/files/inline-images/image8_0.jpg (https://cryptocomes.com/bitcoin-ethereum-litecoin-eos-bounce-back-ripple-nem-hovering-price-analysis-june-15) The currency pair has lost less than one percent in the past 24 hours. Ripple develops its upside correction currently but fails to grow significantly as the currency pair fluctuates almost on the same levels on Friday as compared to Thursday. https://cryptocomes.com/sites/default/files/inline-images/image7_0.jpg (https://cryptocomes.com/bitcoin-ethereum-litecoin-eos-bounce-back-ripple-nem-hovering-price-analysis-june-15) Lets see closer what is going on the hourly chart. The currency pair has reached the resistance area at $0.5643 on Thursday, but failed to develop the progress and retreated towards the support area at $0.5444. Ripple stays there currently. The possible ways for Ripple are the following: 1. Red scenario (bearish). The currency pair will break through the support area at $0.5444 and move lower aiming at the next support area at $0.5088. 2. Orange scenario (neutral). Ripple will stay within the current range, limited by the resistance area at $0.5643 and the support area at $0.5444. 3. Green scenario (bullish). XRP/USD will rise towards the resistance are at $0.5643 and break it through. The next step for XRP/USD is to target the next resistance area at $0.5914. Take a look at EOS (EOS/USD) and NEM (XEM/USD) Price Analysis, June 15 (https://cryptocomes.com/bitcoin-ethereum-litecoin-eos-bounce-back-ripple-nem-hovering-price-analysis-june-15) Thank you for this kind of updates we need more like this specially for the daytraders because they're the most affected when the market speeds moving either ups or down Title: Re: Daily price analysis BTC + ALTCOINS Post by: keanne_isaac on June 15, 2018, 01:44:26 PM it's almost like me where I'm always wrong in making a decision to buy or sell, maybe I often talk that we need to learn from mistakes but in fact it's very difficult to do. Me too.its easy to say buy on deep and sell on profit but once you are in real situation its hard to determine when coins on deep that is why when i bought coins and it keep falling down i buy again to average down my loss hoping once market recover i can easily recover my loss. crypto market is really unpredictable you need patience and additional funds to back up your investment.Title: Re: Daily price analysis BTC + ALTCOINS Post by: coffigayo on June 15, 2018, 01:45:14 PM Yes Bitcoin is stable, some Altcoin is up. The worst is really for sure I think it is a tough time to make an investment decision especially for new investors. I see that EOS has evolved not only against other cryptos but also against fiat from the last few days. It's listed on more exchanges so it gives a boost.
Title: Re: Daily price analysis BTC + ALTCOINS Post by: ohkkstaaahp on June 15, 2018, 02:15:17 PM it's almost like me where I'm always wrong in making a decision to buy or sell, maybe I often talk that we need to learn from mistakes but in fact it's very difficult to do. Misinformed people are the ones who are always successful. Do not give up when we fail and do not be discouraged when we are not successful. I believe that those who have the will to rise up and remain faithful will be the ones who win.Title: Re: Daily price analysis BTC + ALTCOINS Post by: bennie4 on June 15, 2018, 03:00:31 PM Here will be the latest price analysis for BTC and altcoins. You can see that after touching $ 6100, the current price of bitcoin has recovered to $ 6500 and is showing signs of sideways. The strong rebound of bitcoin prices makes the market more vibrant again, so many altcoin are recovering very strongly and I believe this is the time for you to trade altcoin.We appreciate your opinion. Daily reviews are also placed on https://cryptocomes.com/pricewise (https://cryptocomes.com/pricewise) https://i.imgur.com/CuYXzTr.png (https://cryptocomes.com/pricewise) Title: Re: Daily price analysis BTC + ALTCOINS Post by: Keyboard PC on June 15, 2018, 04:01:57 PM I usually only see the daily price of bitcoin from https://coinmarketcap.com/ actually I not only see bitcoin price but I also see altcoin price that I have for my monitor therefore I choose https://coinmarketcap.com/ for monitoring price.
Title: Re: Daily price analysis BTC + ALTCOINS Post by: stomachgrowls on June 15, 2018, 05:17:29 PM it's almost like me where I'm always wrong in making a decision to buy or sell, maybe I often talk that we need to learn from mistakes but in fact it's very difficult to do. sounds stressed. this is an emotional battle.and the winner is the one who can control it. do not let the chart affect you and let your beliefs play. just HOLD ;D it's almost like me where I'm always wrong in making a decision to buy or sell, maybe I often talk that we need to learn from mistakes but in fact it's very difficult to do. Misinformed people are the ones who are always successful. Do not give up when we fail and do not be discouraged when we are not successful. I believe that those who have the will to rise up and remain faithful will be the ones who win.Title: Re: Daily price analysis BTC + ALTCOINS Post by: Dany44 on June 18, 2018, 10:34:10 AM Bitcoin, Ethereum, Ripple, EOS, NEM at New Lows, But Buyers Have Hopes: Price Analysis, June 18
https://cryptocomes.com/sites/default/files/styles/912x570/public/2018-06/Coins_18.06.jpg?itok=dB0DhKyg (https://cryptocomes.com/bitcoin-ethereum-ripple-eos-nem-at-new-lows-but-buyers-have-hopes-price-analysis-june-18) Bitcoin and altcoins make new lows, but buyers have hopes to change the situation Bitcoin and altcoins have established new lows during the weekend, but their fluctuations were calm without significant price changes meaning the cryptos seem to find support finally. There was no important news in the past 36 hours. As for interesting events, it is important to mention that National Bank of Romania (https://cryptocomes.com/bank-of-romania-digital-coins-cannot-replace-real-money-yet-but-blockchain-is-worth-exploring) had comments on cryptocurrencies. The governor of this structure, Mugur Isarescu stated that cryptos cannot be adopted as currencies because they fail to perform functions of traditional fiat money. Isarescu added that cryptos emission is done by anonymous persons and not by authorized bodies. This may increase frauds and scams in future. As for Blockchain, Isarescu mentioned that the technology is worth studying. Romanian authorities are ready to adopt it but the crypto market needs some serious adjustments to be adopted. Bitcoin (BTC/USD) Price Analysis, June 18 https://cryptocomes.com/sites/default/files/inline-images/btc_18.06.jpg (https://cryptocomes.com/bitcoin-ethereum-ripple-eos-nem-at-new-lows-but-buyers-have-hopes-price-analysis-june-18) The currency pair has lost more than one percent in the past 24 hours. However, in general, the situation is neutral meaning sellers have no power to push Bitcoin lower. The buyers are hesitating but have chances to change the situation while there is no important news. https://cryptocomes.com/sites/default/files/inline-images/btc_1_18.06.jpg (https://cryptocomes.com/bitcoin-ethereum-ripple-eos-nem-at-new-lows-but-buyers-have-hopes-price-analysis-june-18) Lets zoom in to see the current situation. The currency pair fluctuated with no clear direction during the weekend below $6,510 resistance area. However, BTC/USD was unable to reach the closest support at 3.618 as well. The possible ways for Bitcoin are the following: 1. Red scenario (bearish). The currency pair will break through the support at 3.618 retracement level and move lower, targeting the basis of the Fibonacci tool. 2. Orange scenario (neutral). Bitcoin will stay within the current range, limited by the resistance area at $6,510 and the support at 3.618 retracement level with no significant price changes. 3. Green scenario (bullish). The currency pair will break through the closest resistance area at $6,510 and move higher, targeting the next resistance at $6,718. Ethereum (ETH/USD) Price Analysis, June 18 https://cryptocomes.com/sites/default/files/inline-images/eth_18.06.jpg (https://cryptocomes.com/bitcoin-ethereum-ripple-eos-nem-at-new-lows-but-buyers-have-hopes-price-analysis-june-18) Ethereum has lost more than one percent in the past 24 hours. The currency pair fluctuates with no clear direction meaning sellers have lost initiative, but bulls are still unable to drive the currency pair higher. ETH/USD has established new local lows, but the currency pair looks promising in the moment of writing. https://cryptocomes.com/sites/default/files/inline-images/eth_1_18.06.jpg (https://cryptocomes.com/bitcoin-ethereum-ripple-eos-nem-at-new-lows-but-buyers-have-hopes-price-analysis-june-18) Lets have a closer look at the currency pair on the hourly chart. Ethereum has reached 3.618 retracement level during the weekend but failed to make any further progress and retreated. The currency pair declined below the support area at $500.36. It fluctuates close to this area in the moment of writing. The possible ways for ETH/USD are the following: 1. Red scenario (bearish). The currency pair will break through the support area at $473.39 and move lower, targeting the next support at $453.24. 2. Orange scenario (neutral). Ethereum will stay within the current range, limited by the resistance area at $500.36 and the support at $473.39 without significant changes. 3. Green scenario (bullish). ETH/USD will break through the resistance area at $500.36 and run higher, targeting the next resistance at $540.69. Ripple (XRP/USD) Price analysis, June 18 https://cryptocomes.com/sites/default/files/inline-images/xrp_18.06.jpg (https://cryptocomes.com/bitcoin-ethereum-ripple-eos-nem-at-new-lows-but-buyers-have-hopes-price-analysis-june-18) The currency pair has lost more than two percent in the past 24 hours. However, Ripple has no clear bias currently and the currency pair can develop its upside correction in the nearest future. XRP/USD reached new tops during the weekend but buyers were unable to develop their progress. https://cryptocomes.com/sites/default/files/inline-images/xrp_1_18.06.jpg (https://cryptocomes.com/bitcoin-ethereum-ripple-eos-nem-at-new-lows-but-buyers-have-hopes-price-analysis-june-18) Lets get closer to the price on the hourly chart. The currency pair has reached $0.5643 resistance area during the weekend, but retreated from there and crossed the support area at $0.5444. XRP/USD reached the next support area at $0.5088 in the moment of writing. The possible ways for Ripple are the following: 1. Red scenario (bearish). The currency pair will break through the support area at $0.5088 and move lower targeting the next support area at $0.4918. 2. Orange scenario (neutral). Ripple will stay within the current range between the resistance area at $0.5444 and the support at $0.5088. 3. Green scenario (bullish). The currency pair will cross the resistance area at $0.5444 and run higher, targeting the next resistance at $0.5643. Take a look at EOS (EOS/USD) and NEM (XEM/USD) Price Analysis, June 18 (https://cryptocomes.com/bitcoin-ethereum-ripple-eos-nem-at-new-lows-but-buyers-have-hopes-price-analysis-june-18) Title: Re: Daily price analysis BTC + ALTCOINS Post by: Dany44 on June 19, 2018, 12:40:10 PM Bitcoin, Ethereum, Ripple, EOS, NEM Grow Finally, Buyers Dominate Crypto Markets: Price Analysis, June 19
https://cryptocomes.com/sites/default/files/styles/912x570/public/2018-06/photo_2018-06-19_11-22-46.jpg?itok=wf9UZDaG (https://cryptocomes.com/bitcoin-ethereum-ripple-eos-nem-grow-finally-buyers-dominate-crypto-markets-price-analysis-june-19) Bitcoin and other cryptos go green on Tuesday, buyers finally take control over the markets Bitcoin and altcoins are green on Tuesday as buyers are controlling the markets. Cryptos are trying to return their positions that they have lost during the past week. There are no important events for this and the growth is likely to be a part of an upside correction. As for interesting news, cryptocurrencies are accepted in Russia during FIFA 2018 World Cup (https://cryptocomes.com/bitcoin-accepted-in-russia-during-fifa-world-cup-despite-us-sanctions). One cannot buy tickets directly, but crypto users may choose several methods including banking cards like Wirex or Epayments to purchase anything. After the US has declared sanction against Russia, Mastercard and Visa have stopped working with some Russian banks. Cryptos help visitors and football fans pay for goods and services. EOS still suffers from different issues. The Mainnet is down (https://cryptocomes.com/eos-net-froze-after-launch-back-online-problems-to-come) and nobody knows when the issue will be fixed. Bitcoin (BTC/USD) Price analysis, June 19 https://cryptocomes.com/sites/default/files/inline-images/btc_8.jpg (https://cryptocomes.com/bitcoin-ethereum-ripple-eos-nem-grow-finally-buyers-dominate-crypto-markets-price-analysis-june-19) Bitcoin has added nearly four percent in the past 24 hours. The currency pair established new tops on Tuesday as it followed the green scenario from our latest BTC/USD price analysis. Bitcoin forms a kind of a flag pattern in the moment of writing meaning the currency pair is able to develop its upside progress on Tuesday. https://cryptocomes.com/sites/default/files/inline-images/btc_1_6.jpg (https://cryptocomes.com/bitcoin-ethereum-ripple-eos-nem-grow-finally-buyers-dominate-crypto-markets-price-analysis-june-19) Lets see closer what is going on the hourly chart. Bitcoin has reached $6,718 resistance area on Monday and tested it several times. The currency pair fluctuates close to this level in the moment of writing. There was a fake breakout, but the price returned below the resistance area. The possible ways for BTC/USD are the following: 1. Red scenario (bearish). The currency pair will reach the support area at $6,510 and jump over it targeting the next support at 3.618 retracement level. 2. Orange scenario (neutral). Bitcoin will stay within the current price range, limited by the resistance area at $6,718 and the support area at $6,510. 3. Green scenario (bullish). BTC/USD will test the resistance area at $6,718 again and jump over it, targeting the next resistance area at $6,943. Ethereum (ETH/USD) Price analysis, June 19 https://cryptocomes.com/sites/default/files/inline-images/eth_8.jpg (https://cryptocomes.com/bitcoin-ethereum-ripple-eos-nem-grow-finally-buyers-dominate-crypto-markets-price-analysis-june-19) Ethereum has added more than four percent in the past 24 hours. The currency pair managed to establish new highs on Monday. ETH/USD forms a flag pattern currently meaning the currency pair has potential to develop its growth on Tuesday. https://cryptocomes.com/sites/default/files/inline-images/eth_1_6.jpg (https://cryptocomes.com/bitcoin-ethereum-ripple-eos-nem-grow-finally-buyers-dominate-crypto-markets-price-analysis-june-19) Ethereum seems to finally find support and looks promising in the moment of writing. However, lets see closer what is going on the hourly chart. ETH price has followed green scenario from our latest ETH/USD review but failed to reach the next resistance area at $540.69. The possible ways for ETH/USD are the following: 1. Red scenario (bearish). Ethereum will reach the support area at $500.36 to test it. If successful, sellers will be able to push the currency pair lower, targeting the next support at $473.39. 2. Orange scenario (neutral). ETH/USD will stay within the current price range between the resistance area at $540.69 and the support at $500.36. 3. Green scenario (bullish). The currency pair will test the resistance at $540.69 and if successful, buyers will be able to drive Ethereum higher, aiming at $566.90. Ripple (XRP/USD) Price analysis, June 19 https://cryptocomes.com/sites/default/files/inline-images/xrp_7.jpg (https://cryptocomes.com/bitcoin-ethereum-ripple-eos-nem-grow-finally-buyers-dominate-crypto-markets-price-analysis-june-19) The currency pair has added more than two percent in the past 24 hours. Ripple reached new tops on Monday. XRP/USD has potential to develop its upside correction in the nearest future. The currency pair seems to form a flag pattern on the hourly chart. https://cryptocomes.com/sites/default/files/inline-images/xrp%20%281%29.jpg (https://cryptocomes.com/bitcoin-ethereum-ripple-eos-nem-grow-finally-buyers-dominate-crypto-markets-price-analysis-june-19) Ripple has found support at $0.5088 support area. The currency pair moved higher on Monday and tested the resistance area at $0.5444 but failed to jump over it. There was a fake breakout, but XRP/USD retreated from this area later is fluctuated below it. The possible ways for XRP/USD are the following: 1. Red scenario (bearish). The currency pair will test the support area at $0.5088 and is successful, XRP price will run lower. 2. Orange scenario (neutral). XRP/USD will stay within that current range, limited by the resistance area at $0.5444 and the support at $0.5088. 3. Green scenario (bullish). Ripple will break through the resistance area at $0.5444 and move higher, targeting the next resistance at $0.5643. Take a look at EOS (EOS/USD) and NEM (XEM/USD) Price Analysis, June 19 (https://cryptocomes.com/bitcoin-ethereum-ripple-eos-nem-grow-finally-buyers-dominate-crypto-markets-price-analysis-june-19) Title: Re: Daily price analysis BTC + ALTCOINS Post by: Dany44 on June 20, 2018, 12:27:15 PM Small Gains, Small Losses for Bitcoin, Ethereum, Ripple, EOS, NEM: Price Analysis, June 20
https://cryptocomes.com/sites/default/files/styles/912x570/public/2018-06/photo_2018-06-20_13-26-39.jpg?itok=GHhLLqmg (https://cryptocomes.com/small-gains-small-losses-for-bitcoin-ethereum-ripple-eos-nem-price-analysis-june-20) Bitcoin and other cryptos neutral on Wednesday, no significant price changes There were no significant changes in the past 24 hours. Bitcoin and other cryptos remain neutral on Wednesday making small gains and small losses. The industry seems to be at crossroads looking for news and events to make further decisions. As for the interesting news, there was a report from Hedge Fund Research (https://cryptocomes.com/blockchain-investment-increases-in-asia-despite-crypto-market-slump) (a reputable hedge fund analytics agency) showing that average profits of hedge funds investing in digital assets are 35 percent lower in 2018. Those investment institutions have reported an average profit of 45 percent in spring, but it is still not enough to overcome the numbers of 2017. Another interesting news comes from the United States. Famous crypto industry expert John McAfee (https://cryptocomes.com/sec-threatens-john-mcafee-no-more-ico-prophecies) will no longer give his prophecies on coins as he was contacted by the US SEC regulator and asked to stop his predictions. Bitcoin (BTC/USD) Price analysis, June 20 https://cryptocomes.com/sites/default/files/inline-images/btc_9.jpg (https://cryptocomes.com/small-gains-small-losses-for-bitcoin-ethereum-ripple-eos-nem-price-analysis-june-20) Bitcoin had almost no changes in the past 24 hours as the cryptocurrency added less than two percent. When we look at the hourly chart we can see that there is no clear tendency currently meaning bulls and bears are in balance and hesitate to make any further steps. https://cryptocomes.com/sites/default/files/inline-images/btc_1_7.jpg (https://cryptocomes.com/small-gains-small-losses-for-bitcoin-ethereum-ripple-eos-nem-price-analysis-june-20) The closer look at the hourly chart helps to understand short-term tendencies. BTC price has tested the resistance area at $6,718 but failed to jump over it. There was a Shooting Star candlestick pattern on Tuesday and the currency pair declined lately following to this signal. BTC/USD stays in the middle of a horizontal range currently with no clear bias. The possible ways for Bitcoin are the following: 1. Red scenario (bearish). The currency pair will test the support at $6,510 and if successful, bears will have an opportunity to push BTC/USD lower towards 3.618 retracement level. 2. Orange scenario (neutral). Bitcoin will stay between the resistance area at $6,718 and the support at $6,510. 3. Green scenario (bullish). BTC/USD will test the resistance area at $6,718. If successful, buyers will be able to drive the currency pair higher, targeting the resistance at $6,943. Ethereum (ETH/USD) Price analysis, June 20 https://cryptocomes.com/sites/default/files/inline-images/eth_9.jpg (https://cryptocomes.com/small-gains-small-losses-for-bitcoin-ethereum-ripple-eos-nem-price-analysis-june-20) The currency pair remained neutral as Ethereum has added less than one percent in the past 24 hours. The situation on the hourly chart, in general, is unclear as we have no direction. Buyers and sellers are in balance in the moment of writing and hesitate to make any further steps. https://cryptocomes.com/sites/default/files/inline-images/eth_1_7.jpg (https://cryptocomes.com/small-gains-small-losses-for-bitcoin-ethereum-ripple-eos-nem-price-analysis-june-20) When we look closer at the hourly chart we can see that Ethereum has tested the resistance area at $540.69 on Tuesday but failed to break it through and retreated later. The currency pair stays within a horizontal range at the moment of writing. The possible ways for Ethereum are the following: 1. Red scenario (bearish). The currency pair is going to test the support area at $500.36 and if successful, bears will be able to push ETH/USD lower, targeting the next support at $473.39. 2. Orange scenario (neutral). ETH/USD will stay within the current range limited by the resistance area at $540.69 and the support area at $500.36. 3. Green scenario (bullish). Ethereum will test the resistance area at $540.69 and if successful, buyers will be able to drive the currency pair higher, targeting the next resistance at $566.90. Ripple (XRP/USD) Price analysis, June 20 https://cryptocomes.com/sites/default/files/inline-images/xrp_1_5.jpg (https://cryptocomes.com/small-gains-small-losses-for-bitcoin-ethereum-ripple-eos-nem-price-analysis-june-20) Ripple had almost no changes in the past 24 hours as the currency pair lost less than two percent. The situation is unclear in general as there is no tendency at the moment of writing. Bulls and bears have found balance and hesitate to make any further steps. https://cryptocomes.com/sites/default/files/inline-images/xrp_2_0.jpg (https://cryptocomes.com/small-gains-small-losses-for-bitcoin-ethereum-ripple-eos-nem-price-analysis-june-20) When we look closer at the hourly chart we can see that XRP/USD has tested the resistance area at $0.5444 and almost reached the next resistance at $0.5643 but retreated below $0.5444 later. The currency pair stays in the middle of a range in the moment of writing. The possible ways for XRP/USD are the following: 1. Red scenario (bearish). Ripple will break through the support area at $0.5088 and move lower targeting the next support area at $0.4918. 2. Orange scenario (neutral). The currency pair will stay within the current range limited by the resistance area at $0.5444 and the support at $0.5088. 3. Green scenario (bullish). XRP/USD will break through the resistance area at $0.5444 and move higher targeting the next resistance at $0.5643. Take a look at EOS (EOS/USD) and NEM (XEM/USD) Price Analysis, June 20 (https://cryptocomes.com/small-gains-small-losses-for-bitcoin-ethereum-ripple-eos-nem-price-analysis-june-20) Title: Re: Daily price analysis BTC + ALTCOINS Post by: collins3 on June 20, 2018, 02:52:07 PM Here will be the latest price analysis for BTC and altcoins. You can see that the price of bitcoin and altcoin today has a huge adjustment, when the price of bitocin reduced to 6400 $ then the girl altcoin also fell sharply and now the price of bitcoin is recovering to 6800 $ And altcoin is showing signs of recovery but very slowly. I believe that at this time you can buy altcoin and trade in the short term. The market is in the downtrend stage so bitcoin prices will probably continue to fall sharply at any time.We appreciate your opinion. Daily reviews are also placed on https://cryptocomes.com/pricewise (https://cryptocomes.com/pricewise) https://i.imgur.com/CuYXzTr.png (https://cryptocomes.com/pricewise) Title: Re: Daily price analysis BTC + ALTCOINS Post by: Dany44 on June 20, 2018, 02:57:34 PM Here will be the latest price analysis for BTC and altcoins. You can see that the price of bitcoin and altcoin today has a huge adjustment, when the price of bitocin reduced to 6400 $ then the girl altcoin also fell sharply and now the price of bitcoin is recovering to 6800 $ And altcoin is showing signs of recovery but very slowly. I believe that at this time you can buy altcoin and trade in the short term. The market is in the downtrend stage so bitcoin prices will probably continue to fall sharply at any time.We appreciate your opinion. Daily reviews are also placed on https://cryptocomes.com/pricewise (https://cryptocomes.com/pricewise) https://i.imgur.com/CuYXzTr.png (https://cryptocomes.com/pricewise) all eyes on BTC anyway Title: Re: Daily price analysis BTC + ALTCOINS Post by: Dany44 on June 21, 2018, 01:01:48 PM Bitcoin, Ethereum, EOS Dead Calm, ETC Goes on Rampage: Price Analysis, June 21
https://cryptocomes.com/sites/default/files/styles/912x570/public/2018-06/photo_2018-06-21_10-53-33.jpg?itok=5SOVbErx (https://cryptocomes.com/bitcoin-ethereum-eos-dead-calm-etc-goes-on-rampage-price-analysis-june-21) Flat movement continues for Bitcoin and most altcoins, with one remarkable exclusion By Thursday 21st the market continues its lateral movement, while neither bears nor bulls fully control the prices. The main concern is that trading volumes remain low proving that the situation may change at any time. Todays balance of forces somehow reminds us those of May 12th when players also froze in indecision unless one long green $1,000 candle broke Bitcoins bearish pattern and unambiguously pointed on further direction. In the meantime in anticipation of a whales turn even significant news are unable to shake the market. Crypto prices almost havent reacted to the hack of Bithumb (https://cryptocomes.com/bithumb-biggest-korean-crypto-exchange-hacked-with-30-mln-gone-promises-customers-will-get-refund), the sixth biggest exchange. Our readers can compare this occasion with Coinrails hack (90th exchange by trading volumes) on June 11th, which allegedly caused sharp markets fall. As for the positive news, we cant but draw readers attention to the latest Tether transparency update. Directors of the scandalous Stablecoin affirm that the companys balance sheets have successfully undergone audit procedures and that all USDT tokens are fully backed by fiat currency on their banking accounts. The question is whether this news will be enough to finally inspire buyers for action? Bitcoin is moving towards a critical point https://cryptocomes.com/sites/default/files/inline-images/BTCUSDjune21.PNG (https://cryptocomes.com/bitcoin-ethereum-eos-dead-calm-etc-goes-on-rampage-price-analysis-june-21) The flat movement will not last forever and we believe that the next couple of days will finally reveal Bitcoin's (and the whole market's) further destiny. On the daily chart, one can notice an intersection of the long-term descending channel (marked in red) and young ascending trend (thin green line). The situation becomes even spicier if we look at close proximity of the long-term ascending trend (orange line) and 0.786 Fibonacci retracement. Trading volumes which were steadily declining since the end of March have finally stabilized which means that all stars came together and either bears or bulls (we bet on bulls) should soon make their move. Their target is clearly visible and after breaking through descending channel at $6,800 and them through long-term ascending trend line which now acts as resistance at $7,000 we may see a rally to $8,000. Further decline is less likely as the bears should be out of fuel after long run. A forming bearish wedge, however, may give them some strength and if they manage to win the battle for $6,000 a door to $5,500 will be easily open. We recommend our readers to watch closely how the price will break through the triangle and do not hurry to make a trading decision right now. ETH/USD looks promising provided that Bitcoin will not fail https://cryptocomes.com/sites/default/files/inline-images/ETHUSDjune21.PNG (https://cryptocomes.com/bitcoin-ethereum-eos-dead-calm-etc-goes-on-rampage-price-analysis-june-21) In comparison with other top altcoins Ethereum -0.33 percent looks good for the several reasons. First, and the most important during long Mays and Junes downtrend the coin didnt updated Marchs minimum (when even Bitcoin -0.49 percent was very close to it). Second, after first shy evidence of possible market reversal, ETH recovered faster than most of the cryptos. Breaking through descending channel in past 24 hours is another positive sign, although not very encouraging the upward movement was not continued for now. With all eyes on Bitcoin -0.49% percent , we may establish further bulls targets which are $570 coinciding with the nearest support-resitance level and psychological $600 defined by 0.382 meaning of Fibonacci grid. In case of decline, the main task for bulls is not to let ETH break through the bottom line of the young ascending channel although the range of $500-$520 should stop the bears anyway, at least for some time. EOS/USD is ready for a breakthrough https://cryptocomes.com/sites/default/files/inline-images/EOSUSDjune21PNG.PNG (https://cryptocomes.com/bitcoin-ethereum-eos-dead-calm-etc-goes-on-rampage-price-analysis-june-21) EOS has been on fire recently: the long-awaited mainnet launch was followed by accusations of high-degree centralization and blocking of several accounts in an attempt to stop coin thefts. However despite some fundamental problems, from the view of technical analysis the main Ethereum -0.33 percent competitor is doing very well. Although EOS is still moving in descending channel, its width doesnt prevent traders to derive profits with acceptable level of risk. The price fluctuations have formed a triangle, which will be resolved tomorrow at the latest. The upper boundary of the triangle is formed by powerful hidden mirror level (marked in orange), breaking through which will confirm bulls strength. In this case, the nearest mid-term target lies at $12.5 directly on the intersection of the boundary of the descending channel and 0.618 Fibonacci retracement. We expect a rebound from this level and after some rest the bulls may try to achieve $14.5. As for the negative scenario, for now $9.5 should act as a reliable support which should restrain bulls pressure. Ethereum Classic in on rampage https://cryptocomes.com/sites/default/files/inline-images/ETCUSDjune21.PNG (https://cryptocomes.com/bitcoin-ethereum-eos-dead-calm-etc-goes-on-rampage-price-analysis-june-21) From the list of top 50 altcoins, Ethereum -0.33 percent Classic is showing the most rapid recovery, surging 15 percent in 24 hours. The reason still lies behind announcement of listing on Coinbase which caused a sharp spike in trading volumes unseen since February. Considering that coins all-time-high was set at $47, there is enough space for a considerable increase of current price. Immediate further growth can however be stopped by reaching an important resistance level formed by the upper boundary of the descending channel and strong 0.382 Fibonacci retracement. A couple of days which Bitcoin -0.49 percent traders may take to decide on further direction should be enough for ETC to gain a foothold before the bulls may attempt to reach next target defined at $20.5 in short-term. No doubt Ethereum -0.33 percent Classic will follow the market, but most probably at a higher speed. The bulls are in a winning position, and in case of a negative scenario, it would be an uphill task for the bears to drag the price below $15.5 where a resistance was formed. Take a look at Cryptocomes Price Analysis here (https://cryptocomes.com/bitcoin-ethereum-eos-dead-calm-etc-goes-on-rampage-price-analysis-june-21) Title: Re: Daily price analysis BTC + ALTCOINS Post by: Dany44 on June 25, 2018, 10:13:11 AM Bitcoin, Ethereum, Ripple, EOS, NEM Take Serious Losses On Weekend, Bounce Back on Monday: Price Analysis, June 25
https://cryptocomes.com/sites/default/files/styles/912x570/public/2018-06/Coins_25.06.18.jpg?itok=1DplxyWG (https://cryptocomes.com/bitcoin-ethereum-ripple-eos-nem-take-serious-losses-on-weekend-bounce-back-on-monday-price-analysis) Bitcoin, Ethereum, Ripple, EOS, NEM start an upside correction on Monday after serious fall during the weekend Cryptocurrencies established new lows during the weekend. Bitcoin tested $5,800 area but bulls managed to bounce back there and started a correction on Monday. The situation is still critical as cryptocurrencies develop their downtrend with short upside corrections. The general fundamental background is neutral, but markets still continue to sink and this is a very dangerous alert for the investors and traders who still try to change the situation. The crypto market is bearish as no one knows when whales are going to end those speculative games. For ones such a serious decline is a good opportunity to buy lower and as we can see they try to invest more into crypto markets. However, for the others, this situation is negative as nobody can predict where and when the crypto market will start its general growth. Bitcoin (BTC/USD) Price analysis, June 25 https://cryptocomes.com/sites/default/files/inline-images/btc_25.06.jpg (https://cryptocomes.com/bitcoin-ethereum-ripple-eos-nem-take-serious-losses-on-weekend-bounce-back-on-monday-price-analysis) The currency pair has added more than four percent in the past 24 hours. However, we have mentioned above that BTC/USD established new lows on the weekend and reached $5,800. Bitcoin was unable to develop its downside progress and started a correction. https://cryptocomes.com/sites/default/files/inline-images/btc_1_25.06.jpg (https://cryptocomes.com/bitcoin-ethereum-ripple-eos-nem-take-serious-losses-on-weekend-bounce-back-on-monday-price-analysis) Lets have a closer look at the situation on the hourly chart. Bitcoin has tested the support line at 4.236 retracement level but failed to cross it and bounced back targeting the resistance at 3.618 retracement level. BTC/USD failed to jump over it as well and stays currently within the range, limited by 4.236 and 3.618. The possible ways for BTC/USD are the following: 1. Red scenario (bearish). Bitcoin will test 4.236 retracement level. If successful, sellers will have an opportunity to push the currency pair lower. 2. Orange scenario (neutral). BTC/USD will fluctuate within the range between the support area at 4.236 retracement level and the resistance at 3.618. 3. Green scenario (bullish). The currency pair will hit the resistance area at 3.618 to test it. If buyers are able to jump over it, they are going to target the next resistance at $6,510. Ethereum (ETH/USD) Price analysis, June 25 https://cryptocomes.com/sites/default/files/inline-images/eth_25.06.jpg (https://cryptocomes.com/bitcoin-ethereum-ripple-eos-nem-take-serious-losses-on-weekend-bounce-back-on-monday-price-analysis) The currency pair has added less than two percent in the past 24 hours. However, as we can see it on the chart, Ethereum suffered significant losses on the weekend. The currency pair resumed its downtrend and stays below the descending trend line. https://cryptocomes.com/sites/default/files/inline-images/eth_1_25.06.18.jpg (https://cryptocomes.com/bitcoin-ethereum-ripple-eos-nem-take-serious-losses-on-weekend-bounce-back-on-monday-price-analysis) When we look closer at the hourly chart we can see that Ethereum has tested the support area at $431.42. The currency pair failed to develop its downside progress as buyers regain initiative and drove ETH/USD higher. However, they were unable to change the situation significantly as Ethereum has tested the resistance area at $453.24, but retreated from there. The possible ways for ETH/USD are the following: 1. Red scenario (bearish). The currency pair will test the support area at $431.42 and if successful, bears will have an opportunity to develop their progress. 2. Orange scenario (neutral). Ethereum will fluctuate within $431.42 and $453.24 levels without significant price changes. 3. Green scenario (bullish). ETH/USD will test the resistance area at $453.24 and if successful, bulls will drive the currency pair higher targeting the next resistance at $473.39. Ripple (XRP/USD) Price analysis, June 25 https://cryptocomes.com/sites/default/files/inline-images/xrp_25.06.jpg (https://cryptocomes.com/bitcoin-ethereum-ripple-eos-nem-take-serious-losses-on-weekend-bounce-back-on-monday-price-analysis) Ripple has added more than four percent in the past 24 hours, but the currency pair is still negative as we can see that it has reached new lows on the weekend. We have drawn the descending trend line which prevented XRP price from going above during Saturday and Sunday. However, XRP/USD is in correction on Monday. https://cryptocomes.com/sites/default/files/inline-images/xrp_1_25.06.jpg (https://cryptocomes.com/bitcoin-ethereum-ripple-eos-nem-take-serious-losses-on-weekend-bounce-back-on-monday-price-analysis) Ripple followed its allies and tested new lows during the weekend. The currency pair has reached the support area at $0.4495, but retreated from there as bears had not enough power to push Ripple lower. XRP/USD went upwards later and tested the resistance at $0.4744. The currency pair stays above this level in the moment of writing. The possible ways for Ripple are the following: 1. Red scenario (bearish). Ripple will move towards the support area at $0.4495 to test it. If successful, bears will be able to push the currency pair lower. 2. Orange scenario (neutral). No significant price changes are expected. The currency pair will stay between the support at $0.4744 and resistance at $0.4918. 3. Green scenario (bullish). Ripple will test the resistance area at $0.4918 and jump over it, targeting the next resistance at $0.5088. Take a look at EOS (EOS/USD) and NEM (XEM/USD) Price Analysis, June 25 (https://cryptocomes.com/bitcoin-ethereum-ripple-eos-nem-take-serious-losses-on-weekend-bounce-back-on-monday-price-analysis) Title: Re: Daily price analysis BTC + ALTCOINS Post by: Dany44 on June 29, 2018, 08:41:03 AM Bitcoin, Ethereum, Ripple, EOS, NEM Test Their Local Lows: Price Analysis, June 29
https://cryptocomes.com/sites/default/files/styles/912x570/public/2018-06/photo_2018-06-29_09-59-09.jpg?itok=Zl2R76f0 (https://cryptocomes.com/bitcoin-ethereum-ripple-eos-nem-test-their-local-lows-price-analysis-june-29) Bitcoin and altcoins reached local lows, but still unable to break them The situation has changed slightly as cryptocurrencies from the top 20 declined on Friday and some of them test their local lows. However, in general, we can say that nothing has changed as cryptos still fail to establish new dips. As for interesting news, the crypto community continues to discuss the situation around Facebook (https://cryptocomes.com/blockchain-big-companies-to-proceed-with-suing-facebook-on-crypto-ads-prohibition). Earlier in 2018, the famous and one of the most popular social media has banned all ads related to cryptocurrencies. However, this week they have changed their mind and weakened the restrictions, but ICOs are still banned. Another interesting news comes from Foley & Lardner (https://cryptocomes.com/crypto-investors-dont-understand-current-regulation-but-want-more-of-it-survey), a law company that has conducted a survey among different member of the crypto industry. They have revealed that community wants more and better regulation for digital assets. Around 84 percent of respondents think that ICO should under regulation. A huge amount of people interviewed want trading operations to be regulated as well. Bitcoin (BTC/USD) Price analysis, June 29 https://cryptocomes.com/sites/default/files/inline-images/btc_11.jpg (https://cryptocomes.com/bitcoin-ethereum-ripple-eos-nem-test-their-local-lows-price-analysis-june-29) Bitcoin has lost almost four percent in the past 24 hours, but in general, the situation is neutral as BTC price has not established new lows, bears seem unable to make it as bulls do not let them push the currency pair lower. https://cryptocomes.com/sites/default/files/inline-images/btc%201.jpg (https://cryptocomes.com/bitcoin-ethereum-ripple-eos-nem-test-their-local-lows-price-analysis-june-29) When we zoom in the hourly chart we can see that BTC/USD has broken through the support area at $6,071 on Friday and is testing the last retracement level 4.236. If bears are successful, they will be able to reach the next support at $5,715. The possible ways for BTC/USD are the following: 1. Red scenario (bearish). The currency pair will confirm the breakout of 4.236 and move lower targeting the next support at $5,715. 2. Orange scenario (neutral). Bitcoin will stay within the range and fail its support area testing. BTC price will fluctuate within the support at 4.236 and the resistance at $6,071. We think that this scenario is most likely than the others for Friday. 3. Green scenario (bullish). The currency pair will jump over the resistance at $6,071 and move higher targeting the next resistance at $6,329. Ethereum (ETH/USD) Price analysis, June 29 https://cryptocomes.com/sites/default/files/inline-images/eth_11.jpg (https://cryptocomes.com/bitcoin-ethereum-ripple-eos-nem-test-their-local-lows-price-analysis-june-29) Ethereum has lost more than three percent in the past 24 hours. The currency pair is testing its local lows in the moment of writing, wave after wave, bears are trying to push it lower. ETH/USD still neutral, but once the lows are broken, the currency pair will be able to develop its downside progress. https://cryptocomes.com/sites/default/files/inline-images/eth%201.jpg (https://cryptocomes.com/bitcoin-ethereum-ripple-eos-nem-test-their-local-lows-price-analysis-june-29) When we zoom in the hourly chart we can see that ETH/USD is testing the support area at $417.28. The currency pair has broken through the support area at $431.42 on Friday and stays close to the next support in the moment of writing. The possible scenarios for ETH/USD are the following: 1. Red scenario (bearish). The currency pair will jump over the support area at $417.28 and develop its downside momentum towards the next support at $404.55. 2. Orange scenario (neutral). Ethereum will stay within the current range on Friday limited by the support area at $417.28 and the resistance at $431.42. We think that this is the most probable one for Friday. 3. Green scenario (bullish). ETH/USD will jump over the resistance area at $431.42 and move higher towards the next resistance at $453.24. Ripple (XRP/USD) Price analysis, June 29 https://cryptocomes.com/sites/default/files/inline-images/xrp_9.jpg (https://cryptocomes.com/bitcoin-ethereum-ripple-eos-nem-test-their-local-lows-price-analysis-june-29) Ripple has lost more than four percent in the past 24 hours, but the currency pair remains neutral as it failed to establish new lows on Friday. The currency pair is above the descending trend line, but is still unable to move higher. https://cryptocomes.com/sites/default/files/inline-images/xrp%201.jpg (https://cryptocomes.com/bitcoin-ethereum-ripple-eos-nem-test-their-local-lows-price-analysis-june-29) When we look closer at the hourly chart we can see that Ripple has tested the resistance area at $0.4744, but failed to jump over it and retreated later. Ripple has reached the support area at $0.4495 on Friday and is currently testing it. The possible ways for XRP/USD are the following: 1. Red scenario (bearish). Ripple will break through the support are at $0.4495 and develop its downside progress towards the next support at $0.4232. 2. Orange scenario (neutral). XRP/USD will stay above $0.4495 and fluctuate there, between this support and the resistance at $0.4744. We think that this scenario is the most likely for Friday. 3. Green scenario (bullish). Ripple will cross the resistance are at $0.4744 and move higher targeting the next resistance at $0.4918. Take a look at EOS (EOS/USD) and NEM (XEM/USD) Price Analysis, June 29 (https://cryptocomes.com/bitcoin-ethereum-ripple-eos-nem-test-their-local-lows-price-analysis-june-29) Title: Re: Daily price analysis BTC + ALTCOINS Post by: Dany44 on July 02, 2018, 08:05:10 AM Bitcoin, Ethereum, Ripple, EOS, NEM Grow, Bulls Smash Bears and Drive Markets Higher: Price Analysis July 2
https://cryptocomes.com/sites/default/files/styles/912x570/public/2018-07/IMG_3918.JPG?itok=xGK_ozGl (https://cryptocomes.com/bitcoin-ethereum-ripple-eos-nem-grow-bulls-smash-bears-and-drive-markets-higher-price-analysis-july) Bitcoin and altcoins grow sharply, bulls finally make their counter attack We think that the main reason for such a growth is the fact that Facebook has almost totally changed their minds (https://cryptocomes.com/facebook-u-turns-on-cryptocurrency-ad-ban-but-still-blocks-icos) towards cryptos. We have already mentioned in our previous reviews that Facebook administration is going to accept crypto ads. Additionally, Facebook (https://cryptocomes.com/facebook-to-acquire-coinbase-and-launch-its-own-crypto-no-smoke-without-fire) is going to acquire Coinbase and issue its own cryptocurrency. This U-turn may be the beginning of huge changes within the community. As for news, Russia (https://cryptocomes.com/russia-might-delay-passing-cryptocurrency-law-until-fall-2018) has delayed crypto law adoption putting it off until the end of summer. Russian policymakers asked for more time to make their decisions. Bitcoin (BTC/USD) Price analysis, July 2 https://lh4.googleusercontent.com/3-f6BGuOKTx1l5UrF2CBE3lQNzOEOdIWxF7u4Cd9fwkfScf83O3R04TSP29FOB-hQuI6uUiD_H1m15coNZ-ql_HoalT2QDrCq9kos8nzL4zA78ph6uFSjdtE8Q8711NdbJ5Dzg0dyxtaPweNZQ (https://cryptocomes.com/bitcoin-ethereum-ripple-eos-nem-grow-bulls-smash-bears-and-drive-markets-higher-price-analysis-july) Bitcoin has added less than one percent in the past 24 hours, but the most important events happened on Saturday, when BTC price made a huge upside burst breaking through a couple of resistance areas. BTC/USD seems to finally find its support and thanks to news from Facebook the whole crypto market is positive currently. https://lh5.googleusercontent.com/CBzw98jBdsb_YeFEYlo_tOaZzVPEl5GXFQbbexyKITGyWRN2DRwrnRkLWlGr1yzG-f7CqFveHznhWU27V6Sh4hF7zNR8-b_UOt659RskrUv1E6K6iSxrBFzWl5fiiaBzOLhanMsRXqkbw49kBQ (https://cryptocomes.com/bitcoin-ethereum-ripple-eos-nem-grow-bulls-smash-bears-and-drive-markets-higher-price-analysis-july) Looking closer at the hourly chart we can see that BTC/USD has jumped over the resistance areas at $6,071 and $6,329. The currency pair stays above $6,329 in the moment of writing, we have a clear flag pattern, which means the probability for Bitcoin to develop its upside tendency. We think that BTC/USD is going to grow higher targeting the closest resistance area at $6,510, where we have put the green flag. If buyers successful there, they will be able to drive the currency pair even higher targeting the next resistance at $6,943. The less probable way for BTC/USD is to fall down towards the next support area at $6,071. The flag pattern will be broken in this case. Ethereum (ETH/USD) Price analysis, July 2 https://lh5.googleusercontent.com/yQreF7cd9N27j5Avmm-m1Xckgjc0rLdjZOGOoDrsSzm9mWGr_VwC4sQ9etjvkv9_ydAYpXZ84TQOmgYCzwamHkCrlv4VGcQdWR8lOJSyMzbmjpZ6PSZmdNngGdnaLk7eL0rdxPAzldi6vJgjxw (https://cryptocomes.com/bitcoin-ethereum-ripple-eos-nem-grow-bulls-smash-bears-and-drive-markets-higher-price-analysis-july) The whole crypto market celebrates Facebook decision as Ethereum has made his way upwards on Saturday following Bitcoin. ETH/USD has almost no changes in the past 24 hours, but the momentum during the weekend was huge. The currency pair seems to change its moods to positive. https://lh4.googleusercontent.com/rhvUWbQ2j9a8h1QrkaSMKQYAC1R6bTEHKmxKKjDnj7K8g8heiyFYQzTbgDtcBx3T71wuckEssfU_9LKgpU98fAGSb2E1LBSDtAtf-ymgPLmRzi5zsYDSl2QFHNYANG0L9_URKiFaOCcrTMiWdg (https://cryptocomes.com/bitcoin-ethereum-ripple-eos-nem-grow-bulls-smash-bears-and-drive-markets-higher-price-analysis-july) When we look closer at the hourly chart we can see that Ethereum has crossed $417.28, $431.42 resistance areas and is currently testing $453.24 resistance area. We have a flag pattern here as well-meaning bulls have chances to drive the currency pair even higher, targeting the next resistance at $473.29. If buyers will be able to reach this green flag area, they will test it and once successful, they will be able to drive ETH/USD higher. However, we advise paying attention to the red flag as well. If the flag pattern fails to develop, ETH price will fall towards the support area at $431.42. Ripple (XRP/USD) Price analysis, July 2 https://lh6.googleusercontent.com/8dsmibDeZFwenFVI4JZTWJ0pLFK2Rw0Eaa9sYKwyzWWjTaxNsQkE2SzH8xepqJ3OeCOiVRzy4SlVs6P7pYrzgNkvHhLdOEoq0vHsHBZubyKqUv2t-yS2tZXfI3Uiww3u-pp_WTfuPvtsXHcF8w (https://cryptocomes.com/bitcoin-ethereum-ripple-eos-nem-grow-bulls-smash-bears-and-drive-markets-higher-price-analysis-july) Ripple has added more than one percent in the past 24 hours. The currency pair changed its moods on Saturday following important news from Facebook as famous social media makes a U-turn towards cryptos. Ripple has found support finally. The currency pair looks positive and is able to develop its success. https://lh5.googleusercontent.com/yoXlOIqZ1oQr7UfUNlTktQU7tEKrG3PJebVFnwurScj6EwOCEKPdVQnW2_eKc8SYPMb3tfshz5Lh-uxD_SiydvPoIRMVHb3k-V1VSKVnTXFbYxdIuBPEg8O62EdCviDUR0BhQlJcuLq38ksrBQ (https://cryptocomes.com/bitcoin-ethereum-ripple-eos-nem-grow-bulls-smash-bears-and-drive-markets-higher-price-analysis-july) When we look closer at the situation on the hourly chart we can see that Ripple has jumped over the resistance area at $0.4495 and tested the resistance area at $0.4744. The currency pair forms a flag pattern currently meaning there are chances for buyers to develop their progress in the nearest future. We have set the next target for Ripple at the resistance area at $0.4918. XRP/USD needs to jump over the closest resistance at $0.4744 naturally in order to get our short-term bullish targets. However, if buyers fail, bears will be able to take control and push XRP/USD lower, targeting the next support area at $0.4232. Take a look at EOS (EOS/USD) and NEM (XEM/USD) Price Analysis, July 2 (https://cryptocomes.com/bitcoin-ethereum-ripple-eos-nem-grow-bulls-smash-bears-and-drive-markets-higher-price-analysis-july) Title: Re: Daily price analysis BTC + ALTCOINS Post by: Dany44 on July 03, 2018, 08:21:42 AM Bitcoin, Ethereum, Ripple, EOS, NEM Rally, Crypto Market Looks Promising: Price Analysis, July 3
https://cryptocomes.com/sites/default/files/styles/912x570/public/2018-07/Coins_03.07.jpg?itok=FXyXK6VR (https://cryptocomes.com/bitcoin-ethereum-ripple-eos-nem-rally-crypto-market-looks-promising-price-analysis-july-3) Bitcoin and other cryptos still grow, strong rally on the crypto market The crypto market continues to surprise as the price still goes upwards. All the majors from the top 20 have grown in the past 24 hours as we have expected. Investors seem to have completely changed their minds and coins are bullish at the moment. What is the main reason for this? We think that news from Facebook are the biggest driver of it all (https://cryptocomes.com/facebook-to-acquire-coinbase-and-launch-its-own-crypto-no-smoke-without-fire). The most popular social media has not only U-turned towards cryptocurrency industry but is going to create its own crypto according to the latest rumors. In other news, cryptos continue to expand as Middle East company (https://cryptocomes.com/middle-east-building-company-offering-vip-real-estate-for-virtual-coins) is ready to sell real estate for coins. The owner of the company has a strong belief in cryptocurrencies and thinks they have changed the whole situation with transactions making them more transparent and safe as there is an opportunity to use smart contracts nowadays. The company is going to offer both cryptos and fiat money payment methods. Bitcoin (BTC/USD) price analysis, July 3 https://cryptocomes.com/sites/default/files/inline-images/btc_03.06.jpg (https://cryptocomes.com/bitcoin-ethereum-ripple-eos-nem-rally-crypto-market-looks-promising-price-analysis-july-3) Bitcoin continues to surprise investors as it added more than three percent in the past 24 hours. The flag pattern was true and those who bought from it had chances to grow their profits. However, we think that this uptrend is still on the way as new patterns appear on the hourly chart. https://cryptocomes.com/sites/default/files/inline-images/btc_1_03.06.jpg (https://cryptocomes.com/bitcoin-ethereum-ripple-eos-nem-rally-crypto-market-looks-promising-price-analysis-july-3) Lets get down to the current situation. The currency pair has reached $6,510 target level on Monday-Tuesday and went even higher. However, we have some kind of a consolidation currently. BTC price resides between the resistance area at $6,718 and the support at $6,510. We have drawn another flag pattern, which is likely to be true again. As for the perspectives for today, we think that investors still have fuel to drive BTC/USD higher. The flag pattern confirms it. However, there are two ways for Bitcoin to develop its growth. The first scenario BTC/USD will start from the flag pattern and break through the resistance at $6,718 targeting the next resistance at $6,943. There is also alternative growth scenario. Bitcoin will correct from its current position towards the closest support at $6,510 and start off from there. However, in this case, we expect the currency pair to reach the resistance at $6,718 at least. Ethereum (ETH/USD) price analysis, July 3 https://cryptocomes.com/sites/default/files/inline-images/eth_03.06.jpg (https://cryptocomes.com/bitcoin-ethereum-ripple-eos-nem-rally-crypto-market-looks-promising-price-analysis-july-3) Ethereum follows its allies as the currency pair shows more than four percent growth in the past 24 hours. ETH/USD reached its targets on yesterday and tested the resistance area at $473.39. Ethereum stops there for a while but we think it has still some fuel to develop its growth on Tuesday. https://cryptocomes.com/sites/default/files/inline-images/eth_1_03.06.jpg (https://cryptocomes.com/bitcoin-ethereum-ripple-eos-nem-rally-crypto-market-looks-promising-price-analysis-july-3) The currency pair has left the flag pattern on Monday-Tuesday and went upwards according to our expectations. Ethereum managed to jump off the support area at $453.24 and reached the resistance area at $473.39. It seems like ETH/USD has already jumped over $473.39. We have drawn another flag pattern. The main scenario for the nearest future is bullish. We think that Ethereum will start to grow from the flag again and reach the next resistance area at $500.36. However, the currency pair may also retest the current support area at $473.39 before further growth. Ripple (XRP/USD) price analysis, July 3 https://cryptocomes.com/sites/default/files/inline-images/xrp_03.06.jpg (https://cryptocomes.com/bitcoin-ethereum-ripple-eos-nem-rally-crypto-market-looks-promising-price-analysis-july-3) Ripple develops its upside progress on Tuesday as the currency pair reaches new highs. XRP/USD added more than five percent in the past 24 hours. The flag pattern was true and we have drawn another one which is also viable. Ripple looks very promising currently and seems to have enough power to develop its growth. https://cryptocomes.com/sites/default/files/inline-images/xrp_1_03.06.jpg (https://cryptocomes.com/bitcoin-ethereum-ripple-eos-nem-rally-crypto-market-looks-promising-price-analysis-july-3) XRP/USD has jumped over the resistance area at $0.4744 on Monday-Tuesday and reached our targets. Bulls managed to drive it even higher. The currency pair works next flag pattern currently and seems to jump over the next resistance at $0.5088. The main way for Ripple is to develop its growth in the nearest future. We have set a new target at the resistance area at $0.5444. XRP/USD is able to reach it even on Tuesday. However, we also think that it may test the support area at $0.5088 before taking off. Take a look at EOS (EOS/USD) and NEM (XEM/USD) Price Analysis, July 3 (https://cryptocomes.com/bitcoin-ethereum-ripple-eos-nem-rally-crypto-market-looks-promising-price-analysis-july-3) Title: Re: Daily price analysis BTC + ALTCOINS Post by: boynamnhi on July 03, 2018, 10:45:53 AM Here will be the latest price analysis for BTC and altcoins. You can see that bitcoin prices are recovering and showing signs of a slight increase in recent days, the market is showing signs of recovery and bitcoin prices as well as altcoin are constantly increasing. I believe that at this point if you are profitable you should get USD in order to preserve the profit and reduce the risk of bitcoin price may decrease.We appreciate your opinion. Daily reviews are also placed on https://cryptocomes.com/pricewise (https://cryptocomes.com/pricewise) https://i.imgur.com/CuYXzTr.png (https://cryptocomes.com/pricewise) Title: Re: Daily price analysis BTC + ALTCOINS Post by: Dany44 on July 03, 2018, 01:25:03 PM Crypto Trading Legend MasterLuc: You Can Visit Cemetery of Dead Alts, Wont Find Bitcoin There
https://cryptocomes.com/sites/default/files/styles/912x570/public/2018-07/MasterLuc.jpg?itok=ni4P5bJI (https://cryptocomes.com/crypto-trading-legend-masterluc-you-can-visit-cemetery-of-dead-alts-wont-find-bitcoin-there) The legendary trader MasterLuc is known in crypto community for his precise predictions. Heres his exclusive interview Bitcoin is experiencing tough times as it has suffered a severe correction of over 70 percent from the point of its peak value. Now is the time to worry about its future, so we decided its about time to turn to the anonymous trader MasterLuc, whose fantastic prediction skills made him a legend on Bitcointalk. What made MasterLuc famous was his 2016 prediction of Bitcoin price all-time high at 20k, which was done at a time when no one could even imagine such figures. MasterLuc shared with us his vision of the future of the crypto market, he explains why Bitcoin is strongly undervalued, and why most altcoins are going to die. CryptoComes: Right now, we see a profound correction of the Bitcoin price. Are you going to give up on your famous prediction of Bitcoin continuing its significant rise in price? ML: Are you interested in the technical answer to your question, or the emotional answer? From a technical point, everything is alright up until the 2,990 mark, any lower than that and you can start feeling strained. From an emotional side, the answer is no; bubbles dont burst like that. Quote Enough of those bear traps need to pass so that the bulls can principally lose their fear of a bitcoin dump. When the vast majority of bulls stop straining over a dump of Bitcoins, then you can expect trouble. However, at the time being people continue to be tense. This is merely a correction. On the other hand, I expect a new strong bullish trend in Bitcoin not earlier than 2019. CC: How do you comment on the skeptics who are predicting the next death of Bitcoin will it really survive under the pressure of these newer alts that are equipped with the latest modern technology on steroids? ML: You can visit the cemetery of dead alts here (https://bitcointalk.org/index.php?topic=588413.0). But you wont find Bitcoin there. Instead, there are hundreds of alts, and they will all eventually get there. Partly because no one yet has brought a revolutionary technology that resembles the scale of Bitcoin to the table. If we were to compare Bitcoin to the invention of the internal combustion engine (ICE) and cars, then yes, you could say that alts are attempting to improve something. Like the car industry, theyre repainting the red to green, removing a piece from the edge, building up the wing of this new car, adding a liter to the tank, cramming in extra bells and whistles. But the ICE remains the only revolutionary invention that gave civilization a breakthrough. Quote And still, with so many alts, the next revolutionary step is for Bitcoin. Im talking about Lightning Network. So why do we need these alts? I have many friends in the CryptoParty, and no matter whom I ask why are you mining alts?, the answer is always: To sell them for Bitcoins. Alright, were pretty clear about altcoins, lets say that they are an unnecessary part of the evolution of Bitcoin ML: Hold on, Im not saying that altcoins are unnecessary. Its just that most alts are created and used for one goalto get more Bitcoins. There is also a quite functional form of alts, for example, Litecoin. It appeared at a time when people were tweaking some constant in Bitcoins source code to quickly release a new alt. Litecoin did precisely that, but it also changed the basic hashing algorithm from SHA2 to the experimental algorithm Scrypt. In theory, Litecoin would have died just as the others had. But what makes it special? People are actively testing new features on it and then merging them into Bitcoin. The most significant achievement for Litecoin was its implementation of SegWit. Yes, this was a huge benefit, but again for Bitcoin. Lets face the truth, Litecoin is experimental (https://cryptocomes.com/litecoin-is-dead-price-prediction-ltc-20182025), its like someone who voluntarily takes powerful medication for research purposes. After the testing and debugging are conducted on the experimental subject, it is added to Bitcoin. We are indeed in need of those types of altcoins. Alright, were going down the list why do you have such revulsion toward Ether? ML: The founder of Ether did something unacceptablehe has censored the network. He also does not hide his central role in the project, calling himself the kind dictator. Understand that the revolution of Bitcoin consists of Blockchain technology, which helped eliminate the need for an intermediary institution, such as a bank, between Alice and Bob during exchanges of money. Blockchain is needed to exclude a central dictator who maintains the exclusive right to inspect coins, and who merely is granted this right because he is in the middle of every exchange. The founder of Ether (https://cryptocomes.com/vitalik-buterin-ethereum-scalable-to-millions-of-transactions-per-second) became that central entity. Ethereum is centralized, and it has one point of failurethe founder, who forks its chain left and right. Why? He just does what he wants, lets not even discuss the motives of this nonsense. I dont know why he uses Blockchain technology in this case since the technology was created to counter entities like himself. Ether is centralized just like EOS. Both compete against other digital currencies like PayPal. However, the latter does not hide behind the mask of Blockchain. All of them love to block other accounts (even with the price of a hardfork), but this isnt about Blockchain at all. Again, the idea of Blockchain is simple: Blockchain is essential in places where no center or regulation is needed. If there is a center of any kind- like some office, leader, or something else that you can just close or fire- then there is no need for Blockchain. Ether and EOS (and some others) have a center, Blockchain, and even a project CEO. All of this put together is a project of insanity. You also dont take ICO seriously, could you explain why? ML: Oh, this is just a dot-com. This is how Wall Street entertained themselves in 1999. They would create imitations of online stores, issue shares of stock, sell out for millions, then repeat the cycle. Only a few companies survived during the dot-com hysteria, and they have since become the current giants such as Google, eBay, Amazon, etc. The remaining 95 percent of projects were washed away by the wave following the collapse of this pyramid. History is repeating itself with ICO. Alright, lets return to Bitcoin proper. Many believe that it is an outdated technology, at least regarding its ability to scale. ML: Those people are merely undervaluing what will someday become of Bitcoin. They dont understand its essence. Concerning its ability to scale, there is a short answerLightning Network. Just find out how much this solution outweighs all of those pathetic attempts to only-increase-the-block. Lets take a closer look at the problem of scaling and the importance of Lightning since it is the real future of Bitcoin. ML: There are two different points of view on the solution of the potential problem of scaling the network. 1. Quantitative. You need to slowly increase the maximum size of the block, or make it adaptively float. But for this, you need a hardforka strict division of the network. 2. Qualitative. You can go to a new level of developing the network where there will be no room for this problem. Similarly, there will be no place for several other issues. The second option is Lightning Network (https://cryptocomes.com/lightning-network-boasts-more-nodes-than-bitcoin-cash). This is the next level of development akin to the OSI model. Heres an analogy that is understandable to sysadmins: Bitcoin is the first physical layer (a cable), and Lightning is the data link layer (ethernet protocol). There are higher levelsnetwork, transport, and application. They have not yet been developed, but that is the logic of the development. Just so you know, in that same Ethernet, there are outrageous limitations on the size of the datagram 1,500 bytes (with much difficulty, you can achieve 9,000). In other words, within all our networks today, on any path from any website to you there is a 1,500-byte limitation on the size of the transmission through the data link layer of OSI. Dont believe it? Google the size of MTU. Its true. How is it then possible that you can watch multi-megabyte videos on servers like YouTube? Its very simple. The limitation exists on the second layer of OSI, but when you like a video, that exists on the seventh layer. On the third layer, the limitation has already been handled quite elegantly. On the fourth layer, nobody even knows that it is there anymore. On to the point of this those who offer to change the size of the block are offering a quantitative solution, which could potentially lead to another similar obstruction in the future, and then someone will want another block that is even bigger in size. In option one we are merely pushing the problem into the future, not fundamentally solving it in any way. For example, this is the approach of BCash. They offer growth in one dimension, but they reject a complex multidimensional development of the network, as seen in the OSI model. Therefore, while lamenting about problems of scaling Bitcoin, think about the MTU data link layer of 1,500 bytes. It exists in any network. It is terribly little for our times. This limitation was put in place 40 years ago, and to this day nobody wants to hardfork the Internet to change the limit. Everything works excellent because a complex adaptive network model was created. Lightning Network is exactly the next big step in the right direction. Finally, I would like to discuss your critique of PoS, the consensus algorithm that many believe is the future of crypt, outweighing PoW. Whats wrong with PoS? ML: First, lets answer the initial question of why PoW (https://cryptocomes.com/wikicoin-proof-of-work) was invented (HashCash originally). And why has Satoshi implemented this into Bitcoin? HashCash was invented for the fight against spam. When sending a message, the sender would have to include his hash in the header. In no way did this complicate the lives of regular users because they needed to calculate only one hash. It did, however, seriously complicate the lives of spammers, who needed a new unique hash for each message, and they sent millions of those messages. In other words, this technology, which opposes the centralization and virtualization of resources, opposes one person doing the work that should be performed by many people under normal circumstances. For example, sending messages, or verifying transactions and so on. This technology, unfortunately, does not entirely prevent the adverse effects, but it does impede the occurrence of these problems rather well. Now about PoS. Even a cursory glance at this technology reveals its significant drawbacks in the fight against centralization. The higher your initial balance, the higher your chances are at sealing a block and getting more money in return. To understand the absurdity of this idea, imagine an analogous situation where a PoW-miner has extra video cards and ASICs materialize on their own out of thin air while working on a network. They configure themselves on the fly, connect to the server, and begin working. That is precisely what happens to those with quite a wealthy wallet under the PoS framework. Besides that, I believe PoS is wild centralization and deflation in one bottle. If the concentration of a fixed amount of money generates new money on its own, then PoS-systems, if they ever become popular, will spawn an especially exaggerated breed of hodlers. PoS will maintain a strong deflationary motive by just sitting on bags of money. But how will a real economy work in such a system? After all, it is paralyzed by the lack of moving money. PoS is a system that generates a passive revenue from fixed money, in other words, money that is taken out of circulation. Finally, separate from the centralization and virtualization of resources is PoW. Quote It is real work that creates a decent load on the system. You will not be able to properly mine Bitcoin and Litecoin from one computer, this idea is initially meaningless (it is intended to be that way). On the other hand, with PoS you can unleash an entire zoo of different PoS-systems, making a profit from all of them immediately and simultaneously. Drawing a parallel, you can participate in 10 or 100 networks at the same time. Now return to the initial example about spam and the story of why PoW came to be for Bitcoin to understand why the situation of PoS is absurd. The link: https://cryptocomes.com/crypto-trading-legend-masterluc-you-can-visit-cemetery-of-dead-alts-wont-find-bitcoin-there Title: Re: Daily price analysis BTC + ALTCOINS Post by: Pab on July 03, 2018, 09:27:47 PM Very helpful analysis thanks a lot
Facebook is going to acquire Coinbase and issue its own cryptocurrency.I ve been reading that FB is thinking about his own crypto but acquire Coinbase first to hear.Do big boys in USA want to own crypto space There was article on Coindesk that Russian payments system will develop his own investment cryptobank .It will be possible for Russian citizens to invest in ico legally And Russian are positive for regulations in his country Title: Re: Daily price analysis BTC + ALTCOINS Post by: worldofcoins on July 03, 2018, 09:34:07 PM Here will be the latest price analysis for BTC and altcoins. You can see that the price of bitcoin and altcoin today has a huge adjustment, when the price of bitocin reduced to 6400 $ then the girl altcoin also fell sharply and now the price of bitcoin is recovering to 6800 $ And altcoin is showing signs of recovery but very slowly. I believe that at this time you can buy altcoin and trade in the short term. The market is in the downtrend stage so bitcoin prices will probably continue to fall sharply at any time.We appreciate your opinion. Daily reviews are also placed on https://cryptocomes.com/pricewise (https://cryptocomes.com/pricewise) https://talkimg.com/images/2023/06/14/AqBYJ.png (https://cryptocomes.com/pricewise) Thanks for sharing such analysis. And this new graph is quite hilarious :D but sadly true. BTC at the moment is buffering around ~ $ 6,600 which I think will act as a cap for a period before a new moon. Title: Re: Daily price analysis BTC + ALTCOINS Post by: htconem7 on July 03, 2018, 10:51:01 PM Here will be the latest price analysis for BTC and altcoins. You can see that the current price of bitcoin and altcoin are showing signs of slowing down after rising continuously over the past few days, I think that at this point you should start selling bitcoin and altcoin in USD to have It is possible to preserve profits by minimizing the risk of bitocaine prices. At present, bitcoin prices are showing slight decreases and are at the $ 6500 level.We appreciate your opinion. Daily reviews are also placed on https://cryptocomes.com/pricewise (https://cryptocomes.com/pricewise) https://i.imgur.com/CuYXzTr.png (https://cryptocomes.com/pricewise) Title: Re: Daily price analysis BTC + ALTCOINS Post by: Dany44 on July 04, 2018, 08:55:33 AM Bitcoin, Ethereum, Ripple, EOS, NEM Stop Growing, But Bullish Look Remains: Price Analysis, July 4
https://cryptocomes.com/sites/default/files/styles/912x570/public/2018-07/photo_2018-07-04_09-47-05_0.jpg?itok=xPpELsRD (https://cryptocomes.com/bitcoin-ethereum-ripple-eos-nem-stop-growing-but-bullish-look-remains-price-analysis-july-4) Bitcoin and other cryptos started their downside correction, but still look bullish After two days of growth, the crypto market has seen a downside correction as Bitcoin and other cryptocurrencies suffered insignificant losses on Tuesday-Wednesday. However, the general situation still looks bullish and this correction is unlikely to last for long or be the game changer. The main driver for the uptrend is news from Facebook relating their U-turn towards cryptocurrency markets and ICOs (https://cryptocomes.com/facebook-u-turns-on-cryptocurrency-ad-ban-but-still-blocks-icos). Another driver also comes from Facebook as there are rumors that the famous social media is going to launch its own coin. There is some less important but worth mentioning news. Ripple plans to launch a drop. However, this word was used to attract attention as there will be no traditional cryptocurrency drop. This time it means a new Ripple vlog (https://cryptocomes.com/ripple-trying-to-increase-utility-by-giving-away-xrp-launching-ripple-drop-vlog) narrating about the technologies crypto markets etc. Other interesting news worth mentioning is the war of McAfee against HitBTC (https://cryptocomes.com/mcafee-war-tweets-on-account-of-hitbtc-exchange-killing-people-urges-crypto-community-to-boycott-it). The famous coin expert had some provocative comments in his Twitter accusing famous exchange in death of people and urging user to boycott this trading place. Bitcoin (BTC/USD) price analysis, July 4 https://cryptocomes.com/sites/default/files/inline-images/btc_1_10.jpg (https://cryptocomes.com/bitcoin-ethereum-ripple-eos-nem-stop-growing-but-bullish-look-remains-price-analysis-july-4) Bitcoin started a downside correction as the currency pair loses around two percent in the past 24 hours. However, we think that this correction is nothing more than just a pause of the uptrend as crypto market is still bullish. Investors fixed their positions but they are likely to resume buying in the nearest future. https://cryptocomes.com/sites/default/files/inline-images/btc_14.jpg (https://cryptocomes.com/bitcoin-ethereum-ripple-eos-nem-stop-growing-but-bullish-look-remains-price-analysis-july-4) BTC/USD had a bullish flag pattern on Tuesday but failed to develop its upside progress as the price reached the support area at $6,510 and tested it. Bitcoin jumped over this level, but still has opportunities to return above the resistance (which was the support previously). We can see a clear Hammer candlestick pattern on the hourly chart meaning the currency pair is ready to grow in the nearest future. The closest targets for Bitcoin growth lie at the resistance area at $6,718. BTC/USD is likely to start growing towards this level on Wednesday. This is the main scenario for the next 24 hours. However, if bulls fail to drive the currency pair higher, we will become witnesses of a deeper downside correction aiming at the next support area at $6,329. Ethereum (ETH/USD) price analysis, July 4 https://cryptocomes.com/sites/default/files/inline-images/eth_1_11.jpg (https://cryptocomes.com/bitcoin-ethereum-ripple-eos-nem-stop-growing-but-bullish-look-remains-price-analysis-july-4) Ethereum stopped its uptrend on Tuesday as ETH price failed to work another bullish Flag. ETH/USD loses more than four percent in the past 24 hours but still looks bullish as we think this decline is nothing more than a simple downside correction to the previous uptrend. https://cryptocomes.com/sites/default/files/inline-images/eth_14.jpg (https://cryptocomes.com/bitcoin-ethereum-ripple-eos-nem-stop-growing-but-bullish-look-remains-price-analysis-july-4) Ethereum declined on Tuesday-Wednesday and reached the support area at $453.29. The currency pair formed a bullish Hammer candlestick pattern right on its support line with a fake breakout, meaning Ethereum is ready to burst upwards again. If this works and buyers are successful, Ethereum will be able to reach at least $473.39 resistance area. We think that this target is enough for Wednesday. However, if buyers gain momentum, they will be able to drive the currency pair even higher. This is the main scenario for today, but we should not forget about the bears. They are also able to develop this downside correction even deeper. ETH price is likely to reach the next support area at $431.42 in this case. Ripple (XRP/USD) price analysis, July 4 https://cryptocomes.com/sites/default/files/inline-images/xrp_1_9.jpg (https://cryptocomes.com/bitcoin-ethereum-ripple-eos-nem-stop-growing-but-bullish-look-remains-price-analysis-july-4) Ripple follows its rivals and develops a downside correction as the price loses almost four percent in the past 24 hours. However, XRP/USD still looks bullish and able to resume its uptrend in the nearest future. https://cryptocomes.com/sites/default/files/inline-images/xrp_14.jpg (https://cryptocomes.com/bitcoin-ethereum-ripple-eos-nem-stop-growing-but-bullish-look-remains-price-analysis-july-4) XRP/USD worked its bullish flag on Tuesday, unlike other cryptos. However, after reaching the resistance area at $0.5088, Ripple failed to jump over it and retreated from this area. XRP/USD declined towards the support area at $0.4744 and reached it later. We have a Doji candlestick, which means that Ripple is able to resume growth in the nearest future. What are the targets for today? If bulls are successful close to this support area at $0.4744, they will be able to drive XRP/USD higher targeting the next resistance at $0.5088. Is this the final point for growth for the next 24 hours? We think that no, it is not and buyers will be able to drive XRP/USD even higher. This is the main scenario for Ripple. However, if sellers gain momentum, they will be able to develop this downside correction towards the next support at $0.4495. Take a look at EOS (EOS/USD) and NEM (XEM/USD) Price Analysis, July 4 (https://cryptocomes.com/bitcoin-ethereum-ripple-eos-nem-stop-growing-but-bullish-look-remains-price-analysis-july-4) Title: Re: Daily price analysis BTC + ALTCOINS Post by: KeijiN on July 04, 2018, 11:04:38 AM Here will be the latest price analysis for BTC and altcoins. This graphic is so funny, thanks for making me laughing. But anyway those predictions and analyses is just unavoidable if you want to have a successful trading plan. Good for you that you're making resources.We appreciate your opinion. Daily reviews are also placed on https://cryptocomes.com/pricewise (https://cryptocomes.com/pricewise) Title: Re: Daily price analysis BTC + ALTCOINS Post by: Dany44 on July 05, 2018, 08:06:04 AM Bitcoin, Ethereum, Ripple, EOS, NEM New Local Highs Reached: Price Analysis, July 5
https://cryptocomes.com/sites/default/files/styles/912x570/public/2018-07/photo_2018-07-05_09-44-28.jpg?itok=eCgyjY6K (https://cryptocomes.com/bitcoin-ethereum-ripple-eos-nem-new-local-highs-reached-price-analysis-july-5) Bitcoin and its rivals make new tops on Wednesday, market sentiment is still bullish The crypto market continues its uptrend as all the majors from the top 20 has reached their new highs on Wednesday. Later, Bitcoin and its rivals declined within the correction. However, there is the midterm uptrend currently as sellers have no chances to reverse it and the price goes upwards establishing new tops. There is interesting news on Wednesday-Thursday that we would like to share with our readers. However, first some experts opinions. A panel from 14 experts in cryptos (https://cryptocomes.com/fintech-analysts-predict-bitcoin-altcoins-boost-report) has issued their report on several coins including Bitcoin. They predict bullish market for the rest of 2018 and Bitcoin price will be at least above $15,000. Another interesting news comes from Binance (https://cryptocomes.com/binance-halts-operations-due-to-syscoin-blockchain-being-compromised). This famous crypto exchange halted its activities temporarily due to Syscoin issues. There are rumors that there one bln Syscoins mined in a single block. Bitcoin (BTC/USD) price analysis, July 5 https://cryptocomes.com/sites/default/files/inline-images/btc_15.jpg (https://cryptocomes.com/bitcoin-ethereum-ripple-eos-nem-new-local-highs-reached-price-analysis-july-5) Bitcoin went upwards yesterday, but retreated later within a correction. The currency pair has added more than two percent in the past 24 hours. BTC price moves along the ascending trend line meaning BTC/USD still looks upwards and is promising. https://cryptocomes.com/sites/default/files/inline-images/btc_1_11.jpg (https://cryptocomes.com/bitcoin-ethereum-ripple-eos-nem-new-local-highs-reached-price-analysis-july-5) Bitcoin has tested the resistance area at $6,718 on Wednesday as we had previously predicted, but BTC price declined towards the ascending trend line later. BTC/USD touched this trend line and seems to jump off it meaning bulls are ready to develop the uptrend in the nearest future. We have two bullish signals in a row at the moment of writing. The first comes from the bullish engulfing candlestick pattern. The second formed when the ascending trend line rejected the price. As for targets, we think that BTC/USD is likely to retest the resistance area at $6,718 first and to move higher targeting the next resistance at $6,943. This target may be reached on Thursday-Friday. As for the alternative scenario, the currency pair will break through the ascending trend line and move lower. The first bearish goal lies at the support area at $6,510 and the second is even lower at $6,329. Ethereum (ETH/USD) price analysis, July 5 https://cryptocomes.com/sites/default/files/inline-images/eth_15.jpg (https://cryptocomes.com/bitcoin-ethereum-ripple-eos-nem-new-local-highs-reached-price-analysis-july-5) Ethereum went up three percent in the past 24 hours. The currency pair develops its uptrend as ETH price moves along the trend line. Our Wednesday targets were reached but ETH/USD failed to develop its progress and retreated towards the ascending trend line. https://cryptocomes.com/sites/default/files/inline-images/eth_1_12.jpg (https://cryptocomes.com/bitcoin-ethereum-ripple-eos-nem-new-local-highs-reached-price-analysis-july-5) The currency pair touched the resistance area at $473.39 on Wednesday, but failed to jump over it and went downwards, targeting the ascending trend line. Ethereum is testing the resistance again in the moment of writing. We have a clear bullish hammer pattern on the hourly chart, which is confirmed by the fact that the currency pair jumped off the ascending trend line. As for the targets for today, we think that Ethereum is able to resume the uptrend. The first goal for the currency pair is to break through the resistance area at $473.39. The second (but the main) target lies higher at the next resistance at $500.36. As for bearish scenario it is less probable in this situation. Targets for sellers are the following: ETH price may reach the support area at $453.24 and if successful, it will go lower, targeting the next support at $431.42 Ripple (XRP/USD) price analysis, July 5 https://cryptocomes.com/sites/default/files/inline-images/xrp_15.jpg (https://cryptocomes.com/bitcoin-ethereum-ripple-eos-nem-new-local-highs-reached-price-analysis-july-5) Ripple reached our targets on Wednesday but retreated later. The currency pair added more than three percent in the past 24 hours. XRP/USD moves along the ascending trend line meaning the uptrend is still in force and is able to develop. https://cryptocomes.com/sites/default/files/inline-images/xrp_1_10.jpg (https://cryptocomes.com/bitcoin-ethereum-ripple-eos-nem-new-local-highs-reached-price-analysis-july-5) The currency pair tested the resistance area at $0.5088 on Wednesday but failed to jump over it. XRP/USD declined towards the ascending trend line later. Sellers were unable to push Ripple lower. We have a clear bullish hammer candlestick pattern on the hourly chart, which is confirmed by jump off the trend line. This means that Ripple is able to resume its uptrend in the nearest future. The closest target for this upside tendency will be at the closest resistance area at $0.5088. We also think that XRP/USD will be able to move higher once the resistance is broken. The next target for Thursday-Friday is at $0.5444. As for the bearish scenario, it is less likely. However, the target for sellers lies at $0.4744. Take a look at EOS (EOS/USD) and NEM (XEM/USD) Price Analysis, July 5 (https://cryptocomes.com/bitcoin-ethereum-ripple-eos-nem-new-local-highs-reached-price-analysis-july-5) Title: Re: Daily price analysis BTC + ALTCOINS Post by: kl8847 on July 05, 2018, 06:08:55 PM Thanks for creating that topic. In those days, when market is so unpredictable we definitelly need something like that in order to gather some different opinions and help to make decisions.
Title: Re: Daily price analysis BTC + ALTCOINS Post by: Dany44 on July 09, 2018, 09:04:44 AM Bitcoin, Ethereum, Ripple, EOS, NEM Go for New Highs, Bulls Becoming Stronger: Price Analysis, July 9
https://cryptocomes.com/sites/default/files/styles/912x570/public/2018-07/Coin_09.07.jpg?itok=lhF8RGIY (https://cryptocomes.com/bitcoin-ethereum-ripple-eos-nem-go-for-new-highs-bulls-becoming-stronger-price-analysis-july-9) Bitcoin and altcoins develop their bullish trends, major cryptocurrencies still look promising Bitcoin and other major cryptos continue to rally as they have reached new highs on weekend. General market moods remain positive and cryptos from the top 20 seem to be ready to make new tops. Psychologically, bulls are winning currently as bears have no chances to reverse the situation. As for the news, there are no drivers in the moment of writing, but we want our readers to pay attention to some interesting facts. Europeans ETF giant launches ETN (https://cryptocomes.com/european-etf-trading-giant-launches-bitcoin-and-ethereum-exchange-traded-notes-trade). This is an Exchange trading note, which is similar to Exchange trading fund, but have some specifics. Crypto community, by the way, expects Bitcoin ETFs in the nearest future. Another great news comes from Switzerland where local stock exchange owner SIX launches their own crypto exchange (https://cryptocomes.com/swiss-stock-exchange-owner-six-to-launch-decentralized-crypto-exchange). This company promises to traders to give them a full set of opportunities in order to provide clients with high-quality service. Bitcoin (BTC/USD) price analysis, July 9 BTC/USD had almost nor gains neither losses in the past 24 hours as the currency pair declined for less than one percent. However, in general, the situation is promising as the main cryptocurrency established new highs during the weekend. https://cryptocomes.com/sites/default/files/inline-images/btc_09.07.jpg (https://cryptocomes.com/bitcoin-ethereum-ripple-eos-nem-go-for-new-highs-bulls-becoming-stronger-price-analysis-july-9) Lets get down to the four hours chart to see whats going on with the cryptocurrency. Bitcoin has tested the supper area at $6,510 during the weekend but failed to develop its decline. We have updated the ascending trend line according to the recent price changes. Bitcoin went upwards later and BTC price jumped over the resistance area at $6,701. BTC/USD stays above this level currently, but still unable to make any further upside steps. We think that the currency pair is going to grow today again as we have a clear bullish flag pattern on the chart. The next target for Bitcoin growth lies at $6,943. BTC price is likely to reach this area within one-two days approximately. However, if bulls are more active, they will be able to develop their progress and to reach even higher tops. As for the alternative scenario, if sellers gain temporary control over the market, they will be able to press the currency pair down towards the support area at $6,510. Ethereum (ETH/USD) price analysis, July 9 Ethereum makes smooth losses in the past 24 hours, but the currency pair still looks very promising as it established new highs during the weekend. We have adjusted the ascending trend line in order to make it more appropriate to the current situation. https://cryptocomes.com/sites/default/files/inline-images/eth_09.07.jpg (https://cryptocomes.com/bitcoin-ethereum-ripple-eos-nem-go-for-new-highs-bulls-becoming-stronger-price-analysis-july-9) What can we see on the four-hour chart? The first thing that is clear is that ETH price goes along the green ascending trend line. This fact indicates the probability of further upside tendency. ETH price reached the trend line on the weekend but jumped over the resistance area at $473.39 and went higher later. Currently, we have some kind of a flag pattern on the chart, but it is not a classic pattern analysis flag that we used to trade. However, psychologically, this one is a consolidation after a bullish momentum and may lead to another significant price burst in the nearest future. As for targets for this growth, we think that Ethereum is likely to reach $540.69 in the nearest future. However, the closest target is the resistance area at $500.36. Is there any alternative scenario? If bulls are unable to drive ETH/USD higher than bears will push it lower. We think that Ethereum will run lower in this case, targeting the support area at $543.29. Ripple (XRP/USD) price analysis, July 9 Ripple looks less promising than other majors as the crypto failed to establish new highs during the weekend. The currency pair has lost more than two percent in the past 24 hours. The currency pair has broken through the ascending trend line and moved lower. It is hard to say currently whether Ripple is going to resume its uptrend in the nearest future. https://cryptocomes.com/sites/default/files/inline-images/xrp_09.07.jpg (https://cryptocomes.com/bitcoin-ethereum-ripple-eos-nem-go-for-new-highs-bulls-becoming-stronger-price-analysis-july-9) The situation on the four-hour chart is neutral as there is no tendency currently. Ripple failed to jump over the resistance area at $0.5088 during the weekend. The currency pair tested the support area at $0.4744 instead. We have set upper targets for Ripple at $0.5444, but currently, we cannot say that XRP/USD is able to reach them in the nearest future as the uptrend was broken. The lower targets are set at the support area at $0.4495, but Ripple will have to breakout the closest support area at $0.4744 in order to reach it. Take a look at EOS (EOS/USD) and NEM (XEM/USD) Price Analysis, July 9 (https://cryptocomes.com/bitcoin-ethereum-ripple-eos-nem-go-for-new-highs-bulls-becoming-stronger-price-analysis-july-9) Title: Re: Daily price analysis BTC + ALTCOINS Post by: Dany44 on July 10, 2018, 08:48:57 AM NEO, Bitcoin Cash, Litecoin, IOTA, QTUM: Days Big Losers: Price Analysis, July 10
https://cryptocomes.com/sites/default/files/styles/912x570/public/2018-07/bull.jpg?itok=d7M-vK4Q (https://cryptocomes.com/neo-bitcoin-cash-litecoin-iota-qtum-days-big-losers-price-analysis-july-10) Bitcoin Cash and other cryptos look frustrating at the moment, but bullish moods still prevail The crypto market seems to take a pause on Monday as the currencies from the top 20 suffered losses. However, we think that this is nothing more than a simple deeper correction. Cryptocurrencies still look bullish and may resume their uptrends in the nearest future. As for the interesting news, there is almost nothing to pay attention to except the new attempts to regulate coins, coming from Kenya (https://cryptocomes.com/kenya-racing-to-regulate-bitcoin-and-cryptocurrencies). The local parliament still examines the industry. Some experts think that they can either ban cryptos entirely or give them a green light as some other African countries have done already. Bitcoin Cash (BCH/USD) price analysis, July 10 Bitcoin Cash develops its correction on Tuesday as the price loses more than two percent in the past 24 hours. Bulls seem to take a rest for a while but they are still holding their positions giving no room for bears to reverse the trend. https://cryptocomes.com/sites/default/files/inline-images/bch.jpg (https://cryptocomes.com/neo-bitcoin-cash-litecoin-iota-qtum-days-big-losers-price-analysis-july-10) The currency pair reached the resistance area at $783.70 during the weekend but retreated from there. BCH/USD reached the ascending trend line later and even jumped over it, touching the support area at $720.1. However, it seems that this is the end of bearish activities as Bitcoin Cash meets huge support there. As for the plans for the nearest future, the first target lies at the resistance area at $783.70. However, bulls need to return above the ascending trend line first. If they reach the resistance at $783.70 and test it successfully, buyers will be able to develop the growth towards the next resistance at $828.60. Bearish targets lie lower. If sellers are able to successfully test the current support area at $720.10, they will develop their progress towards the next support at $665.80 to test Junes lows. Litecoin (LTC/USD) price analysis, July 10 Litecoin stopped to develop its upside progress during the weekend and started a correction. The currency pair still has potential but bears hold their position preventing buyers from getting higher. However, we think that LTC/USD is able to resume its growth in the nearest future. https://cryptocomes.com/sites/default/files/inline-images/ltc.jpg (https://cryptocomes.com/neo-bitcoin-cash-litecoin-iota-qtum-days-big-losers-price-analysis-july-10) Litecoin reached the resistance at $84.44 during the weekend but failed to break it out. LTC price retreated from that level and went towards the ascending trend line. LTC/USD crossed the trend line on Tuesday and reached the support area at $78.62. Targets for today are the following. We think that the most probable scenario for Litecoin is to resume the uptrend and to reach the resistance area at $84.44 in the nearest future. This is the closest target. If buyers are able to progress, they will likely to reach the next resistance at $88.45 The less probable scenario for Litecoin is downside tendency. The price may break out the support area at $78.62 targeting the next support at $73.28. QTUM (QTUM/USD) price analysis, July 10 QTUM follows the other cryptos and feels bad on Tuesday, but we think that the currency pair still looks promising and is able to change the tendency in the nearest future. The currency pair has lost more than six percent in the past 24 hours. https://cryptocomes.com/sites/default/files/inline-images/qtum_0.jpg (https://cryptocomes.com/neo-bitcoin-cash-litecoin-iota-qtum-days-big-losers-price-analysis-july-10) QTUM tested the resistance area at $9.23 on weekend but bears were stronger than bulls and prevented them from progressing higher. However, QTUM price stopped at $8.26 currently. QTUM has reached the ascending trend line. As for the possible ways, we think that QTUM is bullish and the currency pair is going to resume its uptrend line the nearest future. QTUM/USD is going to reach the closest resistance area at $9.23 at least. If bulls successfully test it, the currency pair will progress higher. Bears seem to unable to push it lower, but if they have enough power, they will run the currency pair towards the next support area at $7.47. Take a look at IOTA (IOTA/USD) and NEO (NEO/USD) Price Analysis, July 10 (https://cryptocomes.com/neo-bitcoin-cash-litecoin-iota-qtum-days-big-losers-price-analysis-july-10) Title: Re: Daily price analysis BTC + ALTCOINS Post by: Dany44 on July 11, 2018, 10:00:54 AM Bitcoin, Ethereum, Ripple, EOS, NEM Drop As Facebook Euphoria Disappears: Price Analysis, July 11
https://cryptocomes.com/sites/default/files/styles/912x570/public/2018-07/photo_2018-07-11_09-49-29.jpg?itok=WE9u_2yl (https://cryptocomes.com/bitcoin-ethereum-ripple-eos-nem-drop-as-facebook-euphoria-disappears-price-analysis-july-11) Bears again gain control over the market Bears ruin bullish hopes as the price declined on Tuesday and went downwards. It seems like all top 20 altcoins test their June lows. Facebook euphoria disappeared and sellers regain control over the market. There is some interesting and important news that we would like to mention. The first one comes from Bancor exchange (https://cryptocomes.com/decentralized-exchange-bancor-loses-24-mln-in-crypto-in-security-attack). Famous trading platform was hacked. Around $24 mln in crypto was stolen. This news may cause the wave of sales in the crypto market. Another interesting thing to pay attention to is the report (https://cryptocomes.com/crypto-may-turn-into-mainstream-payment-method-within-10-years-report), issued by crypto experts. They note that Bitcoin and other cryptos may become the next step of money evolution. Experts underline also that cryptocurrencies may become new mainstream payment method within the next ten years. Bitcoin (BTC/USD) price analysis, July 11 Bitcoin loses more than five percent in the past 24 hours. The currency pair has broken the uptrend and targets its month lows. Sellers are controlling the market currently and are able to push BTC/USD even lower as we can see some upcoming bearish signals on the chart. https://cryptocomes.com/sites/default/files/inline-images/btc_0.jpg (https://cryptocomes.com/bitcoin-ethereum-ripple-eos-nem-drop-as-facebook-euphoria-disappears-price-analysis-july-11) As for the current situation, Bitcoin successfully tested the ascending trend line from the above and went downwards. BTC/USD passed the closest support area at $6,510 and went even lower. Bitcoin reached the next support area at $6,329 on Wednesday. We think that BTC/USD is likely to develop its downtrend in the nearest future as bulls have lost their control over the market. The currency pair forms a bearish flag currently, which means that the next target may be set at $6,071. However, is bulls make an attempt to counterattack, they will be able to change the situation in their favor and reach the resistance area at $6,510 at least. Ethereum (ETH/USD) price analysis, July 11 Ethereum went downwards on Tuesday as the currency pair has lost nearly seven percent in the past 24 hours. This is a bad news for buyers as Ethereum targets Junes lows currently. The uptrend was broken and we can see that Ethereum still has some potential to develop its downtrend. https://cryptocomes.com/sites/default/files/inline-images/eth_3.jpg (https://cryptocomes.com/bitcoin-ethereum-ripple-eos-nem-drop-as-facebook-euphoria-disappears-price-analysis-july-11) The currency pair has made a breakout of the green ascending trend line without any troubles showing that sellers control the market currently. ETH/USD has broken through a couple of supports at $473.39 and $453.24 and $431.42. We think that Ethereum is able to develop its downtrend in the nearest future. The currency pair is likely to make a breakout of the closest support at $431.42 and move lower, targeting the next support at $417.28 at least. There is a bearish flag on the chart, which is a signal for bears to develop their progress. Is Ethereum able to go upwards? In case of good news or bulls regaining control. However, this scenario is less probable. Ripple (XRP/USD) price analysis, July 11 Ripple follow the other major cryptocurrencies on its way downwards. The currency pair has lost more than four percent in the past 24 hours but shows some signs of further downtrend to develop. XRP/USD targets Junes lows and is able to reach them in the nearest future. https://cryptocomes.com/sites/default/files/inline-images/xrp_16.jpg (https://cryptocomes.com/bitcoin-ethereum-ripple-eos-nem-drop-as-facebook-euphoria-disappears-price-analysis-july-11) Ripple went downwards on Tuesday and crossed a couple of support areas at $0.4744 and $0.4495. The currency pair fluctuates below $0.4495in the moment of writing and we think that XRP/USD is able to reach the next support in the nearest future. We have a bearish flag on the chart, which confirms our bearish thoughts. The currency pair is able to test the closest support area at $0.4232 in the nearest future. If bears are successful, they will be able to push XRP/USD even lower. AS for the alternative, the less probable scenario is growth towards the closest resistance area at $0.4744. Take a look at EOS (EOS/USD) and NEM (XEM/USD) Price Analysis, July 11 (https://cryptocomes.com/bitcoin-ethereum-ripple-eos-nem-drop-as-facebook-euphoria-disappears-price-analysis-july-11) Title: Re: Daily price analysis BTC + ALTCOINS Post by: karim30 on July 11, 2018, 10:33:17 AM Hopefully bitcoin and altcoin prices will come back soon. Bitcoins are at $ 6,300 and other altcoins are falling. I hope to see a positive sign of the cryptocurrency market next week
Title: Re: Daily price analysis BTC + ALTCOINS Post by: Arceusz on July 11, 2018, 07:46:30 PM Actually as of now the market value bitcoin and altcoin in the market is quite recovering from the loss they incurred during the past two quartes of the year,
I hope they can exceed the price of dec. 2017. Title: Re: Daily price analysis BTC + ALTCOINS Post by: Dany44 on July 12, 2018, 08:31:26 AM Bitcoin Cash, Litecoin, Neo, IOTA, QTUM Flat, But Changes Near: Price Analysis, July 12
https://cryptocomes.com/sites/default/files/styles/912x570/public/2018-07/Coins_12.07.jpg?itok=UfRp56r8 (https://cryptocomes.com/bitcoin-cash-litecoin-neo-iota-qtum-flat-but-changes-near-price-analysis-july-12) For top 20 cryptocurrencies, the next step is around the corner The crypto market was sleeping on Wednesday as nothing serious happened. Most of the major cryptocurrencies remained flat as buyers and sellers have found a balance. However, this situation is likely to change in the nearest future. There are no events to affect coin prices currently, but we are going to mention a couple of interesting news here. The Korean Blockchain Association (https://cryptocomes.com/12-korean-exchanges-given-security-thumbs-up-despite-recent-hacks) has tested local exchanges and stated that 12 major trading places have a high-security level. It is important to mention, that the majority of those exchanges were subject to hacker attacks in the past. McAfees war against HitBTC (https://cryptocomes.com/mcafee-to-sue-hitbtc-exchange-preparing-to-release-his-own-coin) still rages on. He has lost the first round as his verbal calls remained almost unnoticed by the crypto community. Famous coins and ICOs oracles decided to make another round of war, but this time, McAfee and collected all the information from the victims of this exchange in order to start a legal procedure. Bitcoin Cash (BCH/USD) Bitcoin Cash has broken its uptrend on Tuesday-Wednesday and declined. The currency pair added almost nothing in the past 24 hours as we have a very narrow flat situation on the chart. It is hard to say whether bulls or bears are going to take control over the market. https://cryptocomes.com/sites/default/files/inline-images/bch_12.07.jpg (https://cryptocomes.com/bitcoin-cash-litecoin-neo-iota-qtum-flat-but-changes-near-price-analysis-july-12) The currency pair has broken through the green ascending trend line and successfully tested the support area at $720.1. It stays below this level in the moment of writing. The currency pair is close to Junes lows but it is hard to say currently whether BCH/USD is going to reach them or reverse from the current position. We give a chance for both scenarios on Thursday as there are no signals or even hints on future price fluctuations currently. We think that bears still have power and control over the market and are able to push Bitcoin Cash to Junes lows. Perhaps, this scenario is vital. However, bulls prevent them from smashing the price currently. Buyers also have a chance to reverse the situation in their favor. Litecoin (LTC/USD) Litecoin fluctuated in a wider range on Wednesday. Litecoin added half a percent in the past 24 hours, but the situation remains neutral. Neither sellers nor buyers control the market currently. https://cryptocomes.com/sites/default/files/inline-images/ltc_12.07.jpg (https://cryptocomes.com/bitcoin-cash-litecoin-neo-iota-qtum-flat-but-changes-near-price-analysis-july-12) Litecoin has successfully tested the ascending trend line on Tuesday and has broken through the support area at $78.62 later. The currency pair currently stays below this level. There is a kind of bearish flag pattern on the four hour chart. If the flag works, we think that Litecoin will be able to test Junes lows in the nearest future. The target for the currency pair lies at the support area of $73.28. This is the first and nearest target for LTC/USD. The alternative scenario for the currency pair is growth towards the resistance area at $84.44. However, we think that this one is less probable in the nearest future. NEO (NEO/USD) NEO stopped declining on Thursday. The currency pair is flat currently. NEO/USD has lost almost two percent in the past 24 hours. However, the situation remains neutral as bulls and bears have found balance. https://cryptocomes.com/sites/default/files/inline-images/neo_12.07.jpg (https://cryptocomes.com/bitcoin-cash-litecoin-neo-iota-qtum-flat-but-changes-near-price-analysis-july-12) NEO has broken through the ascending trend line and declined towards the support area at $32.31. The currency pair attempted several times to test this level, but bulls still hold their positions. There are no signals currently. As for the scenarios, there are two of them. Bears are able to push NEO/USD lower targeting June lows at the support area at $27.78. This bearish scenario has 50 percent probability currently. The other way for NEO/USD to break through the resistance area at $36.45 and move higher, targeting the next resistance at $40.30. Take a look at IOTA (IOTA/USD) and QTUM (QTUM/USD) Price Analysis, July 12 (https://cryptocomes.com/bitcoin-cash-litecoin-neo-iota-qtum-flat-but-changes-near-price-analysis-july-12) Title: Re: Daily price analysis BTC + ALTCOINS Post by: bluemoon84 on July 12, 2018, 09:33:10 AM I see you are actually going for a serious analysis of crypto markets and I respect that, because I usually try to do the same. The problem is that we just keep.During Thursdays trading, the minimum price of BTC was A$6,660, which is 13 percent less than the previous day. Predictably, dominance grew - to 45.5 percent.
Title: Re: Daily price analysis BTC + ALTCOINS Post by: Dany44 on July 12, 2018, 01:34:21 PM I see you are actually going for a serious analysis of crypto markets and I respect that, because I usually try to do the same. The problem is that we just keep.During Thursdays trading, the minimum price of BTC was A$6,660, which is 13 percent less than the previous day. Predictably, dominance grew - to 45.5 percent. BTC min price on Thursday was $6,377, wasnt it?Title: Re: Daily price analysis BTC + ALTCOINS Post by: Siren on July 12, 2018, 01:49:19 PM I love those Fuck words on the chart looks like high risk position lol
Well i might say ,continue to make this analysis and helps people understand whats the real score of the market and what would they might react upon this flow .thanks for this one and looking for many of this Title: Re: Daily price analysis BTC + ALTCOINS Post by: Dany44 on July 13, 2018, 07:32:21 AM Bitcoin, Ethereum, Ripple, EOS, NEM at Bearish Targets, U-Turn Nears: Price Analysis, July 13
https://cryptocomes.com/sites/default/files/styles/912x570/public/2018-07/photo_2018-07-13_09-15-51.jpg?itok=J_mrfK7X (https://cryptocomes.com/bitcoin-ethereum-ripple-eos-nem-at-bearish-targets-u-turn-nears-price-analysis-july-13) Bitcoin and its rivals almost reached their lows, but U-turn is close The cryptos from the top 20 developed their bearish tendencies and reached our targets that we have set previously. However, sellers are unable to push currencies lower and we can see that the major cryptos are ready for U-turn. The majority of coins have almost reached their June lows, where huge support lies. However, sellers have no power to develop their progress as the prices retreated from there, staring a correction. As for the interesting news, there are a couple of things we want to mention. The first one comes from China. The Yuan is no longer the major player in the cryptocurrency market (https://cryptocomes.com/chinas-yuan-no-longer-big-player-in-bitcoin-transactions-going-from-90-to-1) as its volumes declined from 90 to one percent. However, this does not mean that Chinese traders and investors are no longer important players on the cryptomarket. They choose other ways to buy and sell cryptocurrencies. Another interesting fact comes from the Bancor exchange (https://cryptocomes.com/bancor-decentralized-exchange-operational-again-bnt-coin-remains-in-red), which is operational again after a pause, related to a hacker attack. They have already reached a $2.5 mln per day volume. However, the local coin still fails to reverse its tendency and remains red. Bitcoin (BTC/USD) price analysis, July 13 The currency pair went downwards according to the bearish scenario but failed to reach June lows and makes a U-turn currently. Bitcoin losses for the last 24 hours are non-significant and BTC/USD shows signs of a correction. https://cryptocomes.com/sites/default/files/inline-images/btc_4.jpg (https://cryptocomes.com/bitcoin-ethereum-ripple-eos-nem-at-bearish-targets-u-turn-nears-price-analysis-july-13) Bitcoin has successfully broken through the support area at $6,329 in the past couple of days and moved lower. The currency pair reached $6,071 support area but BTC price retreated from there showing that bulls have prepared a very strong defensive line there. There are no signals from price action neither from graphic patterns currently but we think that Bitcoin is going to start an upside correction at least which is able to become an uptrend in the future. The closest target for the growth is at $6,329. We think that BTC/USD aims at $6,510 in the next couple of days. There is an alternative scenario as well, which is less probable at the moment. Bitcoin will test the support area at $6,071 and if successful, bears will push it lower. Ethereum (ETH/USD) price analysis, July 13 Bears were trying to develop their progress in the past couple of days but had not enough power to do it. ETH price remained almost unchanged in the past 24 hours meaning the bulls have built a strong support line there. https://cryptocomes.com/sites/default/files/inline-images/eth_5.jpg (https://cryptocomes.com/bitcoin-ethereum-ripple-eos-nem-at-bearish-targets-u-turn-nears-price-analysis-july-13) Ethereum reached the support area at $417.28 but retreated from there. ETH price returned above the $31.42 line. The bearish flag worked, but we think that ETH/USD is going to start a correction in the nearest future. We can see a bullish hammer on the four-hour chart and this is a strong signal. We think that ETH/USD is going to develop its upside tendency targeting the next resistance area at $453.24 at least. If bulls are successful, they will be able to develop their progress even higher. A bearish scenario is less probable. However, lets see what the sellers can do. Their first target is at the $417.28 support line. The next one lies lower at June lows. Ripple (XRP/USD) price analysis, July 13 Ripple reached June lows and makes a U-turn there. The currency pair has lost less than one percent in the past 24 hours as its downside tendency slows down significantly. We think that bulls are now in the game and they are going to develop this upside correction in the nearest future. https://cryptocomes.com/sites/default/files/inline-images/xrp_17.jpg (https://cryptocomes.com/bitcoin-ethereum-ripple-eos-nem-at-bearish-targets-u-turn-nears-price-analysis-july-13) Ripple has reached the support area at $0.4232, but bullish defensive lines were strong and the price retreated from there. Bulls are taking control over the market and drive the currency pair towards the resistance area at $0.4495. There is no price action nor pattern signals, but it is almost clear that the buyers are going to test the resistance at $0.4495 in the nearest future and will target the next resistance at $0.4744 at least. As for the alternative scenario, bears will be able to retest the support area at $0.4232 and push the currency pair lower. However, this one is less probable. Take a look at EOS (EOS/USD) and NEM (XEM/USD) Price Analysis, July 13 (https://cryptocomes.com/bitcoin-ethereum-ripple-eos-nem-at-bearish-targets-u-turn-nears-price-analysis-july-13) Title: Re: Daily price analysis BTC + ALTCOINS Post by: LoverOfBitcoin on July 13, 2018, 01:38:41 PM This is interesting ;D I am investing in ICO, what about you guys? Recently found interesting ICO - https://medium.com/@kelvinchain/the-post-quantum-era-of-blockchain-todays-solutions-for-the-world-of-tomorrow-16bdd970f49a (https://medium.com/@kelvinchain/the-post-quantum-era-of-blockchain-todays-solutions-for-the-world-of-tomorrow-16bdd970f49a) Project itself is flexible to implementing cryptographic algorithms which will make it one of the safest blockchains ever existed with 10+ signature available from the start. :o
Title: Re: Daily price analysis BTC + ALTCOINS Post by: quynhtrang666 on July 13, 2018, 02:50:03 PM Thank you for your report and chart. The bitcoin price is stable. But bitcoin and altcoin prices are dropping today
Title: Re: Daily price analysis BTC + ALTCOINS Post by: TheNotoriouss on July 13, 2018, 03:57:26 PM Wow, interesting, also checked article about Kelvin Blockchain, interesting project :o It is very flexible and adaptive, which makes it a perfect choice for implementation of the new blockchain projects and platforms.
Title: Re: Daily price analysis BTC + ALTCOINS Post by: Salamita on July 13, 2018, 04:14:56 PM This is really good, I like this analysis
Title: Re: Daily price analysis BTC + ALTCOINS Post by: worldofcoins on July 13, 2018, 04:34:18 PM It looks like exchange coins are doing well as the market turns bearish, maybe it's a good idea to keep a track on Kucoin shares and binance token, as those have shown to resist the negative trend that we've seen for the past few days.
Title: Re: Daily price analysis BTC + ALTCOINS Post by: JohnWick_Bitcoin on July 13, 2018, 05:25:27 PM Hopefully bitcoin and altcoin prices will come back soon. Bitcoins are at $ 6,300 and other altcoins are falling. I hope to see a positive sign of the cryptocurrency market next week Most of the pumping time are always at the end of the year so hold your coins today in order to earn more profit and avoid selling your coins today because it will only make you lose more investments. Title: Re: Daily price analysis BTC + ALTCOINS Post by: hgsteknoloji on July 13, 2018, 05:54:26 PM Looking at the btc charter it looks like we have 3 impulse waves down now so should expect a bit more of a correction at the very least :-\
Title: Re: Daily price analysis BTC + ALTCOINS Post by: Dany44 on July 16, 2018, 07:54:01 AM Bitcoin, Ethereum, Ripple, EOS, NEM in Green, New Targets in Focus: Price Analysis, July 16
https://cryptocomes.com/sites/default/files/styles/912x570/public/2018-07/Coins_07-16.jpg?itok=jZMiftfC (https://cryptocomes.com/bitcoin-ethereum-ripple-eos-nem-in-green-new-targets-in-focus-price-analysis-july-16) Bitcoin and altcoins develop their upside correction, new targets in focus Bitcoin and the altcoins remained calm during the weekend as the volatility was low, cryptocurrencies still go towards their goals but without huge fluctuations. Interesting news comes from the Bitcoin community (https://cryptocomes.com/bitcoin-lightning-networks-half-capacity-provided-by-one-person-decentralization-threatened) where half of its Lightning Network capacity was reached by just one person. But overall the news background has been calm over the weekend as there were no events that are able to provoke significant volatility growth. As most of the cryptos went slightly upwards, one of the second-tier coins has shown huge growth. KickCoin (KICK) shot up 21 percent as somebody is buying this coin big way. The company is hiring all over the globe now, with open positions including EOS developers (KICK is an ERC20 token so currently, its working on Ethereum). Reportedly KickCoin may be listed on a large crypto exchange soon. Bitcoin (BTC/USD) price analysis, July 16 Bitcoin has added less than two percent in the past 24 hours but looks bullish. BTC price went upwards during the weekend and continues its upside correction. BTC/USD failed to reach June lows and seems to target new tops. https://cryptocomes.com/sites/default/files/inline-images/btc_16.07.jpg (https://cryptocomes.com/bitcoin-ethereum-ripple-eos-nem-in-green-new-targets-in-focus-price-analysis-july-16) The currency pair has tested $6,071 support area on Friday but retreated from there and went upwards later according to our forecasts. BTC/USD has successfully tested the resistance area at $6,329 and went above this level. The currency pair remains above in the moment of writing targeting the next resistance. What is the main scenario for today? We stick to the same targets that we have established on Friday. BTC price can reach the next resistance area at $6,510 on Monday-Tuesday. However, if bears take control of the market, they will be able to break through the support area at $6,329 targeting the next support at $6,071. This scenario is less probable. Ethereum (ETH/USD) price analysis, July 16 Ethereum has added almost three percent in the past 24 hours as the currency pair stopped to decline and started its bullish correction. ETH/USD failed to reach June lows and went upwards instead meaning bears are losing control over the market. https://cryptocomes.com/sites/default/files/inline-images/eth_16.07.jpg (https://cryptocomes.com/bitcoin-ethereum-ripple-eos-nem-in-green-new-targets-in-focus-price-analysis-july-16) Ethereum tested $431.42 support area several times but failed to break through it. The currency pair went upwards during the weekend and reached our targets at $453.24. The currency pair is currently fluctuating close to this resistance. We can see a bullish flag pattern forming on the four-hour chart. If it works, the currency pair will be able to jump over the resistance area at $453.42 and move higher, targeting new resistance at $473.39. This is the main scenario for today. If buyers fail to drive the currency pair higher, we think ETH/USD will retreat towards the closest support area at $431.42 at least. Ripple (XRP/USD) price analysis, July 16 Ripple has added less than two percent in the past 24 hours. The currency pair reached June lows on Friday but failed to establish new ones and reversed. The currency pair seems to develop its bullish correction in the moment of writing. https://cryptocomes.com/sites/default/files/inline-images/xrp_16.07.jpg (https://cryptocomes.com/bitcoin-ethereum-ripple-eos-nem-in-green-new-targets-in-focus-price-analysis-july-16) Ripple has tested the support area at $0.4232 but retreated from there. The currency pair went upwards and reached the first resistance area at $0.4495 during the weekend. XRP/USD stays close to this level in the moment of writing. We can see a bullish flag pattern on the four-hour chart which forms below the resistance area at $0.4495. It may result in further growth towards the next resistance at $0.4744. This scenario is the most probable for Monday-Tuesday. However, if bears regain control over the market, they will be able to push the currency pair lower targeting the support area at $0.4232. Take a look at EOS (EOS/USD) and NEM (XEM/USD) Price Analysis, July 16 (https://cryptocomes.com/bitcoin-ethereum-ripple-eos-nem-in-green-new-targets-in-focus-price-analysis-july-16) Title: Re: Daily price analysis BTC + ALTCOINS Post by: Dany44 on July 17, 2018, 08:19:02 AM Bitcoin, Ethereum, Ripple, EOS, NEM Bulls Take Control, Significant Gains Across Board: Price Analysis, July 17
https://cryptocomes.com/sites/default/files/styles/912x570/public/2018-07/photo_2018-07-17_09-53-36.jpg?itok=DEOFk_sE (https://cryptocomes.com/bitcoin-ethereum-ripple-eos-nem-bulls-take-control-significant-gains-across-board-price-analysis) Bitcoin price, altcoins go up, bulls take control of the market again Bitcoin price and the prices of altcoins developed their upside progress Monday. The currency pairs have had significant gains in the past 24 hours. A bullish mood is returning to the market which may result in higher prices. In the news, the Shanghai Stock Exchange (https://cryptocomes.com/chinese-regulations-need-changing-to-introduce-blockchain-in-stock-market-operations-report) looks to introduce distributed ledger technology to improve the security of trading operations. This will include registration procedures and other important factors. Coinsuper crypto exchange (https://cryptocomes.com/coinsuper-now-among-top-crypto-exchanges-binance-okex-huobi-but-investors-suspect-fake-trading) made a significant step forward as this platform is among the most popular exchanges now. However, some experts accuse the exchange in fake trading volumes. Bitcoin (BTC/USD) price analysis, July 17 More than five percent added in the past 24 hours. Bitcoin looks very bullish currently as the currency pair is close to Julys tops. We think that BTC/USD is likely to develop this positive tendency and establish new highs in the nearest future. https://cryptocomes.com/sites/default/files/inline-images/btc_16.jpg (https://cryptocomes.com/bitcoin-ethereum-ripple-eos-nem-bulls-take-control-significant-gains-across-board-price-analysis) Bitcoin has reached our targets on Monday as BTC price had a significant momentum. BTC/USD has jumped over a couple of resistance levels including $6,510 and $6,701. This upside momentum is likely to continue on Tuesday. As for the main scenario, we think that Bitcoin will develop its growth targeting the next resistance at $6,943. There are no signals currently, but the currency pair is above the support at $6,701 and still looks bullish. However, if bulls will be unable to develop their progress, bears may start a correction targeting the support area at $6,510. Ethereum (ETH/USD) price analysis, July 17 Ethereum has added more than seven percent in the past 24 hours. The bullish flag is done currently but it helped traders to make the right decision we hope. The currency pair is close to its Julys highs and we think ETH/USD is likely to develop this positive trend in the nearest future. https://cryptocomes.com/sites/default/files/inline-images/eth_16.jpg (https://cryptocomes.com/bitcoin-ethereum-ripple-eos-nem-bulls-take-control-significant-gains-across-board-price-analysis) Ethereum has jumped over a couple of resistance areas including $453.24 and $473.39 and currently is above the last one. ETH/USD looks bullish and we think it is going to reach Julys highs within Tuesday-Wednesday. The main scenario for today is bullish as well. Ethereum is likely to reach the next resistance area at $500.36. Buyers seem to dominate the market and are likely to develop their progress. However, if sellers take short-term control over the market, they will be able to start a correction towards the support area at $453.24. Ripple (XRP/USD) price analysis, July 17 Ripple has reached the targets we have set on Monday. The currency pair added almost eight percent in the past 24 hours and looks very strong. Buyers have taken control over the market and drive XRP/USD higher targeting Julys highs. https://cryptocomes.com/sites/default/files/inline-images/xrp_18.jpg (https://cryptocomes.com/bitcoin-ethereum-ripple-eos-nem-bulls-take-control-significant-gains-across-board-price-analysis) Lets have a closer look at the currency pair and the current situation. XRP/USD has passed two resistance areas at $0.4495 and $0.4744 already. Ripple is trading above the last one at the moment of writing. However, we think that XRP/USD looks very promising and is able to reach new tops. The main scenario for Tuesday-Wednesday is growth towards the next resistance at $0.5088. We think that this target will be reached in the nearest future. There are no patterns currently, but XRP/USD looks very promising currently. As for the alternative one, Ripple may decline towards the support area at $0.4495. However, sellers will have to jump over the closest support at $0.4744 in this case. Take a look at EOS (EOS/USD) and NEM (XEM/USD) Price Analysis, July 17 (https://cryptocomes.com/bitcoin-ethereum-ripple-eos-nem-bulls-take-control-significant-gains-across-board-price-analysis) Title: Re: Daily price analysis BTC + ALTCOINS Post by: bluemoon84 on July 17, 2018, 09:36:17 AM I see you are actually going for a serious analysis of crypto markets and I respect that, because I usually try to do the same. The problem is that we just keep having so many "fake" traps that I really think there is a lot of manipulation going on. The trend is negative right now, and you can probably only play for short bounces.I really like your charting, very well explained. I also admire the posted analysis in your blog. I guess I need to condition my self to become half bull and half bear.
Title: Re: Daily price analysis BTC + ALTCOINS Post by: Howard1102 on July 17, 2018, 09:47:23 AM Actually as of now the market value bitcoin and altcoin in the market is quite recovering from the loss they incurred during the past two quartes of the year, Although the market is recovering in recent times, the price of the market in 2018 is hard to beat the price of the market in 2017. Bitcoin is the most valuable coin in the crypto market. But I guess the real value of Bitcoin is just $ 7000I hope they can exceed the price of dec. 2017. Title: Re: Daily price analysis BTC + ALTCOINS Post by: tatum506 on July 17, 2018, 09:51:11 AM Here will be the latest price analysis for BTC and altcoins. The market has been fluctuating strongly over the past few days, you can see that bitcoin prices are rising strongly and this has led to the price of altcoin is also recovering very strong, the market is starting to have Short-term recovery signals.We appreciate your opinion. Daily reviews are also placed on https://cryptocomes.com/pricewise (https://cryptocomes.com/pricewise) https://i.imgur.com/CuYXzTr.png (https://cryptocomes.com/pricewise) I think that in long term, bitcoin prices are still in the long-term downtrend and bitcoin prices will drop sharply at any time so be careful of any trading decisions. Title: Re: Daily price analysis BTC + ALTCOINS Post by: johnwest on July 17, 2018, 10:45:59 AM We are seeing some positive trend from this week and hopefully it wont fall to the the $5k bracket again as most of the predictions right now. The resistance is high and it is hard for the people who are trying to dump.
Title: Re: Daily price analysis BTC + ALTCOINS Post by: yayat on July 17, 2018, 11:28:50 AM before its really thank you for you who provide information about daily price list about cryptocurrency.
hopefully you can use this website you can further improve his graphics and make his words to look simple, I will support it. Title: Re: Daily price analysis BTC + ALTCOINS Post by: Dany44 on July 18, 2018, 08:42:11 AM Bitcoin, Ethereum, Ripple, EOS, NEM Appetites Rising, Investors Rushing Into Coins: Price Analysis, July 18
https://cryptocomes.com/sites/default/files/styles/912x570/public/2018-07/Coins_18.07.jpg?itok=Gdt7-I1w (https://cryptocomes.com/bitcoin-ethereum-ripple-eos-nem-appetites-rising-investors-rushing-into-coins-price-analysis-july) Bitcoin and altcoin buyers smashed bears, coins make significant gains Hey, mates. This is Andrew Strogoff again and today we are going to discuss Bitcoin and several altcoins. As you can see, the situation on the crypto market looks promising as many new investors have jumped into this leaving bullish train, which picks up speed and is almost ready to take investors to the moon. I have thoroughly read the news but I found nothing that could be a reason for such a huge momentum. I think that the main reason for this growth is that investors are bored of this downtrend and want some money that they can make on the uptrend only. Anyway, I have prepared some interesting events for you to take a look through. The first thing I want to share with you is the future appointment of new Goldman Sachs (https://cryptocomes.com/goldman-sachs-further-embraces-bitcoin-as-david-solomon-named-new-ceo) CEO David Solomon who is known for his positive attitude towards cryptos. Could this news be the reason for the current growth? I dont think so, but what is clear is that this event may be the fuel for coins growth in the nearest future. The other great news comes from China. This country is famous for its negative attitude towards cryptos but they are interested in Blockchain technologies. Beijing has registered six times more Blockchain companies in 2018 as compared to 2017 (https://cryptocomes.com/china-registers-6x-more-blockchain-named-companies-than-in-2017). And now lets get down to technical analysis, so fasten your seat belts as we are going to rock. Bitcoin (BTC/USD) huge price gains, but still have some fuel to skyrocket, price analysis, July 18 Do you remember the last time Bitcoin added more than 10 percent in just 24 hours? I dont but in fact, this is a good sign for the main crypto and the whole industry as the others will follow BTC/USD in this huge uptrend. The currency pair has done great work on Tuesday and reached my targets. Moreover, Bitcoin went even higher, bringing more profits to investors. Is that all? I dont think so. I believe that the show will go on in the nearest future. https://cryptocomes.com/sites/default/files/inline-images/btc_18.07.jpg (https://cryptocomes.com/bitcoin-ethereum-ripple-eos-nem-appetites-rising-investors-rushing-into-coins-price-analysis-july) Well, mates, lets see whats going on the four-hour chart currently. I have put a green rocket there as I think that Bitcoin looks very promising. BTC/USD had no problems to surpass $7,000 on Tuesday and seems to have enough fuel to develop this progress in the nearest future. As for my closest targets, I think Bitcoin is going to reach $7,734 in the nearest future. Why this level? I think that the volatility is going to decrease. Moreover, I suppose that BTC/USD is going to make a sort of a correction or better a consolidation before resuming its uptrend. There are no patterns currently but I dont think they are needed in this situation. News that Bitcoin is alive, will bring more buyers than any of those technical tricks could do. Ethereum (ETH/USD) Buterins brainchild is fit again, price analysis, July 18 Ethereum looks modest as compared to Bitcoin as it added less in the past 24 hours. However, Im pleased with this growth. Look at this green flag on the four-hour chart. This was my target for Wednesday and we are there! However, I dont think that bulls are going to hide now as they look like titans currently. https://cryptocomes.com/sites/default/files/inline-images/eth_18.07.jpg (https://cryptocomes.com/bitcoin-ethereum-ripple-eos-nem-appetites-rising-investors-rushing-into-coins-price-analysis-july) Do you see this green rocket on the four-hour chart? Oh yes, this is my new target for Wednesday-Thursday. I think we are going there currently, but I want you to be patient as ETH price may test $500.36 again before flying higher. I see no clear patterns currently but I dont think we need them. Bulls are playing their muscles and it seems that nothing can stop them now. My next target is at $540,69, but if the price goes even higher, I would be happier. Ripple (XRP/USD) another great day for the promising coin, price analysis, July 18 Ripple makes new local highs and makes me happy again as my targets were reached on Wednesday. However, I think that this is not the end and XRP/USD is going to surprise us again. This small green flag is just an interim target for the currency pair. https://cryptocomes.com/sites/default/files/inline-images/xrp_18.07.jpg (https://cryptocomes.com/bitcoin-ethereum-ripple-eos-nem-appetites-rising-investors-rushing-into-coins-price-analysis-july) XRP price stopped above the $0.5088 level. Ripple makes more than seven percent in the past 24 hours as bulls continue to build a strong support to the currency pair. Ripple skyrocketed already but still has fuel to do it again. Im far from thinking that XRP/USD will develop its uptrend without a break but I think Ripple is very promising currently. As for my targets, lets look at the four chart to see them. There are no patterns currently and I think XRP price is going to retest this $0.5088 level from above to satisfy bears needs. However, I suppose XRP/USD is going to fly higher and reach $0.5444 in the nearest future. The bears are smashed currently and have no control over the market. The only thing they can do currently is just to watch the train leaving their station. Take a look at EOS (EOS/USD) and NEM (XEM/USD) Price Analysis, July 18 (https://cryptocomes.com/bitcoin-ethereum-ripple-eos-nem-appetites-rising-investors-rushing-into-coins-price-analysis-july) Title: Re: Daily price analysis BTC + ALTCOINS Post by: Dany44 on July 19, 2018, 08:57:04 AM Bitcoin, Ethereum, Ripple, EOS, NEM Correction Needed Before Further Bullish Trend: Price Analysis, July 19
https://cryptocomes.com/sites/default/files/styles/912x570/public/2018-07/photo_2018-07-19_10-01-33.jpg?itok=YgtZk3ya (https://cryptocomes.com/bitcoin-ethereum-ripple-eos-nem-correction-needed-before-further-bullish-trend-price-analysis-july) Bitcoin and altcoin bulls need more power, bears turn to take control Hello, everybody! This is Andrew Strogoff and welcome to the trip to the world of cryptos and analysis. Todays review is a weekly one and we are going to look through the daily charts and midterm tendencies. The current situation on the cryptomarket is bullish I think as investors cling to Bitcoin and altcoins adding to their price and capitalization. Bitcoin and its rivals have started to grow last week and they look promising. I would like to suggest a couple of news to you as I think they are interesting. The crypto market spreads its influence as more companies pay attention to Blockchain technology. Mastercard (https://cryptocomes.com/mastercard-wins-patent-to-make-crypto-transactions-on-bank-cards), for example, wins patent to conduct crypto transactions on bank cards. Billionaire investor Marc Lasry (https://cryptocomes.com/bitcoin-can-reach-40000-if-it-becomes-more-mainstream-says-billionaire-investor-marc-lasry) sees big perspectives in Bitcoin and predicts that the price of the cryptocurrency is able to reach $40,000 in the nearest future. Bitcoin (BTC/USD) the currency pair is ready for further growth, but correction comes first, price analysis, July 19 Bitcoin looks pretty good on the hourly chart. BTC price, as you may see is above the descending trend line and I am almost sure that BTC/USD is likely to develop its growth. Bulls look very strong. Bitcoin has started to grow last week but it is time for the currency to start a correction. https://cryptocomes.com/sites/default/files/inline-images/btc_17.jpg (https://cryptocomes.com/bitcoin-ethereum-ripple-eos-nem-correction-needed-before-further-bullish-trend-price-analysis-july) As far as you can see, the currency pair has broken $6,757 resistance area and is trading above $7,000 at the moment of writing. I think that this upside tendency is likely to develop in the nearest future, but I also suppose that further growth is impossible without a downside correction. My main scenario looks the following. Bitcoin will decline towards the support area at $6,757 first. This is my target for the next week. Why do I have such an idea? If you pay attention to the marked area, you can see a clear Shooting Star candlestick pattern. What does it mean? It is a price action signal for a decline. I also think that this temporary downside tendency will be broken at $6,757 as this is a strong level, which was tested from below several time before being broken. The next target is higher, but this is a matter of a couple of weeks I think. Ethereum (ETH/USD) this rocket needs more fuel to fly, price analysis, July 19 ETH/USD started its upside tendency last week and I think the currency pair is going to develop it in the midterm. However, I also think that the fuel is needed for that as buyers are out of power currently. The currency pair looks very promising currently but ETH/USD is likely to go downwards first. https://cryptocomes.com/sites/default/files/inline-images/eth_17.jpg (https://cryptocomes.com/bitcoin-ethereum-ripple-eos-nem-correction-needed-before-further-bullish-trend-price-analysis-july) Ethereum has reached new local highs on the daily chart and failed to establish new lows. I see a good sign here as investors seem to be ready to change the situation. ETH/USD touched the resistance area at $495.89 on Tuesday but then retreated below it. I think that this is logical and natural according to the technical analysis. The first target for the next week is the support area at $427.24. This support is strong as it resisted a couple of bearish attacks already. The next target for midterm lies above the current price at $569.72. Ripple (XRP/USD) the fuse is lit, price analysis, July 19 Ripple, one of my favorite ones feels good as the currency pair started its growth last week and developed this upside tendency currently. Ripple looks very promising as other altcoins. However, this rocket needs fuel. https://cryptocomes.com/sites/default/files/inline-images/xrp_19.jpg (https://cryptocomes.com/bitcoin-ethereum-ripple-eos-nem-correction-needed-before-further-bullish-trend-price-analysis-july) Lets pay attention to the daily chart. What do you see there? I see a clear correction on the way. This is why I have drawn this orange line towards the support area at $0.4372. The currency pair has tested the resistance area at $0.4908 but failed to move higher. This indicates on the inability of bulls to develop the uptrend without the downside correction. What is going to happen next? I see the following situation. XRP/USD is going to jump off the support area at $0.4372 and resume its uptrend. The rocket is likely to break through the resistance area at $0.4908 and fly higher to the sky. Take a look at EOS (EOS/USD) and NEM (XEM/USD) Price Analysis, July 19 (https://cryptocomes.com/bitcoin-ethereum-ripple-eos-nem-correction-needed-before-further-bullish-trend-price-analysis-july) Title: Re: Daily price analysis BTC + ALTCOINS Post by: aqrulesms on July 19, 2018, 10:36:50 AM I believe that day trading and daily analyses is for the guys who are just completely involved in the cryptocurrency trading process. I am literally don't having a lot of free time daily.
Title: Re: Daily price analysis BTC + ALTCOINS Post by: Dany44 on July 20, 2018, 08:10:44 AM Bitcoin Small Gains While Ethereum, Ripple, EOS, NEM Lose Momentum: Price Analysis, July 20
https://cryptocomes.com/sites/default/files/styles/912x570/public/2018-07/Coins_20.07.jpg?itok=8lvnoKl_ (https://cryptocomes.com/bitcoin-small-gains-while-ethereum-ripple-eos-nem-lose-momentum-price-analysis-july-20) Bitcoin up, other cryptos down, those are the results of Thursdays price fluctuations Hello, everybody. This is Andrew Strogoff and we are going to take off again. Bitcoin is a single crypto from this five to make small gains in the past 24 hours. The others develop their corrections, which are even deeper than I thought previously. However, as I can see now, the market is still bullish and once investors gain volumes, they will be able to make another bullish run towards new targets. As for the news, there is still nothing to fuel trends, but I think I can share with you some interesting ideas. First, EOS has a confirmation of 2,822 transactions per second (https://cryptocomes.com/eos-achieves-2822-transactions-per-sec-surpassing-btc-eth-xrp) which is much higher than at Bitcoin and Ethereum networks. This figure surpasses even Ripple network results. It is to mention that transactions speed has reached 2,000 operations per second just a couple of days ago. Another interesting news comes from WEX exchange (https://cryptocomes.com/crypto-exchange-wex-lets-prices-dip-withdrawals-suspended). They have started to perform a repair works and suspended all withdrawals. The most interesting thing there is that WEX has higher cryptocurrency rates than other exchanges. BTCs price, for example, was around $9,200 there but went downwards and reached $8,700. Bitcoin (BTC/USD) crypto reserve currency feels well and targets new high, price analysis, July 20 I personally love to call Bitcoin a reserve crypto in this industry as it reminds me of USD in the world of fiat money. The majority of transactions is conducted in BTC and at the moment I see that investors are running from altcoins and fuel Bitcoin price. https://cryptocomes.com/sites/default/files/inline-images/btc_20.07.jpg (https://cryptocomes.com/bitcoin-small-gains-while-ethereum-ripple-eos-nem-lose-momentum-price-analysis-july-20) Bitcoin has reached the support area at $7,341 on Thursday but failed to develop this correction and moved higher. I think that there are two reasons for that. The first one means that bulls have ended a correction and have started off for new tops. The second is that investors are running away from the altcoins via BTC/USD. Anyway, I think that BTC/USD looks promising currently and I have some targets above current levels. As you can see, BTC price is above the ascending trend line meaning bulls have control over the market. My trading idea for the next couple of days looks the following: BTC/USD is likely to break through the resistance area at $7,565 and move higher targeting the next resistance at $7,734 where the green rocket is. If any alternative scenario possible? I think yes, as we dont know whether investors are running from altcoins or from the whole board of cryptocurrencies. We will see it soon. Ethereum (ETH/USD) deeper correction is developing, price analysis, July 20 Ethereum loses momentum as we had a negative tendency in the past 24 hours. Im far from thinking that this upside tendency that we have seen at the beginning of the week is done, but the correction seems to be deeper than predicted. https://cryptocomes.com/sites/default/files/inline-images/eth_20.07.jpg (https://cryptocomes.com/bitcoin-small-gains-while-ethereum-ripple-eos-nem-lose-momentum-price-analysis-july-20) Ethereum has reached my targets at the beginning of this week, but then reversed and moved lower. The currency pair has reached the support area at $473.39 and seems to break through it. I think that the currency pair is able to reach another support area at $453.24 before going higher. However, this reverse may happen even before touching this level. In my personal opinion, Ethereum has targets higher at $500.36 at least. However, ETH price will reach them in a couple of days. I am almost persuaded that this bullish holiday will go on. However, currently, it is hard to be 100 percent sure in this. Ripple (XRP/USD) bears gain momentum, but bulls are still on guards, price analysis, July 20 Ripple develops its bearish correction as well. The currency pair reached my targets at the beginning of this week, but reversed later and moved lower. Im far from thinking that this is the end for the bullish trend, however, I have an idea, that XRP price is likely to move a bit lower before taking off. https://cryptocomes.com/sites/default/files/inline-images/xrp_20.07.jpg (https://cryptocomes.com/bitcoin-small-gains-while-ethereum-ripple-eos-nem-lose-momentum-price-analysis-july-20) As far as you can see, I have set lower targets as compared to my previous review. It does not mean that I have changed my opinion, but I think we have to reach those targets first before going higher. I see no signals currently and I think it is time to pay more attention to the level. My main trading idea is the following: I think Ripple is going to reach the support area at $0.4495 before going higher. I recommend, by the way, to pay attention to the situation when XRP price reaches this level. Any reversal price action signal like a hammer or engulfing (or even doji) will be good signs for bulls. Take a look at EOS (EOS/USD) and NEM (XEM/USD) Price Analysis, July 20 (https://cryptocomes.com/bitcoin-small-gains-while-ethereum-ripple-eos-nem-lose-momentum-price-analysis-july-20) Title: Re: Daily price analysis BTC + ALTCOINS Post by: Dany44 on July 23, 2018, 09:25:10 AM Bitcoin, Ethereum, Ripple Correction Over, Bulls Ready for Run: Price Analysis, July 23
https://cryptocomes.com/sites/default/files/styles/912x570/public/2018-07/photo_2018-07-23_10-46-37.jpg?itok=qcR302mc (https://cryptocomes.com/bitcoin-ethereum-ripple-correction-over-bulls-ready-for-run-price-analysis-july-23) Bitcoin and other cryptos seem to be preparing for bull run Hey everybody. This is Andrew Strogoff and we are going to make a brief review of what is happening with the crypto market today. The whole top 20 is green, but the gains are small. There was a correction as I have expected on Friday, but it was even deeper than predicted. Currently, cryptocurrencies seem to be preparing for a bullish run. As for the news, there is still nothing to influence prices significantly. However, I want you to pay attention to some interesting facts. You probably know that India has recently banned cryptocurrencies (https://cryptocomes.com/indias-top-court-hearing-on-crypto-ban-postponed-to-september). The local cryptocurrency community has turned to the court in order to solve the issue. Hearings were planned for summer, but they were postponed according to the latest news. Another interesting event comes from Italy (https://cryptocomes.com/italian-university-to-register-degrees-on-ethereum-blockchain). One of the universities in this country is going to issue degrees on Ethereum Blockchain. This news is important for the community as this is one of the first steps to adopt the technology in this country. Bitcoin (BTC/USD) ready to develop the uptrend, price analysis, July 23 Bitcoin has small gains on Monday as the currency pair has added around three percent. However, I think that the most interesting is on the way as BTC/USD is close to my targets again. The currency pair has reached them on Friday already but retreated. I think that Bitcoin is ready to develop the uptrend. https://cryptocomes.com/sites/default/files/inline-images/btc_18.jpg (https://cryptocomes.com/bitcoin-ethereum-ripple-correction-over-bulls-ready-for-run-price-analysis-july-23) Bitcoin has reached the resistance area at $7,734 on Friday, but as I have already mentioned, bulls were unable to develop their progress. BTC price retreated to the support area at $7,341 and then went upwards to $7,565. I think that the main scenario for today is bullish. My idea is the following: BTC/USD is going to reach the resistance area at $7,734 on Monday and will continue to grow even higher. Bitcoin looks very promising at the moment and bulls seem to gain momentum again. Ethereum (ETH/USD) same targets different day, price analysis, July 23 Ethereum makes small gains on Monday but I think that the show is just beginning. There was a correction during the weekend according to my expectations, but it was even a bit deeper as it supposed to be. However, I think that bears enjoyed it enough as the current situation indicates the probability of further growth. https://cryptocomes.com/sites/default/files/inline-images/eth_18.jpg (https://cryptocomes.com/bitcoin-ethereum-ripple-correction-over-bulls-ready-for-run-price-analysis-july-23) I still have the same targets on the four-hour chart as I think that ETH price will reach my green rocket before going higher. Ethereum has reached the support area at $453.24 as I predicted, but the correction was even a bit deeper. However, the currency pair is currently above this level and I think Ethereum is going to run higher in the nearest future. My target is at the resistance area at $500.36. The currency pair will have to break through the closest resistance at $473.39 in order to get it. However, I have even better plans for Ethereum once the currency pair reaches my main target. Take a look at Ripple (XRP/USD)price analysis, July 23 here (https://cryptocomes.com/bitcoin-ethereum-ripple-correction-over-bulls-ready-for-run-price-analysis-july-23) Title: Re: Daily price analysis BTC + ALTCOINS Post by: rawafe on July 23, 2018, 09:46:52 AM Hours after yesterdays, the market saw a huge 10% spike across the board with charts mostly flat since then. Bitcoin are pretty much exactly where they were yesterday 16 hours ago, in fact.
Title: Re: Daily price analysis BTC + ALTCOINS Post by: phucngungoc on July 23, 2018, 11:28:38 PM Here will be the latest price analysis for BTC and altcoins. You can see that after several days of continuous price increases, altcoin prices have started dropping dramatically at the present time, I think that at this point you should leave the altcoin bitcoin to preserve capital and profit. The market is constantly fluctuating and difficult to guess, so in order to reduce the risk of bitcoin prices will cause altcoin prices continue to fall deep you should only take bitcoin at this time.We appreciate your opinion. Daily reviews are also placed on https://cryptocomes.com/pricewise (https://cryptocomes.com/pricewise) https://i.imgur.com/CuYXzTr.png (https://cryptocomes.com/pricewise) Title: Re: Daily price analysis BTC + ALTCOINS Post by: Dany44 on July 24, 2018, 08:36:53 AM Bitcoin Gains Momentum As Investors Run From Ethereum, Ripple, EOS, NEM, Other Altcoins: Price Analysis, July 24
https://cryptocomes.com/sites/default/files/styles/912x570/public/2018-07/photo_2018-07-24_11-07-27.jpg?itok=-h1x-1To (https://cryptocomes.com/bitcoin-gains-momentum-as-investors-run-from-ethereum-ripple-eos-nem-other-altcoins-price-analysis) Bitcoin develops its uptrend as a reserve crypto while other cryptos are in deeper correction Hello to all my readers. This is Andrew Strogoff again and we are going to take off with our cryptocurrency analysis. Unfortunately, we still have to wait for the targets to be reached. I established them on Friday, but Ethereum, Ripple, EOS and NEM still avoid to meet them. However, Bitcoin seems to take force. This let me say reserve cryptocurrency goes higher and higher establishing new heights. I think the main reason is the runaway of investors from altcoins into Bitcoin. As for the news, there are a couple of events I would like to share with you. The first one is the ban of mining that is going to be launched in Xinjiang Uyghur autonomous Chinese province (https://cryptocomes.com/autonomous-chinese-province-to-ban-bitcoin-mining-by-september) on September. China is known for its banning of crypto-related activities. However, the government states that the Blockchain technology is promising. The US Chamber of Commerce (https://cryptocomes.com/us-chamber-of-commerce-sec-should-hold-icos-by-throat) recommends the SEC to hold ICOs by the throat meaning some more serious measures are required to regulate this industry. Bitcoin (BTC/USD) the lonely hero in this cryptocurrency industry, price analysis, July 24 Bitcoin is the only currency pair that develops its uptrend from the top 20 currently. I think that this is due to the runaway from the altcoins as there is a huge money inflow into BTC/USD. I think that the currency pair is likely to develop its uptrend in the nearest future and may take the altcoins aboard. https://cryptocomes.com/sites/default/files/inline-images/btc_19.jpg (https://cryptocomes.com/bitcoin-gains-momentum-as-investors-run-from-ethereum-ripple-eos-nem-other-altcoins-price-analysis) My targets were reached again, but I think that BTC/USD aims for higher targets currently. The currency pair has tested the resistance area at $7,734 and went higher. It aims at the next resistance area at $7,949, where my green rocket is. Why do I think Bitcoin looks promising currently? The first reason is that BTC/USD is the lonely gainer. The currency pair benefits from altcoins deeper corrections as investors are running away from other cryptos. Moreover, there are no reasons for the market to fall. Ethereum (ETH/USD) still needs some more fuel to fly, price analysis, July 24 The currency pair developed its deeper than expected correction on Monday frustrating my expectations. I saw ETH/USD rising after testing the support area at $453.24. However, ETH price went upwards and retreated from the resistance area at $473.39 https://cryptocomes.com/sites/default/files/inline-images/eth_19.jpg (https://cryptocomes.com/bitcoin-gains-momentum-as-investors-run-from-ethereum-ripple-eos-nem-other-altcoins-price-analysis) What are my next thoughts on the currency pair? I think Ethereum is going to resume its uptrend in the nearest future. This kind of range fluctuations between the two levels in coming to the end already. I also think that ETH/USD is likely to reach the next resistance area at $500.36 in the next couple of days. What do I see currently on the four-hour chart? There is a kind of bullish hammer candlestick pattern, which I suppose is a signal indicating the price may grow in the nearest future. However, the price resides slightly below $453.24 level and needs to go above before developing upside progress. Ripple (XRP/USD) has a deeper than expected correction, price analysis, July 24 Ripple goes in the opposite side from my targets but I still believe XRP/USD is going to reverse in the nearest future to reach the goals I have set on Friday. The currency pair develops a deeper than expected correction, but I think it is near its end. https://cryptocomes.com/sites/default/files/inline-images/xrp_21.jpg (https://cryptocomes.com/bitcoin-gains-momentum-as-investors-run-from-ethereum-ripple-eos-nem-other-altcoins-price-analysis) As far as you can see, the currency pair is close to its local lows meaning we can see a reverse soon. I am far from thinking that the crypto market is going to develop downtrend as there are no reasons for it. New Chinese bans have almost no impact on price as market participants have an immunity to it already. As for targets, I still think that the currency pair is going to reach $0.5088 in the nearest future. However, this task is a bit hard currently as Ripple needs to break through several resistance areas, which are on the way to my target. Take a look at EOS (EOS/USD) Price Analysis, July 24 (https://cryptocomes.com/bitcoin-gains-momentum-as-investors-run-from-ethereum-ripple-eos-nem-other-altcoins-price-analysis) Title: Re: Daily price analysis BTC + ALTCOINS Post by: Dany44 on July 25, 2018, 08:11:02 AM Bitcoin, Ethereum, Ripple, EOS, NEM Have New Targets On The Way Up, Price Analysis, July 25
https://cryptocomes.com/sites/default/files/styles/912x570/public/2018-07/photo_2018-07-25_10-49-42.jpg?itok=ZhEw3jQc (https://cryptocomes.com/bitcoin-ethereum-ripple-eos-nem-have-new-targets-on-the-way-up-price-analysis-july-25) Bitcoin and altcoins resume their upside tendencies, new tops on the way Hello, my dear readers and subscribers! This is Andrew Strogoff again and we are going to make another interesting trip to the world of cryptos. The whole board of the top 20 is on its bullish run and my targets are very close to the current prices. The crypto industry has positive moods in the moment of writing and I think traders and investors will preserve it for a while at least. I suppose that investors are sick and tired of plating the second role and now they have control over the market. As for the news, I have some interesting data for you. First, I would like to introduce the opinion of Brian Kelly, famous CEO of BKCM (https://cryptocomes.com/bitcoins-bull-run-is-far-from-over-investor-brian-kelly). He thinks that Bitcoin is far from its midterm tops and is going to develop this upside tendency in the nearest future. Another interesting news comes from McAfee. This famous ICO promoter decided to launch his own MacAfeeMarketCap.com website (https://cryptocomes.com/mcafee-surprises-crypto-world-again-launches-mcafeemarketcapcom), which is going to compete with another famous website in this industry. Bitcoin (BTC/USD) carries the whole crypto market upwards, price analysis, July 25 Let me start with Bitcoin. BTC/USD has added almost six percent in the past 24 hours and I am far from thinking that this cryptocurrency is going to sing Jim Morrisons famous The End. However, I think that BTC/USD needs to visit a gas station before developing its uptrend. https://cryptocomes.com/sites/default/files/inline-images/btc_20.jpg (https://cryptocomes.com/bitcoin-ethereum-ripple-eos-nem-have-new-targets-on-the-way-up-price-analysis-july-25) The currency pair has reached my targets on Tuesday and went even higher as BTC/USD reached $8,000 and overcame this level. Bitcoin is currently above $8,300. The currency pair failed to reach $8,560 resistance area. I think that BTC/USD is going to start a downside correction currently to reach the support area at $8,193 first before going higher. My targets are set at $8,824. However, Bitcoin may be even more active in the next 24 hours and hit higher aims. Ethereum (ETH/USD) still on the way to my targets, price analysis, July 25 Ethereum makes new gains and ETH price is going towards my targets finally. The correction was a bit deeper but I have indicated on the hammer bullish pattern yesterday and those who bought after it, could have profits as well. https://cryptocomes.com/sites/default/files/inline-images/eth_20.jpg (https://cryptocomes.com/bitcoin-ethereum-ripple-eos-nem-have-new-targets-on-the-way-up-price-analysis-july-25) Anyway, this downside correction is done finally and Ethereum is close to $500 again. The currency pair has broken through the resistance area at $473.39 on Tuesday. I have not changed my targets as ETH price still heads towards $500.36. I think that this aim is going to be reached on Wednesday-Thursday. Are there other scenarios? Im far from thinking that Ethereum is going to decline and start a downtrend. However, the price may correct towards the closest support area at $473.39 before reaching my target. Ripple (XRP/USD) the rocket flies to my targets, July 25 Ripple is another gainer of Wednesday as the currency pair added almost four percent in the past 24 hours. As you may see, XRP/USD goes straight to my target and I think it is going to reach it in the next 24-48 hours. The uptrend is confirmed as the downside correction has ended already. https://cryptocomes.com/sites/default/files/inline-images/xrp_22.jpg (https://cryptocomes.com/bitcoin-ethereum-ripple-eos-nem-have-new-targets-on-the-way-up-price-analysis-july-25) Ripple has reached its lows on Monday-Tuesday but then the currency pair went upwards and is currently trading above the support area at $0.4495. I think that XRP/USD has enough fuel to develop this upside progress and to reach the closest resistance area at $0.4744 at least on Wednesday. My targets are even higher as I think Ripple will touch the resistance area at $0.5088 in the nearest future. The downside corrections are also possible, but I am far from thinking that they are going to be deep. Take a look at EOS (EOS/USD) and NEM (XEM/USD) Price Analysis, July 25 (https://cryptocomes.com/bitcoin-ethereum-ripple-eos-nem-have-new-targets-on-the-way-up-price-analysis-july-25) Title: Re: Daily price analysis BTC + ALTCOINS Post by: Dany44 on July 26, 2018, 07:24:26 AM Bitcoin, Ethereum, Ripple, EOS, NEM Pause, New Gains Likely to Be Achieved After Some Refueling: Price Analysis, July 26
https://cryptocomes.com/sites/default/files/styles/912x570/public/2018-07/Coins_26.07.jpg?itok=s8PJ2qub (https://cryptocomes.com/bitcoin-ethereum-ripple-eos-nem-pause-new-gains-likely-to-be-achieved-after-some-refueling-price) Bitcoin and altcoins corrected on Wednesday, ready for another upside burst Hi there. Andrew Strogoff is with you again and we are going to dive into the crypto analysis right now. As you may see, there was almost nothing interesting on Wednesday as the currency pairs that I review here are in correction. However, this correction is almost done and I believe that we are on the eve of another bullish run in the nearest future. What is going on in the crypto world? Nothing to change the price significantly, but some events are worth your attention. Google integrates Ethereum into their cloud platform (https://cryptocomes.com/ethereum-joins-google-cloud-platform-eth-community-excited). The community is excited about this news as it gives more perspectives to the Ethereum platform as well. Another interesting news comes from the US. 2020 US presidential candidate started to accept donations in cryptos meaning Bitcoin and friends have wider adoption currently and may have larger support in future especially if Andrew Young becomes US President (https://cryptocomes.com/2020-us-presidential-candidate-andrew-yang-accepts-crypto-donations-no-refunds). Bitcoin (BTC/USD) refueling stage is almost over, new upside burst is on the way, price analysis, July 26 Bitcoin has lost almost two percent in the past 24 hours. The currency pair is in its correction phase currently but nearly ends. I believe that BTC/USD is going to resume the uptrend in the nearest future. https://cryptocomes.com/sites/default/files/inline-images/btc_26.07.jpg (https://cryptocomes.com/bitcoin-ethereum-ripple-eos-nem-pause-new-gains-likely-to-be-achieved-after-some-refueling-price) Bitcoin has almost reached the resistance area at $8,560 on Wednesday but retreated from there as bulls were unable to run the currency pair higher. Moreover, BTC/USD has started a correction and reached the support area at $8,193. Bears are unable to develop this correction and I think the uptrend is likely to resume on Thursday. My targets are the same as I think Bitcoin is likely to develop the uptrend targeting the resistance area at $8,824. This is my target for the next couple of days. However, BTC/USD needs to break through the resistance area at $8,560 first. I think many of you are wondering whether the downtrend is possible? The probability of this scenario is low, I suppose. The uptrend seems to be strong. Ethereum (ETH/USD) correction stops as bulls are ready for an assault, price analysis, July 26 Ethereum has lost a little in the past 24 hours, but the uptrend is still actual. There was a correction on Wednesday but it almost over and the currency pair is ready to resume the uptrend. Anyway, I believe that bulls are going to double their efforts in the nearest future to break bears resistance. https://cryptocomes.com/sites/default/files/inline-images/eth_26.07.jpg (https://cryptocomes.com/bitcoin-ethereum-ripple-eos-nem-pause-new-gains-likely-to-be-achieved-after-some-refueling-price) Ethereum has reached the support area at $473.39 on Wednesday within the correction framework but failed to move lower and I see a good sign here. Bulls have build a wall at this level, which supported the currency pair from further decline. What my targets are? I think that ETH/USD is going to reach the resistance area at $500.36. The currency pair is able to move even higher, but lets be realistic. We have to test Julys highs first before the price will be able to go higher. Ripple (XRP/USD) is ready to resume the uptrend, price analysis, July 26 Ripple corrected on Tuesday and consolidated on Wednesday with almost no gains no losses. I think that the currency pair is ready to resume the uptrend in the nearest future. Bears seem to be unable to change the situation in their favor. https://cryptocomes.com/sites/default/files/inline-images/xrp_26.07.jpg (https://cryptocomes.com/bitcoin-ethereum-ripple-eos-nem-pause-new-gains-likely-to-be-achieved-after-some-refueling-price) We have reached the support area at $0.4495 again on Tuesday, but bulls counterattacked and gained momentum. XRP price is above this support area currently. My targets are well above at $0.5088. I believe that we are going to have the uptrend resumed in the nearest future. However, the price has to break through the closest resistance at $0.4744 before reaching my target. Can bears revert the situation? I am far from thinking this. Bulls are strong currently and are able to gain new aims. Take a look at EOS (EOS/USD) and NEM (XEM/USD) Price Analysis, July 26 (https://cryptocomes.com/bitcoin-ethereum-ripple-eos-nem-pause-new-gains-likely-to-be-achieved-after-some-refueling-price) Title: Re: Daily price analysis BTC + ALTCOINS Post by: hgsteknoloji on July 26, 2018, 10:31:20 PM What about a Btc/usd sideways action in the range 7900-8500 for about 1 week? It should form a flag with target about 9700/9800 and altcoins should Start pumping during this sideway move
Title: Re: Daily price analysis BTC + ALTCOINS Post by: Dany44 on July 30, 2018, 08:03:11 AM Bitcoin, Ethereum, Ripple, EOS, NEM Flat, But Pairs Preparing to Reach Targets: Price Analysis, July 30
https://cryptocomes.com/sites/default/files/styles/912x570/public/2018-07/photo_2018-07-30_09-51-33.jpg?itok=lbp9-wHm (https://cryptocomes.com/bitcoin-ethereum-ripple-eos-nem-flat-but-pairs-preparing-to-reach-targets-price-analysis-july-30) Bitcoin and altcoins are flat, no direction is clearly seen Hello, this is Andrew Strogoff again and today we are going to look at what is happening on the crypto market. This weekend that has ended already, had no interesting events at all. Fluctuations were weak, had no clear direction. My targets still remain the same as the price is still far from them, but it doesnt mean they wont be reached. Moreover, I expect the currency pairs to be there this week. Anyway, I hope for significant fluctuations in the next couple of days. As for news, the fundamental background is calm. There is nothing important to shake the markets. However, some events and news may be interesting for you. The Poloniex exchange (https://cryptocomes.com/poloniex-exchange-in-trouble-with-regulators-for-neglecting-clients-complaints) risks its reputation and business at all as the famous trading place neglects users complaints. Many clients say that this exchange freezes their accounts. The US regulatory authority steps in. US lawmakers (https://cryptocomes.com/us-lawmakers-inch-closer-to-introducing-crypto-regulations) see the importance of cryptocurrency regulating and are one step closer to realize their plans. The US is one of the countries that adopt Blockchains and cryptocurrencies but want this market to be strictly regulated to avoid frauds. Bitcoin (BTC/USD) low volatility Bitcoin had no clear direction during the weekend and fluctuated along the ascending trend line. We have still the uptrend as BTC price is above this trend line. I think that bulls are going to take control in the nearest future. https://cryptocomes.com/sites/default/files/inline-images/btc_22.jpg (https://cryptocomes.com/bitcoin-ethereum-ripple-eos-nem-flat-but-pairs-preparing-to-reach-targets-price-analysis-july-30) Lets get a closer look at the four-hour chart. BTC price has several times tested the resistance area at $8,193 but still remains below this level. However, I think that buyers will break through it in the nearest future. Currently, I expect BTC/USD to reach my target which is at $8,824 resistance area. Before this happens, Bitcoin will have to break through the $8,560 resistance area. This may happen anytime once volatility rises and bulls take control of the market. However, this flat may last longer if the ascending trend line will be broken. BTC price is likely to move towards the support area at $7,949 in this case. Ethereum (ETH/USD) prepares for the uptrend Ethereum develops its consolidation as there is no clear tendency currently. The currency pair decreases volatility on falling volumes, but this may be a sign of future significant fluctuations and huge trend. I still think that bulls will take control over Ethereum and drive it to my targets at least. https://cryptocomes.com/sites/default/files/inline-images/eth_22.jpg (https://cryptocomes.com/bitcoin-ethereum-ripple-eos-nem-flat-but-pairs-preparing-to-reach-targets-price-analysis-july-30) Ethereum stays within the range, limited by the resistance area at $473.39 and the support at $453.24. The currency pair had no significant fluctuations during the weekend. It forms a kind of a triangle currently. I still expect ETH/USD to resume the uptrend and to reach my targets which is at $500.36. I personally think that bulls have such an opportunity to regain control. While the market is floating between the two levels, you can also try to open long trades at the support area selling the currency pair when it is close to the resistance. Ripple (XRP/USD) preparing for a boost Ripple has made almost no gains and no losses in the past 24 hours. Fluctuations during the weekend were flat, no tendency is currently seen. However, I think that the uptrend is on the way. Bulls just need some more fuel to resume it. https://cryptocomes.com/sites/default/files/inline-images/xrp_24.jpg (https://cryptocomes.com/bitcoin-ethereum-ripple-eos-nem-flat-but-pairs-preparing-to-reach-targets-price-analysis-july-30) Ripple stays below the resistance area at $0.4744. It is testing the support area at $0.4495 in the moment of writing. The currency pair is likely to jump off this level and to resume the uptrend in the nearest future, I think. I expect XRP/USD to reach my targets this week. The currency pair is likely to touch the resistance area at $0.5088 according to my trading idea. However, Ripple will need to break through the closest resistance at $0.4744 first. Take a look at EOS (EOS/USD) and NEM (XEM/USD) Price Analysis, July 30 (https://cryptocomes.com/bitcoin-ethereum-ripple-eos-nem-flat-but-pairs-preparing-to-reach-targets-price-analysis-july-30) Title: Re: Daily price analysis BTC + ALTCOINS Post by: Dany44 on July 31, 2018, 08:05:06 AM Bitcoin Flat, Ethereum, Ripple, EOS Suffer Losses: Price Analysis, July 31
https://cryptocomes.com/sites/default/files/styles/912x570/public/2018-07/41564387.jpg?itok=LzP86ms2 (https://cryptocomes.com/bitcoin-flat-ethereum-ripple-eos-suffer-losses-price-analysis-july-31) Bitcoin is flat, altcoins fall, but the situation still remains bullish Hello, dear readers. This is Andrew Strogoff. Bitcoin and altcoins still fail to reach my targets. BTC/USD remains in flat while the altcoins suffer some losses. As you may understand, there are no important events currently that allows the crypto industry to make no steps. As for the news, I have some interesting releases for you. They are not influencers, but I think you may be interested in these events. Social media stars use cryptocurrencies. Are you surprised? So was I when I read about Kim Kardashians first Bitcoin experience (https://cryptocomes.com/social-media-superstar-kim-kardashian-posts-about-first-bitcoin-experience). To tell you the truth, she was not using a digital wallet or something like that. Kardashian played poker and had two physical coins on the table. However, I think that even such an appearance is a good promo for the most popular cryptocurrency. Bitcoin price (BTC/USD) makes no gain Bitcoin has lost almost nothing in the past 24 hours making no gains as well. The result is -0.67 percent, which indicates on a tight range. The currency pair has broken through the ascending trend line meaning the uptrend is paused currently. https://cryptocomes.com/sites/default/files/inline-images/btc_23.jpg (https://cryptocomes.com/bitcoin-flat-ethereum-ripple-eos-suffer-losses-price-analysis-july-31) I think that BTC/USD still looks upwards. Why? Because it is not falling and stays close to $8,193 meaning the currency pair is ready to resume the uptrend in the nearest future. However, currently, to reach my targets, Bitcoin needs to jump over the resistance area at $8,193 and the next at $8,560. Im still bullish on BTC/USD, but I think it is time to be patient and wait for opportunities. Bitcoin, by the way, looks far better than its altcoin competitors. Ethereum (ETH/USD) prepare for uptrend Ethereum still has troubles to resume the uptrend. The currency pair has lost nearly three percent in the past 24 hours meaning the upside tendency is delayed. The currency pair looks neutral at the moment. It is testing the support area close to the local lows. https://cryptocomes.com/sites/default/files/inline-images/eth_23.jpg (https://cryptocomes.com/bitcoin-flat-ethereum-ripple-eos-suffer-losses-price-analysis-july-31) Well, I personally think that the situation here is far from being tragic. Ethereum is close to its lows, but those lows make a serious support for the currency pair and some extraordinary events are needed to allow ETH/USD to break it through. I still have the same targets for Ethereum at $500.36. Im even persuaded that ETH/USD has even better perspectives in future. However, now it is time to wait as Ethereum is flatting within the range, limited by the support area at $453.24 and the resistance $473.39. Ripple (XRP/USD) close to its local lows, price analysis, July 31 Ripple has lost more than three percent in the past 24 hours. The currency pair is neutral and is close to its local lows. This is the moment of truth for the Ripple as this support is supposed to be very strong. However, if bears break it through, they will be able to push XRP/USD lower. https://cryptocomes.com/sites/default/files/inline-images/xrp_25.jpg (https://cryptocomes.com/bitcoin-flat-ethereum-ripple-eos-suffer-losses-price-analysis-july-31) I still believe in Ripple, as I believe in other cryptos and mostly in Bitcoin. I think that they look promising, but time is needed. Ripple is close to its local lows as I have already mentioned and the currency pair is likely to jump off this area. I dont think that bears will be able to jump over those lows. My targets are still above. I think that Ripple is able to reach $0.5088 level in the nearest future. Not on Tuesday, thats for sure, but for this week, I think it is a reachable target. Take a look at EOS (EOS/USD) Price Analysis, July 31 (https://cryptocomes.com/bitcoin-flat-ethereum-ripple-eos-suffer-losses-price-analysis-july-31) Title: Re: Daily price analysis BTC + ALTCOINS Post by: hgsteknoloji on July 31, 2018, 03:59:22 PM Totally agree with your EOS prediction...
If daily candle closes above 0.00094 it will be a good reversal sign! Title: Re: Daily price analysis BTC + ALTCOINS Post by: Dany44 on August 01, 2018, 08:35:59 AM Bitcoin, Ethereum, Ripple, EOS, NEM Suffer Losses, Uptrend Delayed: Price analysis, August 1
https://cryptocomes.com/sites/default/files/styles/912x570/public/2018-08/photo_2018-08-01_09-50-52.jpg?itok=EzG4mjso (https://cryptocomes.com/bitcoin-ethereum-ripple-eos-nem-suffer-losses-uptrend-delayed-price-analysis-august-1) Bitcoin and altcoins fall as bulls lose power Hello, dear readers. This is Andrew Strogoff again and I have some bad news for buyers! Bears have breached bulls lines and pushed the market lower. I am far from thinking that the downtrend will last for long but currently it has some room to develop. As for the news, I have found nothing bad, that may affect the market negatively. This means that the decline may be the result of technical correction. However, I have some interesting releases for you to read. The first news comes from the Block.one EOS team (https://cryptocomes.com/blockone-launches-software-to-simplify-making-eos-dapps). They have released their Demux software allowing databases to receive direct updates from the main network. The main idea of this software is to make it easier to create decentralized applications. Another great news comes from the US. Madonna, famous pop star (https://cryptocomes.com/madonna-joins-forces-with-ripple-in-an-attempt-to-solve-the-malawian-orphan-crisis) starts a new fundraising campaign that involves Ripple. Her aim is to help Malawian orphans. Bitcoin (BTC/USD) looking for support The situation has changed significantly on Tuesday as BTC/USD declined. The currency pair has lost more than six percent in the past 24 hours. Now buyers are trying to give support to Bitcoin, but bears are too strong and it is not easy to do it. https://cryptocomes.com/sites/default/files/inline-images/btc_24.jpg (https://cryptocomes.com/bitcoin-ethereum-ripple-eos-nem-suffer-losses-uptrend-delayed-price-analysis-august-1) Bitcoin has broken through several support areas on Tuesday including $7,949, $7,734 and $7,565. BTC/USD fluctuates below $7,565 currently. The currency pair stays below $8,000 which is not good for buyers as they were unable to develop their success or to hold positions. Anyway, I think that bears still have some power to push the currency pair lower. I believe Bitcoin will fall towards $7,341 before starting its correction towards my target. By the way, I have re-established my target lower. Now it is at $7,734. Ethereum (ETH/USD) bears push it lower Ethereum has lost more than seven percent in the past 24 hours. The news is bad as bulls now face hard times. The good news is that this downtrend has no fundamental reason, meaning it wont last long. I think that we will have an upside correction in the nearest future at least. https://cryptocomes.com/sites/default/files/inline-images/eth_24.jpg (https://cryptocomes.com/bitcoin-ethereum-ripple-eos-nem-suffer-losses-uptrend-delayed-price-analysis-august-1) Ethereum has broken through several support areas including $453.24 and $431.42. It fluctuates close to the next support area at $417.28. ETH/USD is close to its monthly lows and I think that currency pair has almost no room for further developing of the downtrend. My trading idea for today is the following the currency pair is likely to start growing targeting the resistance area at $453.24. Ripple (XRP/USD) suffered losses, correction on the way Ripple suffered losses on Tuesday but they were non-significant. The currency pair has lost less than three percent. XRP/USD is close to the monthly lows meaning we are close to the correction. https://cryptocomes.com/sites/default/files/inline-images/xrp_26.jpg (https://cryptocomes.com/bitcoin-ethereum-ripple-eos-nem-suffer-losses-uptrend-delayed-price-analysis-august-1) Ripple is close to the support area at $0.4232. The currency pair has almost reached monthly lows and I think that bulls are likely to counterattack in the nearest future. I have changed my targets and laced them closer to the current price. I believe that the cryptos will reach higher targets but Im a realist and we have to get closer targets first. I hope the currency pair will reach $0.4744 in the nearest future. This is my closest target for the next couple of days. As for bearish pressure, I dont think that sellers have power to push Ripple below monthly lows. Take a look at EOS (EOS/USD) and NEM (XEM/USD) Price Analysis, August 1 (https://cryptocomes.com/bitcoin-ethereum-ripple-eos-nem-suffer-losses-uptrend-delayed-price-analysis-august-1) Title: Re: Daily price analysis BTC + ALTCOINS Post by: Dany44 on August 02, 2018, 07:56:06 AM Bitcoin Ready to Resume Uptrend, Ethereum, Ripple, EOS, NEM Grow Slightly: Price Analysis, August 2
https://cryptocomes.com/sites/default/files/styles/912x570/public/2018-08/Coins_02.08.jpg?itok=rzByqWog (https://cryptocomes.com/bitcoin-ready-to-resume-uptrend-ethereum-ripple-eos-nem-grow-slightly-price-analysis-august-2) Bitcoin and altcoins consolidate and are ready to resume their uptrends Hello everybody. This is Andrew Strogoff and we are starting off again. The crypto market finally tries to reverse its tendency from negative to positive. All the major cryptos (or almost all of them) attempt to change the situation. Those attempts are shy but they mean cryptocurrencies are ready to resume their uptrends. As for the news, I have some interesting ones for you. The first one comes from Morgan Stanley, famous US bank (https://cryptocomes.com/morgan-stanley-hires-ex-credit-suisse-banker-to-run-digital-assets-department), which hires former Credit Suisse banker to run digital assets department. This news is a good signal for the cryptocurrency market as it shows the growing adoption of coins and tokens. The latest survey shows that cryptocurrencies become more and more popular. You can book a hotel or pay for a video game, for example, using coins. Latest reports show (https://cryptocomes.com/almost-one-third-of-employees-would-accept-salary-in-crypto-poll) that one-third of employees are ready to receive salary in cryptocurrencies. Bitcoin (BTC/USD) ready to fly? You might know that Ive been bullish the whole July. I believe that the cryptos are going to grow in the nearest future to establish new highs. And if we look at Bitcoins chart, we can see that it is looking promising currently as BTC price slightly goes upwards, meaning the beginning of the correction. https://cryptocomes.com/sites/default/files/inline-images/btc_02.08.jpg (https://cryptocomes.com/bitcoin-ready-to-resume-uptrend-ethereum-ripple-eos-nem-grow-slightly-price-analysis-august-2) Bitcoin has tested the support area at $7,565 on Wednesday and retreated from there. BTC price went towards the next resistance area at $7,734 later and almost reached my Wednesdays targets. I could say that everything is going according to my plans, but there is one thing that makes me a bit nervous. I see the bearish flag on the four-hour BTC/USD chart. If this pattern is vital, BTC price is likely to develop its decline towards the next support area at $7,341 at least. As for my targets, I set them at the resistance area at $7,949. I believe BTC price is going to reach them (in the case of the bullish scenario) within a couple of days. Ethereum (ETH/USD), no significant changes Ethereum stays close to the support area at $417.28 and there were no significant fluctuations on Tuesday. Ripple has made positive changes for nearly one percent in the past 24 hours. However, I think that it looks very promising currently. Why? https://cryptocomes.com/sites/default/files/inline-images/eth_02.08.jpg (https://cryptocomes.com/bitcoin-ready-to-resume-uptrend-ethereum-ripple-eos-nem-grow-slightly-price-analysis-august-2) The main reasons for my bullish expectations are the fact that Ethereum has reached its lows and has met the strong support at $417.28. I think that ETH/USD is likely to start a correction from there. Moreover, I expect the currency pair to start the uptrend from those levels targeting the resistance at $453.24 at least. Ripple (XRP/USD), an attempt to start the uptrend Ripple has made almost three percent in the past 24 hours. The currency pair seems to end its bearish tendency as we had clear growth yesterday. My plans for Ripple are still actual and I have some confirmation of further growth. https://cryptocomes.com/sites/default/files/inline-images/xrp_02.08.jpg (https://cryptocomes.com/bitcoin-ready-to-resume-uptrend-ethereum-ripple-eos-nem-grow-slightly-price-analysis-august-2) Ripple has tested the support area at $0.4232 and went upwards later. The currency pair reached the resistance area at $0.4495 but failed to jump over it. XRP/USD started its local correction to that upside momentum later. As I have previously written, I have a confirmation signal there meaning I see a bullish flag on the four-hour chart. My target for the next couple of days is set at the resistance area at $0.4744. Take a look at EOS (EOS/USD) and NEM (XEM/USD) Price Analysis, August 2 (https://cryptocomes.com/bitcoin-ready-to-resume-uptrend-ethereum-ripple-eos-nem-grow-slightly-price-analysis-august-2) Title: Re: Daily price analysis BTC + ALTCOINS Post by: Dany44 on August 06, 2018, 09:09:35 AM Bitcoin, Ethereum, Ripple, EOS, NEM Slightly Gain, Bears Seems to Lose Control: Price Analysis, August 6
https://cryptocomes.com/sites/default/files/styles/912x570/public/2018-08/coins_06.08.jpg?itok=zJLyn0Ip (https://bit.ly/2LYaReD) Bitcoin and altcoins develop upside corrections, bears lose control over the market Hello, this is Andrew Strogoff again and we are going to dive into Bitcoin and altcoins price analysis again. Looking through charts and events I am wondering what the hell is going on with the crypto market. I have carefully studied everything that has happened in the past week and found nothing that could help me to understand the reason for such a significant decline. The price seems to live its own life separately from fundamental analysis. There is nothing important that could affect the quotes and lead to such a huge downtrend. I personally think that this decline is due to the lack of interest from investors. It is summer time and most of them have fixed their positions in order to spend some money on holidays. As for news, I have some interesting events to give you. The first one comes from the US. North Carolina has prohibited to donate in cryptos (https://cryptocomes.com/north-carolina-prohibits-donating-crypto-to-political-causes) for political purposes meaning the candidates are not allowed to take contributions in Bitcoin, e.g. Bitcoin and altcoins cannot be considered as money according to the Dutch central bank (https://cryptocomes.com/dutch-central-bank-declares-bitcoin-not-money-no-plans-to-ban). This is a strange decision. However, there are no plans to ban cryptocurrencies neither to restrict their implementation. Bitcoin (BTC/USD) develops its downtrend, bulls hope for correction Bitcoin has added more than one percent in the past 24 hours. However, the currency pair has lost nearly 13 percent in the past seven days meaning we are still within the downtrend stage. BTC/USD had a significant decline during the past week and now this downtrend is stopped due to some technical reasons. https://cryptocomes.com/sites/default/files/inline-images/btc_06.08.jpg (https://bit.ly/2LYaReD) Bitcoin is trading below the red descending trend line meaning we are still in a downtrend. However, the currency pair has reached the support area at $6,943 and stopped there. Bears seem to be tired and need some rest while bulls are full of power and they are ready to counterattack. BTC price is close to the resistance area at $7,181 currently and I think BTC/USD is going to test this level in the nearest future. My main scenario for the next 24 hours is bullish as I think buyers are able to develop this upside correction at least. I have set the targets higher at the resistance area at $7,565. To reach those targets, Bitcoin will have to pass a couple of resistance areas. However, if bears come into play again, they will be able to push Bitcoin even lower, below the current support at $6,943. Ethereum (ETH/USD) downtrend is over Ethereum has added more than one percent in the past 24 hours meaning the downtrend is paused at least. However, the currency pair has lost over 11 percent within the last week and established a strong downside tendency. https://cryptocomes.com/sites/default/files/inline-images/eth_06.08.jpg (https://bit.ly/2LYaReD) I can see some signs of reverse on the four-hour chart currently. The first one comes from graphic analysis. We have a double bottom pattern as the price has tested the support area at $404.55 twice and failed to break through. We are below the descending red trend line currently, but Ethereum tries to fill the gap between its current position and this trend line. ETH/USD is close to the next resistance area at $417.28 and I think the currency pair is able to reach it in the nearest future. I have set my target at $453.24. I think that Ethereum is able to reach this area in the next couple of days. Bears are exhausted and bulls seem to take control. However, if buyers are unable to pass this red trend line or the closest resistance area, they will be discarded to the support area by sellers. Ripple (XRP/USD) flats: no gains, no losses Ripple is one of the most resistible cryptocurrency from the top 20 as its losses for the past seven days are less than five percent. The currency pair has no tendency currently as it stays within the range. XRP/USD looks promising currently and I think it is going to reach my targets in the nearest future. https://cryptocomes.com/sites/default/files/inline-images/xrp_06.08.jpg (https://bit.ly/2LYaReD) The currency pair has reached the support area at $0.4232 last week but failed to go lower. We have a clear flat situation and I can see that Bollinger Bands indicators have no direction currently. XRP price is close to its red middle curve and is ready to test it. If bulls succeed, they will be able to go further targeting the closest resistance area at $0.4495. I have set my targets even higher as I think that XRP/USD is going to develop the uptrend in the nearest future, aiming $0.4744 this week. However, bears may counterattack at $0.4495 and retake control. Take a look at EOS (EOS/USD) and NEM (XEM/USD) Price Analysis, August 6 (https://bit.ly/2LYaReD) Title: Re: Daily price analysis BTC + ALTCOINS Post by: yanixbtc on August 06, 2018, 12:06:02 PM Everyone would like to see nice bull run and make fortune (me too), but please, get rid of your feelings. There will be a big surprise awaits all of us this year. The fullest recovery of bitcoin and altcoins is on its way and all we need to do is just hang on tight. This is a hard time for cryptocurrencies since 2017 entered but this surely wont continue until the end of the year. There is big chances of a decent profit for the ones who keep holding despite the current market.
Title: Re: Daily price analysis BTC + ALTCOINS Post by: Dany44 on August 07, 2018, 07:55:08 AM Bitcoin, Ethereum, Ripple, EOS Decline Again, Bears Counterattack: Price Analysis, August 7
https://cryptocomes.com/sites/default/files/styles/912x570/public/2018-08/photo_2018-08-07_09-15-16.jpg?itok=J9eOoHc0 (https://cryptocomes.com/bitcoin-ethereum-ripple-eos-decline-again-bears-counterattack-price-analysis-august-7) Bitcoin and altcoins bulls are exhausted again, bears take control Hello, this is Andrew Strogoff again and today we are going to look through several cryptos in order to see their perspectives. The current situation is neutral as there are no tendencies in the moment of writing. Bears have counterattacked yesterday and most of the cryptos declined. There are no important events to affect the market still. I think that this is something related to psychology. Investors and traders try to get rid of cryptocurrencies currently but the reasons of such decisions are not uncovered. As for the interesting news, I have something to show here. Ripple is added to Bitcoin store (https://cryptocomes.com/xrp-partners-with-bitcoin-superstore-now-open-to-payments-in-over-200000-online-stores). This fact increases its adoption and gives some support to the currency pair. However, this support is weak as you will see it later on the charts. Robert Kiyosaki, famous author of Rich Dad, Poor Dad (https://cryptocomes.com/rich-dad-poor-dad-author-is-highly-optimistic-about-cryptocurrencies-but-predicts-historic-market) makes his own prediction of the crypto market. He thinks that cryptocurrencies and other digital assets may even overtake traditional money. However, he also forecasts market crash. Bitcoin (BTC/USD) price declines, bulls lose power Bitcoin loses momentum again. The currency pair has lost nearly two percent in the past 24 hours. However, this is not the biggest problem for BTC/USD. The biggest problem is that the main crypto has true issues attempting to grow as there are no significant volumes to drive the currency pair higher. https://cryptocomes.com/sites/default/files/inline-images/btc_25.jpg (https://cryptocomes.com/bitcoin-ethereum-ripple-eos-decline-again-bears-counterattack-price-analysis-august-7) As I have previously mentioned, the situation is neutral currently. Bitcoin has almost reached the descending trend line yesterday, but reversed there and declined towards the support area at $6,943 to test it. The currency pair still fluctuates there close to the red descending trend line again. I think BTC/USD is likely to test this trend line today in an attempt to break through and develop its upside progress later. I think that bulls and bears chances are equal currently and you are to follow the situation with caution before taking any decisions. If BTC price stays below the red descending trend line, sellers will likely push it further downside targeting the next support area at $6,701. However, once the descending line is breached, we have chances to go higher. I have set targets at $7,341. Ethereum (ETH/USD) bears retake control The current situation looks really strange to me as there is nothing to support bears. Nor bad news nothing events that may push Ethereum down. However, we see that ETH price is still unable to break this vicious circle. ETH price stays below the red descending trend line meaning we have equal chances for both sides. https://cryptocomes.com/sites/default/files/inline-images/eth_25.jpg (https://cryptocomes.com/bitcoin-ethereum-ripple-eos-decline-again-bears-counterattack-price-analysis-august-7) Ethereum failed to test the resistance area at $417.29 and failed to reach the red descending trend line on Monday. The currency pair declined towards the support area instead, reaching $404.55. The situation is really neutral as both sides now have equal perspectives. I think that ETH price is likely to test the red descending trend line today. In case if bulls fail, sellers will be able to push it lower and retest the support area at $404.55. Once breached, this level opens for Ethereum the path towards the nest support at $392.32. However, I think that the currency pair will successfully test the red descending trend line and move above it targeting $431.42 at least. Ripple (XRP/USD) breaks its neutrality Ripple declined in the past 24 hours for more than five percent as the currency pair breaks its neutrality and follow the other cryptos in their downtrends. Bears have taken control over the market and push the currency pair lower. https://cryptocomes.com/sites/default/files/inline-images/xrp_27.jpg (https://cryptocomes.com/bitcoin-ethereum-ripple-eos-decline-again-bears-counterattack-price-analysis-august-7) I can see currently the downtrend but I think it wont last for long. The closest support area lies at $0.3934. There Ripple is going to make a stop in order to start a correction at least. I have set my targets at $0.4495. I think that XRP price is going to move there after it reaches the support at $0.3934. However, I think that the changes for bulls and bears are equal currently. XRP price already established new local lows and bears have great chances to make new achievements. Bulls can also benefit from the situation when bears are exhausted. Take a look at EOS (EOS/USD) Price Analysis, August 7 (https://cryptocomes.com/bitcoin-ethereum-ripple-eos-decline-again-bears-counterattack-price-analysis-august-7) Title: Re: Daily price analysis BTC + ALTCOINS Post by: adaseb on August 07, 2018, 08:00:38 AM Basically its unfortunate that XRP broke its support at $0.42, I was long also and scaled back my position in case it keeps dropping. I really assumed this was the yearly low for XRP but I guess I was wrong.
BTC might of found its low at the $6800 since it failed to close lower and resulted in a nice doji close on the daily. Right now I am looking at the right shoulder and the high at ~7150 and hopefully it will close higher than that today or tomorrow. Title: Re: Daily price analysis BTC + ALTCOINS Post by: taliwang on August 07, 2018, 09:18:22 AM I think bitcoin prices will never be able to predict bitcoin price movements depending on the good news conditions that are specifically for cryptocurrency, the price of bitcoin depends on the presence of buyers and sellers so you should never be affected by the graph completely, you buy as much as possible when prices fall.
Title: Re: Daily price analysis BTC + ALTCOINS Post by: Dany44 on August 08, 2018, 08:06:57 AM Bitcoin, Ethereum, Ripple, EOS Suffer Significant Losses: Price Analysis, August 8
https://cryptocomes.com/sites/default/files/styles/912x570/public/2018-08/photo_2018-08-08_08-51-35.jpg?itok=rRyR9JqN (https://cryptocomes.com/bitcoin-ethereum-ripple-eos-suffer-significant-losses-price-analysis-august-8) Bitcoin and altcoins suffer significant losses, currency pairs establish new lows Hello, my name is Andrew Strogoff and Im going to give you my view of the situation on the crypto market today. As far as you can see, everything goes down. Bitcoin and altcoins have suffered significant losses. I have thoroughly studied news in an attempt to find out what is going on and I saw no clear reason for downtrends. As I have already told you previously, the reasons may be psychologic meaning market participants have fears of something and get rid of their digital assets. However, I also think that whales may drive the price in order to allow themselves to buy lower. As for the events, I would like you to pay attention to the following information. Blockchain data is legalized in Ohio (https://cryptocomes.com/ohio-legalizes-blockchain-data-other-us-states-considering-the-same). The other states consider to make the same This is a very important step on the way of technology adoption. Another interesting news comes from Japan where local student creates an application (https://cryptocomes.com/japanese-student-builds-crypto-app-to-let-voters-and-politicians-communicate) to help voters and politicians to communicate. The main aim of this PoliPoli app is to allow voters to talk directly to the politicians. Bitcoin (BTC/USD) makes new lows Bitcoin has suffered significant losses in the past 24 hours. You can see it on the chart. BTC price is below the red descending trend line meaning bears are controlling the market again and have the power to develop the downtrend. However, before they will try to push the price lower, I think the correction is needed. https://cryptocomes.com/sites/default/files/inline-images/btc_26.jpg (https://cryptocomes.com/bitcoin-ethereum-ripple-eos-suffer-significant-losses-price-analysis-august-8) If we take a closer look at the four-hour chart, we can see that the price has reached the support area at $6,510. BTC/USD has crossed a couple of supports recently including $6,943 and $6,701. The currency pair managed to break through the red descending trend line recently but returned to it, retested and went below again. Now, I think, Bitcoin is going to make a correction towards this red descending trend line again. The closest aim for the currency pair is the resistance area at $6,701. If tested successfully, bulls will be able to move further and to develop this correction towards the red descending trend line and the next resistance area later. However, if $6,701 stops BTC price from further growth, I expect bears to push it towards $6,510 to retest this level and to develop the downtrend later. Ethereum (ETH/USD) downtrend in play Ethereum declined and suffered significant losses in the past 24 hours. ETH/USD has lost more than six percent. This is the common tendency for the cryptocurrency market currently. However, I think that bulls have to say their word before bears are able to develop their progress. https://cryptocomes.com/sites/default/files/inline-images/eth_26.jpg (https://cryptocomes.com/bitcoin-ethereum-ripple-eos-suffer-significant-losses-price-analysis-august-8) Ethereum has reached the support area at $375.60. The currency pair has crossed a couple of supports in the past 24 hours as this downtrend was strong and buyers had no chances to change the situation. The currency pair stays far below the red descending trend line. I think that ETH/USD is going to start a correction currently as ETH price has done a huge dive in the past 24 hours. This upside correction will aim the closest resistance area at $392.32 at least. If bulls test this level successfully and manage to break through the descending trend line, they are likely to drive ETH/USD higher to new resistance areas. However, bears are still in force and I think they will try to push ETH/USD lower after the upside correction. They are likely to retest the support area at $375.60 Ripple (XRP/USD) todays big loser, ready for a correction Ripple has lost more than 10 percent in the past 24 hours. The situation is really catastrophic for the buyers as the currency pair has broken through a couple of support areas without significant difficulties. This means that the whales may push all the currencies somewhere to have nice opportunities to buy for lower prices. https://cryptocomes.com/sites/default/files/inline-images/xrp_28.jpg (https://cryptocomes.com/bitcoin-ethereum-ripple-eos-suffer-significant-losses-price-analysis-august-8) Anyway, it is time for bulls to be defensive. The situation is not favorable for them as bears destroy their defensive lines one by one. However, I think that buyers are likely to make an upside correction in the nearest future. Their target is at the resistance area at $0.3934. I think that the price will be there on Wednesday-Thursday. However, bears are too strong currently. They have total control over the market and establish new lows. I expect sellers to counterattack after the end of this upside correction. They will target this current support area at $0.3503 again. If successful, bears will be able to develop their progress. Take a look at Ripple (XRP/USD) & EOS (EOS/USD) Price Analysis, August 8 (https://cryptocomes.com/bitcoin-ethereum-ripple-eos-suffer-significant-losses-price-analysis-august-8) Title: Re: Daily price analysis BTC + ALTCOINS Post by: hgsteknoloji on August 08, 2018, 08:27:38 PM I think btc is doing a weekly move with first targets at 4900/5200... A bounce from $6200/6300 to 6700/6900 is very possible and then dip again ,
Title: Re: Daily price analysis BTC + ALTCOINS Post by: sumanto on August 09, 2018, 05:22:58 AM in my opinion the price of bitcoin and altcoin in 2018 will never be predicted the price movements of bitcoin and altcoin will not be clear because the current market conditions are very vulnerable to attack by bad news and it is very easy to panic traders so that prices will never be able to prediction.
Title: Re: Daily price analysis BTC + ALTCOINS Post by: Dany44 on August 09, 2018, 08:08:35 AM Bitcoin, Ethereum, Ripple, EOS Develop Downtrends, Suffer Big Losses: Price Analysis, August 9
https://cryptocomes.com/sites/default/files/styles/912x570/public/2018-08/coins_10.08.jpg?itok=6nSLPJ8x (https://cryptocomes.com/bitcoin-ethereum-ripple-eos-develop-downtrends-suffer-big-losses-price-analysis-august-9) Bitcoin and altcoins new lows reached, bulls are frustrated Hello, this is Andrew Strogoff again. This situation in the crypto market remains negative as Bitcoin and altcoins continue to fall and suffer significant losses on Tuesday. I was talking about a probability of a correction, but it seems that investors dont pay attention to the technical analysis at all as they continue to get rid of cryptos quickly. However, this downtrend may be a game of whales who want to push the price lower in order to buy it with benefits. If this is true, I think we still have some long distance to do. As for the events, there is nothing to affect the price significantly. However, I have prepared some interesting events for you. Lets get down to them. Opera Browser launched their own crypto wallet (https://cryptocomes.com/opera-to-launch-its-crypto-wallet-on-desktops-introducing-biometric-verification). This wallet, released in July 2018, is Ethereum compatible. This add-on allows users to make payments using Windows devices. Bitcoin (BTC/USD) establishes new lows Bitcoin developed its downtrend on Tuesday as bulls have almost no chances. There were more red candlesticks again. BTC/USD has lost nearly four percent in the past 24 hours and established new local lows. The currency pair resides below the red descending trend line and even failed to approach it yesterday. https://cryptocomes.com/sites/default/files/inline-images/btc_09.08.jpg (https://cryptocomes.com/bitcoin-ethereum-ripple-eos-develop-downtrends-suffer-big-losses-price-analysis-august-9) As you can see it on the four-hour chart, Bitcoin develops its downtrend with huge momentum. I spoke about a correction in Tuesdays review, but it hasnt happened as bears continued to push it and smash bulls. This sellers success is strange, however, I gave a couple of versions at the beginning of this review. I thought that BTC/USD (https://u.today/bitcoin-price-prediction-20182025-10-forecasts-from-professionals) were going to reach the red descending trend line, but the currency pair failed to get there as Bitcoin developed the downtrend instead. It is hard to predict further fluctuations now. I still think that BTC/USD needs a correction even if it is going to develop its downtrend in future. This correction may aim $6,510 resistance at least. If buyers are successful, BTC/USD may develop this uptrend targeting next resistance areas. However, bears are very strong currently and they are able to develop this downtrend even without any correction at all. BTC price is below the resistance area at $6,329 and they may start off from there. Ethereum (ETH/USD) follows Bitcoin on its way down Ethereum developed the downtrend following Bitcoin. The whole crypto market shows negative dynamics in the past several days as investors pay less interest to this industry. ETH/USD stays below the descending trend line and far from it. I think that bulls are ready to counterattack, but as I see, investors pay less attention to technical analysis as well currently. https://cryptocomes.com/sites/default/files/inline-images/eth_09.08.jpg (https://cryptocomes.com/bitcoin-ethereum-ripple-eos-develop-downtrends-suffer-big-losses-price-analysis-august-9) ETH/USD has reached the support area at $355.45 and established new lows. Ethereum has lost more than four percent in the past 24 hours showing that sellers are still very strong as they managed to push it lower without any correction. I think that the upside correction should happen now and its targets are at the resistance area at $375.60 at least. If bulls are stronger, they will be able to drive Eth/USD even higher. There are several interesting levels above. However, sellers have control over the market currently and they are very strong and powerful as the moment. This means that you need to be cautious when placing buy orders expecting upside correction. Ripple (XRP/USD) develops the downtrend Ripple has lost more than four percent in the past 24 hours. The currency pair stays far below the descending trend line meaning bears have full control over the situation. Buyers are frustrated as they are unable to counterattack. I have expected some sort of correction on Tuesday, but as you may see it, there was none yesterday. https://cryptocomes.com/sites/default/files/inline-images/xrp_09.08.jpg (https://cryptocomes.com/bitcoin-ethereum-ripple-eos-develop-downtrends-suffer-big-losses-price-analysis-august-9) Ripple has reached the support area at $0.3503 and even managed to break it through. However, bulls seem to be able to drive it towards this level to retest it again. Lets see what will happen in the nearest future. I think that the buyers are going to counterattack now. The correction is truly needed and XRP price is likely to run towards the closest resistance area at $0.3934 (after jumping over the resistance at $0.3503). I think that this target is primary for today. What may happen next? If buyers are successful, they will be able to drive Ripple even higher as there are many interesting targets on the way. However, we should not forget that bears are too strong now and they are able to change the situation in their favor at any moment. Take a look at EOS (EOS/USD) Price Analysis, August 9 (https://cryptocomes.com/bitcoin-ethereum-ripple-eos-develop-downtrends-suffer-big-losses-price-analysis-august-9) Title: Re: Daily price analysis BTC + ALTCOINS Post by: el kaka22 on August 09, 2018, 09:40:04 AM in my opinion the price of bitcoin and altcoin in 2018 will never be predicted the price movements of bitcoin and altcoin will not be clear because the current market conditions are very vulnerable to attack by bad news and it is very easy to panic traders so that prices will never be able to prediction. Yes, bitcoins and altcoins are behaving in very typical way which was not observed in the past as per my view. When bitcoin was rising, altcoins were falling and when bitcoin was falling again altcoins also falling. This results in bitcoin dominance to be really high and we know that can't stay that way for too long.It will eventually drop (not bitcoin, the dominance) as long as bitcoin stays high the bitcoin dominance will drop because the money coming in will go back to altcoins and the price of those coins are not bad in dollar value right now they are just losing value against a bitcoin that is going up, in the end they will go up in bitcoin value as well which means they will gain value in dollar compared to now as well. Title: Re: Daily price analysis BTC + ALTCOINS Post by: hgsteknoloji on August 17, 2018, 07:10:29 AM BTC should go to $6800/7100 now and Probably that would be the end of the bullish move of Btc and altcoins
Title: Re: Daily price analysis BTC + ALTCOINS Post by: hicies on August 21, 2018, 10:37:49 AM BTC should go to $6800/7100 now and Probably that would be the end of the bullish move of Btc and altcoins Bitcoin price will no doubt expected to reach to 8000$ very soon, but I think that it is not the bullish end for bitcoin and other altcoin. I hope that once bitcoin price will start increasing and will reach to 8000$ then it will continue to increase it s price for a long time and will not dump again so easily. Title: Re: Daily price analysis BTC + ALTCOINS Post by: Dany44 on August 29, 2018, 10:25:55 AM Cryptocurrency market shows us positive signs at last
https://u.today/sites/default/files/styles/912x570/public/2018-08/photo_2018-08-29_12-54-27.jpg?itok=rgR79mf5 (https://u.today/bitcoin-btc-cardano-ada-show-signs-of-short-term-bullish-wave-price-analysis-aug-29-2018) *** Please note, the analysis below is not an investment advice. The views and opinions expressed here are solely those of the author and do not necessarily reflect the views of U.Today. Every investment and trading move involves risk, you should conduct your own research when making a decision. Over a long time, we can pick up some positive signs from the cryptocurrency market and so as our next analysis- Bitcoin (BTC) & Cardano ( ADA ). We have been on the down-train, yes train, for a very long time but at the moment looks like we have some changes in the market structure. Lets start with Bitcoin At the moment I would like to share some higher resistance areas if somebody doesn't know where to take out some profits if we fly higher, and one technically good entry point if we start to make a pullback! From my point of view, the first strong resistance is around $7,286-$7,349. Historically, this level is worked nicely and if somebody is on the trade then this level is definitely one point where you must consider to take out some partial profit. If we rally through this level right away then the second one is $7,500 (described later in the post)! If you are not in the trade at the moment then definitely do not enter before we make a pullback or before we haven't got any significant confirmation, because the current price is very risky and full of FOMO, it may fall down quickly! The pullback may happen because we are on the trendline which is pulled wick to wick(first touch Aug. 8 and the second touch Aug. 22) and we are on the decent resistance zone (we have the May low and around number $7,000) Where we can enter the trade after the pullback!? https://u.today/sites/default/files/inline-images/image1_6.jpg (https://u.today/bitcoin-btc-cardano-ada-show-signs-of-short-term-bullish-wave-price-analysis-aug-29-2018) From the current price perspective (current price is $7,052), the ideal entry point would be around $6,700-$6,800. Entry point criteria: 1. We have historically a strong resistance which now becomes a support at $6,766 2. Fibonacci I- pulled from Aug. 8-28 retracement 38 percent 3. Fibonacci II- pulled from Aug. 26-28 retracement 62 percent 4. Close to upwards trendline- pulled from bodies since Aug. 14 5. Supported with 50 daily EMA 6. Supported with multiple EMA's on the 4h chart 7. Definitely, we wait and watch the current price action in this area if we reach there Target $7,500 criteria (for those who are in the trade at the moment and for those who enter a trade after the pullback): 1. Fibonacci pulled from July 24- Aug. 14 2. Round number 3. Trendline since May 5th 4. Fibonacci extensions (entry point Fibonacci's) 5. Round number and Fibonacci retracement level are just SO identical! Cardano (ADA/USDT) Around $0.09 area, we have found a bottom what we have tested two times and we can call this a "Double bottom" (W-formation) After we made a second touch around $0.09 we have a steady climb upwards. Firstly, we break the down-trendline (which is pulled from 02.05.2018 and the second touch 18.07.2018) and we made a breakout from "Descending Triangle". The descending triangle is a bearish pattern but the triangle patterns have a breakout opportunities to either direction and at the moment we made a breakout upwards- bullish sign, and after those breakouts, we made a structure change, we manage to make HH (higher high) on the market! https://u.today/sites/default/files/inline-images/image2_6.jpg (https://u.today/bitcoin-btc-cardano-ada-show-signs-of-short-term-bullish-wave-price-analysis-aug-29-2018) Currently, you can see that there are two blue target boxes first is above the current price of 10 percent and the second 18 percent. So, probably there you can see some price bounce or price stop because those levels are historically worked. First one is June low/support which now becomes a resistance and the second one is the July low which now may become support! If you want to enter the coin (https://u.today/how-to-buy-cryptocurrency-all-possible-ways-for-beginners) then there is an opportunity if the price falls down a little bit. Like you know we have a breakout from the triangle and the perfect breakout trade would be- breakout and wait for a retest! So, at the moment we could see that we may start to make a pullback because on the four-hour chart has formed a three candle candlestick pattern called "Evening Star" ( bearish pattern). Currently looks like the solid spots where to enter the trade are: $0.1 - criteria: round number, Fibonacci retracement level 38 percent and supported with EMA's $0.095 - criteria: it would be close to retest area, perfect Fibonacci retracement level 62 percent Hopefully, this helps you out a little bit to confirm your own analysis! Definitely make your own research! Have a nice day! (https://u.today/bitcoin-btc-cardano-ada-show-signs-of-short-term-bullish-wave-price-analysis-aug-29-2018) Title: Re: Daily price analysis BTC + ALTCOINS Post by: hgsteknoloji on August 29, 2018, 04:07:49 PM 6850 holded well!
But it will come back down to that level before comin back up to 7070/7100, this looks like a typical distribution zone...Btc is changing hands and the top of today (7140) was the top of this move Title: Re: Daily price analysis BTC + ALTCOINS Post by: Dany44 on August 30, 2018, 09:35:17 AM Looks like the crypto market starts to make a little pullback
https://u.today/sites/default/files/styles/912x570/public/2018-08/photo_2018-08-30_11-45-46.jpg?itok=1eKgK0cq (https://u.today/bitcoin-btc-ethereum-eth-ripple-xrp-ready-for-pullback-crypto-price-analysis-aug-30-2018) *** Please note the analysis below is not investment advice. The views and opinions expressed here are solely those of the author and do not necessarily reflect the views of U.Today. Every investment and trading move involves risk, you should conduct your own research when making a decision. BTC could make a pullback and so can altcoins! Yesterday, after the triple top we have seen some downwards movements and we have collected the signs that a movement downwards may happen! https://lh6.googleusercontent.com/E13YY7DdWmn9zM8mzf3SQoyWQYGpxyNKe-GQUQjPRMi_bSyGXPN4EkszaJO8vbq8pLAtoxAHSNLdqdpLO4uuP4SpSf3XiDK_iEhEdaSIAf83cYtHH06XpD0cdQ4c1Bz3QVBbRrOS (https://u.today/bitcoin-btc-ethereum-eth-ripple-xrp-ready-for-pullback-crypto-price-analysis-aug-30-2018) We have a break below the triangle, we have a break below the red trendline which was resistance and now it becomes a support, we have a break below the round number! At the moment the price retests this round number area and we are ready to go lower! Also, we have a lower low and a lower high price structure which indicates that the leg down is coming but you already know where you can enter the trade if you see a correct price action at this level- $6,700-$6,800! Let's see what the altcoins do in this situation... Ethereum (ETH/USD) important aspects of staying healthy Currently, the market looks like it is starting to make a little pullback! BTC has pointed down and shows some pullback signs and so does Ethereum! We have some signs from the daily timeframe and from the 12-hour timeframe. In the daily timeframe we could see a bearish candlestick pattern called "Tweezer top" and in the 12-hour timeframe there is also a bearish pattern called "Evening Star. So, this will indicates that we start to make a little pullback also on the ETH/USD chart. https://lh4.googleusercontent.com/DwnJ__8umdlU71hd3d1aMWNmK_IHukW_ic6S4CFZ25mqoVZ3S58KSkgo4TBo9sg8xMBoeZw0n7HEYGT3VnfUFwqQ8Cf-g6g_hQ1tFFJ32IzPFuKPXRKvMp56UDxBJ0j28UgIbthB (https://u.today/top-7-best-bitcoin-trading-bots-in-2018) If the price structure wants to stay healthy then the pullback can't be lower than $270-$275. Why? At the moment we have a nice HL at the $270 level but if we drop below that then we make a new lower low and also we have a close below the strong support (blue line) which all indicates bearishness. In the image, you can also see bearish confirmation box, at least the four-hour candle closes in this area could mean disaster for ETH and it may go to around $200. https://lh6.googleusercontent.com/k0xNh1o6cS_FaVrYqFcEF5yOzG-ljq5QWgvi8DcjUA9knDeOX0WC-cB7PYmK-9MMplRCBtwxfnutkO2eAWkFfYm4heFqj5152CdXlSB88L8jGsG2B2mIgDngePw74wpiu0fp3Cvj (https://u.today/bitcoin-btc-ethereum-eth-ripple-xrp-ready-for-pullback-crypto-price-analysis-aug-30-2018) If we stay 'healthy' and we get a bounce around $270-$275 (bounce is supported by- strong support level and Fibonacci 62 percent retracement level) then we have made a new HL (higher low) and we are ready to climb higher. The first obstacles are the triangle trendline and the round number which is $300. To be fully confirmed that we start to heading upwards we have to make a new higher high which is around $330-$340. Take a look at Ripple (XRP/USD) Price Analysis Aug. 30, 2018 (https://u.today/bitcoin-btc-ethereum-eth-ripple-xrp-ready-for-pullback-crypto-price-analysis-aug-30-2018) Title: Re: Daily price analysis BTC + ALTCOINS Post by: Dany44 on August 31, 2018, 09:57:00 AM Like we had planned- pullback happened and the bounce level was precise!
https://u.today/sites/default/files/styles/880/public/2018-08/Pic%201.jpg?itok=W_EhStWw (https://u.today/bitcoin-bounces-up-as-ethereum-neo-look-for-troubles-crypto-price-analysis-aug-31-2018) *** Please note the analysis below is not investment advice. The views and opinions expressed here are solely those of the author and do not necessarily reflect the views of U.Today. Every investment and trading move involves risk, you should conduct your own research when making a decision. BTC possible targets Yesterday, after we posted- we could make a pullback and you already know where to enter the trade ($6,709-$6,800) if the pullback occurs. It happened, and we also got a bounce upwards exactly from $6,800. The current price is $7,000 and we are our first target point where we could take out some partial profits because if the market wants to go lower then here is the decent place where it could turn around because in this area it makes a lower high on the price structure, but if we start to go higher than our next targets would be: 2. Around $7,300- strong and historically worked levels! 3. Around $7,500- final target: * Fibonacci pulled from July 24- Aug. 14 * Round number * Trendline since May 5th * Fibonacci extensions (entry point Fibonacci's) * Round number and Fibonacci retracement level are just SO identical! Let's see how the market and the price reacts on these price levels. https://lh3.googleusercontent.com/xHH5S87y6xszRNRWNQjP7mdilCaLtpeNAp2hfpnTFpJ72CDKeoioROz1APURVTmcXn7rXv9XLQhOl9yeoeOImmWkdoW8ABhJC_kBtdOEo0r42XunQtBkDpstJj31dNd8kUv1i84G (https://u.today/5-most-secure-bitcoin-and-cryptocurrency-wallets-2018) Ethereum managed to stay healthy and it got a bounce from our mentioned evel! Currently, on the Ethereum chart, we could see that it stayed "healthy. Like we expected yesterday we have to bounce upwards around $270-$275 if the price structure wants to stay bullish and exactly from this area we got our bounce and we have made a clean higher low (HL) on the chart. The bounce was supported with a perfect Fibonacci retracement level 62 percent and a blue line which means the strong support area. Now our nearest resistance is this triangle upper trendline and round number $300 crossing area! Those crossing areas area always hard to beat but if we see at least a four-hour candle close above the $300 then it could be mean that we make another leg upwards and if Ethereum wants to make a higher high (HH) then we have to see a candle close around $330. https://lh5.googleusercontent.com/ZnVAWKDQFtBLU7Z85DipW7w4hffxNSorMJJRPaihyMmRoZXuZ6SJiku4M1GwnoT_2sBr4jlrb__jOGXR4DSJuaRqm7nbSo4DPD7QNgcbltz2Qe79UVBapU_sI1gCWIKKMGH-1vIh (https://u.today/bitcoin-bounces-up-as-ethereum-neo-look-for-troubles-crypto-price-analysis-aug-31-2018) Take a look at NEO (NEO/USD) Price Analysis Aug. 31, 2018 (https://u.today/bitcoin-bounces-up-as-ethereum-neo-look-for-troubles-crypto-price-analysis-aug-31-2018) Have a nice day! Title: Re: Daily price analysis BTC + ALTCOINS Post by: R9s on August 31, 2018, 10:18:34 AM Thank you for your analysis. If Bitcoin can evolve according to analysis, then I think you may make a lot of money, but the status quo of Bitcoin is not optimistic!
Title: Re: Daily price analysis BTC + ALTCOINS Post by: Bakemat on August 31, 2018, 03:30:17 PM BTC should go to $6800/7100 now and Probably that would be the end of the bullish move of Btc and altcoins Bitcoin price will no doubt expected to reach to 8000$ very soon, but I think that it is not the bullish end for bitcoin and other altcoin. I hope that once bitcoin price will start increasing and will reach to 8000$ then it will continue to increase it s price for a long time and will not dump again so easily. It will really reach 8k dollars because of the bullish market today and we can expect for the price to rise up again because the value of bitcoins has started at $7k dollars before it skyrocket to $19k, so try to expect higher price this year because of legalization of bitcoins in other countries. Title: Re: Daily price analysis BTC + ALTCOINS Post by: Dany44 on September 03, 2018, 09:37:48 AM Last week was bullish for crypto market, but there is room to go higher
https://u.today/sites/default/files/styles/880/public/2018-09/Pic%204%402x.png?itok=NcUwen3q (https://u.today/bitcoin-fights-strong-resistance-ethereum-tries-to-break-out-of-the-triangle-ripple-pulls-back) Please note the analysis below is not investment advice. The views and opinions expressed here are solely those of the author and do not necessarily reflect the views of U.Today. Every investment and trading move involves risk, you should conduct your own research when making a decision. Bitcoin fights historically strong resistance Over the weekend, the Bitcoin price showed us a very steady grind upwards and because of it, there was a steady growth on the altcoins list. Currently, the BTC chart shows us that we are on the strong resistance area which is $7,286-$7,349. From here we expect a little pullback or the price stop just a while and if we break this area then our short-term target would be around $7,500. $7,500 target criteria: * Fibonacci pulled from July 24-Aug.14 * Round number * Trendline since May 5 * Fibonacci extensions (entry point Fibonacci's) * Round number and Fibonacci retracement level are just SO identical. https://u.today/sites/default/files/inline-images/btc_28.jpg (https://u.today/3-major-paradigm-shifts-in-crypto-space-bitcoin-smart-contracts-social-layer) Let's talk a little bit about the current pullback. At the moment the price is above the minor trendline which is pulled from the wicks. It makes for us an upward channel, the price may go inside this channel and the first bigger retest area is around $7,000. There we can find a May low which works as a support, round number and in the four-hour chart, we could see that the 50 EMA starts to work as a support. If it drops lower, then our next support is around $6767 which is historically worked level and there is also our last trendline. This has to hold us, if not then we go definitely test the lower levels. Ethereum still in symmetric triangle The current situation on the ETH chart shows us that, after the bounce upwards from our mentioned level, we tried to break outside the triangle and tried to break the round number $300 but this attempt was unsuccessful. ETH price was very close to make a breakout but we didn't find much power to hold the price above the $300. https://u.today/sites/default/files/inline-images/eth_28.jpg (https://u.today/10-best-penny-cryptocurrency-to-invest-right-now-in-2018) Luckily, we had something positive on the ETH chart- ETH price structure made a small higher high which indicate that we are still on the rising mode and now the pullback definitely have to hold us over the blue support line if we want to stay bullish (marked as Strong Area). We know that soon we will see some bigger action on the Ethereum chart because we are on the triangle tip where the price is 'pushed ' together and soon it will launch. At the moment definitely don't trade this and wait for a breakout from the triangle. Breakout from triangle means short-term Ethereum direction and breakout is confirmed when we have at least a four-hour candle outside that area. Take a look at Ripple (XRP) Price Analysis , Sept. 3, 2018 (https://u.today/bitcoin-fights-strong-resistance-ethereum-tries-to-break-out-of-the-triangle-ripple-pulls-back) Have a nice day! Title: Re: Daily price analysis BTC + ALTCOINS Post by: Deku on September 03, 2018, 11:59:47 AM BTC should go to $6800/7100 now and Probably that would be the end of the bullish move of Btc and altcoins Bitcoin price will no doubt expected to reach to 8000$ very soon, but I think that it is not the bullish end for bitcoin and other altcoin. I hope that once bitcoin price will start increasing and will reach to 8000$ then it will continue to increase it s price for a long time and will not dump again so easily. It will really reach 8k dollars because of the bullish market today and we can expect for the price to rise up again because the value of bitcoins has started at $7k dollars before it skyrocket to $19k, so try to expect higher price this year because of legalization of bitcoins in other countries. Title: Re: Daily price analysis BTC + ALTCOINS Post by: Dany44 on September 04, 2018, 01:06:49 PM Bitcoin moves sideways between the two strong levels and waiting for a breakout but which way?
https://u.today/sites/default/files/styles/880/public/2018-09/Pic%203%402x_0.png?itok=_4sClDrz (https://u.today/bitcoin-price-consolidates-eos-looking-to-a-rally-cardano-climbing-up-crypto-price-analysis-sept-4) *** Please note the analysis below is not investment advice. The views and opinions expressed here are solely those of the author and do not necessarily reflect the views of U.Today. Every investment and trading move involves risk, you should conduct your own research when making a decision. Bitcoin possibly breakout opportunities Currently, we are still between those two resistance lines (blue lines). To give you an indication where we might go then we have an Inside bar candlestick pattern (black lines from the wick). We already have a higher close from this important candle but we need also a close above the wick, above the black line and if we get a close above $7,350 then we have two confirmations- breakout from the Inside bar main candle and break above the strong resistance levels. If we lose the bullish momentum and we start to make a bigger pullback downwards then those confirmations are close below the Inside bar candle range ($7,200) and close below the trendline (black diagonal line). https://u.today/sites/default/files/inline-images/image3_8.png If the market stays stable EOS may start to rally upwards! From the last month, we got a nice "Hammer" candlestick pattern (bullish pattern), bounce upwards was from $4 and the close was $6.4. Last week EOS made a little bit over 30 percent growth (open $4.9, close $6.6) and it made a break above the major down-trendline. Currently, the weekly chart shows us also a very positive sign, we have a "Morning Star" candlestick pattern which will indicate bullishness. If Bitcoin and the whole market stays stable then we could definitely see some rally upwards because, we have two strong candlestick patterns on the higher timeframes - super strong sign. https://u.today/sites/default/files/inline-images/image1_20.png (https://u.today/eos-price-prediction-how-much-will-eos-cost-in-2018-2020-2025) On the four-hour chart the current price is above the EMA's (50,100,200) but if we want to move upwards then we have to take down the July low which is around $6.5 and above the July low is also a very strong resistance what you need to watch: the round number $7 and there are also old supports which now becomes a resistance. So, above us, you have to watch two levels $6.5 and $7. If we take those levels down then we may go almost straight to $10 because 100 & 200 EMA is pointed upwards and ready to make a death cross. Take a look at Cardano (ADA) Price Analysis , Sept. 4, 2018 (https://u.today/bitcoin-price-consolidates-eos-looking-to-a-rally-cardano-climbing-up-crypto-price-analysis-sept-4) Have a nice day! Title: Re: Daily price analysis BTC + ALTCOINS Post by: BTC_BTC on September 04, 2018, 04:07:19 PM Here will be the latest price analysis for BTC and altcoins (https://cryptodetail.com/category/altcoins). good snslids, it seems you really observe the market very well.We appreciate your opinion. Daily reviews are also placed on https://cryptocomes.com/pricewise (https://cryptocomes.com/pricewise) https://i.imgur.com/CuYXzTr.png (https://cryptocomes.com/pricewise) I think at this time the volume still hasn't changed still remains flat. Title: Re: Daily price analysis BTC + ALTCOINS Post by: arikassuja on September 05, 2018, 05:46:34 AM I think the movement of the graph is not very certain and you will never be able to predict what movements or graphs will be created in the future, make this chart only as an evaluation of your trading.
Title: Re: Daily price analysis BTC + ALTCOINS Post by: Dany44 on September 05, 2018, 09:01:21 AM Bitcoin- sixth attempt was successful, Ethereum cant find the momentum, Litecoin fights with trendline
https://u.today/sites/default/files/styles/880/public/2018-09/Pic%204%402x_0.png?itok=JIokJwQM Please note the analysis below is not investment advice. The views and opinions expressed here are solely those of the author and do not necessarily reflect the views of U.Today. Every investment and trading move involves risk, you should conduct your own research when making a decision. Bitcoin (BTC) breaks above the strong resistance areas Yesterday we made a breakout of $7,349 (upper blue line). We had tried to break this five times but all attempts were unsuccessful but the bulls managed to hold the price up near the resistance and finally the sixth attempt was successful. https://u.today/sites/default/files/inline-images/image2_18.png Bitcoin made a breakout upwards but our next resistance is not far away from us and you already know, the next resistance is $7,500-$7,600, and looks like we are going to test this area. We have a little problem, Bitcoin doesn't show the high volume, maybe this could be the only problem but let's see technically looks all very promising. Litecoin (LTC)- have to fight with the last down-trendline Currently, LTC price is below the round number $70 and we are still below almost the last major down-trendline pulled on the four-hour chart from the wicks. This crossing area makes it difficult to break through from here although the $70 haven't been so difficult level for Litecoin but like always those crossing areas makes it a little bit harder to break through. https://u.today/sites/default/files/inline-images/image3_12.png If we get another leg upwards then above the trendline we have right away the very strong resistance level which consists of the July and June lows around $72-$74 and also Fibonacci retracement areas are in this level zone. We have to take down this level if we want to see a bullish Litecoin. At the moment the price trades above the important EMA's (50, 10, 200) we have a golden cross between the 50 and 100 EMA and we are starting to make it also with 100 and 200. If we had the bigger golden cross (100&200) then we could say that the chance to go straight through from this trendline is a bit bigger change but at the moment we could make a small pullback before we can make the breakout upwards. If we start to make a pullback then luckily we have the EMA's which works as the supports and we have a counter trendline which could work as a support. If we break below the counter trendline then this is definitely very bad for Litecoin (https://u.today/wikicoin-litecoin) price and we may go and retest the $50 again. Also, it depends on what the whole market does. Take a look at Ethereum (ETH) Price Analysis, Sept. 5, 2018 (https://u.today/bitcoins-sixth-attempt-to-break-it-ethereums-momentum-litecoin-fighting-trendline-crypto-price) Have a nice day! Title: Re: Daily price analysis BTC + ALTCOINS Post by: hgsteknoloji on September 05, 2018, 05:09:26 PM All the gains that this market has slowly been making for 5 days were wiped out with a single candle within hours.
I initially planned to go long at these levels 6800-6900,but actually I do not want to do that yet because of how sharp this drop was. It may indicate a larger move, and not just a correction (that candle was definitely not how a correction/pullback should look like). Title: Re: Daily price analysis BTC + ALTCOINS Post by: Dany44 on September 06, 2018, 09:53:20 AM Bitcoin, NEO, Cardano, EOS Ready to Bounce After Drop: Crypto Price Analysis, Sept. 6, 2018
https://u.today/sites/default/files/styles/880/public/2018-09/photo_2018-09-06_12-27-55.jpg?itok=DO-OP7fF Bitcoin made more than a $1,000 drop *** Please note the analysis below is not investment advice. The views and opinions expressed here are solely those of the author and do not necessarily reflect the views of U.Today. Every investment and trading move involves risk, you should conduct your own research when making a decision. Bitcoin- all strong supports are broken, only one left on the current price Yesterday we said that if the price closes below the strong support line (blue line) and below the minor upper trendline, which is also a part of the continuation pattern "Rising Wedge, then we will drop into the $6,500 area. Currently, we are in this area. In August, we attempted to break above this level many times and currently, the old resistance becomes a support. https://u.today/sites/default/files/inline-images/btc.png RSI is totally oversold and we made over a $1,000 drop which is massive. So, we could guess that we could find a small support from here and this support will guide us may be around $6,700. There is a historically strong level which started to work as a resistance and from the current drop points (high to low) pulled the Fibonacci retracement to 38 percent in this area. Currently, we just have to wait and see what the price action shows us, maybe we can find something positive! Let's take a look at how the altcoins react to this "market crash. NEO (NEO/USD) trades below the upward channel Since yesterday, NEO came down ~26 percent and we trade below the channel and below the round number $20! https://u.today/sites/default/files/inline-images/NEO.png (https://u.today/wikicoin-neo) We got a bounce from $18 where the Fibonacci retracement level is 62 percent and from the support which was there before the resistance (black line). On the four-hour chart, we trade below the EMA's, actually, in all timeframes we trade below the EMA's and that's not a good sign like we said, we have also a breakout downwards from the upwards channel. If we want to search for some positive signs then at the moment NEO price is in the area where it still could make a higher low, after the bounce from the Fibonacci level we got a "Hammer" candlestick pattern, but this is a very small pattern because there is still panic in this market. A close below $18 confirms a lower low and in addition, we have a change in the price structure which will indicate that we may come down and retest the $13 area. But if BTC finds the support from the current price then NEO will follow suit because it looks solid compared to others altcoins. Take a look at Cardano (ADA) and EOS (EOS/USD) Price Analysis, Sept. 6, 2018 (https://u.today/bitcoin-neo-cardano-eos-ready-to-bounce-after-drop-crypto-price-analysis-sept-6-2018) Have a nice day! Title: Re: Daily price analysis BTC + ALTCOINS Post by: Dany44 on September 07, 2018, 09:01:13 AM Bitcoin makes a small recovery but it is on the Rising Wedge, Monero (XMR) shows some positive signs and our mentioned NEO was yesterday on of the top gainers
https://u.today/sites/default/files/styles/912x570/public/2018-09/Pic%204%20%282%29.jpg?itok=WxWK9BvP Bitcoin started to make a small recovery and so have alts Currently, Bitcoin starts to make a recovery but definitely nothing remarkable because we dropped -$1,100 and we have made recovery +$200. At the moment, it moves slowly upwards and a positive sign is this that the daily candle closes above the strong area $6,509. In August, the $6,500 area was very hard resistance to beat but after many attempts it was successful and now the old resistance becomes a support. https://u.today/sites/default/files/inline-images/image3_11.png Like you see on the one-hour timeframe, we start to make new short-term higher highs and higher lows on the important level. Currently, it looks good but those HH's and HL's starts to form a continuation pattern "Rising Wedge" which will indicate the future direction. If it breaks below the lower trendline then it's simple, we follow the trend, which is down and continuation pattern starts to work correctly and the first bigger target would be around $6,000 but if we make a breakout upwards then we might go and retest the $6,767 area. This area is also historically very strong and it would require a lot of power to break above but there are also other criteria: *Fibonacci retracement level 38 percent (pulled from the Sept. 5th, which is the high point, to Sept. 6th which is the low point) * Different timeframes EMA's starts to work as resistances. Lets look at how altcoins have reacted after Bitcoins small recovery. Monero (XMR) looks good but it all depends on Bitcoin The day before yesterday, Monero was down 22 percent but Bitcoin finds a support from the strong area and after that, we saw a nice upwards movement from Monero. https://u.today/sites/default/files/inline-images/image2_13.png Technically the bounce came from the strong price levels where are several reversal criteria: 1. Channel bottom trendline bounce 2. In the three-hour and the four-hour chart we could see that EMA 200 works as a support 3. Smaller Fibonacci retracement level is perfectly 62 percent 4. Bigger Fibonacci retracement level is 50 percent 5. Old resistance becomes support 6. We are in the higher high area So, technically Monero (https://u.today/monero-price-prediction-20182025-how-much-will-xmr-cost) can continue climbing up, but all depends on Bitcoin: if it breaks above the Rising Wedge then Monero will follow. The starting platform is very good and the first target would be the major trendline touch above us. If it breaks above the trendline then there are several red lines, those are monthly lows and monthly highs and that makes the $150 very hard to beat. If Bitcoin makes a breakout from the continuation pattern downwards then Monero bearish confirmation area would be a close around $105. Then we have a breakout from the upwards channel and if we get a close below the $100 then we have also a break below the round number and we have made a new lower low which all indicates bearishness. Take a look at NEO Price Analysis, Sept. 7, 2018 (https://u.today/bitcoin-on-rising-wedge-monero-looks-good-neo-among-top-gainers-crypto-price-analysis-sept7-2018) Have a nice day! Title: Re: Daily price analysis BTC + ALTCOINS Post by: Dany44 on September 10, 2018, 12:14:15 PM Bitcoin- Bad Signs, EOS Looks Good, ETH is On the Edge: Crypto Price Analysis Update, Sept. 10, 2018
https://u.today/sites/default/files/styles/880/public/2018-09/Pic%203_1.jpg?itok=7mUj6b1b Bitcoin- bad signs come from the weekly candle close We are again in a well-known area between the $6,000-$6,500 where the big guys dont even hide their movements. Just a quick sell off and the next day a quick buyback and etc. Bad signs come from the weekly candle, the previous week close was below the $6,500 mark, below the April low and below the strong support area, which all indicates that there is a very big selling pressure. The previous weeks close (bearish Engulfing candlestick pattern) gave us another lower low close and again, the overall market structure is bearish. https://u.today/sites/default/files/inline-images/image2_17.png Currently, BTC price moves in the down channel and it has broken support after support. This channel guides us exactly into the $6,000 range where there is a major counter trendline, pulled from the June 24th low and from the Aug. 14s low. So, if it drops, then this is the first target that we have to watch where we want to search and predict any further moves. https://u.today/sites/default/files/inline-images/image3_9.png Currently, trading is definitely very risky because we don't have any significant confirmations. Confirmations are only bearish and come from the weekly chart but if you want to know when we could see a bit better opportunity to enter the market or any altcoins then it would be a four-hour candle close above the 'yellow' short-term trendline, above the April low and above the round number $6,500. There we can say that the short-term trend could be bullish and remember the counter-trend is always very risky because we have bad signs from higher time frames. EOS (EOS/USD) shows some strength Over the weekend when almost all alts took another hit, EOS (https://u.today/eos-vs-ethereum-which-soin-is-more-promising) holds the price very nicely. It shows that EOS has some potential and the platform is technically solid. The weekly candle closes below the round number $5 and below the short-term counter trendline but nothing significant just a small fall and quickly back around the $5 area. https://u.today/sites/default/files/inline-images/image1_26.png Currently, we trade above the round number and on lower time frames. We could see that it starts to form a bullish chart pattern called "Inverted Head & Shoulders" which will indicate the further move upwards. If we want to see a bullish move then we have to get a close above the April low and a candle close above the counter trendline. This will guide us to the last down-trendline which starts to work as a resistance if we take down the last down-trendline then we have a free road almost to the $6.5-$7. A bearish move will be almost confirmed when it gets a close below the red line and then the price will continue the move down on the down channel. Nearest supports would be the trendline which is pulled from the 2018 low point, the August low and the round number $4. This zone is a very strong area and we expect further price movement from this price level at $4-$4.2. Technically, EOS looks very strong and promising if the market finds the way upwards. Take a look at ETH (ETH/USD) Price Analysis, Sept. 10, 2018 (https://u.today/bitcoin-bad-signs-eos-looks-good-eth-is-on-the-edge-crypto-price-analysis-update-sept-10-2018) Have a nice day! Title: Re: Daily price analysis BTC + ALTCOINS Post by: pocketfullofpoke on September 11, 2018, 05:15:05 AM That's one hilarious cryptocurrency graph but i normally don't look at crypto graph regularly because it may just frustrate me in the process. I just let the time past because i know a promising cryptocurrency is like wine that has its taste getting better as time goes by.
Title: Re: Daily price analysis BTC + ALTCOINS Post by: BigBos on September 11, 2018, 06:21:50 AM That's one hilarious cryptocurrency graph but i normally don't look at crypto graph regularly because it may just frustrate me in the process. I just let the time past because i know a promising cryptocurrency is like wine that has its taste getting better as time goes by. well, sometimes people just follow the path to see the current price. keep monitoring prices will make us even better in terms of analysis, bitcoin or altcoin. Well, but looking at the current price analysis, the price is declining for this month.Title: Re: Daily price analysis BTC + ALTCOINS Post by: BlackSociety on September 11, 2018, 06:50:26 AM Bitcoin is now very suitable for purchase. I think that you can buy it even if you don't analyze the data, because many people start dumping coins because of panic. Bitcoin and USDT will be their best safe haven!
Title: Re: Daily price analysis BTC + ALTCOINS Post by: Dany44 on September 11, 2018, 10:46:40 AM Bitcoin on the Down Channel, Ripple Possible Double Bottom, DASH Showing Some Strength: Crypto Price Analysis Update, Sept. 11, 2018
https://u.today/sites/default/files/styles/880/public/2018-09/photo_2018-09-11_12-13-46.jpg?itok=g9LsvZTP Bitcoin possible short area After the Sept. 9 inverted "hammer," yesterday we got a green candle close. Yesterdays candle closed above the mentioned strong level $6,250 but the volume is very low to get any information from this candle. https://u.today/sites/default/files/inline-images/Bitcoin.png In the four-hour chart, we could see that we are still moving downwards in the down channel which will guide us to the $6,000 level and there is also the major counter trendline. So, at the moment, we can't make any precise prediction because the signs are just too unclear. We have to wait for this level or better price action from the current level. In the four-hour chart BTC still makes lower highs and lower lows but if you zoom in, then in the shorter timeframes there is a sign which will tell us that the small price structure could change because there we can see some lower highs which tell us that buyers don't want to let the price down and we could see a bounce upwards. If we break upwards from the current channel then technically a good short opportunity- short opportunity, because our bias is bearish based from the previous week candle close (yesterday's post)- would be around $6,700-$6,800 and the area criteria are: 1. The Fibonacci retracement 50 percent (pulled from Sept. 5 to Sept. 6) 2. The Fibonacci extension 141 percent to 161 percent (pulled from Sept. 7 to Sept. 8) 3. Strong resistance area $6,787-$6,800 3. Different timeframes EMA's starts to work as resistances Currently, our recommendation is, stay away from the market and wait for those levels that we mentioned above. From these areas, we can make better decisions but lets look at what the few altcoins charts show us. Ripple (XRP/USD) possible "double bottom" Currently, Ripple trades between the $0.25 and $0.3 levels. The short-term price structure is still lower highs and lower lows but the chart shows us that it slowly starts to slow down after the drop from $0.35. A first possible support is the August low/ 2018 low and the round number area $0.25. If it finds support from this area then we have also a bullish chart pattern called "double bottom" and currently looks like the channel guide us into this area. https://u.today/sites/default/files/inline-images/Ripple.png To enter the market from the mentioned area we have to watch what Bitcoin does, if it also shows us some positive signs then definitely this is a place where Ripple (https://u.today/ripple-an-oddity-among-cryptocurrencies-and-their-2017-champion) may bounce upwards. Upwards target would be the trendline which is pulled from July 4ths wick. This trendline starts to work as a resistance and if we get a candle close above the trendline and above the round number $0.3, then we have an almost free ride to the $0.35 or $0.4, depends how healthy the market is. Bearishness will be confirmed if we get a candle close (at least four-hour) below the August low which matches almost exactly with the round number $0.25, then this is our confirmation and we can be almost certain that XRP (https://cryptodetail.com/why-should-i-invest-ripple)' could drop as low as $0.2. There is the rally month low (December low), historically nothing more and the psychological number. The rally month low- December last year's rally started from this area! So, if we drop below the $0.25 next stop would be around $0.2. Take a look at DASH (DASH/USD) Price Analysis, Sept. 11, 2018 (https://u.today/bitcoin-on-the-down-channel-ripple-possible-double-bottom-dash-showing-some-strength-crypto-price) Have a nice day! Title: Re: Daily price analysis BTC + ALTCOINS Post by: Dany44 on September 12, 2018, 09:34:32 AM Bitcoin- Seven Failed Attempts, LTC is on the Important Area, TRX Approaching Key Level: Crypto Price Analysis Update, Sept. 12, 2018
https://u.today/sites/default/files/styles/880/public/2018-09/Pic%2013.jpg?itok=NtwxHezM Bitcoin has seven failed attempts Now we have been in this consolidation phase a little bit over six days. Currently, BTC price has drawn us a "Triangle" pattern and we have a down channel where the price moves downwards. https://u.today/sites/default/files/inline-images/Bitcoin_0.png Yesterday we got a small sign that the price may come down and test the lower levels. It made a breakout from the triangle downwards which is a bearish sign, but currently, on the four-hour chart, we could see that there is a very strong level- $6,250. BTC (https://u.today/bitcoin-price-volatility-explained) price has tried to break this seven times but all those attempts were unsuccessful and it bounced back above the mentioned level. So, basically, we have a sign that we may go downwards from triangle breakout, now, if we get a close below the $6,250 this could mean that there is a very high probability to go test the lower levels. If we start to drop then the first support is $6,000 where we want to watch what the price action does but we think it will go much lower than $6,000 but let's see and lets take this step-by-step. If we start to go higher then you already know our resistances from yesterdays post. Litecoin (LTC/USD) is on the important area If some alts are approaching the 2018 low point then Litecoin (https://cryptodetail.com/litecoin-preditions) is almost there. Currently, LTC price is on the very important support area- $50 which starts to work as a support and the 2018 low which was made on Aug. 14. https://u.today/sites/default/files/inline-images/Litecoin.png If we don't find that power to hold the price above $50 then bearish confirmation would be a four-hour candle close below the 2018 low (red box). A break below the 2018 low could mean bad news for LTC because there are exactly zero recent supports until the next round number area of $40. There are also two different trendlines pulled from different wicks and lows (let's call those trendlines the minor trendlines) and they make a cross on the $40 level + there is also some Fibonacci extension areas. So, this means the next support area and a pretty significant one is around $40. To trade between the $50 and $40 level is pointless and very risky. Because technically there is almost nothing remarkable. Wait for $40 or if the price doesn't reach into this are then wait for our technical analysis, we will try to keep you posted. Take a look at Tron (TRX/USD) Price Analysis, Sept. 12, 2018 (https://u.today/bitcoin-seven-failed-attempts-ltc-is-on-the-important-area-trx-approaching-key-level-crypto-price) Have a nice day! Title: Re: Daily price analysis BTC + ALTCOINS Post by: Dany44 on September 13, 2018, 12:00:40 PM Bitcoin Shows Bullish Momentum, Monero and NEO Have to Fight Key Levels: Crypto Price Analysis Update, Sept. 13, 2018
https://u.today/sites/default/files/styles/880/public/2018-09/Pic%2014_0.jpg?itok=LhBjNmjE Bitcoin (https://u.today/how-to-buy-bitcoin-anonymously-without-id-and-verification) shows a bullish momentum Yesterday, we said that we have seven failed attempts to break below the $6,250 level and after we post it, the eighth attempt was successful but with a very low volume and the close wasn't in our mentioned "red box. The buyers were alert because each bigger selling attempt was pushed quickly back upwards. So, this action drew us a smaller triangle and we made a breakout upwards from it with a nice volume inside the candles. https://u.today/sites/default/files/inline-images/image2_21.png Currently, we are back above the counter trendline (pulled from Sept. 8) but below the April low and below the round number $6,500. These orange price zones are strong resistances and at the moment we got a bounce from the April low and from the lower orange resistance area. The small throwback will guide us to the counter trendline and there we have to watch what the price action wants to tell and show us but currently, looks like the price shows some bullish strength and momentum and we may go higher than $6,500 but the candle which guides us through these levels have to be full of volume. Monero (XMR/USD) starts to fight against the heavy resistance Almost all the altcoins got a bounce from yesterdays run and so as Monero (https://cryptodetail.com/how-buy-monero-xmr-and-whats-reason-it). It bounced upwards from previous support level at $97. It made a massive bullish "engulfing" candle which guides us above the round number $100 and the profit from the bottom was +11 percent. https://u.today/sites/default/files/inline-images/image3_15.png But looks like we have a heavy resistance above us. This red area has been historically a support and has been historically a resistance and now, again it starts to work as a resistance. In this area, around the $110, are all important EMA's on the four-hour chart and also we could find a counter trendline which passing through this area and makes a cross. This will all indicate that the key level is around $110. Break above the mentioned level will guide us back above the counter trendline, back above the EMA's and we make a new short-term higher high. Those criteria are all bullish and if it could do this then definitely we are in the bullish zone again. Take a look at NEO (NEO/USD) Price Analysis, Sept. 13, 2018 (https://u.today/bitcoin-shows-bullish-momentum-monero-and-neo-have-to-fight-key-levels-crypto-price-analysis-update) Have a nice day! Title: Re: Daily price analysis BTC + ALTCOINS Post by: Affilate User on September 13, 2018, 12:50:30 PM maybe the graph analysis that you provide can help new traders to determine the right time to buy cryptocurrency and can sell the cryptocurrency that you have but that cannot be relied on forever because this bitcoin price movement is very difficult to predict due to demand and some news in the media can also influence the movement of cryptocurrency.
Title: Re: Daily price analysis BTC + ALTCOINS Post by: Dany44 on September 13, 2018, 03:22:56 PM yeah, I know, but we're trying to do our best!
Title: Re: Daily price analysis BTC + ALTCOINS Post by: Dany44 on September 14, 2018, 12:50:09 PM Bitcoin Made a Breakout, Ethereum is One of the Top Gainers and Cardano Possible Short-Term Targets: Crypto Price Analysis Update, Sept. 14, 2018
https://u.today/sites/default/files/styles/880/public/2018-09/Pic%209_2.jpg?itok=OCpBwyZ0 Bitcoin is above U.Todays mentioned resistances Yesterday, we said that Bitcoin (https://cryptodetail.com/bitcoin-price-manipulation-who-guilty) shows some bullish volume and it shows some strength to go upwards. Currently, the last four-hour candle close was exactly above our last marked resistance area at $6,550 which means that we have a breakout from the strong resistances and now, starts to play our next previously mentioned resistance level at $6,700-$6,800. In this level zone, the price could turn around and be bearish again. https://u.today/sites/default/files/inline-images/Bitcoin_1.png It is technically a good short opportunity because technically, our bias is bearish based from the previous week candle close which was bearish "Engulfing. $6,700-$6,800 area short criterias are: The Fibonacci retracement 50 percent (pulled from Sept. 5 to Sept. 8) The Fibonacci extension 141 percent to 161 percent (pulled from Sept. 7 to Sept. 8) Strong resistance area $6,787-$6,800 200 EMA starts to work as a resistance We also might see a throwback from the bigger Fibonacci 38 percent level around $6,600 On the four-hour chart, we meet with the 100 EMA line. 38 percent is also important because if the pressure is down (currently the long-term pressure is down) then from this level we could see a bigger throwback but lets see! Currently, the last candle close and the price structure shows us positive signs and our main aim is still $6,700-$6,800 if we climb higher, there we want to search some bearish price action (candlestick patterns, chart patterns on the lower timeframes, minimum 15 min, volume) before we start doing anything. Ethereum (ETH/USD) one of the top gainers in the trendline party Ethereum (https://u.today/eth-crash-ethereum-price-prediction-what-is-happening-to-second-biggest-cryptocurrency) has made a 33 percent increase since Sept. 12, it bounced upwards from $170 and now the current price is around $215. The bounce came from the sharper trendline area. After the bounce, we got from the daily timeframe a nice bullish candlestick pattern called "Morning Star" and this momentum gave a boost to break back above the blue trendline, above the $200, above the orange resistance level, above the 50 EMA (on the one- hour timeframe it trades above all the EMA's - 50, 100, 200). https://u.today/sites/default/files/inline-images/Ethereum.png Currently, the price sitting on the Fibonacci retracement level 38 percent and it approaching the trendline (dark red) which is pulled from April 1, 2018 and could start to work as a resistance. Above the current price are heavy resistances after another: 1. The longer and smoother trendline since April 1, 2018- $225 2. Previously worked resistance- $230-$234.5 3. Fibonacci retracement 50 percent- $235 4. The trendline since July 29 - $237-$241 If we can beat those levels then the Ethereum panic selling could be over. Take a look at Cardano (ADA) Price Analysis, Sept. 14, 2018 (https://u.today/bitcoin-made-a-breakout-ethereum-is-one-of-the-top-gainers-and-cardano-possible-short-term-targets) Have a nice day! Title: Re: Daily price analysis BTC + ALTCOINS Post by: Dany44 on September 17, 2018, 12:13:39 PM Bitcoin & Cardano Are on the Triangle, Ethereum Has to Fight With Trendlines: Crypto Price Analysis Update, Sept. 17, 2018
https://u.today/sites/default/files/styles/880/public/2018-09/Pic%203_4.jpg?itok=RuiV01GC Bitcoin is on the descending triangle Over the weekend we moved sideways between the strong areas. Our resistance was the March low at $6,533 and our support was the April low at $6,425. We break downwards from the older counter trendline which is not so remarkable anymore because there are other and newer counter trendlines, but still, it could be a small sign. The weekly candle closes just below the round number at $6,498, so, Bitcoin took down two out of four major resistance levels between the $6,425-$6,533. Remember we had two weeks ago the "engulfing" candlestick pattern which indicates that we could get another leg down but we didn't. So, this will show us a little bullish hold/momentum on the BTC chart and if you remember, in August, we had a pretty strong monthly candle close (let's say a sloppy "hammer") which could be the reason why we didn't fall further because this monthly candle indicates a little bullishness on the Bitcoin. https://u.today/sites/default/files/inline-images/image3_16.png On the four-hour chart, Bitcoin (https://u.today/bitcoin-51-attack-how-it-works-how-much-bitcoin-51-attack-costs) has drawn a bearish chart pattern descending triangle. It is pulled from the bodies and soon, it is ready to make a breakout. The triangle means that we have breakout opportunities to either direction, descending means that we have just a slight advantage to break downwards so, a candle close below the 'currently the main counter trendline' and below the April low level will be a sign that we go downwards (red triangle is the confirmation area). Bullish confirmation would be a candle close above the "descending triangle" and above the March low. Then we got bullish momentum from the chart pattern breakout and if we take down all the major resistance levels from this area then this could be another momentum sign. So, a close above the $6,533 could mean another leg upwards (green box on the chart) and a close below the counter trendline could mean another leg downwards (red triangle). Ethereum (ETH/USD) has to fight with the trendlines Overall, the altcoins show us a nice and steady climb upwards which will be a good sign for the whole market. Currently, like Bitcoin, Ethereum has to fight against the strong resistance. The Ethereum (https://cryptodetail.com/top-5-erc20-wallets-store-eth-based-tokens) price is around $218 and just above us are two trendlines: the longer and smoother since April 1, 2018, and the trendline since July 29 (pulled from bodies). Those trendlines make across just above the current price, plus we have a 'naked' resistance area (orange box) and we approaching into the 100 EMA which starts to work as a resistance. https://u.today/sites/default/files/inline-images/image1_30.png So, after we calculate those criteria we got a pretty significant resistance level. If we want to beat that then Bitcoin definitely has to make a breakout upwards from the triangle then the other altcoins could find the momentum and should follow this move upwards. If we don't catch this momentum then we might go and test the lower levels and the next supports are the orange area below us and the round number $200. Take a look at Cardano (ADA) Price Analysis, Sept. 17, 2018 (https://u.today/bitcoin-cardano-are-on-the-triangle-ethereum-has-to-fight-with-trendlines-crypto-price-analysis) Have a nice day! Title: Re: Daily price analysis BTC + ALTCOINS Post by: pieppiep on September 17, 2018, 12:30:10 PM I think this bitcoin price analysis will never be predictable, usually the price will be predictable when it has happened like this and I think it is too late and not very useful because it is very difficult to predict the price movements of bitcoin and altcoin.
Title: Re: Daily price analysis BTC + ALTCOINS Post by: Dany44 on September 18, 2018, 10:45:53 AM https://u.today/sites/default/files/styles/880/public/2018-09/Pic%208_1.jpg?itok=FebuKYLx
Bitcoin is in the crucial area Yesterday we mentioned that Bitcoin is on the "descending triangle" and this meant that we had a slight advantage to break downwards, well it happened. On the one-hour chart, we got a breakout from the counter trendline and we got a candle close below the April low (below all important price levels between the $6,425-$6,533). Those confirmations from the one-hour chart led us to the lower levels, to the next strong support line at $6,250. https://u.today/sites/default/files/inline-images/image2_23.png Currently, BTC (https://u.today/what-can-you-buy-with-bitcoin-in-2018) price has stopped in this area and the daily candle got a close above the mentioned level. This is good because if the current level holds us then we make a higher low and the price structure stays healthy with the higher highs and higher lows. Stellar (XLM/USD) has a superstrong area Yesterday, Stellar (https://cryptodetail.com/stellar-what-was-wrong-ripple-make-another-coin) fought with the area which has been historically a super-strong level to beat, around $0.21. Over the two week period it has 20 (!) failed attempts to break above the mentioned levels. Previously this super-strong resistance was a support and also then we had around 20 attempts to break. So, if you want to see a bullish Stellar it has to make a breakout above the blue line. https://u.today/sites/default/files/inline-images/image3_17.png Currently, after the little drop, we are below the round number $0.2 and back below the trend line which is pulled from July 25th. If BTC doesn't find the bottom from the current level ($6,250) then definitely Stellar will follow that move down and we will retest the lower levels because we had a bullish "ascending triangle" pattern. However, sadly, we made a breakout downwards. Our nearest support lines would be the double bottom around $0.18 and below is a black trendline. This trendline has pulled from March 18 and it has already three precise touches so, this is definitely a significant level. If we break below from this trendline then we may go and touch pretty low levels. Take a look at Dash (DASH/USD) Price Analysis, Sept. 18, 2018 (https://u.today/btc-dash-are-on-the-important-level-stellar-has-magic-price-level-crypto-price-analysis-update-sept) Have a nice day! Title: Re: Daily price analysis BTC + ALTCOINS Post by: Dany44 on September 19, 2018, 10:23:19 AM BTC & BCH Has Found Short-Term Bottom, Ripple Exploded: Crypto Price Analysis, Sept. 19, 2018
https://u.today/sites/default/files/styles/880/public/2018-09/coins_19.09.jpg?itok=RwO8Oi0a Bitcoin respected our mentioned level The whole market made a short pump upwards. This was due to the fact that BTC bounced upwards from our mentioned level at $6,250. BTCs move pulled all the altcoins upwards as well and like we said the whole market got pretty nice bullish momentums. https://u.today/sites/default/files/inline-images/Pic1_19.09.png From a technical perspective, Bitcoin (https://u.today/10-bitcoin-millionaires-people-who-became-rich-from-cryptocurrency) now trades above the major counter trendline which is pulled from Sept. 18. The bounce from $6,250 made a scarcely higher low which is good for the price structure and will indicate that we are still in the short-term bullish market. Currently, we are on the chart pattern, slightly in the bullish "Ascending Triangle. If we break upwards then we could see another leg up to the important resistance levels. The next and first resistance would be around the April low, in the one-hour chart there is 200 EMA and in the four-hour chart there is 50 EMA. If we don't find the power to break through from the triangle upper trendline then the first bearish sign will be when we get a candle close below the counter trendline. After that, we might go and retest the strong area at $6,250 but nothing can be confirmed before we see a candle close below the counter trendline. Ripple (XRP/USD) exploded Yesterday, when the whole market started to pump upwards, Ripple (https://cryptodetail.com/stellar-what-was-wrong-ripple-make-another-coin) just exploded. Weve discovered the bullish chart pattern (Inverted Head & Shoulders) on the XRP/USD chart and it even made five percent in minutes! The detailed post is here: (https://www.tradingview.com/chart/XRPUSD/aWWYaTLf-RIPPLE-XRP-USD-Inverted-Head-and-Shoulders/) https://u.today/sites/default/files/inline-images/Pic2_19.09.png Currently, it has made a little bit over 18 percent growth since we discover this momentum and now we could see another move upwards if we can break above the bullish "Ascending Triangle" upper trendline/support. Our main target is the round number $0.4 but we could see stops around $0.35 and around $0.38. This move upwards should also be supported by Bitcoin, BTC has to at least hold the current price and can't break below the counter trendline, if it manages to hold this then Ripple definitely starts to climb higher. Take a look at Bitcoin Cash (BCH/USD) Price Analysis, Sept. 19 (https://u.today/btc-bch-has-found-short-term-bottom-ripple-exploded-crypto-price-analysis-sept-19-2018) Have a nice day! Title: Re: Daily price analysis BTC + ALTCOINS Post by: Dany44 on September 20, 2018, 09:48:54 AM Bitcoin made a massive shake off and Ethereum has to fight with heavy intersection area
https://u.today/sites/default/files/styles/880/public/2018-09/Pic%207_0.jpg?itok=jxkFc6al Bitcoin possible confirmation areas Last night Bitcoin (https://u.today/what-is-bitcoin-halving-and-when-next-bitcoin-halving-occurs) made very strong and sick moves. The big guys shook off some buy and sell orders and hopefully, now they are satisfied. Like you see on the four-hour chart, one candle range is almost $500, recently this is the biggest shake off that we have seen but let's try to break down the price action and possible confirmations areas. https://u.today/sites/default/files/inline-images/Bitcoin_2.png Currently, we trade on the triangle (black trendlines), the massive candle was below the triangle and it was above the triangle but the close was inside. Actually, this move was pretty good for the technical perspective that this could mean that probably we don't see those fake moves in the near future and technical analysis confirmation areas would be higher accuracy. At the moment, on the four-hour chart, the price is 'sitting' on the Fibonacci retracement level at 62 percent and below the 50 EMA. Also, all our earlier mentioned level above the current price starts to work as a resistance: - April low at $6,425 - Strong Resistance at $6,460 - Round number $6,500 - March low at $6,533 If we want to see another leg upwards then firstly, the biggest confirmation would be the upwards breakout from the triangle upper trendline. This is definitely hard to beat because this trendline makes a cross from those resistance levels and also, there is a 100 EMA which starts to work as a resistance but let's watch what we can get from the current levels and we have to take this step-by-step, confirmation after confirmation. To confirm bearishness then a candle close below the $6,235 will confirm a movement downwards. If we get a candle close around $6,200 then we have a breakout from the triangle and break below the strong support levels. To make the trades inside the triangle is very risky because we never know when they start to fool us. Be cautious! Take a look at Ethereum Price Analysis, Sept. 20, 2018 (https://u.today/btc-shook-off-buy-and-sell-orders-eth-is-between-the-strong-areas-crypto-price-analysis-sept-20) Have a nice day! Title: Re: Daily price analysis BTC + ALTCOINS Post by: Dany44 on September 21, 2018, 11:47:04 AM Bitcoin is above the current level of major resistances, Dash shows bullish signs, Ripple is a massive gainer
https://u.today/sites/default/files/styles/880/public/2018-09/Pic%203%20%281%29_1.jpg?itok=Zin3_hpi Bitcoin is above the current level major resistances Yesterday, we mentioned exactly a bullish confirmation area which was above the triangle upper trendline and above 100 EMA. The four-hour candle closed pretty precisely above those and as we mentioned, this shake off that happened the day before yesterday would give us a better accuracy on the confirmation areas from the technical perspective. https://u.today/sites/default/files/inline-images/Bitcoin_3.png After the close, we got another bullish four-hour candle which closed above all our named resistances. Now, those resistances become the support levels, starting from the March low until the April low. Currently, after the pump upwards, Bitcoin (https://u.today/20-best-bitcoin-cloud-mining-sites-in-2018) finds a resistance from 200 EMA but we have a good sign from the candlestick pattern called "Inside bar, it means that if we break above or below from the main candle range it will show us current momentum. So, this massive candle and those candles afterward created us "Inside bar(s)" and we did a breakout upwards (you can see the blue lines mark those places on the chart) which will indicate that the momentum could be upwards. Now, when we have a little throwback from 200 EMA we could retest the lower levels. All throwbacks are healthy if we manage to stay above the triangle upper trendline which now also becomes a support level. The lowest point where we want to see another movement upwards is around $6,460. The bounce criteria from retest area: 1. There is the strong support level (blue line) 2. The triangle trendline 3. There is 100 EMA 4. Fibonacci retracement level 38 percent All those criteria make a crossing area and start to work as strong support levels. Obviously, there is room to reach higher levels. We want to name the first area where the price could stay in consolidation mode or could make a little throwback, it is around $6,766. There is another strong resistance level, the bigger Fibonacci 50 percent retracement zone and a trendline projection. Dash made a bullish breakout Dash (https://cryptodetail.com/dash-coin-fastest-growing-blockchain-network) has made a breakout from two triangles. The first bullish four-hour candle takes down the smaller triangle and the second candle takes down the bigger triangle (blue lines). https://u.today/sites/default/files/inline-images/Dash.png We have mentioned before how strong it looks and etc. Currently, as we said, it has two bullish signs but let's count all the bullish signs together, we have: 1. Upwards breakouts from the triangles 2. A break above the round number $200 3. Currently, we are sitting on the July low level which starts to work as a support because we broke above that level too 4. The golden cross between 100 and 200 EMA So, those criteria will guide us to higher levels and the target areas could be around: * $225- the August high level which starts to work as a resistance * Currently, the main target would be around $250- semi-round number, the triangle pattern possible target, Fibonacci extensions. Technically, Dash is very bullish, multiple bullish price action criteria matching each other means it is ready to climb into the main target area. Take a look at Ripple Price Analysis, Sept. 21, 2018 (https://u.today/btc-dash-made-a-breakout-ripple-is-a-massive-gainer-crypto-price-analysis-sept-21-2018) Have a nice day! Title: Re: Daily price analysis BTC + ALTCOINS Post by: bitcoinrays on September 22, 2018, 06:44:04 AM I think this bitcoin price analysis will never be predictable, usually the price will be predictable when it has happened like this and I think it is too late and not very useful because it is very difficult to predict the price movements of bitcoin and altcoin. The price of Altcoin right now is also running in their lowest markets same to that of the price of Bitcoin is also in its low market. Ethereum has also declined to 200 US dollar value from 500 US dollar value which is a big decreased for it. If we take Bitcoin its value if even drops at low stage is many times higher than that of other currencies.Title: Re: Daily price analysis BTC + ALTCOINS Post by: putrii on September 22, 2018, 07:45:13 AM I think that the daily analysis on bitcoin and altcoin will not be used as a benchmark forever because these prices and graphs can be analyzed when they have occurred so that they cannot predict what will happen in future price movements.
Title: Re: Daily price analysis BTC + ALTCOINS Post by: raidarksword on September 22, 2018, 07:52:56 AM Graphs show the downtrend of bitcoin and other altcoins in the market but let's just assumed that bitcoin can comeback anytime soon and bring along the alt coins as well. It may seemed that as of today bitcoin and ethereum are gaining slowly and doing uptrend. Even xrp got the second spot temporarily but ethereum don't want to sit in the third place, so ethereum grabbed the second spot again. These shows we are moving closer and gaining the uptrend momentum.
Title: Re: Daily price analysis BTC + ALTCOINS Post by: Dany44 on September 24, 2018, 10:00:44 AM Bitcoin managed to hold the price and it has the potential to go higher, Ethereum makes higher highs & higher lows, Litecoin is above the last major trendline
https://u.today/sites/default/files/styles/880/public/2018-09/Pic%2010_4.jpg?itok=H20-EOCz Bitcoin managed to hold the price and it has the potential to go higher Over the weekend BTC stayed below the strong area (blue line) at $6,767. There were eight attempts to break above but all of them failed. https://u.today/sites/default/files/inline-images/Bitcoin_4.png Since Sept. 6, BTC traded between $6,100-$6,500 and on Sept. 21st it made a breakout upwards. Currently, when we had several unsuccessful attempts to break the strong resistance level at $6,767 we got a bounce downwards, this bounce almost touched the $6,500 area which is the perfect scenario if we want to see a bullish Bitcoin. The perfect breakout trade = breakout + retest the breakout area and technically it is ready to climb higher/lower depending on the breakout. The bounce was supported with EMA's on the four-hour chart. It touches all the important EMA's (50, 100, 200) and after the bounce upwards it closed on the green, which gives us a bullish candlestick pattern called "Hammer. To give a weekly overview and weekly direction then, there are several bullish signs on the higher timeframe: * Weekly candle close was pretty bullish, its a "Hammer" or a sloppy "Hammer" candlestick pattern * Daily is above 50 EMA, it has a retest and bounce already * Four-hour, BTC trade above the EMA's and 50 and 100 EMA made a golden cross (which is a bullish sign). So, we might see a bullish Bitcoin (https://cryptodetail.com/how-convert-bitcoin-other-cryptocurrencies), but currently, we have to take down that strong resistance level at $6,767. To give you a bearish view, if Bitcoin price goes lower than $6,500 then this could be a bad sign because then we are in the consolidation area again. If this happens we dont know where it is going to break next, several times we have seen a break upwards (luckily) but the next one could be downwards. So, if we move down between $6,000-$6,500 please be cautious. Ethereum makes higher highs & higher lows but... After the dump on the Sept. 12th, Ethereum (https://u.today/5-best-ethereum-mining-software-2018) has made a recovery over the 40 percent. Currently, on the four-hour chart, it makes higher highs and higher lows but those HH & HL are just on the short-term timeframe because Septembers high is still far away. In order to confirm a higher high (long-term), we have to climb upwards and break above the round number area $300. https://u.today/sites/default/files/inline-images/Ethereum_1.png At the moment, ETH price fights with the August low and the semi-round number area which works as a resistance at $250, plus we have a 200 EMA above us which also works as a resistance. Just a little throwback downwards gave us a bearish chart pattern/continuation pattern "Rising Wedge" (...and the overall trend is down, then the pattern starts to work correctly if we make a breakout downwards). If we manage to break upwards from this "Rising Wedge" then like we said our first target is around $300. However, to get there ETH has to break a strong level of around $275 and one orange resistance zone, the road above $300 is not easy but it's definitely doable. If we break downwards from the continuation pattern "Rising Wedge" then the pattern starts to work and confirms that bearish momentum if we get a candle close below the lower black trendline! Also, if we break it soon, then there is also other trendlines and support areas (brown line and blue line), closes below those levels and lines confirms bearishness, let's say a candle close around $210. Take a look at Litecoin Price Analysis, Sept. 24, 2018 (https://u.today/btc-has-potential-to-go-higher-eth-ltc-will-follow-that-move-crypto-price-analysis-sept-24-2018) Have a nice day! Title: Re: Daily price analysis BTC + ALTCOINS Post by: Dany44 on September 25, 2018, 12:52:53 PM Bitcoin is on the risky area, if the market shows some stability NEM will explode, Ripple possible bounce area
https://u.today/sites/default/files/styles/880/public/2018-09/BTC%20is%20on%20the%20risky%20area_Sept.%2025%2C%202018.jpg?itok=_MuhWdWh Bitcoin is on the risky area After last weeks rise, BTC makes a throwback (downwards move). As we said yesterday, if we drop below the round number $6,500 then we could be in trouble. https://u.today/sites/default/files/inline-images/image3_20.png This grey area on the image is the consolidation area where Bitcoin searches for direction and this is an area where the big guys don't hide their moves, historically very big shake offs are in this area. If we want to see a bullish BTC then it has to make a reversal some time soon. Currently, we are on the blue line which is a strong support level from our well-known support in this price zone. BTC price touched $6,400 and got a bounce, the bounce occurred upwards from the April low level and also from the Fibonacci 62 percent retracement level (pulled from Sept. 17 to Sept. 22). Like we said, Bitcoin (https://u.today/bitcoin-cloud-mining-profitability-is-it-worth-it) is on the risky area, where the breakout may happen in either direction. From this area, we have made the breakouts upwards multiple times, above the $6,500 area but now, we have a little premonition. We don't want a close below the bottom channel black trendline (the major counter-trendline), so, a close around $6,300 would be bad because if we break that major counter trendline then it will confirm the trend will continue and the overall trend is down! The full confirmation would be a candle close outside that grey area and if we get a close below that box then the $6,000 support level definitely wont hold us. NEM (XEM/USD)- Waiting for the big move upwards Currently, NEM price is below the round number of $0.1 which works as a resistance. NEM has managed to break above the nearest down-trendline which now works as a support. This is a pretty significant sign because NEM has been on the big downtrend and it has not shown any big recoveries and big pumps. https://u.today/sites/default/files/inline-images/image1_36.png Remember what Ripple did, it exploded and from a technical perspective, one possible reason was that it was very far from the major down-trendline (not like other altcoins). As NEM (https://cryptodetail.com/nem-xem-one-more-ethereum-killer-or-its-friend) stands right now, it is also far away from the major down-trendline and the possible pump may happen soon if the market starts to show some stability. To be bullish we have to break above the round number and we have to make a short-term higher high (the green box higher high confirmation box). These first steps will guide us to the higher levels: * Blue line around $0.116- it is historically worked as a support and resistance level and the price has made reversals and stops in this price level. * The second one is around $0.14- there we start to catch some monthly levels and we need pretty good power to push through because 200 EMA comes into the play * The final target would be the major down-trendline (+100%). The red box will confirm bearishness and is the area where you want to consider to sell your NEM. If we get a candle close below the main counter trendline and below the "nearest down-trendline" then it would be bearish confirmation and NEM would probably go and test the lower levels. Take a look at Ripple (XRP/USD) Price Analysis, Sept. 25, 2018 (https://u.today/bitcoin-is-on-the-risky-area-if-the-market-shows-some-stability-nem-will-explode-ripple-possible) Have a nice day! Title: Re: Daily price analysis BTC + ALTCOINS Post by: Dany44 on September 26, 2018, 09:19:34 AM https://u.today/sites/default/files/styles/880/public/2018-09/Pic%206_14.jpg?itok=mUWmsOAc
Bitcoin finds a short-term support from the Fibonacci level Bitcoin (https://cryptodetail.com/legality-bitcoin-united-states-august-2018) price is almost on the same price level as yesterday but we have gathered more information from the current level, and currently, those signs are short-term bullish indications. https://lh4.googleusercontent.com/v8skqrFMxAsVWuiEKPMddAn9Hz6VGoYTbtedqlDwo2rMtrl0F3ZF4TiZvXkIE6Ff2242qJaoEME3EUi1tKIihudCZy6smEkulIJobQBtx0pwTUeqW_-jWxNevfDa1NrqFCkp0G9v Yesterday, the lowest point was around $6,330 where the price touched the perfect Fibonacci retracement level of 62 percent and bounced upwards. After the bullish bounce, we got a bullish candlestick pattern called "Marubozu," which will indicate that we may see a continuation move upwards. Bitcoin has broken above the April low level and is now fighting with a strong resistance area around $6,460. From the price structure perspective, this bounce occurred from a 'healthy' place, because Bitcoin made a short-term HL (higher low) which is very important if we want to see a bullish BTC. https://lh3.googleusercontent.com/qEudQ3HixM59aiTSkN40L3suw5gMSdf5MJRfwa4MCltbSxM8JIEHzV1qy6GdD-RbZopPDAbqfBhB-MkUaPnOmfygCVopCvalBeI_Cz7DDXGuCSQ5wJdY4kCjB3aSS8Cm0jsAmRq1 In the shorter timeframes, we could see a nice bullish chart pattern called "Inverted Head & Shoulders. It shows that we have the momentum from the perfect Fibonacci level and it works nicely as a support level. BTC price also made a breakout from the neckline and technically it is ready to go higher but there is nothing clear before we are above those well-known resistance levels (Blue line- strong resistance, $6,500 round number which works as a resistance and the March low level which also starts to work as a resistance). Monero (XMR/USD) shows overall strength Monero (https://u.today/best-monero-mining-rigs-how-to-build-a-cheap-xmr-rig) shows us a pretty smooth and steady climb upwards. It has made very clean higher lows which will indicate that the current short-term trend is strongly upwards. https://lh4.googleusercontent.com/c36WJZtZ_wqw3q8hkH9OXrBNjdEuSEDNEa6M9qc1cRcvalkXsCALvqprGQhTt8iOowqL0g77NXM2jeVbSxYVBF8BP5aKNkGGURWGQXGfLWhmOpNwIka9GzEoDwICLdOPZKuXeyKZ At the moment, XMR price is below the main down-trendline which works as a resistance, also there is a 50 & 100 EMA and they do the same thing. Like you know, we have clean higher lows and also we have a bullish indication from the EMA's. On the chart you can see that the 200 EMA is below the 100 EMA, this means that we have a golden cross between the mentioned EMA's and this is a nice indication if we break above the major trendline that the climb will continue. The first targets would be the nearest resistances above us (green 'boxes'), the first one is around $128 and the second one is around $140. Speaking about support levels and bearish confirmations, then the 200 EMA is below the current price (currently, this is a pretty rare case that the price is above the 200 EMA and this is a pretty strong sign that the coin has the power to hold the price after those dumps) which works as a support. If we break below that then we will have a major counter trendline around $105-$107. The trendline is a remarkable spot where we want to see a bounce upwards if we want to stay bullish, but if we got at least a four-hour candle close below that trendline then it would be a bearish sign and the down pressure is very strong. At that point, you have to be cautious. Take a look at NEO (NEO/USD) Price Analysis, Sept. 26, 2018 (https://u.today/btc-the-perfect-fibonacci-level-xmr-shows-overall-strength-neo-is-on-the-trendline-price-analysis) Have a nice day! Title: Re: Daily price analysis BTC + ALTCOINS Post by: Dany44 on September 27, 2018, 11:06:21 AM Bitcoin important areas what you need to watch, Dash is under the major trendline, Ethereum has a breakout from the bearish chart pattern
https://u.today/sites/default/files/styles/880/public/2018-09/Pic%2011_7.jpg?itok=H_XRibOs Bitcoin important areas, what you need to watch Yesterday, we discovered a bullish chart pattern called "Inverted Head & Shoulders", the right and the left shoulders were located precisely on the perfect Fibonacci retracement level at 62 percent, and after we made a break above that blue support/resistance line where the price made a pretty nice jump upwards. From the price structure perspective, this bounce occurred from a 'healthy' place, because Bitcoin (https://cryptodetail.com/how-convert-bitcoin-other-cryptocurrencies) made a short-term HL (higher low) which is very important if we want to see a short-term bullish BTC. https://lh4.googleusercontent.com/Q-WNeUvaMgMbGRVqbB3bqzAwaDmxJ3b29De_s-WWzljl9eCRQ2pbepwk9VjZJhpPjkwGvBaTm01-MPTtDzysND6kkJldGDFsE_bkf7TGQuCFWCxJB8izL1_C7BL23QfscVaz8vQc So, this pattern worked almost perfectly and BTC price reached $6,560. However, now it has a second phase, we started to make a retest to the pattern neckline. Overnight we got a retest and after that, on the one-hour timeframe, it formed a bullish candlestick Hammer pattern, with a little bounce upwards above $6,500 where the momentum stops. Currently, we are approaching for the second time this strong support area (blue line) and the Fibonacci 38 percent retracement area but let's see if this level holds the price because there are technically some bad signs. We are below the short-term up-trendline and this could start playing a role in this bounce. Technically it is ready to go higher if we get a bounce from the strong support level but there is nothing clear before we are above those well-known resistance levels ($6,500 the round number which works as a resistance and March low level which also starts to work as a resistance, plus we have the EMA's above the current price, it should confirm bullishness if we can make a break above them). If BTC manages to break above those resistance levels and it gets a close on the green box, then we are out of the risky area which will indicate that we might go and test the higher levels. The first target would be the strong resistance at $6,767 and the second target would be around $7,000. Between those levels are the well-known Fibonacci level 62 percent around $6,900, lots of people are guessing that this might be the place where we go down again, but I think opposite: this is just so well-known price level, everybody knows it and if it reaches into this area then it flies above. To give to you bearish confirmations then it would be those red 'boxes. The first one is a break below the major counter trendline, if we get a break below the trendline then it will show that the short-term up trendline doesn't work as is should and the downward pressure is still pretty massive and the second confirmation is a close below those strong support blue line. If the price reaches there, then please be cautious because we might test the very low levels. Try to stay away from the market if it happens. DASH (DASH/USD) is under the major trendlines The market has shown some ups and downs movements and so has DASH. Last week, DASH (https://u.today/3-best-dash-mining-pools-2018) was technically pretty good but it didn't catch that big momentum and currently, it is in a bearish area. It is below both major trendline, below the short-term down-trendline which is pulled from July 20th and below the major counter trendline which will indicate that the upwards momentum is over. We could see a pullback if the market doesn't make any fast recoveries. Also, DASH trades below the EMA's which also is not a good sign. https://lh3.googleusercontent.com/_M5h0H65xmCdgrY_HfV66HtTx8OxwxUHmBYX-ZJVq7AOhjZOeqAx9VZM64oO8z8PRJcMYi6WvstISPE4CIcbnDvwgVDeukviVbVtpwJkkWJIx0w1UAgLsBSnVs3fhPPL3hrKViaE However, alongside these bad signs, we also have a good sign. The current short-term bounce comes from the Fibonacci 62 percent retracement level which still printed a higher low (HL) onto the chart. So, if we stay above this orange area, then all is under control, but if we can't hold the price above that mentioned level, we might see a bigger correction downwards. To be bullish, we have to break above again those trendlines or at least above that trendline which is pulled from July 20th. 'The road' upwards is pretty hard but if the market starts a bull run then all the altcoins start a bull run but if the market stays stable then DASH is on the trouble and definitely, it needs a big volume to break above those trendlines and EMA's. Take a look at Ethereum (ETH/USD) Price Analysis, Sept. 27, 2018 (https://u.today/btc-important-areas-dash-is-under-the-major-trendline-eth-break-below-the-bearish-chart-pattern) Have a nice day! Title: Re: Daily price analysis BTC + ALTCOINS Post by: sirohige on September 27, 2018, 02:26:37 PM I think the graph analysis created by the movement of the price of bitcoin and altcoin is very profitable because by analyzing this can determine the right time to buy and sell coins and can determine what movement will occur in the next movement.
Title: Re: Daily price analysis BTC + ALTCOINS Post by: tumokatok on September 28, 2018, 06:12:39 AM actually this bitcoin price movement is very unpredictable due to demand and some news in the media can also influence cryptocurrency movements but maybe the graph analysis that you provide can help new traders to determine the right time to buy cryptocurrency and can sell cryptocurrency that you have but it can't dependable forever
Title: Re: Daily price analysis BTC + ALTCOINS Post by: putrisa on September 28, 2018, 06:34:17 AM if you can analyze bitcoin and altcoin it looks like you can determine what price movements will occur on the coin which means you will be able to determine the right time to buy and sell coins and can make you get a lot of profit.
Title: Re: Daily price analysis BTC + ALTCOINS Post by: Dany44 on September 28, 2018, 08:26:01 AM https://u.today/sites/default/files/styles/880/public/2018-09/PW_28.09.18.jpg?itok=hceWD8dn
Bitcoin approaching the targets After we mentioned the neckline double retest on yesterday's post, BTC made a very strong move upwards. It breaks above the well-known resistance levels and more than that, now we are above the trendline which is the upper channel trendline and the current price is $6,720. Bitcoin reaches almost to our mentioned first target at $6,767 which is also historically a very strong resistance level. https://u.today/sites/default/files/inline-images/image3_21.png On the one-hour chart, we have a golden cross between the EMA's and it should be a pretty good statement. Further, we have to wait and watch how the "Ascending Triangle" plays out. The ascending triangle is a bullish chart pattern which indicates that the price has a bigger advantage to break upwards, plus we have this golden cross which should support that move upwards to the higher levels and those higher levels are, almost immediately the $6,767 strong resistance and our major target would be the $7,000. There are several price action criteria crossing areas: the round number $7,000 and the minor trendline crossing area and there is the May low level which also starts to work as a resistance, but firstly we have to see a break above the ascending triangle and break above the strong resistance. If BTC (https://u.today/5-best-asic-miners-for-bitcoin-mining-in-2018) price doesn't find that power to go upwards and it breaks below the ascending triangle and breaks below the current trendline, then it will be a sign that we might see a little throwback (move downwards). If we start to make a little throwback then technically a good opportunity for reversal would be around $6,570, there is the short-term up-trendline, different EMA's starts to work as the support and different Fibonacci levels begin to work support levels. The bearish sign/confirmation would be the break below the short-term up-trendline. Litecoin (LTC/USD)- on the upwards channel & the possible targets Litecoin (https://cryptodetail.com/litecoin-preditions) is flying after the third touch from the major counter trendline! If we watch the top 10 altcoins, then LTC was one of the top gainers yesterday. https://u.today/sites/default/files/inline-images/image2_27.png Currently, LTC price is on the upwards channel with very nice and clean higher highs and higher lows. It broke above the round number $60 and above the blue line which was a resistance. If we start to make a move downwards, then those levels become the supports. Speaking of further resistances, then there is the minor trendline and the round number $70 at the crossing area. As you already know those crossing areas are always harder to beat and we have to watch it closely. Above $70 we have the strong levels with very low gaps. In this area we have several monthly lows and even weekly supports and resistances, so, if the rally continues then, those areas are on the target list. But first, we have to break above this channel upper trendline which currently works as a resistance. Take a look at NEO (NEO/USD) Price Analysis, Sept. 28, 2018 (https://u.today/btc-approaching-the-targets-ltc-is-one-of-the-top-gainers-neo-wants-to-do-the-same-price-analysis) Have a nice day! Title: Re: Daily price analysis BTC + ALTCOINS Post by: geopolisch on September 29, 2018, 09:56:58 AM if you can analyze bitcoin and altcoin it looks like you can determine what price movements will occur on the coin which means you will be able to determine the right time to buy and sell coins and can make you get a lot of profit. It is important to study the prices of coins daily where you have investment because you will have to stick with it as long as you are holding. You will decide to sell according to this monitoring of price that will show increase and decrease in price, once you noticed jump in price then it is up to you if the profit satisfies your desire then you can sell it. On the other hand you can wait for some more time in order to get higher outcome.Title: Re: Daily price analysis BTC + ALTCOINS Post by: Dany44 on October 01, 2018, 10:32:13 AM https://u.today/sites/default/files/styles/880/public/2018-10/BTCETHADAOct.%201%202018.jpg?itok=wrj6NOgj
Bitcoin is on the big Ascending Triangle Currently, it trades between the two blue lines. Above is the resistance at $6,767 where BTC (https://cryptodetail.com/legality-bitcoin-cryptocurrency-world) has tried to break out several times, one attempt was successful but let's call this a fakeout. The second one is below the current price at $6,460 which works as a support. On Sept. 26th and 27th, it worked nicely as a support and it holds that price very nicely. Over the weekend, we touched it again and got a bounce, but this time, this level is much stronger than before because in this area we had the trendline and the golden Fibonacci level 62 percent crossing area which makes this price level much stronger to break through. https://u.today/sites/default/files/inline-images/image3_23.png Over the weeks, the chart has drawn a bullish pattern called "Ascending Triangle" which will indicate that we might see a breakout upwards. However, we always have two breakout opportunities from the triangle, but this 'ascending' means that we have an edge to break upwards. Also, we have nice and clean higher highs and higher lows on the price structure which indicates a little bullishness. Let's talk about a couple of scenarios: 1. In general, during the weekends there is very low volatility and we needed a lot of power to make a breakout upwards. We didn't catch that power and the price is still in the triangle. At the moment we trade above the important EMA's and on the four-hour chart we got a bullish "Hammer" candlestick pattern and the hammer low bounced upwards exactly from the trendline and from the EMA's. If we see a continuing move upwards in the near future and if we manage to break above the triangle upper resistance line at $6,767, then the triangle pattern shows us that the ideal target point would be around $7,300 where several weekly resistances are. 2. In the bigger picture, the overall trend is down and that's why we think it is simple to break downwards. If we see a candle close below the blue line and below the triangle trendline, let's say around $6,420, then it would be a bearish confirmation. It confirms that the bullish momentum is gone and the strong support level doesn't work anymore and the next stop would be on the major counter trendline which is around $6,300. Be careful in this scenario! Ethereum(ETH/USD) is still on the "Rising Wedge" As Bitcoin, Ethereum trades currently between the two blue lines, support, and resistance. The resistance line at $236 has been before a support and now it becomes a resistance. https://u.today/sites/default/files/inline-images/image1_39.png Several times it has tried to break above that blue line, but those attempts were unsuccessful. To break through this level, we have to fight with 200 EMA which starts to work as a strong resistance on the four-hour chart. Ethereum (https://u.today/5-best-ethereum-cloud-mining-sites-in-2018) shows nice short-term higher highs and higher lows since Sept. 25. This could show us that we have market structure and power to push the price upwards from the mentioned level and the next target would be around $260 where the minor trendline is. The current support line has been historically a good S&R level and now it becomes a major support level again. To make this level even stronger then we trade above the 50 and 100 EMA's which should also start to work as support levels. If we break below that blue line and if we break below that major counter trendline then we have a bearish confirmation and the bearish confirmation is even stronger because we are on the continuation chart pattern called "Rising Wedge. The overall market trend is down and if Bitcoin makes a breakout downwards from the triangle then Ethereum definitely makes a breakout downwards from the "Rising Wedge" and probably the next stop would be around $200. So, stay alert when you see at least a four-hour candle close below the major counter trendline which also breakout from the continuation pattern "Rising Wedge. Take a look at Cardano (ADA/USD) Price Analysis, Oct. 1, 2018 (https://u.today/btc-is-on-the-big-chart-pattern-eth-is-on-the-rising-wedge-ada-is-ready-to-make-a-move-price) Have a nice day! Title: Re: Daily price analysis BTC + ALTCOINS Post by: Dany44 on October 02, 2018, 10:46:42 AM Bitcoin is on the edge, Litecoin is on the upwards channel, Ripple possible scenarios & targets
https://u.today/sites/default/files/styles/880/public/2018-10/Pic%201_0.jpg?itok=aIi5wK-x Bitcoin is on the edge Bitcoin (https://cryptodetail.com/10-ways-spend-your-bitcoin) price slides on the triangle trendline. As youve seen on the four-chart, we don't have a candle close below the important trendline, the triangle trendline. Yesterday, the price touched exactly the round number area at $6,500 which worked nicely as a support, and it bounced quickly back to the triangle. This showed that buyers were alerted and theyve caught this move pretty quickly and managed to push the price back above the trendline. After that, we have small green candles, but those small green candles are slowly climbing above the EMA's. We still have a golden cross between the 50 and 100 EMA's. https://lh4.googleusercontent.com/auahIAxye87bMhgPLYahy3C6MSV6CL9A43NBXnTaIlj7H-g4szQnTFVu4cIYP_mgYUGIDH1mi7QbvqSD1svs-SddO4zeW04NIPB788Hq1aWAZm8VjgNIZkTBX7xGawmAOGcgfJtt If we look at the daily chart again, we got a bullish candlestick pattern called "hammer" (hammers are everywhere), this is the second hammer in the three days period, and it shows that buyers have the power to hold the price up even if sellers tried to push it down multiple times. https://lh6.googleusercontent.com/SWKIkPlq43jtL6YZN9_L8kSiCNuqR7mMQKzE65kaHXumaVquYGSigqEb-Uii1Yk3gn4Mqyn2SVF1ADXfasENjNFQm9eCwPk2kOqpGCgpNzagLIcmAhc4hz8Q1WYZnVYw7KTFc2jc Now, here is a question- do the bulls have the power to hold the price up and can they start climbing higher or are they out of steam? Maybe the bears are finally winning the battle, and soon we will see a candle close below the trendline? The candle confirms that the bears dominate the market at the moment and we can possibly witness a leg downwards. We are really on the edge, and anything can happen, but technically it looks more bullish than bearish. Litecoin (LTC/USD) is on the upwards channel Litecoin (https://u.today/wikicoin-litecoin) looks 'healthy' with the upwards channel and with the clean higher highs (HH) & higher lows (HL). Currently, LTC price has found a good support area from the round number at $60. This area matches exactly with Fibonacci retracement 50 percent. Two times tested ($60) and two times it got a bounce upwards. The EMA's are around the round number area and that makes this support level even harder to break. https://lh3.googleusercontent.com/xTS2I9SF5DWjPkUwWGl-B7RkkS0WKrtYS8FPBdVrDI8qvXmgns_W8v8_0McC6HIWwwS7tHVLMnq0gjxswMTNBchuZs5Sznx_Vd9PK_x-SmJOuZnD5HMdC337_SYb_VhS2JmXg6Mf We have a golden cross between 200 and 50 EMA, which also indicates that we are on the bullish mode but at the moment. In order to get a leg upwards, we have to break the blue line, the strong resistance area. Lately, six attempts failed, and it shows that if we want to be bullish then firstly, we have to take down the blue line which works as a resistance. The target would be slightly below the $70 where the minor trendline and the channel trendline crossing area plus the round number are. All those might work as a resistance, and the first short-term target should be there. The bearish confirmations would be a candle close below the round number $60, a candle close below the channel trendline (counter trendline) and probably the first stop is around $54-$55. These are the latest support level and previous higher low. Take a look at Ripple (XRP/USD) Price Analysis, Oct. 2, 2018 (https://u.today/btc-is-on-the-edge-ltc-is-on-the-channel-xrp-possible-scenarios-monthly-to-four-hour-time-frame) Have a nice day! Title: Re: Daily price analysis BTC + ALTCOINS Post by: mia khalifa on October 02, 2018, 01:51:37 PM I think the analysis that you are doing for now will not be able to provide clear information about the upcoming increase in cryptocurrency prices, such as yesterday's bitcoin price which can be as expensive as it is not unexpected. All predictions are missed and predictions are not right predict cryptocurrency price movements.
Title: Re: Daily price analysis BTC + ALTCOINS Post by: Dany44 on October 04, 2018, 09:51:12 AM Bitcoin got a bullish candlestick pattern, EOS shows some stability, TRON is almost ready to make a breakout
https://u.today/sites/default/files/styles/880/public/2018-10/Pic%203_0.jpg?itok=D12JpMb3 Bitcoin got a bullish candlestick pattern https://u.today/sites/default/files/inline-images/Bitcoin_5.png Yesterday was a very important day to find out what we can expect the next days. We reached as low as the April level at $6,425 and after that, the price quickly bounced upwards between the round number and the strong support at $6,460. Basically, we touched three important levels below the current price and we got a bounce, that gave us a nice daily candle close which was again above the $6,500. It is a very good sign because we touched pretty low levels and still, the bulls manage to push the price upwards above the round number and this 'jump' gave as also a bullish candlestick pattern called "Hammer. The hammer also indicates that we can see a reversal. https://u.today/sites/default/files/inline-images/Bitcoin1.png (https://u.today/why-does-bitcoin-have-any-value) If we look at the four-hour chart (image above) then, after the daily candle close the price made a very powerful statement upwards. The close was above the EMA's, the volume oscillator MA (moving average) is nicely pointed upwards and most importantly, the altcoins followed this movement and they are also on the green side. Currently, if we want to look the next resistances at the moment, we are on the pretty significant price area, the trendline area (pulled from July 24). The trendline and the latest resistance (orange 'line' above the current price) makes a crossing area. If we want to go to the higher prices then we have to break this crossing area. The break might open major resistance level at $6,767. If we don't find that power and if the momentum doesn't last long enough then our well-known levels below the current price start to work as support levels. A daily and the four-hour candle close below the $6,450 will be the significant signs that those moves were just little fakeouts and it confirms bearishness. EOS (EOS/USD) shows some stability EOS is currently on the short-term consolidation mode. After the September rallies, where it made new short-term higher highs, it had a little bit of a slow down. https://u.today/sites/default/files/inline-images/EOS_0.png At the moment we could see that it is on the chart pattern called "Triangle" and the triangle tip is a bit far from us, which indicates that we might see a small movement from EOS (https://cryptodetail.com/eos-coin-token-sale-over-whats-next). Positive signs are: we still have higher lows on the price structure and the current price is above the EMA's. This will show that it slowly start gaining some power to push through the triangle and this breakout from the triangle is also our main focus. To make a breakout, we have to fight with the triangle trendline and with the February low which works as a resistance, but that's not all because after the breakout from the triangle comes the round number $6 and then the latest peak (lower high) will start to work as a strong resistance level. So, pretty heavy levels above the EOS and to break through, firstly, BTC has to make a breakout from the trendline. Take a look at TRON (TRX/USD) Price Analysis, Oct. 4, 2018 (https://u.today/btc-bullish-pattern-eos-is-stable-trx-almost-ready-to-make-a-breakout-price-analysis-oct-4-2018) Have a nice day! Title: Re: Daily price analysis BTC + ALTCOINS Post by: Duogembrot on October 04, 2018, 10:51:00 AM this method seems to be no longer useful at this time because the prices that have passed let go but with your analysis this makes a lot of people aware of cryptocurrency price movements that rise and fall and must be brave to take risks.
Title: Re: Daily price analysis BTC + ALTCOINS Post by: BaraxLo on October 05, 2018, 05:27:25 AM if you can analyze bitcoin and altcoin it looks like you can determine what price movements will occur on the coin which means you will be able to determine the right time to buy and sell coins and can make you get a lot of profit. About Altcoins we have daily analysis everywhere as we know that we use Litecoin, Ethereum and several other crypto coins best for investment as well so we are in daily discussion about it as well. Besides this Bitcoin is the first name when we discuss about crypto market we say the Bitcoin which is currently running stable by price. On the other hand other Altcoins are also in their low markets especially Ethereum.Title: Re: Daily price analysis BTC + ALTCOINS Post by: Dany44 on October 05, 2018, 09:30:43 AM Bitcoin is technically good to make another leg upwards, Monero is getting ready for breakout, Ethereum is in trouble
https://u.today/sites/default/files/styles/880/public/2018-10/Pic%206_3.jpg?itok=dnvWeFWj Bitcoin is technically good to make another leg upwards Yesterday was bullish-day and the "Hammer" worked nicely as a bullish pattern. BTC price (https://u.today/bitcoin-still-breaking-new-lows-but-bullish-breakout-expected) found a resistance from the trendline which is pulled from July 24. Several attempts in the lower time frames to break upwards have failed, and currently, it makes a healthy little throwback (movement downwards). Healthy, because after impulse wave (yes, this is tiny impulse) there is always a correction before we can start another movement upwards. https://lh6.googleusercontent.com/pMkK9Hjt8vyfcvMrRQ3zf3Or9w_4Q_emJnz5FhEt1qg5r2b22qk-5eLAG8gx2q1G72onyD3TQjW-DcvXBsI4EOMy3tu3OCj79QbPiuwWELY-jo3TXfBnUD53fDNI7lh73mS2ouxd The current correction has founded a support from the golden Fibonacci ratio at 62 percent, and we discovered a very strong area on the chart between the $6,530-$6,550 (marked with the orange 'box'). This area has worked historically as a strong support and as a strong resistance and no single candle close inside this orange area, only powerful candles through the area up-and-down, this makes this area super strong. If the current scenario holds us, then there is almost a perfect starting point to go to the higher levels. First bullish confirmation is a trendline breakout, if we get at least a four-hour candle close above the trendline then it could mean another leg upwards to the next strong resistance at $6,767. Let's count down all the bullish price action criteria: 1. Oct. 3. we got a bullish candlestick pattern "Hammer" 2. Yesterday (Oct. 4) we got a nice impulse upwards 3. Current throwback has found a support from the golden Fibonacci level at 62 percent 4. Current throwback has found a support from the super-strong area So, technically Bitcoin is ready to break that trendline! To confirm bearishness then the candle close below the orange area will guide us to the lower levels and the full bearish confirmation is then when we also get a candle close below the $6,460 (blue line). Monero (XMR/USD) awaiting breakout Monero looks a little bit suspicious and looks like it needs to wait a moment and for the opportunity to break upwards from the triangle. https://lh4.googleusercontent.com/jhgmPj38j3DOMOKEnw13Qh5OPw3cvkkNI540v6GCih5f7biSGUs0K-MxR7rS-T_QJZZkzHYOGNNiT-80HL9pDFMnWbXiOEKkOV14iVqN7ahjpiWihwK1F3lV6zZLaiELpAIaXWjJ Currently, there have been several attempts to break through the counter trendline, but it has held the price nicely. Slowly, XMRs move into the triangle tip to explode and if Bitcoin makes a move upwards and it breaks the trendline then definitely Monero has waited the perfect moment to do the same. At the moment it trades above the 200 EMA on the four-hour chart. The counter trendline and the 200 EMA make together a strong support area below the current price. So, the only way that we could see a Monero (https://cryptodetail.com/how-buy-monero-xmr-and-whats-reason-it) coming down is if the BTC can't break that resistance and starts to come down, a candle closes around $6,450. In this case, we can say that Monero comes down also but currently, doesn't looks like that. For breakout from the upper trendline, there are two target areas at $128 and $140. Those are the recently worked resistances, and we would recommend to take out some profits in this area because around $150 is just hell. There are multiple monthly supports and resistances that you never want to be on Monero if we reach into this area. The bounce downwards could be probably massive if the scenarios matching each other. Take a look at Ethereum (ETH/USD) Price Analysis, Oct. 5, 2018 (https://u.today/btc-looks-bullish-xmr-has-waited-for-opportunity-eth-is-in-trouble-price-analysis-oct-5-2018) Have a nice day! Title: Re: Daily price analysis BTC + ALTCOINS Post by: Bonsaiav on October 05, 2018, 11:18:13 AM this method seems to be no longer useful at this time because the prices that have passed let go but with your analysis this makes a lot of people aware of cryptocurrency price movements that rise and fall and must be brave to take risks. Maybe you are right, because most investors today, seem to be more following the flow of trends that are developing at this time. But for most traders, price analysis using methods like this's very necessary. Even if you are able, you have to do it within 24X7. Title: Re: Daily price analysis BTC + ALTCOINS Post by: Dany44 on October 08, 2018, 01:30:10 PM Bitcoin weekly forecast and Ripple possible scenarios
https://u.today/sites/default/files/styles/880/public/2018-10/Pic%208_0.jpg?itok=XEj7bOAR Bitcoin weekly forecast https://u.today/sites/default/files/inline-images/image2_31.png Let's start with a weekly time frame. In the picture above, we have a curved support line which reflects the price over a period of time. It starts this February, and now we have touched it multiple times over the last weeks. Previously, when the price was approaching the trendline, it was rejected quickly and had to move sharply downwards and when the price has touched the curved support line after that, it has bounced upwards pretty quickly. But currently, we are waiting for the momentum with the volume. This week we will definitely see a bigger movement because the price is approaching the crossing area and is ready to make a breakout in either direction. In order to find out which direction is more favorable, we need to examine shorter time frames, too. However, during the last three weeks, the price has bounced upwards from the round number of $6,500 which works as a support. Note that there are more bullish signs on shorter time frames. https://u.today/sites/default/files/inline-images/image3_24.png Let's take a look at a four-hour chart. As you might have already noticed, we managed to push through the trendline which was the last week major goal. Over the weekend, as usual, the price moved sideways because the weekends are historically with a super-low volume. Luckily, this sideways kick brought an important price action movement. On Friday, Bitcoin broke above the trendline and over the weekend made a retest and got a bounce exactly from the trendline which previously was a resistance and now becomes a support. To get a move upwards, we have to break above the orange line, which is just above the current price. This level has worked multiple times as a resistance and if this level breaks, it will be the first sign of the bullishness. That would be a small step due to Bitcoin (https://u.today/will-next-financial-crisis-bring-a-boom-to-bitcoin)s super-strong resistance and the major down-trendline crossing area position above the orange line. Crossing area is very hard to crack and we need a massive volume to accomplish that. If Bitcoin moves upwards, we can get the power to guide us through $6,767 and through the major down-trendline. Thus, the first major targets would be around $7,000 and $7,300. In the four-hour chart, the Bitcoin price trades above the all-important EMA's which is a good sign if we want to see a movement upward. However, in the daily chart, the price is currently below the 50 EMA. It works as a resistance and matches with the orange line on the four-hour chart. The orange line is the first short-term level for bullish BTC. Remember, the breakout can occur in either direction: above the major down-trendline or below the curve support. The major downwards confirmation is a daily close below the curve support and the round number of $6,500. The close will give us several break below's: - Break below the curve support; - Break below the round number; - Break below the EMA's; - Break below the minor up-trendlines. Summary: Weekly timeframe analysis indicates that the price starts to think differently three weeks around the major trendline without any dump are an indication. The four-hour chart shows bullish signs such as trendline breakout and retest, but strong support levels at $6,460 and $6,500 have held the price nicely. The correction to $6,460$6,500 is possible; however, its not favorable to witness candle close below these levels. Specifically, it applies to a daily candle close because then the bullish momentum would be gone and the possibility that the bears start to control the market would be high. RIPPLE (XRP/USD) Possible Scenarios Since Sept. 22, the Ripple (https://cryptodetail.com/why-should-i-invest-ripple) price has had consolidation between $0.45 and $0.6. Remember, last week we discovered Cypher harmonic pattern and now it has completed. Currently, it got a bounce exactly from the complete area at $0.475. https://u.today/sites/default/files/inline-images/image1_43.png The price is again above the short-term counter trendline which is a good sign if the market stays stable. To get a full confirmation, we have to break the round number of $0.5 which works as a resistance. In this area, there is also an old support level which now transfers into the resistance level. So, the road to the higher prices is almost free. The only stop could be on the Mays low level at $0.544. This scenario could be very powerful if Bitcoin makes a breakout upward from the major down-trendline. In this case, the target is even higher and we can easily reach it into the June low level at $0.7. Bearish confirmation would be a candle close below the previous low at $0.47 (below the short-term counter trendline). The first support would be the grey area, which was the support on Sept. 25, and after its crack, the major support would be at $0.4. Take a look at Daily Price Analysis (https://u.today/pricewise) Have a nice day! Title: Re: Daily price analysis BTC + ALTCOINS Post by: trako on October 08, 2018, 01:56:01 PM these reports are not enough for market analysis. Resistance point graphically stands weak. Don't expect a downward movement. will continue at this level. If there are five different consecutive moves up, the uptrend begins.
Title: Re: Daily price analysis BTC + ALTCOINS Post by: upsidedown75 on October 09, 2018, 10:03:29 AM this method seems to be no longer useful at this time because the prices that have passed let go but with your analysis this makes a lot of people aware of cryptocurrency price movements that rise and fall and must be brave to take risks. It is very important to monitor market price and to stick with it and to hold your coins tightly till bull market price. Once you are done with it then you will have a huge profit at the end of your investment. Bitcoin is currently available on low price and perhaps it is from about 7 months the price is running down. Other Altcoins are also available on low price is now is the best time to buy it using less amount.Title: Re: Daily price analysis BTC + ALTCOINS Post by: Dany44 on October 10, 2018, 12:07:59 PM Bitcoin testing the curve support, Litecoin breaks below the minor trendline, Monero looks bad
https://u.today/sites/default/files/styles/880/public/2018-10/PW_10.10.jpg?itok=hjihUS7z Bitcoin testing the curve support Yesterday's price range was pretty small. The price was above the orange area (an important level) and below it. https://u.today/sites/default/files/inline-images/image3_26.png Currently, the price makes moves and it has broken below the all-important EMAs, it has reached the curve support line and the March low level which also should start to work as a support. The Fibonacci golden ratio retracement level at 62 percent will indicate if we get a bigger or a smaller bounce upwards. If we get a candle close below the mentioned levels, it would be the first sign of the bullish momentum gone. Our next major supports are the round number $6,500 and the strong support area at $6,460. At the moment, altcoins (https://u.today/5-best-altcoin-to-invest-in-2018) also take this little hit but nothing remarkable. Watch those levels (curve support, round number, and the blue line as a strong support) and if the price breaks below then definitely stay out and wait for some better opportunities to enter again. LITECOIN (LTC/USD) Breaks Below The Minor Trendline Currently, the market takes some hit and so do altcoins. https://u.today/sites/default/files/inline-images/image2_33.png Currently, Litecoin (https://cryptodetail.com/litecoin-preditions) has made a break below the minor trendline which will indicate that the red box below the price around $57 should start to work as a support. If this level doesnt hold and if BTC drops even more, then we could see a break below the red support area and the price approaching the next support level at $55, and that would be an important level. In this case, the price structure may change. This area is the last HL (higher low) formation area and if it breaks, bad things can happen. At the moment, BTC is on the very important area and if it gets a bounce upwards, LTC will have a good opportunity to follow this move and the targets will be on the next round number at $60 and the strong resistance at $62. So, watch closely what Bitcoin does. Take a look at MONERO (XMR/USD) Price Analysis, Oct. 10, 2018 (https://u.today/btc-testing-the-curve-support-ltc-breaks-the-trendline-xmr-looks-bad-price-analysis-oct-10-2018) Have a nice day! Title: Re: Daily price analysis BTC + ALTCOINS Post by: Dany44 on November 05, 2018, 09:13:31 PM Bitcoin Price Prediction for November: The Market Is Wound Up and Waiting
Bitcoin price predictions 2018 have not come to pass. The coin is range-bound and waiting for something to happen, but what could it be? https://u.today/sites/default/files/styles/880/public/2018-11/_D0_BE_D0_B1_D0_BB_D0_BE_D0_B6_D0_BA_D0_B0.jpg?itok=D2JUXMsX Technical Outlook The technical outlook for Bitcoin is lackluster at best. With no major catalyst to drive it, the coin is languishing near long-term lows where it has been trading for many months. The worlds leading cryptocurrency is trapped in a tight range and does not look like it will break out any time soon. Indicators like stochastic and MACD concur; this token is range-bound and trending sideways for the short-term at least. https://u.today/sites/default/files/inline-images/1_22.png Description - Bitcoin price chart with Bitcoin Predictions 2018 Major support is above $6,000, and the tokens range appears to be narrowing down to a point near $6,400. This point is noteworthy as it is the balance point at which miners most of them, anyway are able to turn a profit. If the price of Bitcoin was to fall significantly below this level, it could force miners out of the market and spell the end for the worlds reserve cryptocurrency That is not a possibility in our Bitcoin projections. Our Bitcoin forecast is this: the price of Bitcoin will most likely trend sideways within the current trading range until the next major catalyst emerges. The token will likely trend near a point of the market equilibrium that appears to be near $6,400. When the catalysts emerge and there are several on the horizon, Bitcoin will break out of the range and start moving higher. How high it goes will depend on the catalyst. Bitcoin miners are supporting the market The global hash rate data says that Bitcoin miners are still interested in the number one cryptocurrency by market cap and are supporting the market. The global hash rate, the amount of computing power spent on BTC mining, topped out this year when BTC prices hit their lowest levels but have since been trending at record-high levels. The miners are important for one fundamental fact: they are the source of all Bitcoins. Because it costs the miners about $6,500 per coin to operate their rigs, you can bet the price of Bitcoin wont far fall below that level. https://u.today/sites/default/files/inline-images/2_22.png Description - Chart of Bitcoin hash rate growth since 2017 A Dwindling Supply will help drive prices higher What most Bitcoin price predictions fail to mention is the ever-dwindling supply of Bitcoins. By dwindling, I do not mean the ever-increasing difficulty rate which makes finding new Bitcoins harder and harder. By dwindling, I mean the growing number of Bitcoins that are lost or irretrievably locked away. - Proof of Burn is a way to start new cryptocurrencies by burning another cryptocurrency. A public cryptocurrency burn is sending cryptocurrency to a prearranged and irretrievable BTC address for the purpose of shifting value from one token to another. Estimates as recent as November 2017 had the number of lost Bitcoins at 4 mln. That number has jumped significantly over the last 12 months and now stands closer to 7 mln lost Bitcoins. The reasons for the loss are varied, but all point to one thing: less and less Bitcoins are available every day, and eventually, they will all be gone. To put this problem into perspective, think about this: there are only 21 mln BTCs ever to be mined, about 18 mln are already mined, and 7 mln of those are lost. People lose Bitcoin on purpose?! One of the primary reasons Bitcoins are getting lost is Proof-of-Burn. Proof-of-Burn is the concept that value stored in one token can be transferred to a new digital token. By burning coins in a public fashion, sending them to an unrecoverable address, the tokens are lost on purpose and are in effect an escrow account guaranteeing the value of the newly created cryptocurrency. Regardless the reason, the bottom line for investors is this. Bitcoin is a commodity; commodities are valued based on supply and demand. We know for a fact that supply is shrinking, all it will take for Bitcoins price to shoot higher is an increased demand. Bitcoin is the dominant cryptocurrency Despite this years bear market in cryptocurrency, Bitcoin remains the leading digital currency by market cap. The total market cap for Bitcoin has been hovering near $110 bln over the past few months and represents more than 50% of the total cryptocurrency market. This figure shows Bitcoin is still the most sought-after digital token commanding the greatest flow of new money. Over the past year, Bitcoins dominance has been in flux as bearish activity and the launch of new tokens induce market volatility. Bitcoins dominance fell to a low near 33% in January 2018 and has since recovered. Over the past two months, the tokens dominance has steadily increased to current levels as market participants flock back to the most stable and trusted digital currency on the market. Source: Coinmarketcap.com https://u.today/sites/default/files/inline-images/3_22.png Description - Chart of Bitcoin price dominance with annotations This figure is brought into sharp contrast when compared to the #2 and #3 digital currencies by market cap, Ethereum and Ripple. Combined, Ethereum and Ripple command less than 20% of the total market which makes them less attractive to new money seeking to invest in cryptocurrency. When the market comes back, and it will, Bitcoin will be the first choice as it has the greatest respect and trust among digital currency traders. 1. Bitcoin dominance November 2018 is 53%. 2. Ethereum dominance November 2018 is 10%. 3. Ripple dominance November 2018 is 9%. How does this affect the Bitcoin price prediction 2018? If you look at the Bitcoin price prediction 2017, there is a compelling comparison to be made. In 2017, just before Bitcoin began its wild march to $20,000, the tokens dominance fell below 40% before resurging to more than 60%. Many analysts believe, and I am one of them, this years fall to 33% and rebound to 50% are signaling a rebound in Bitcoin price that only needs a catalyst to get started. Regulation is the catalyst traders are waiting for The catalyst traders are waiting for is regulation. Regulation and regulatory issues have been hanging (https://cryptodetail.com/legality-bitcoin-united-states-august-2018) over the entire cryptocurrency market for years and are the cause of the 2018 bear market. The war began last fall when Chinas financial regulators moved to ban cryptocurrency, cryptocurrency trading, and ICOs within China. The bear market was set off a month or so later when South Korea, a hotbed of Blockchain technology, made similar moves. Since then, South Korea has softened their stance, embracing Blockchain and digital financial securities, but the issue of regulation is far from being settled. Source: CCN.com Bitcoin Infographic Description - Bitcoins potential to change the world, from CCN.com The number one issue holding traders back today is the SEC, the CFTC, and US regulation. The SEC and CFTC have allowed the listing of BTC futures, but that is as far as theyve got regarding the legal listing of Blockchain-based trading solutions in the US. The SEC has created a cryptocurrency czar whose job is to coordinate proper regulation of the market, but still, there is no framework, not even a hint of what may come. Traders around the world are waiting for a Bitcoin or cryptocurrency ETF to be listed in the US. Many Bitcoin predictions see such a listing as early as this year, although the chances of that are getting slimmer by the day. The SEC has already reviewed and rejected over a dozen requests by money managers to list such an ETF, and there is yet no indication of when, or even if, a Bitcoin ETF will be permitted. A Bitcoin ETF is on the way, traders need to be ready A group of Blockchain industry leaders including fund managers, cryptocurrency developers, and hedge fund/private equity investors made a plea to the US Congress for clarity on cryptocurrency regulation. Their stance is that lack of regulation is far more damaging to the US investor than any risks with the technology. The plea resulted in Congress asking the SEC for clarification, and yet still no word. The biggest hurdle for US regulation of cryptocurrency is a lack of regulated infrastructure; there isnt any, or not very much, anyway. The good news is that Bakkt may end all that. Bakkt is a joint venture between the ICE (The Intercontinental Exchange) and partners. Quote Bakkt is designed to enable consumers and institutions to seamlessly buy, sell, store and spend digital assets. Formed with the purpose of bringing trust, efficiency and commerce to digital assets, Bakkt seeks to develop open technology to connect existing market and merchant infrastructure to the Blockchain. The exchange is designed to support the purchase, storage, and trading of digital currencies across ecosystems and includes a digital clearinghouse for trades. The exchange is expected to launch its first products, new BTC/USD futures, in early December 2018 and seen as the stepping stone to a Bitcoin ETF. The takeaway for traders is this: Bitcoin regulation is holding the market back, and news, for good or bad, is what will drive the cryptocurrency markets over the next twelve months. If the SEC puts the kibosh on BTC and cryptocurrency investing, ETFs, and other retail products, you can rest assured the cryptocurrency market will react negatively. If, on the other hand, a BTC ETF is approved (as expected), you can rest assured Bitcoin prediction and Bitcoin price forecast will turn overwhelmingly bullish. https://lh5.googleusercontent.com/T8jBgGibGN66vc4WAOLlQMhzLJpn0XendeacdHDsQYFHU8iUIPcbXjsnmfuZhS8zPPgrVuMV5MakLdms3YvQTp2_sqfSf2s639HiQ3sRD6RRFSohb0vZUGBjPy3I8dAWI6vvD1VP Description - Bitcoin prices are expected to move higher in 2018 and 2019 My Bitcoin Prediction? It is only a matter of time before the US embraces cryptocurrency regulation and allows a BTC ETF to be listed. If that happens, my Bitcoin price forecast is this: Bitcoin will retest its all-time high near $20,000 and most likely break through to new all-time highs. Bitcoin predictions 2018 are a dime a dozen, everybody has an opinion of when and how high BTC will go. The only thing you need to know is that BTC is going to move higher, if not now, then very, very soon. Source: https://u.today/bitcoin-price-prediction-for-november-the-market-is-wound-up-and-waiting |
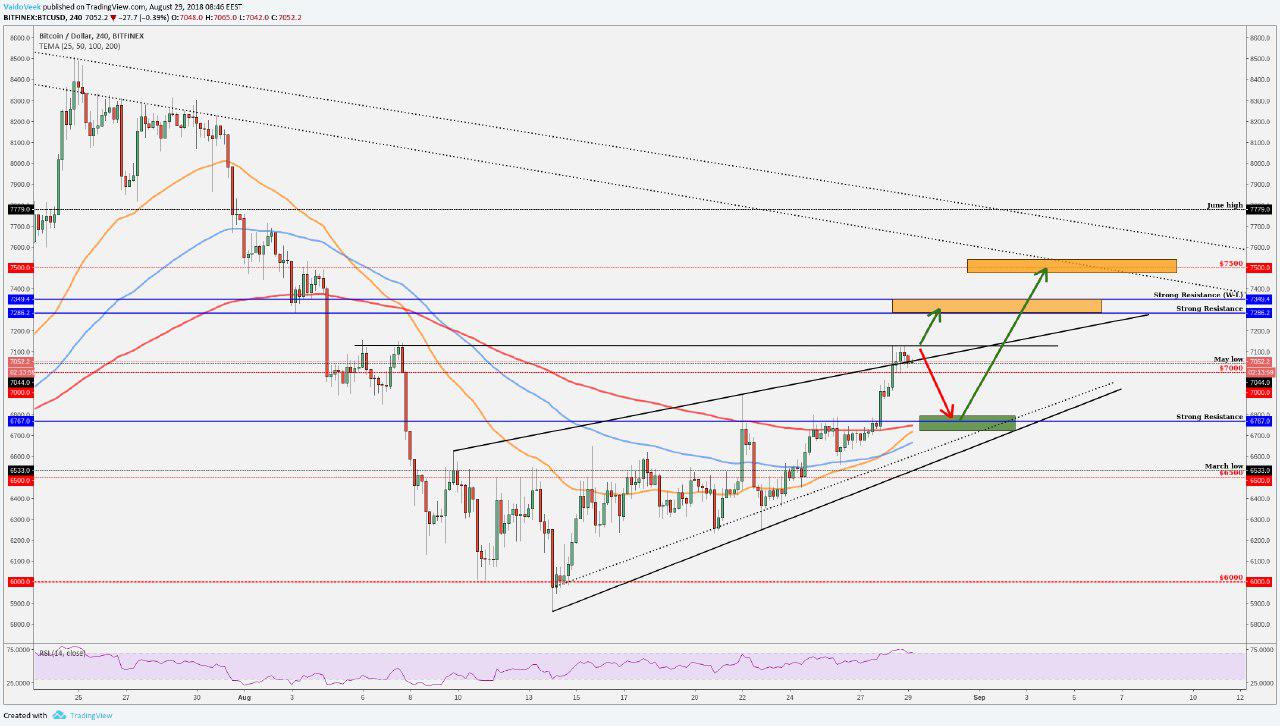
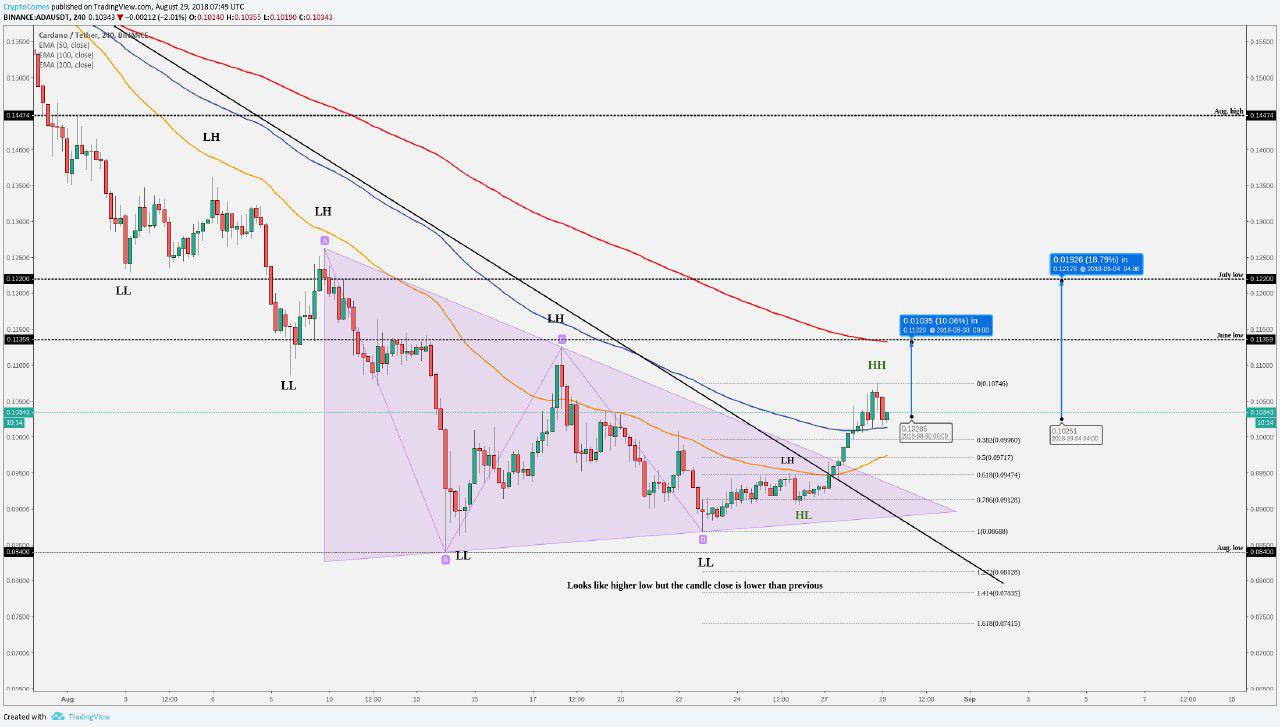
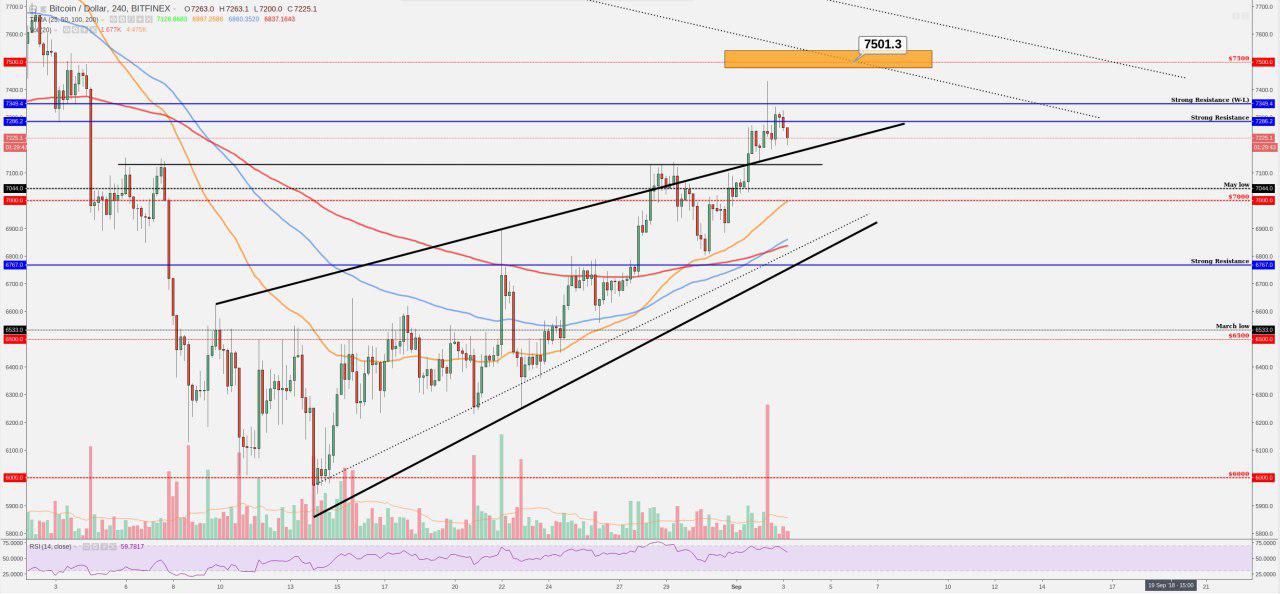
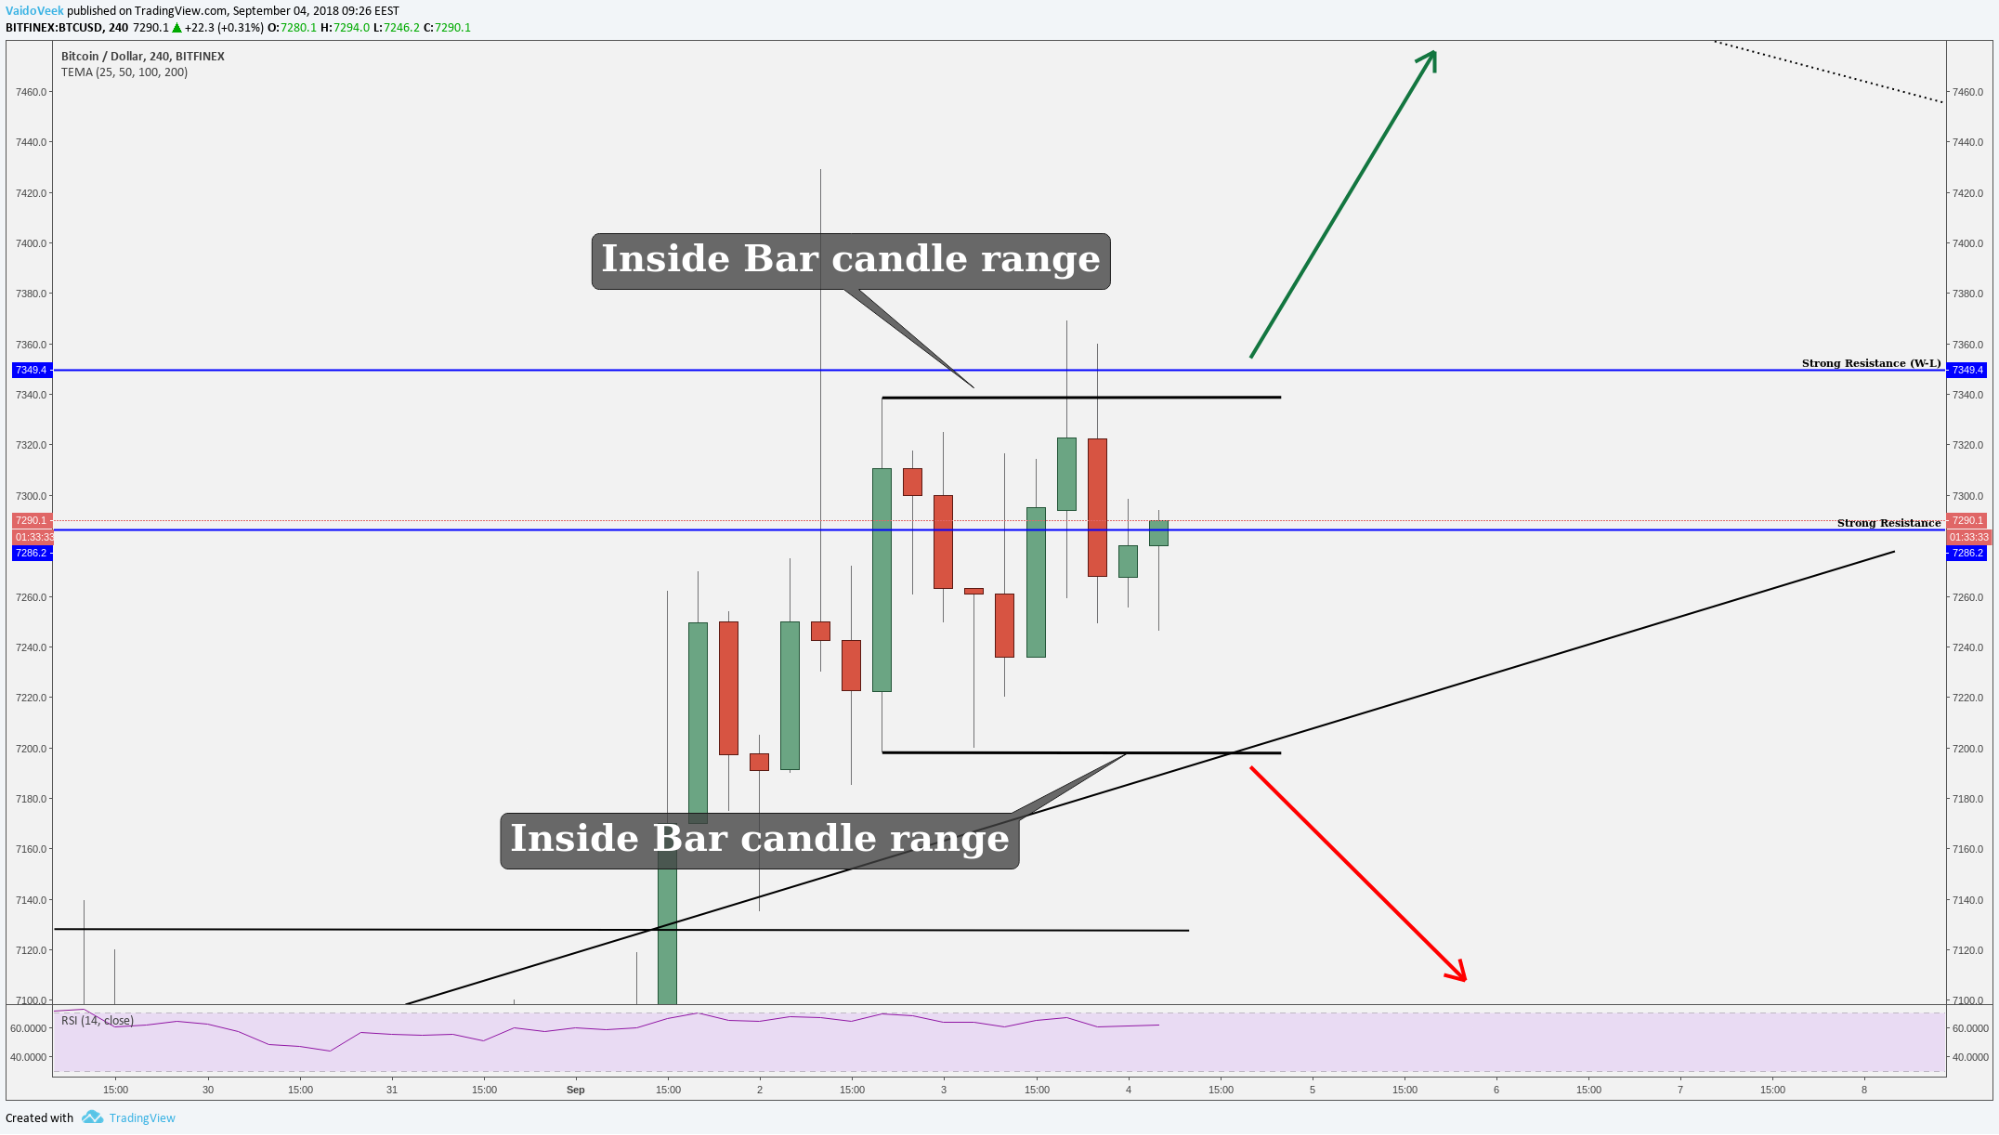
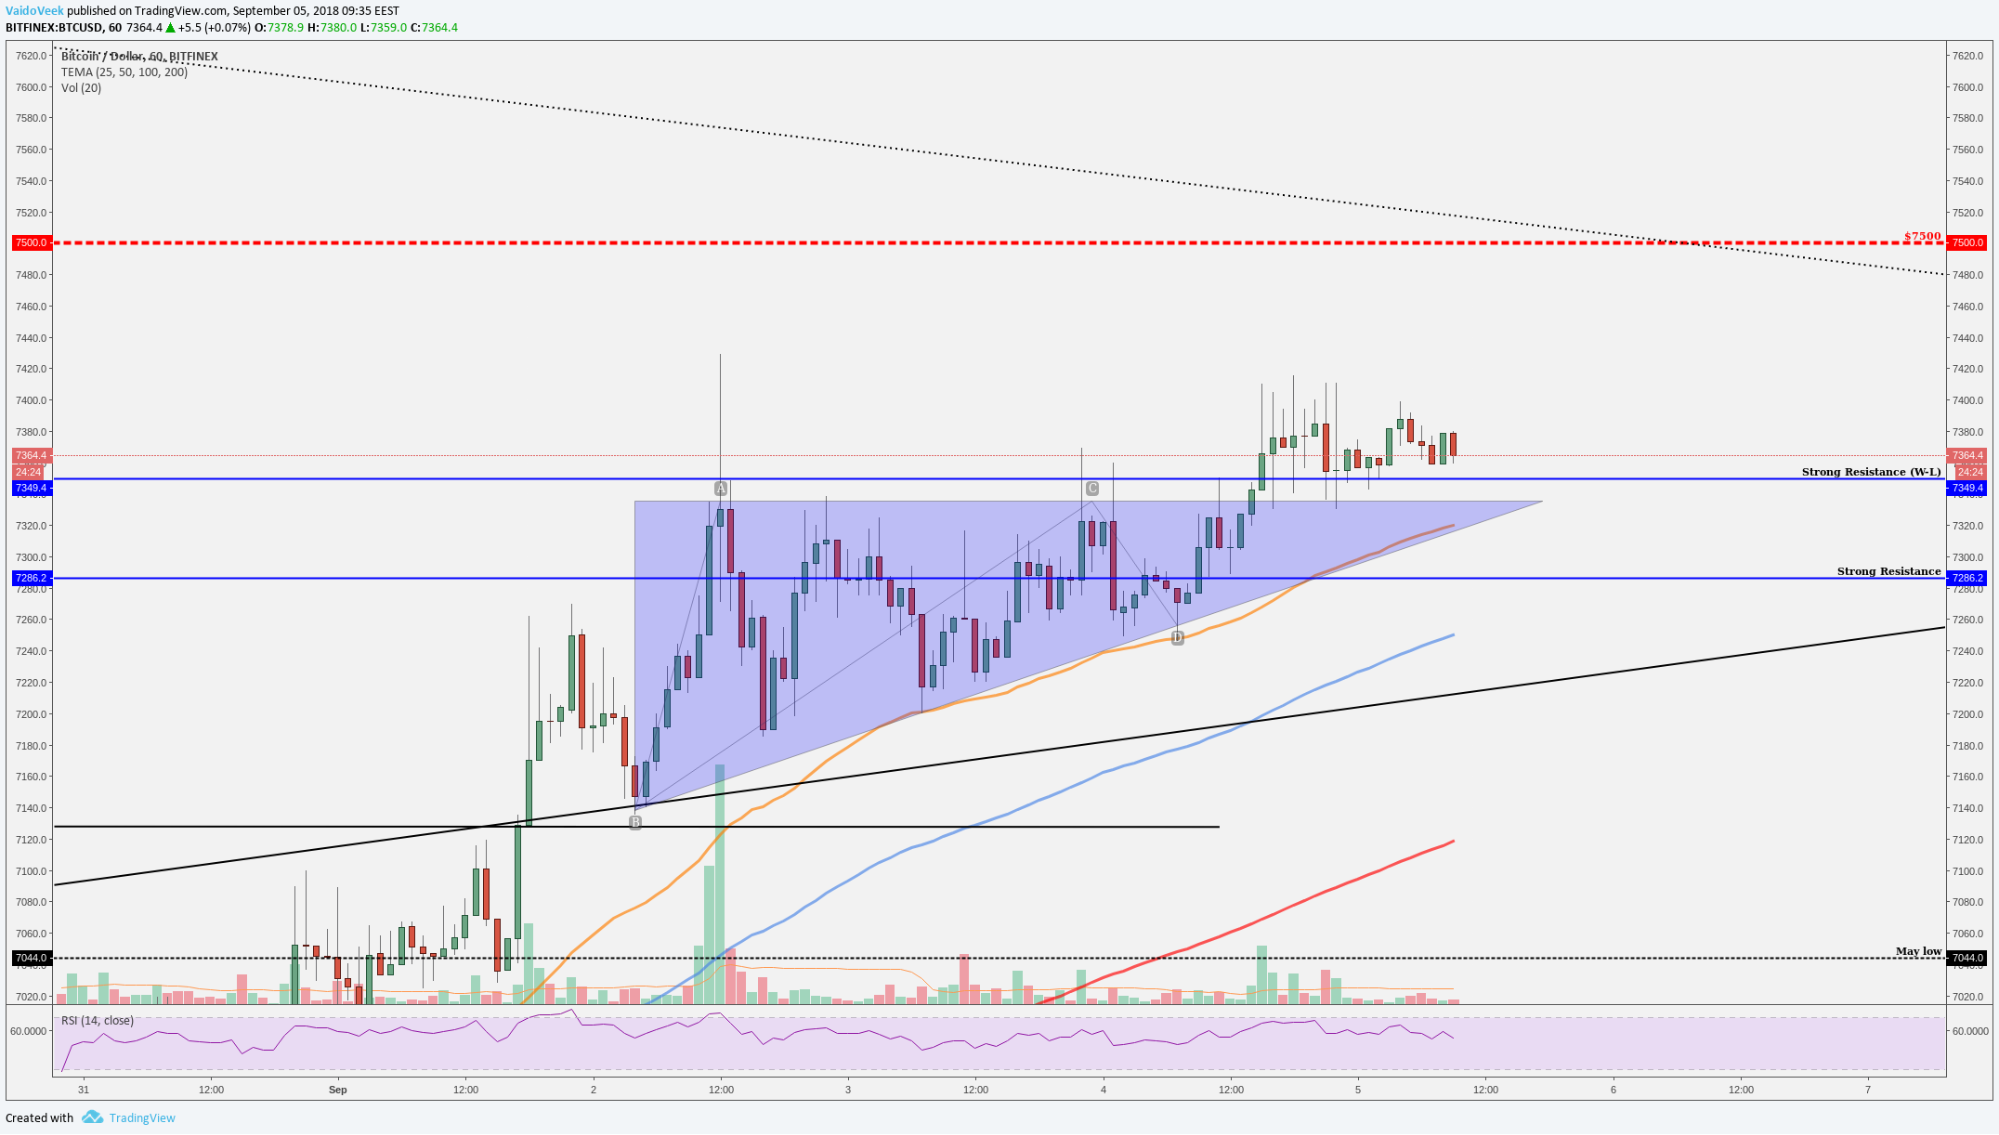
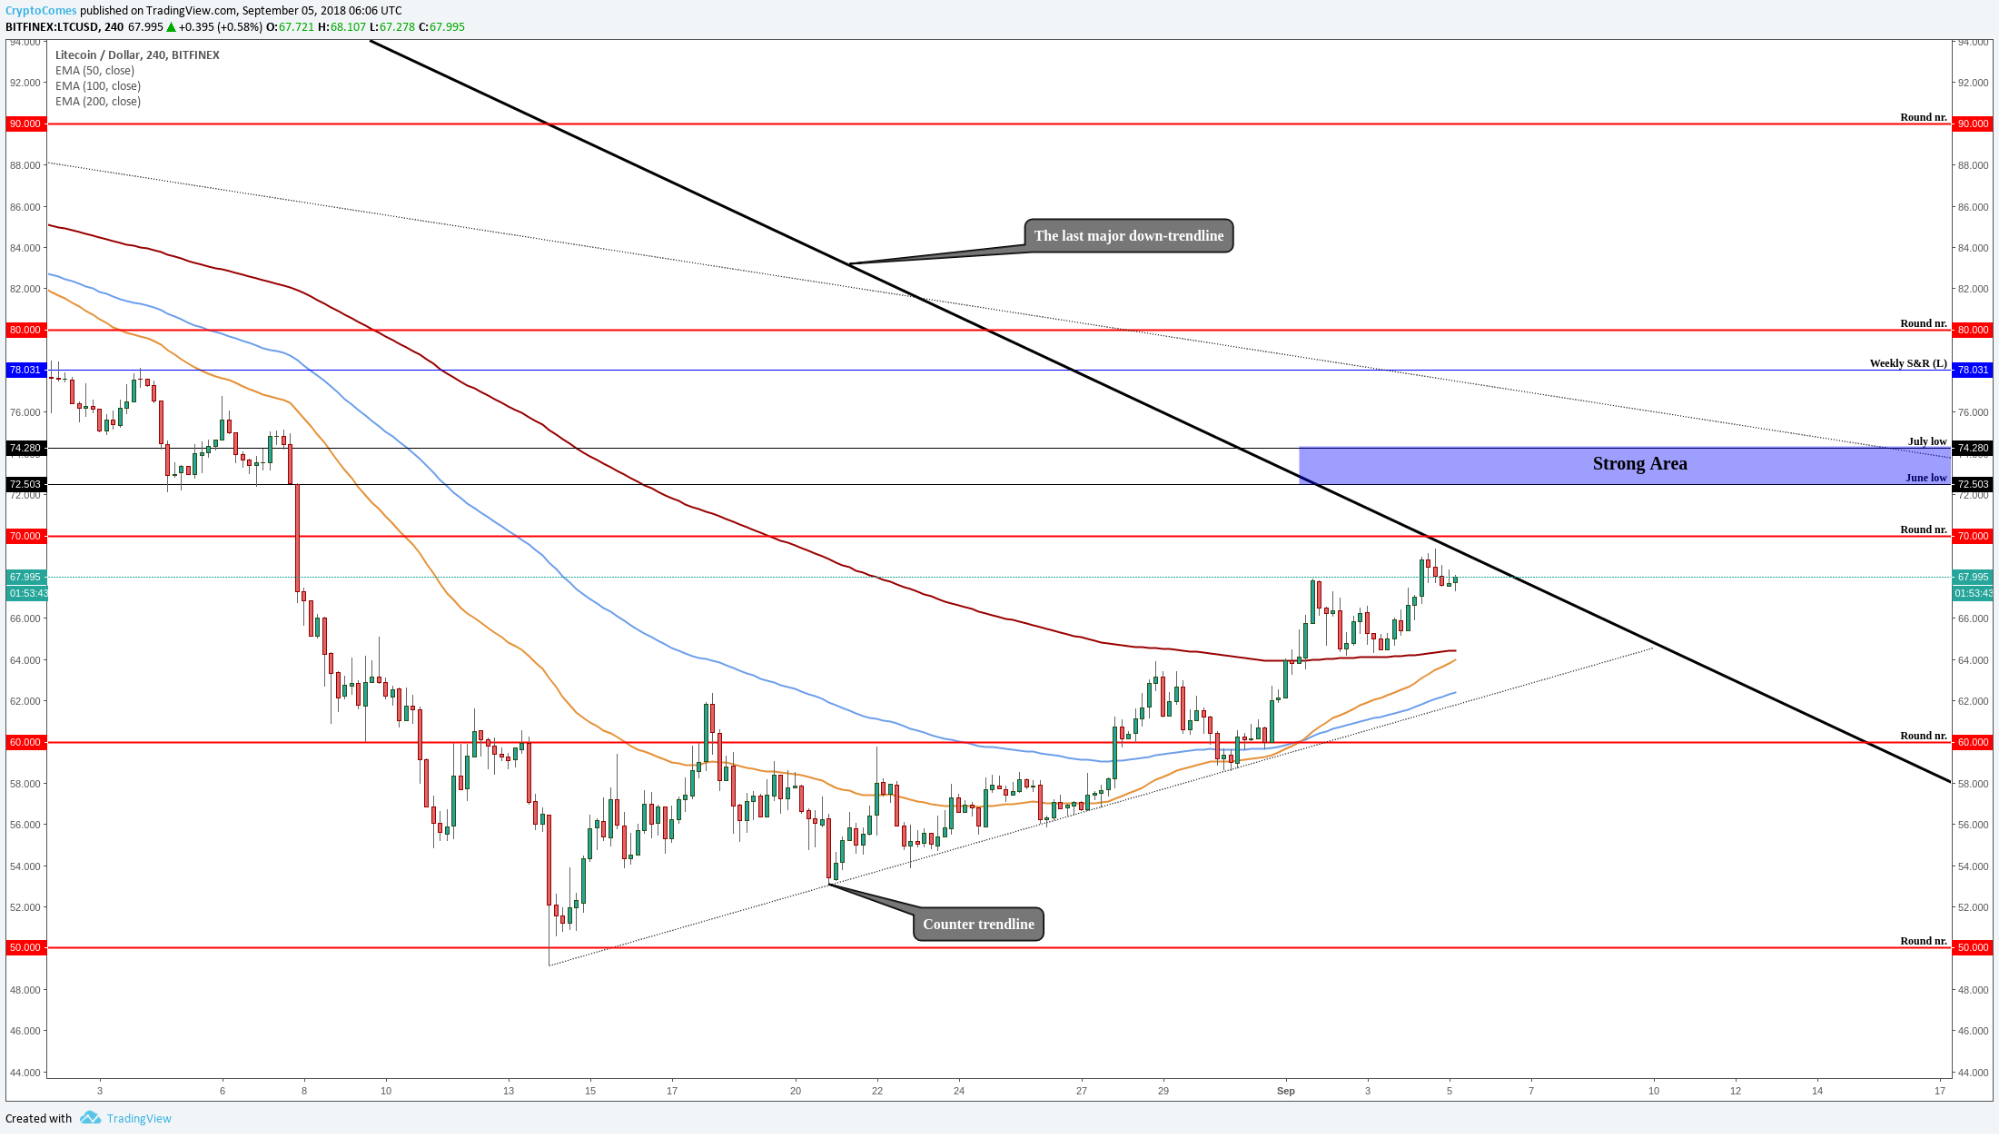
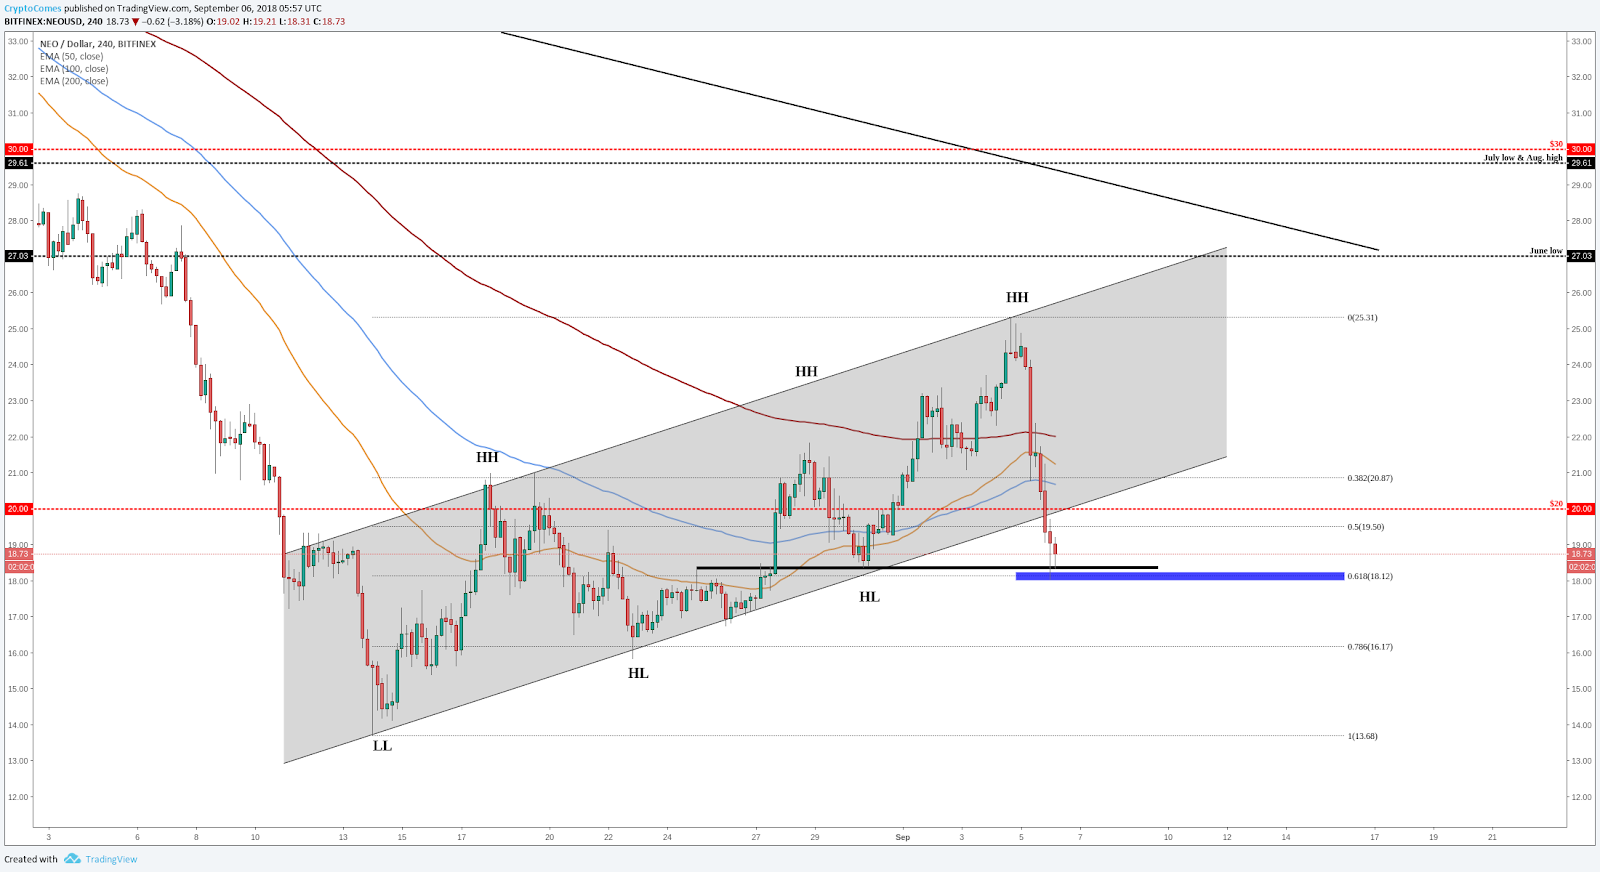
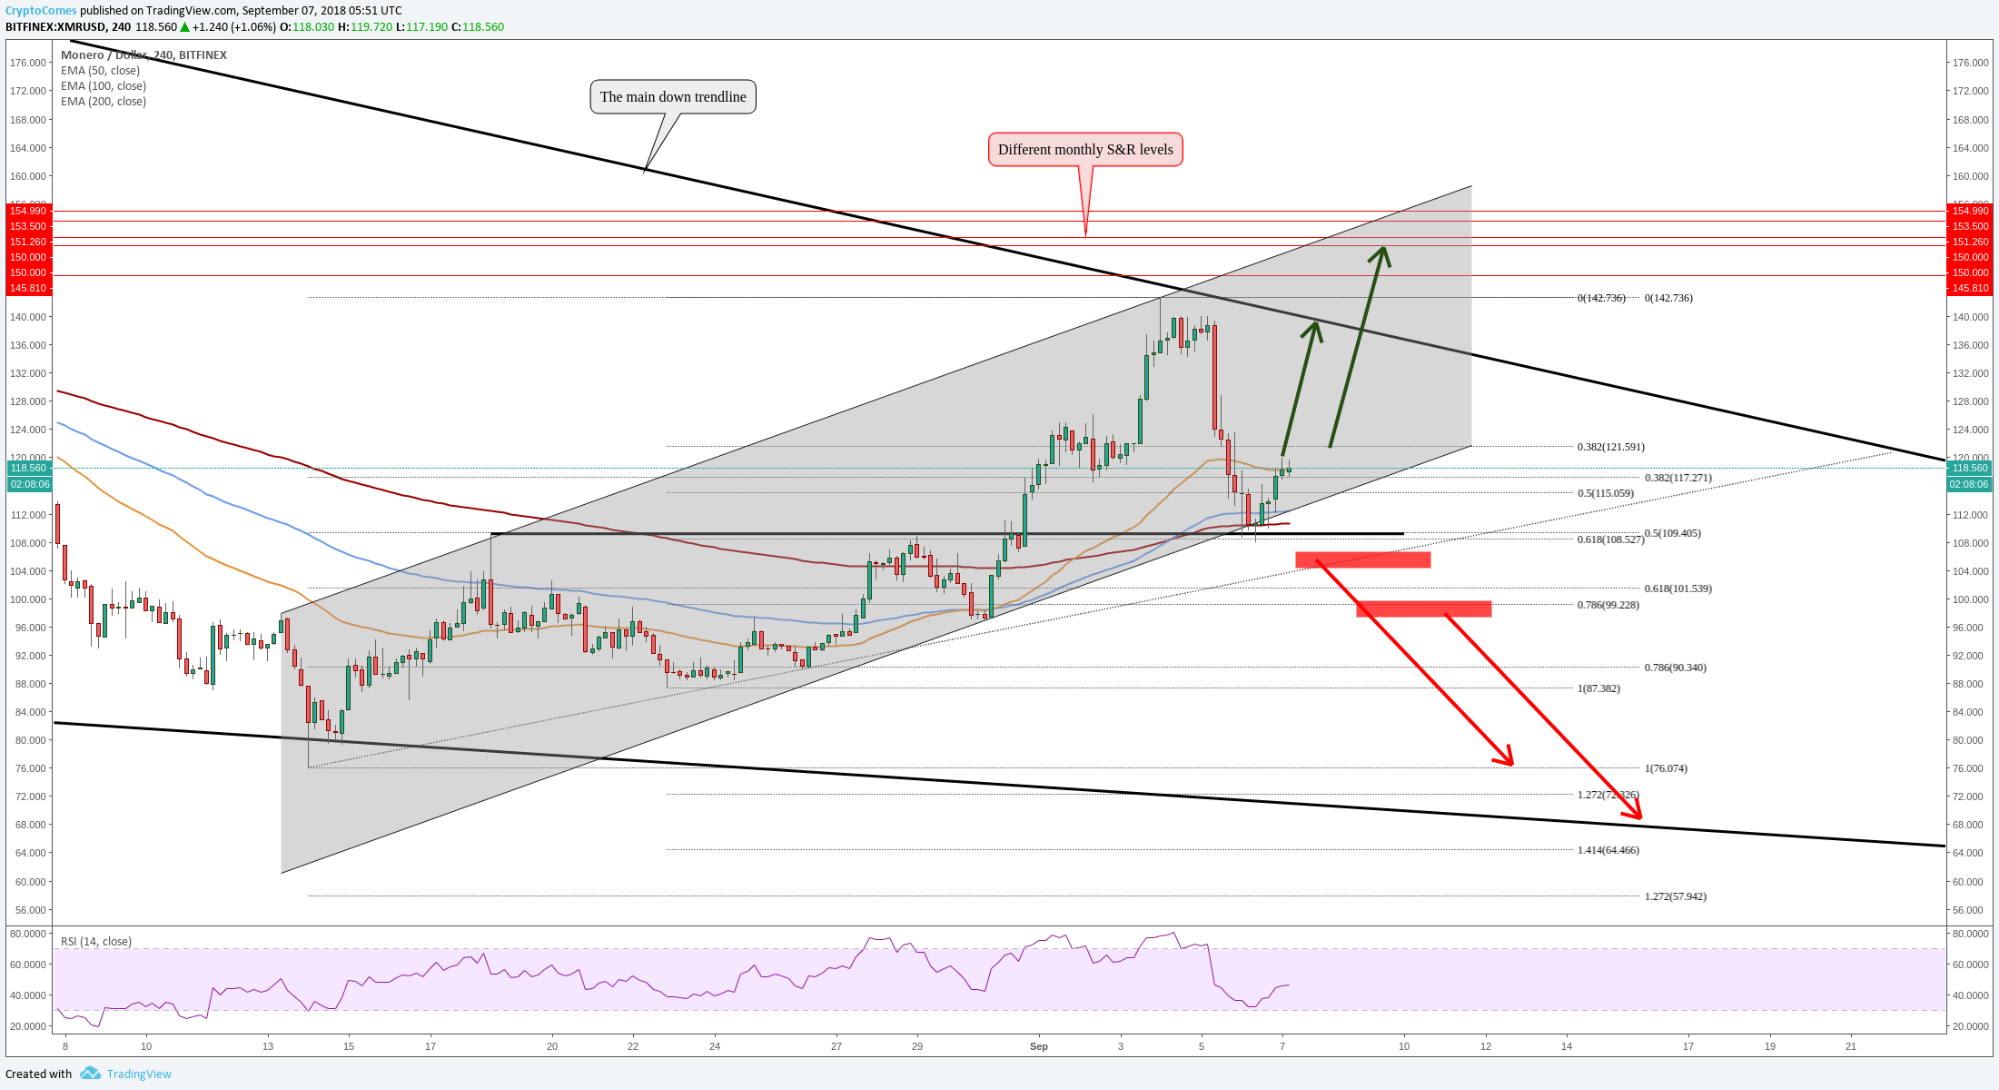
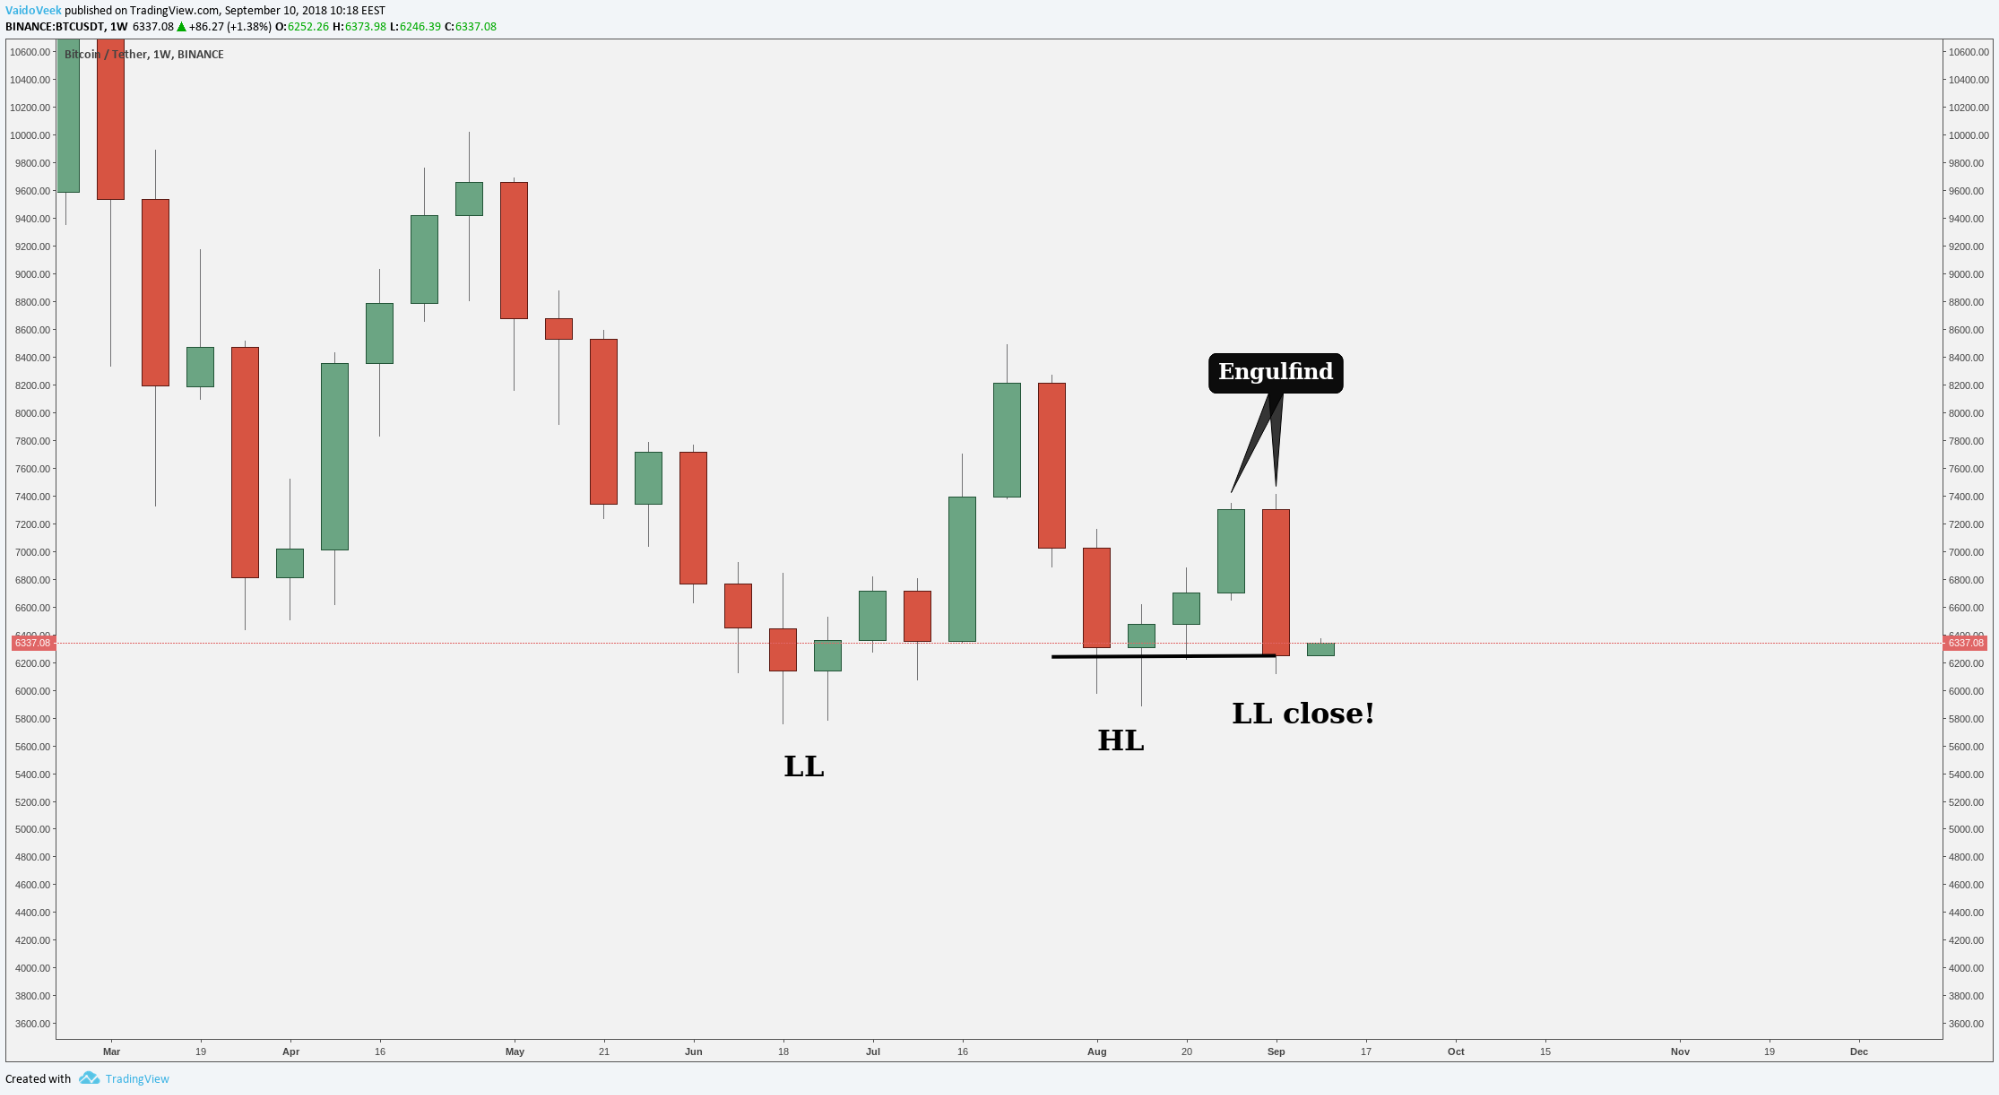
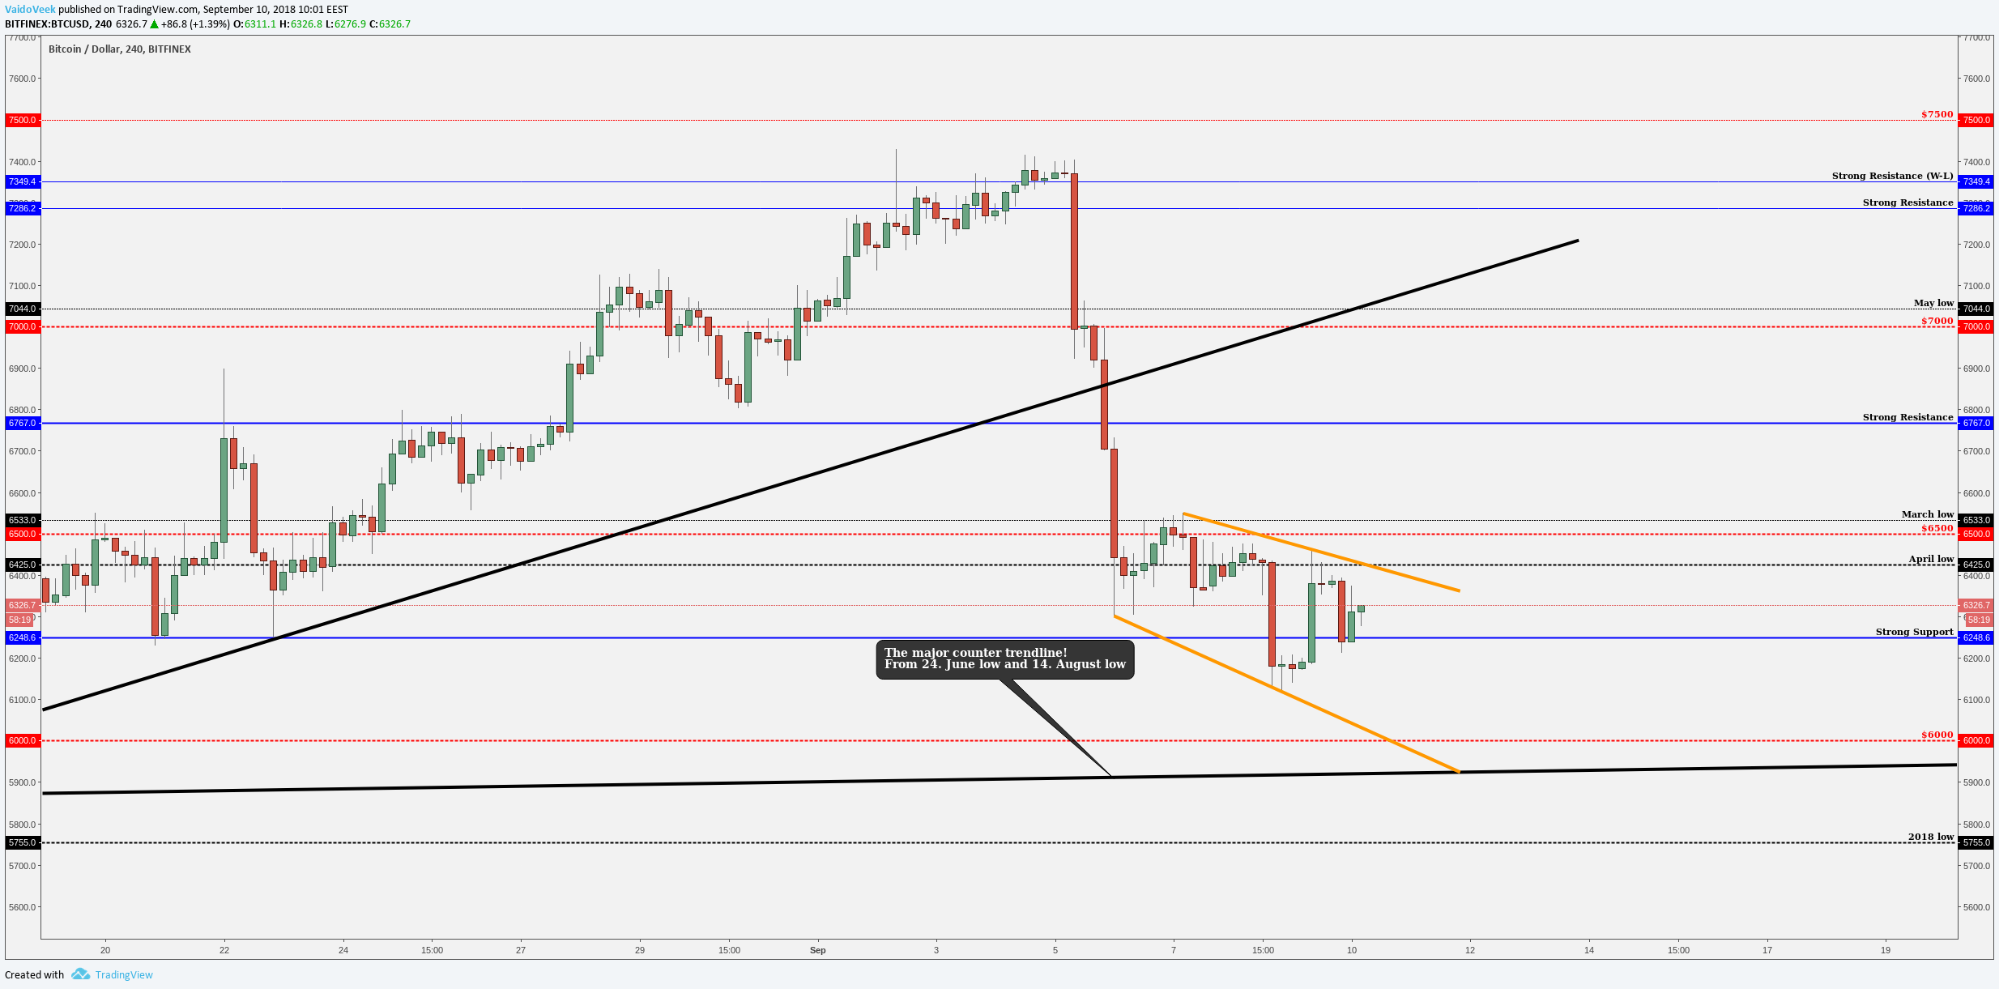
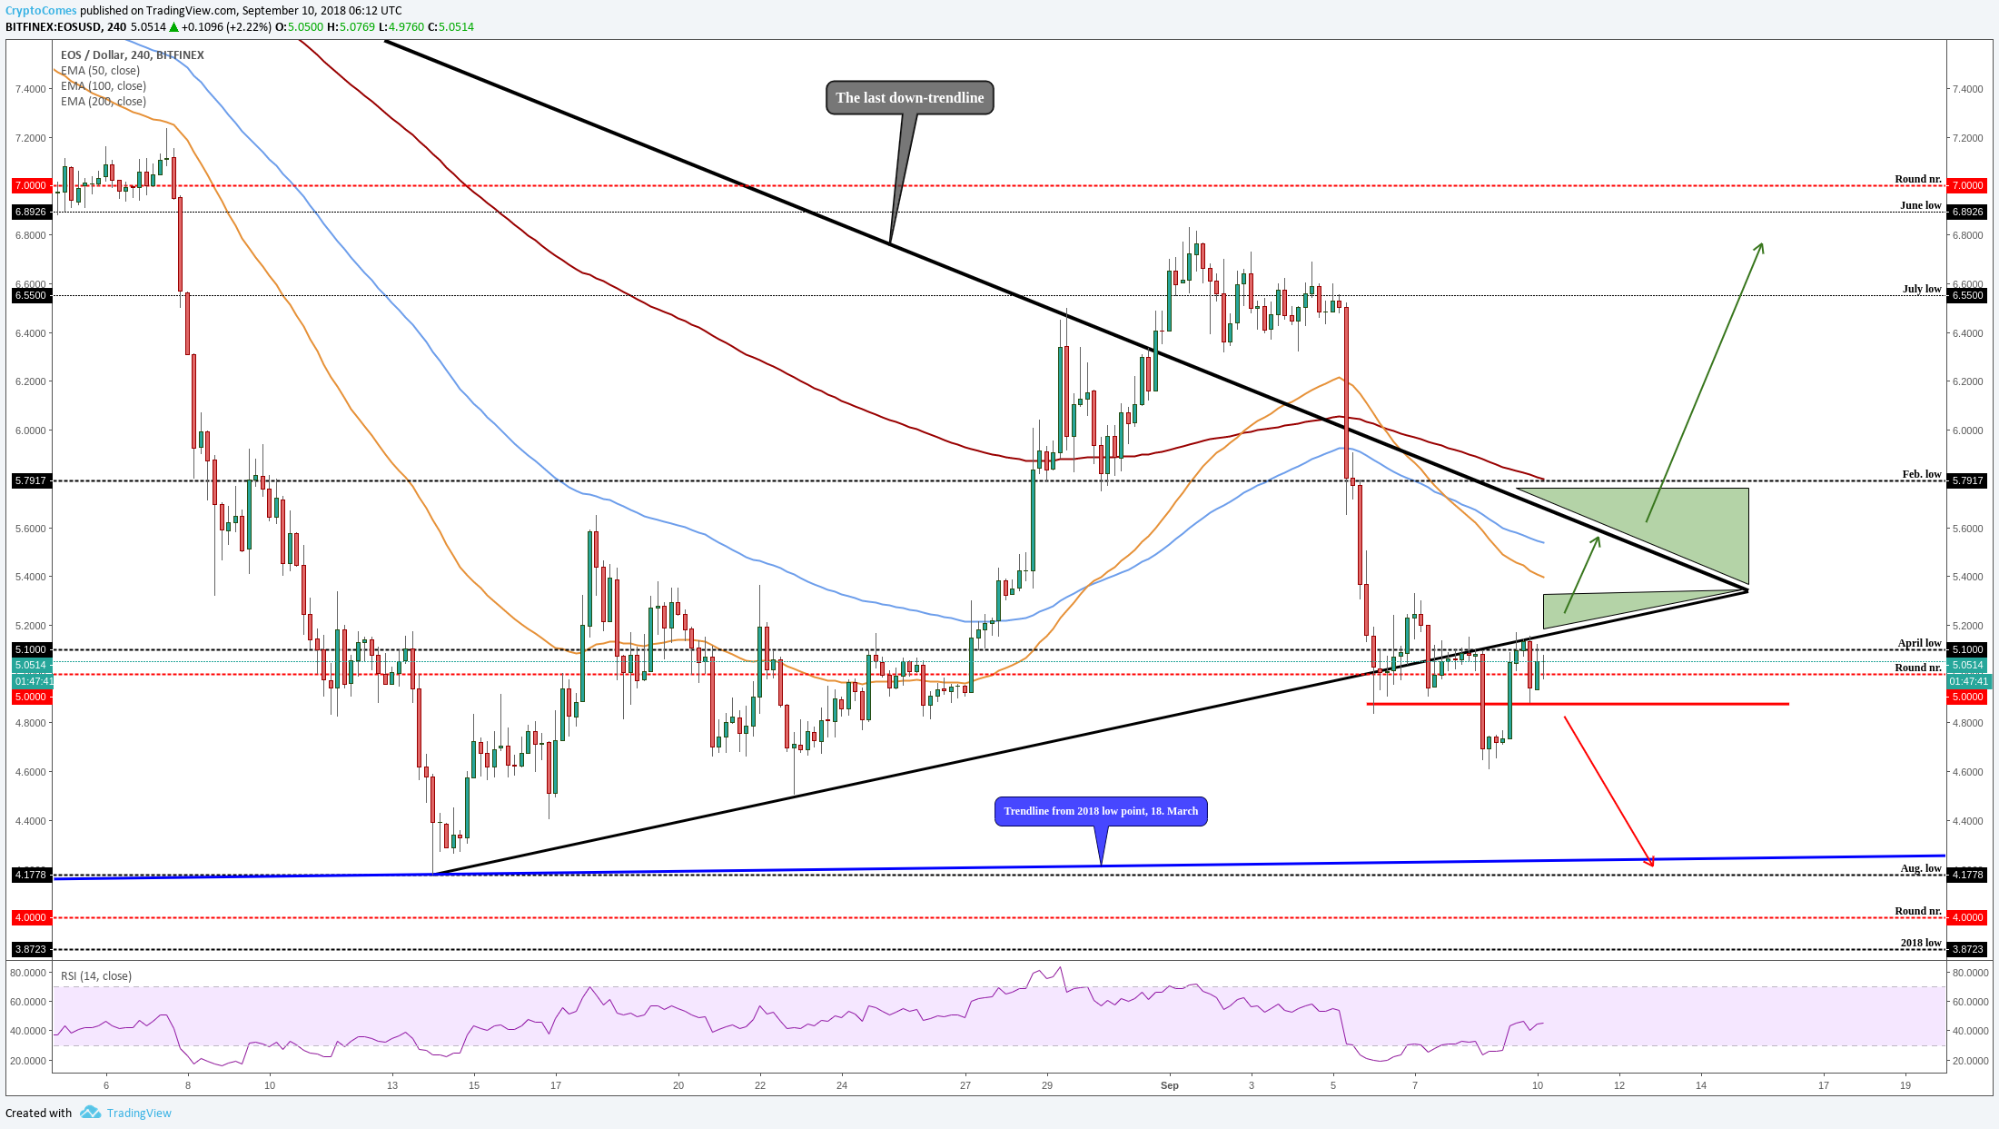
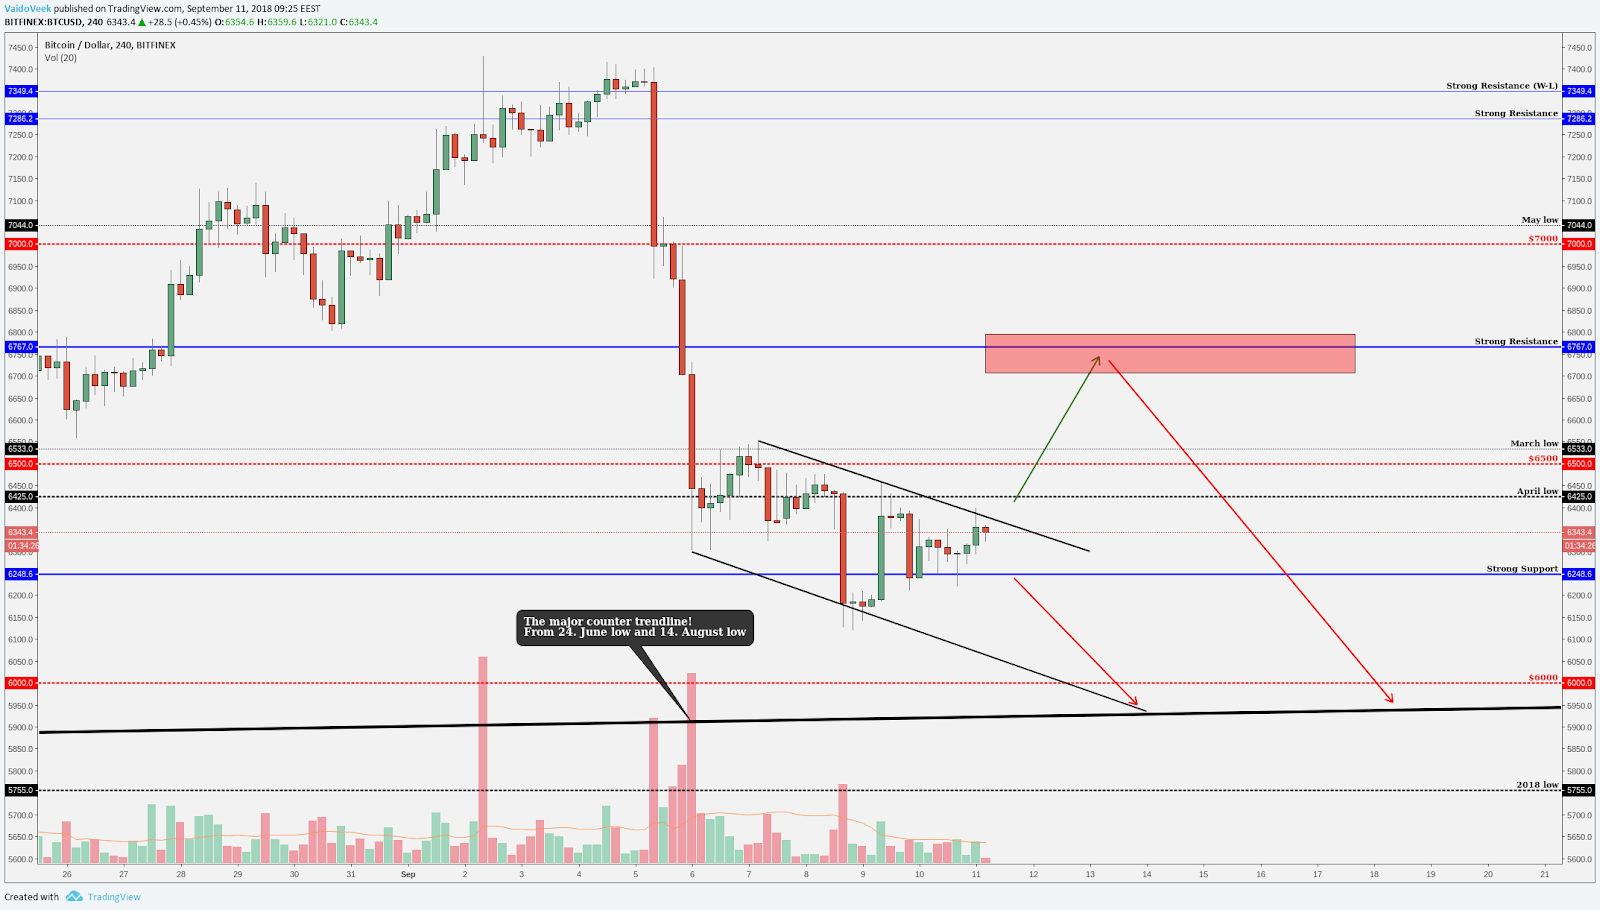
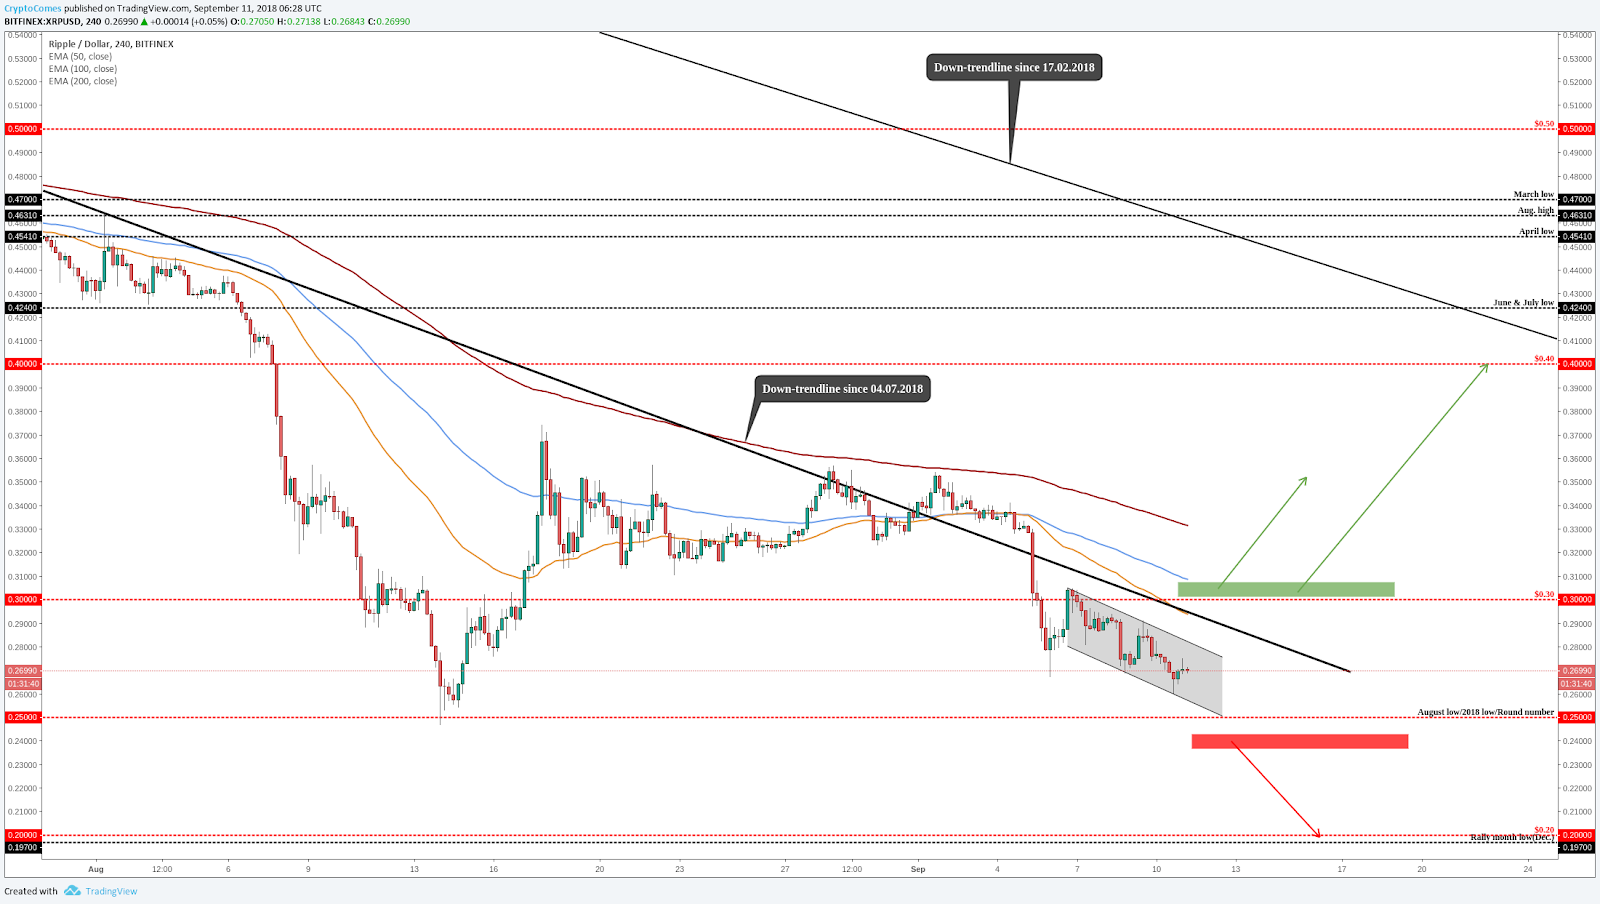
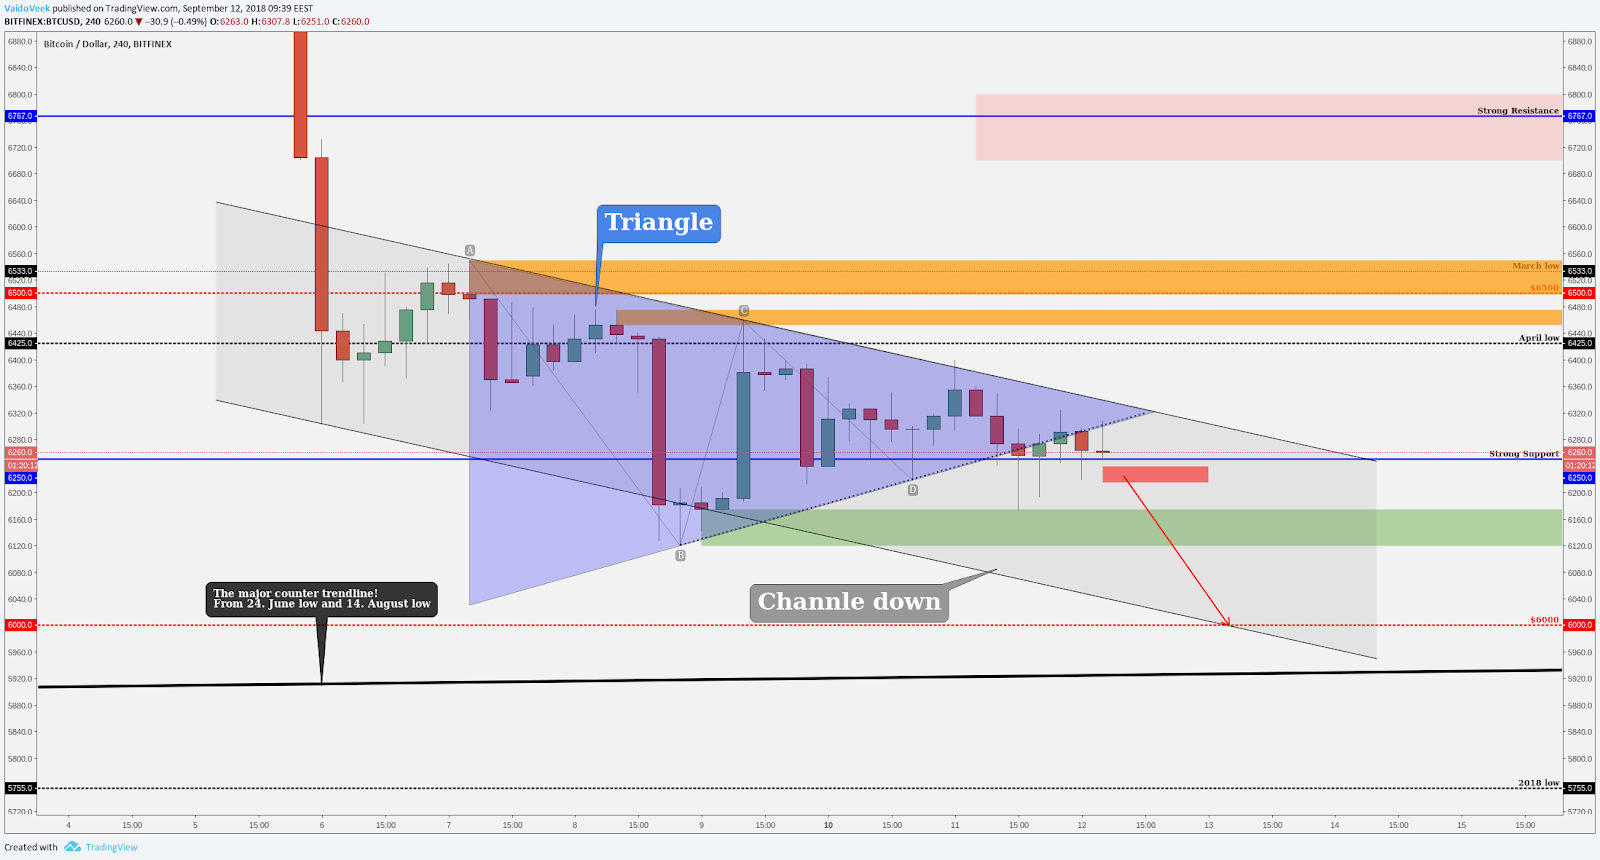
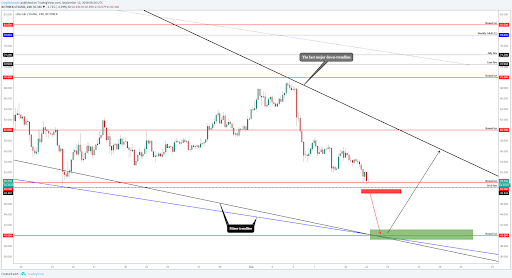
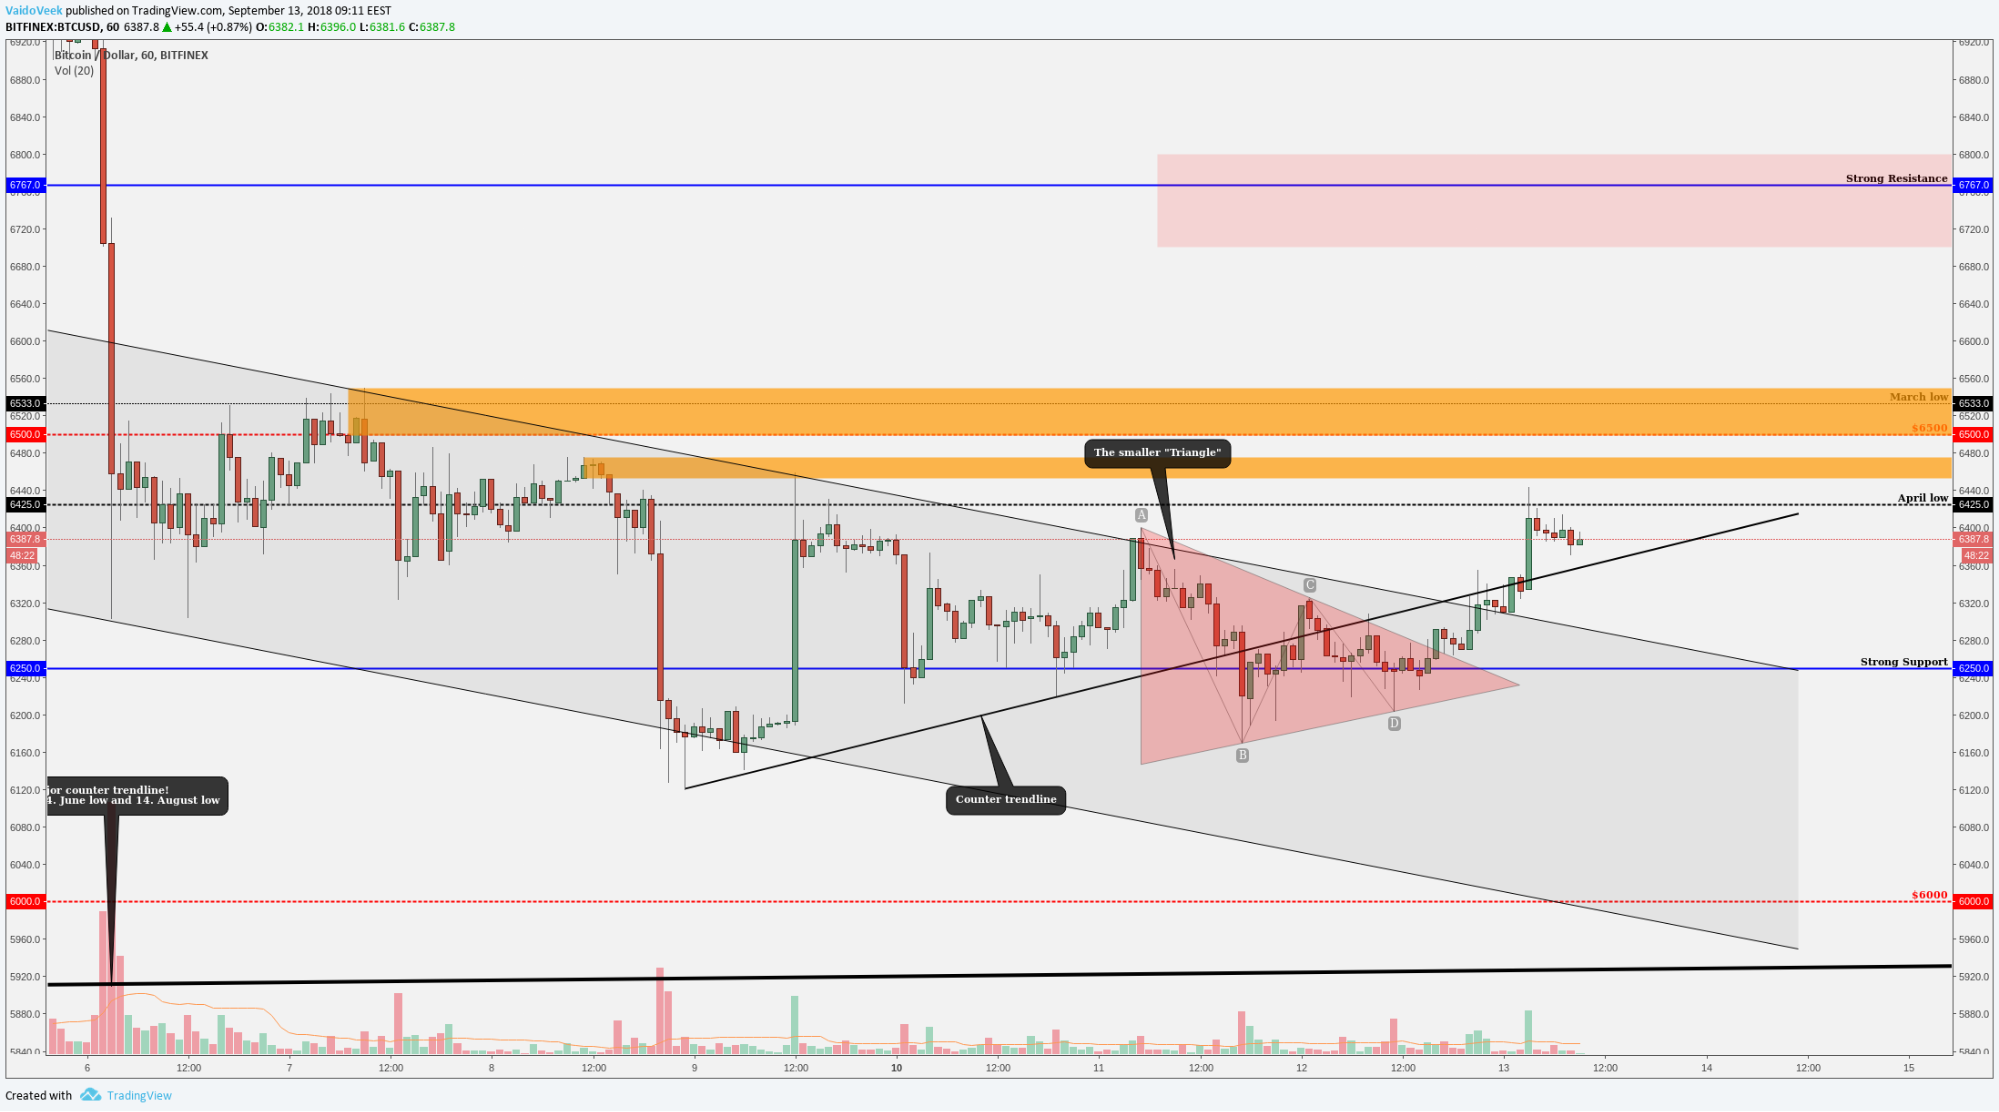
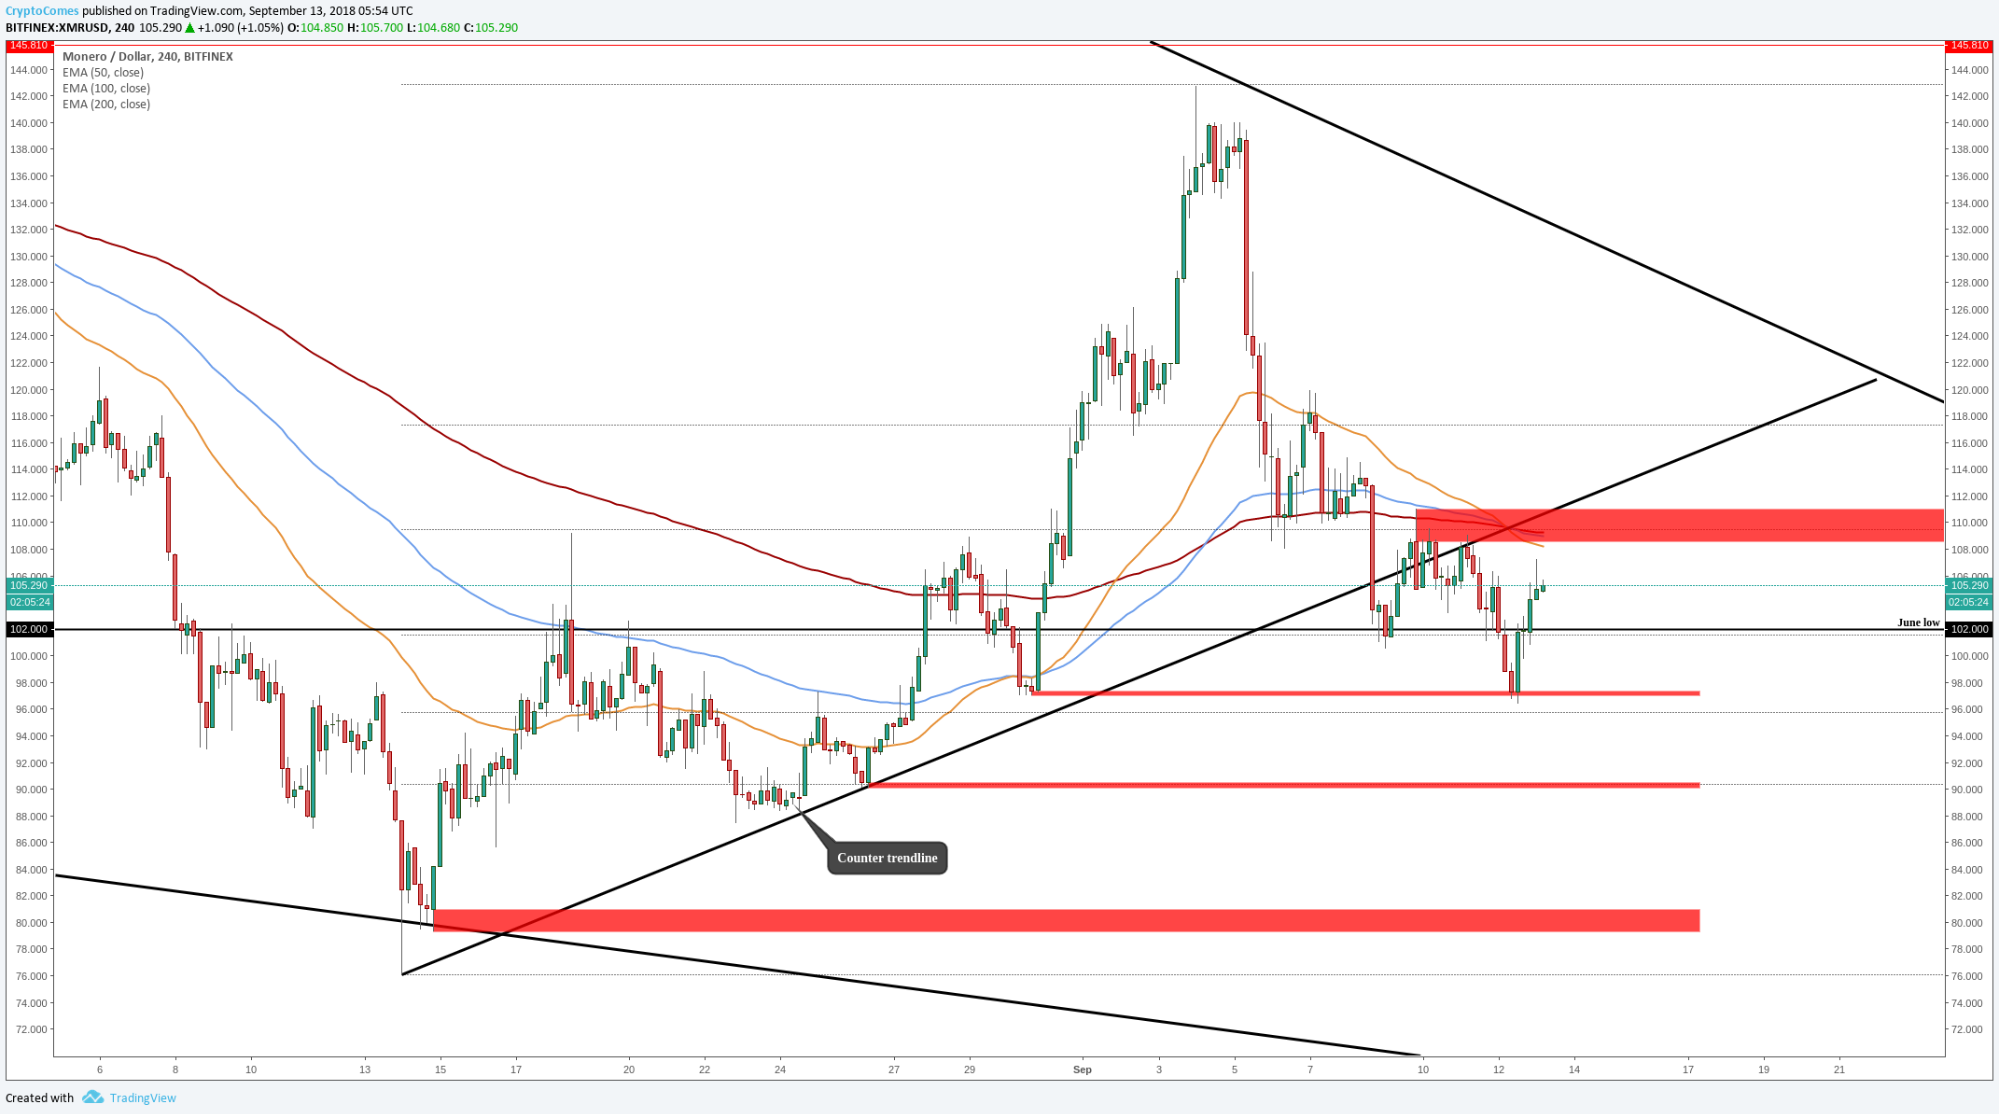
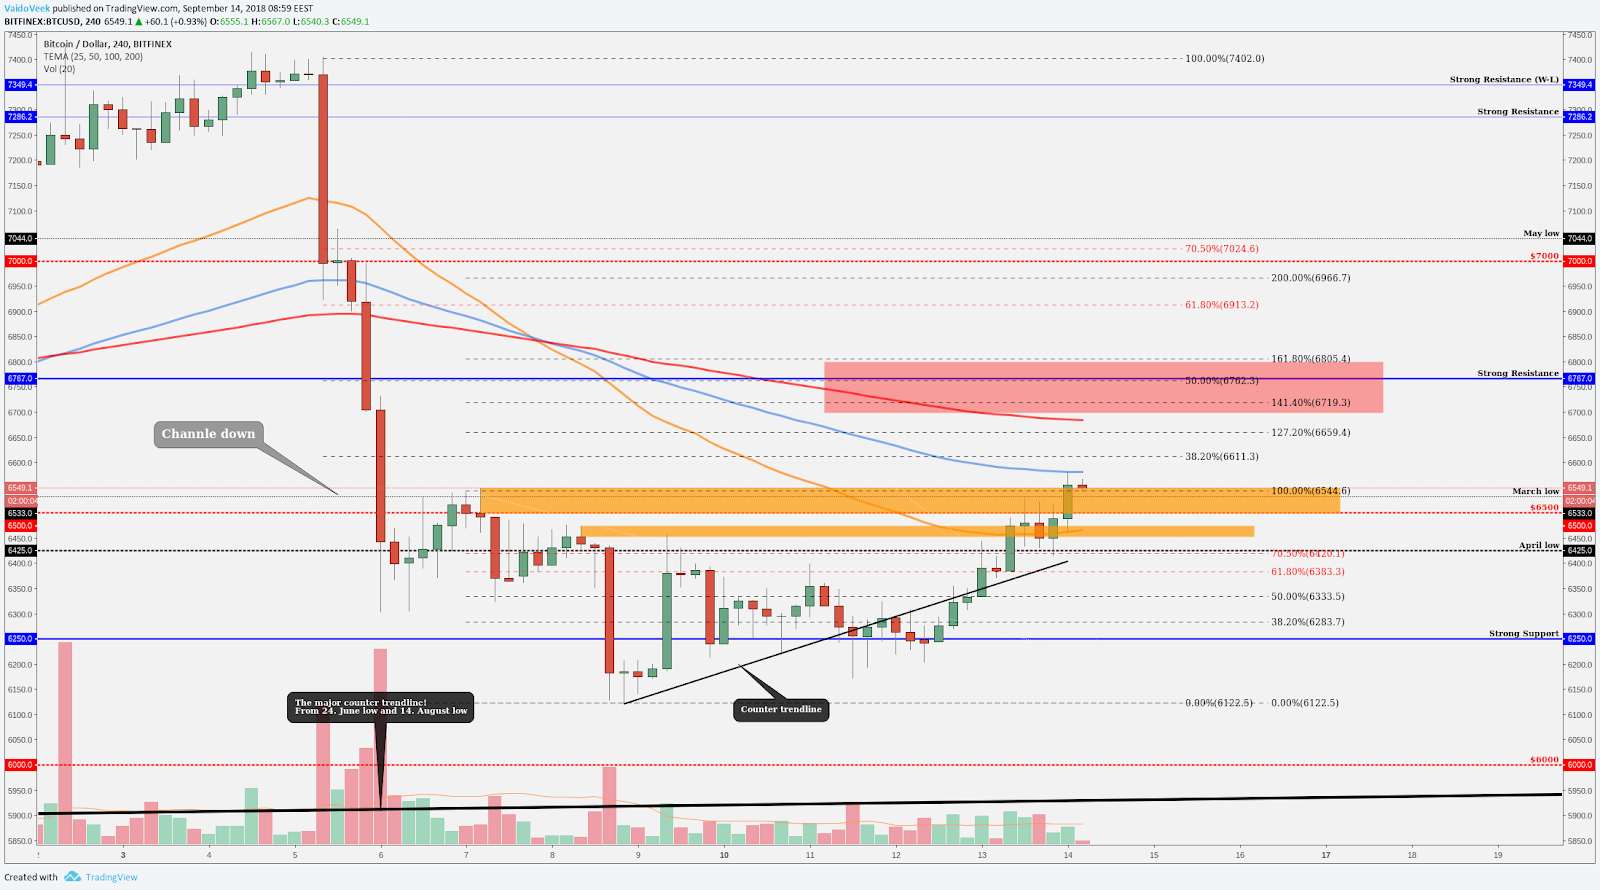
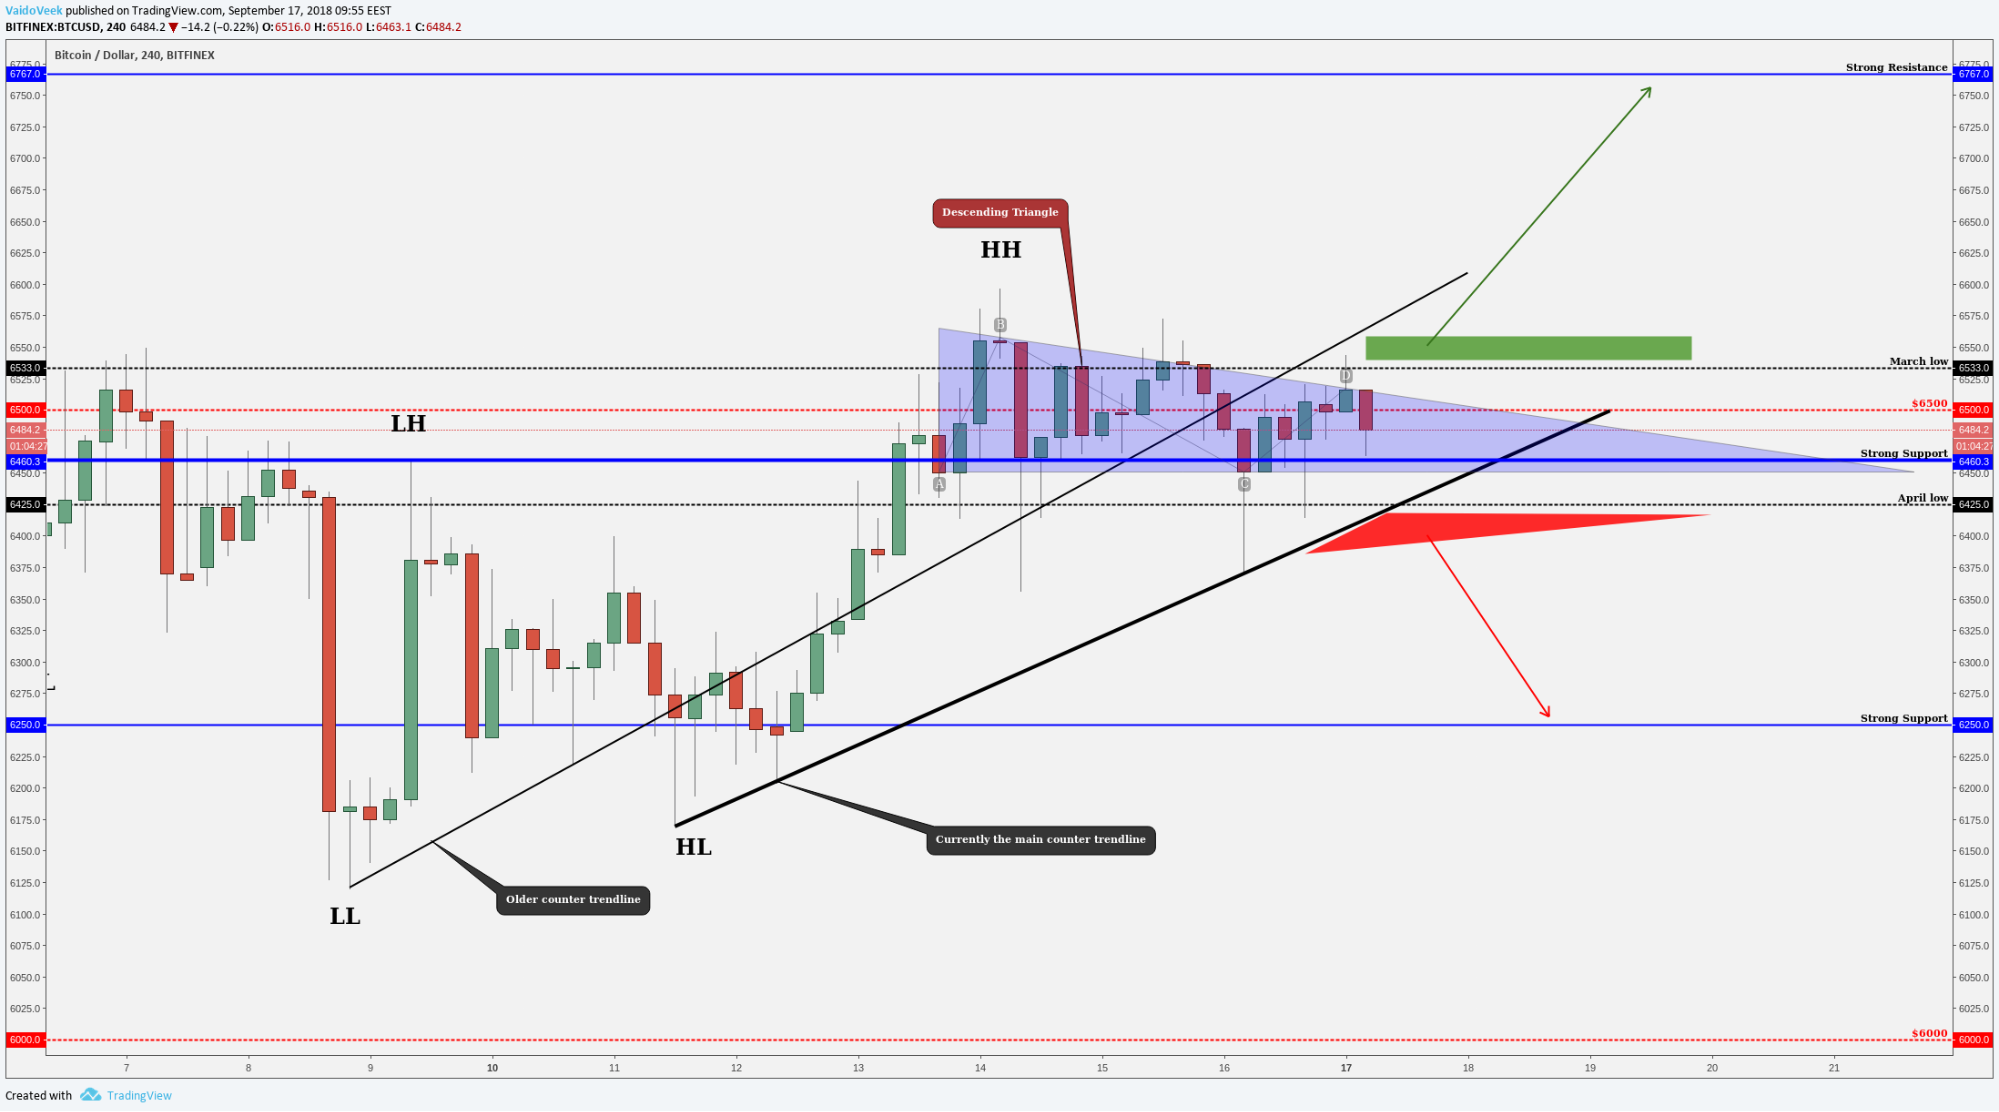
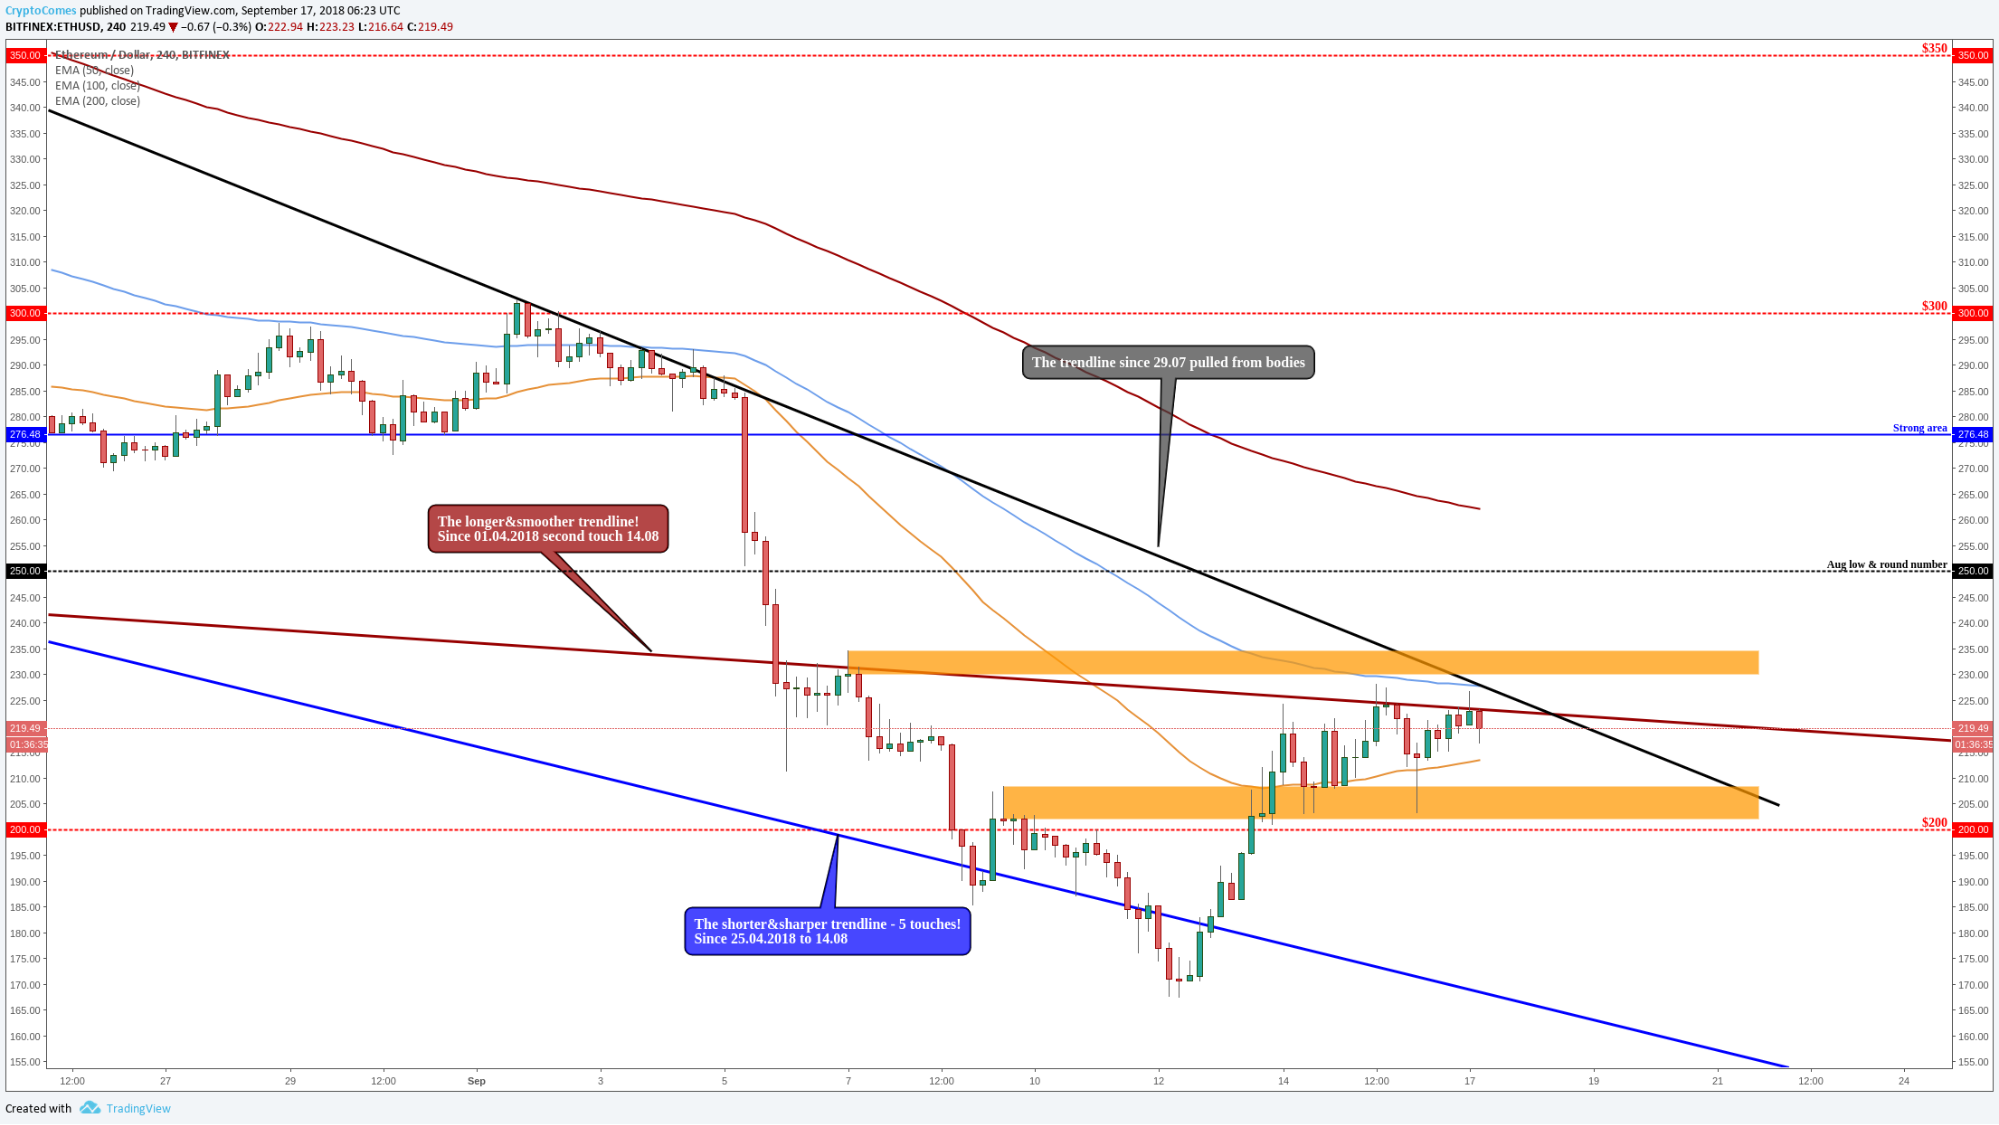
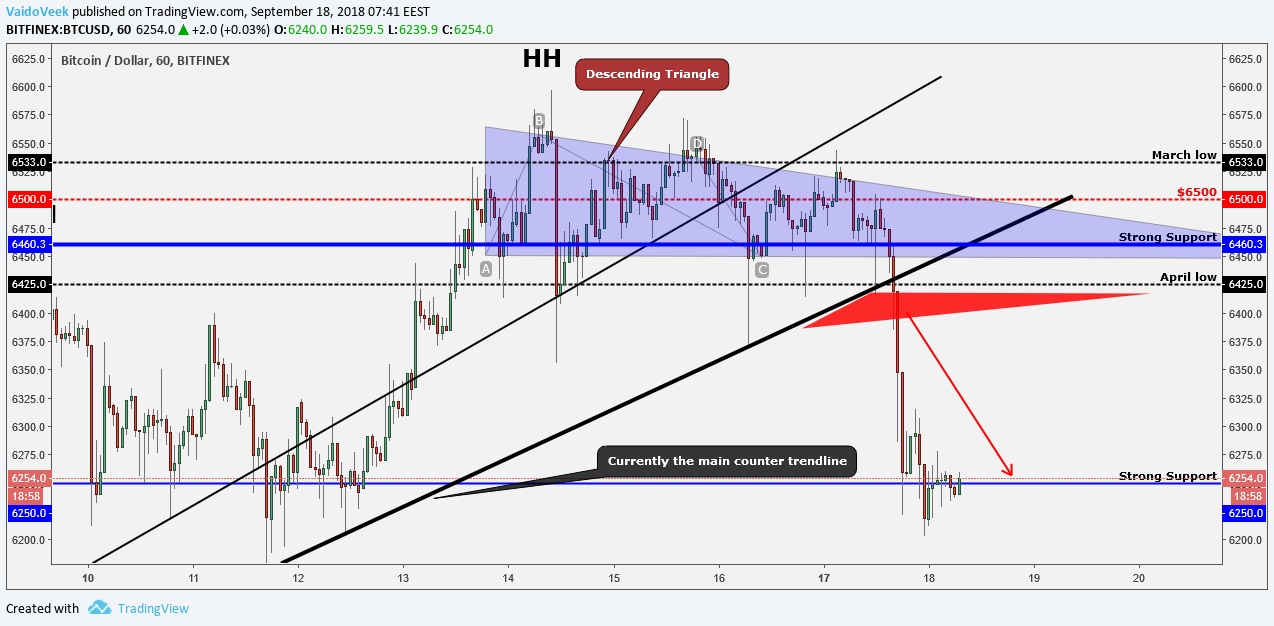
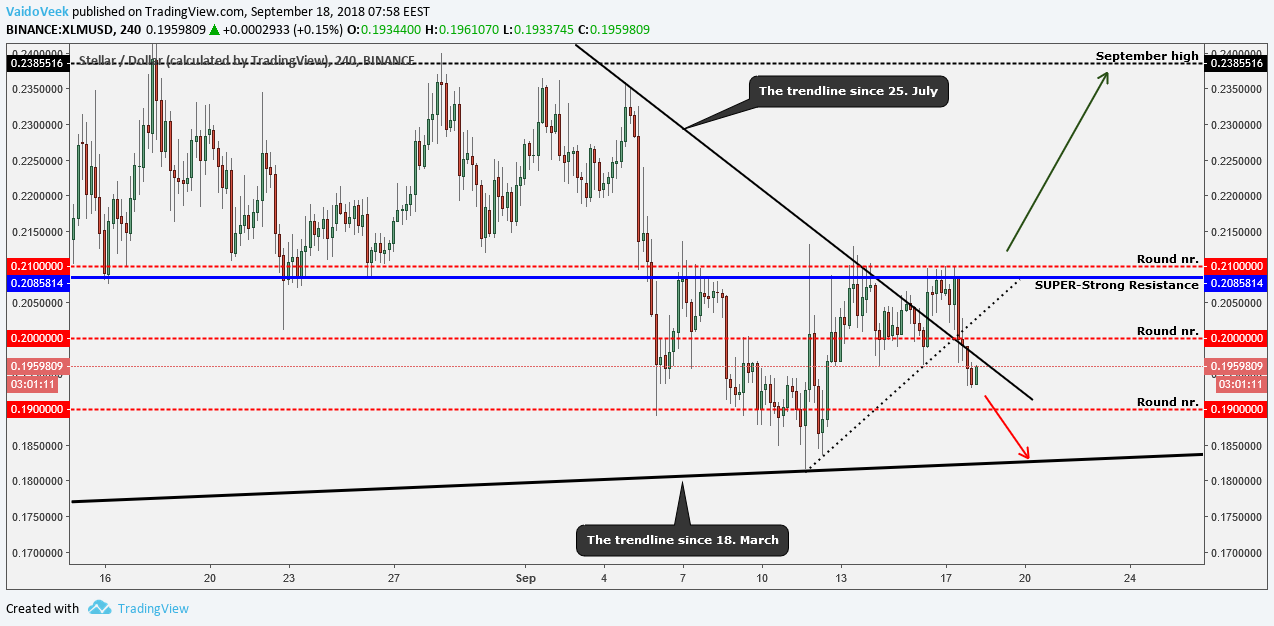
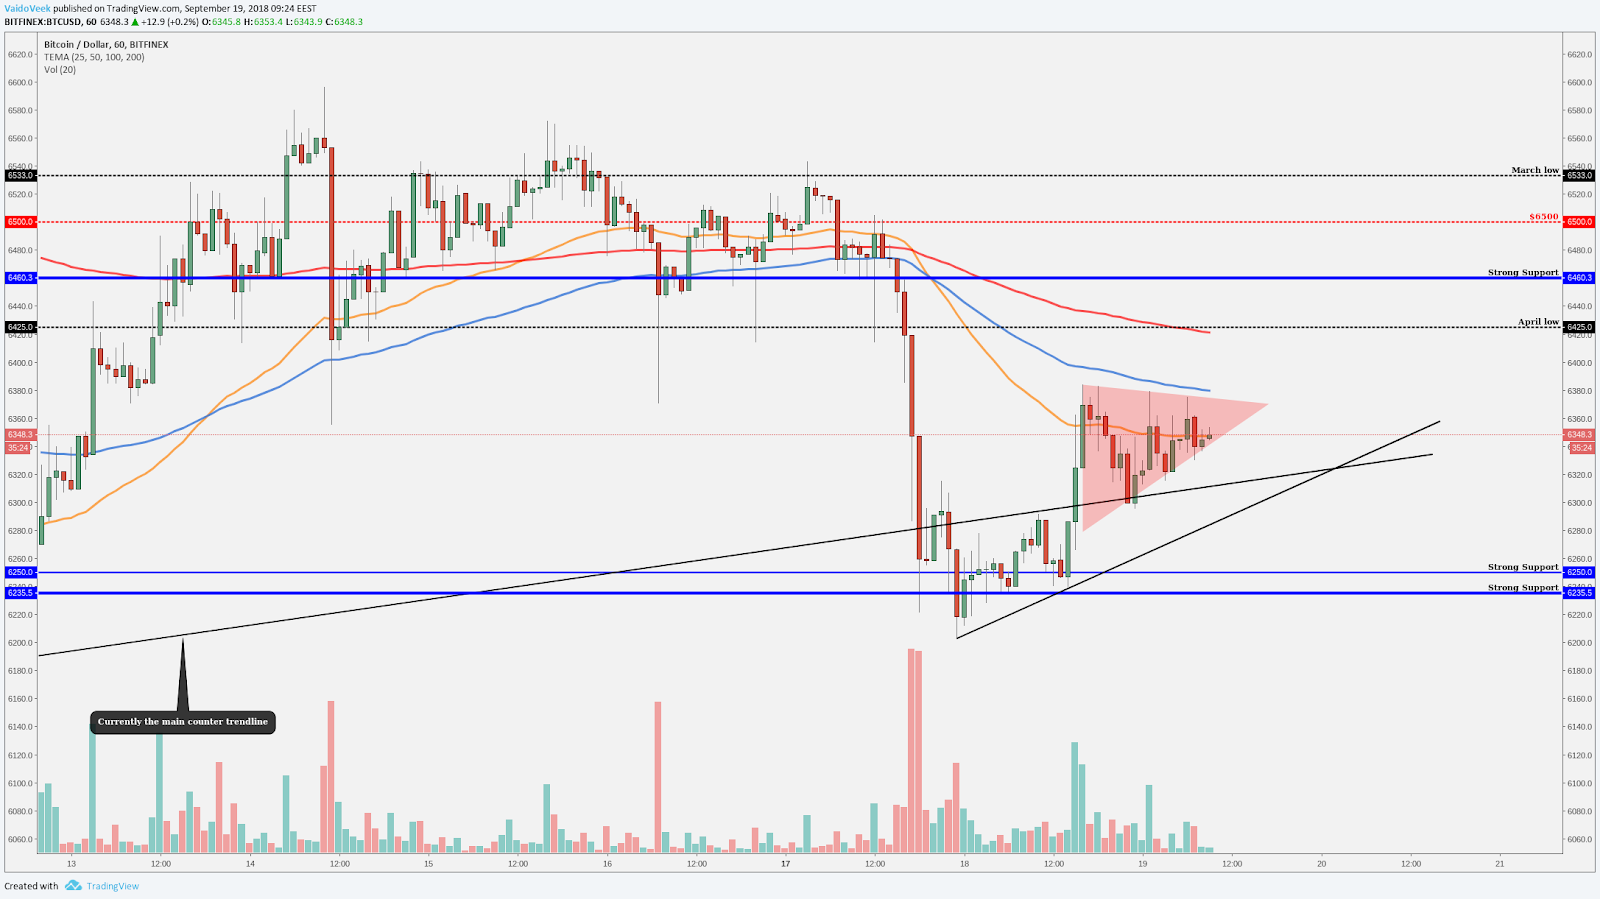
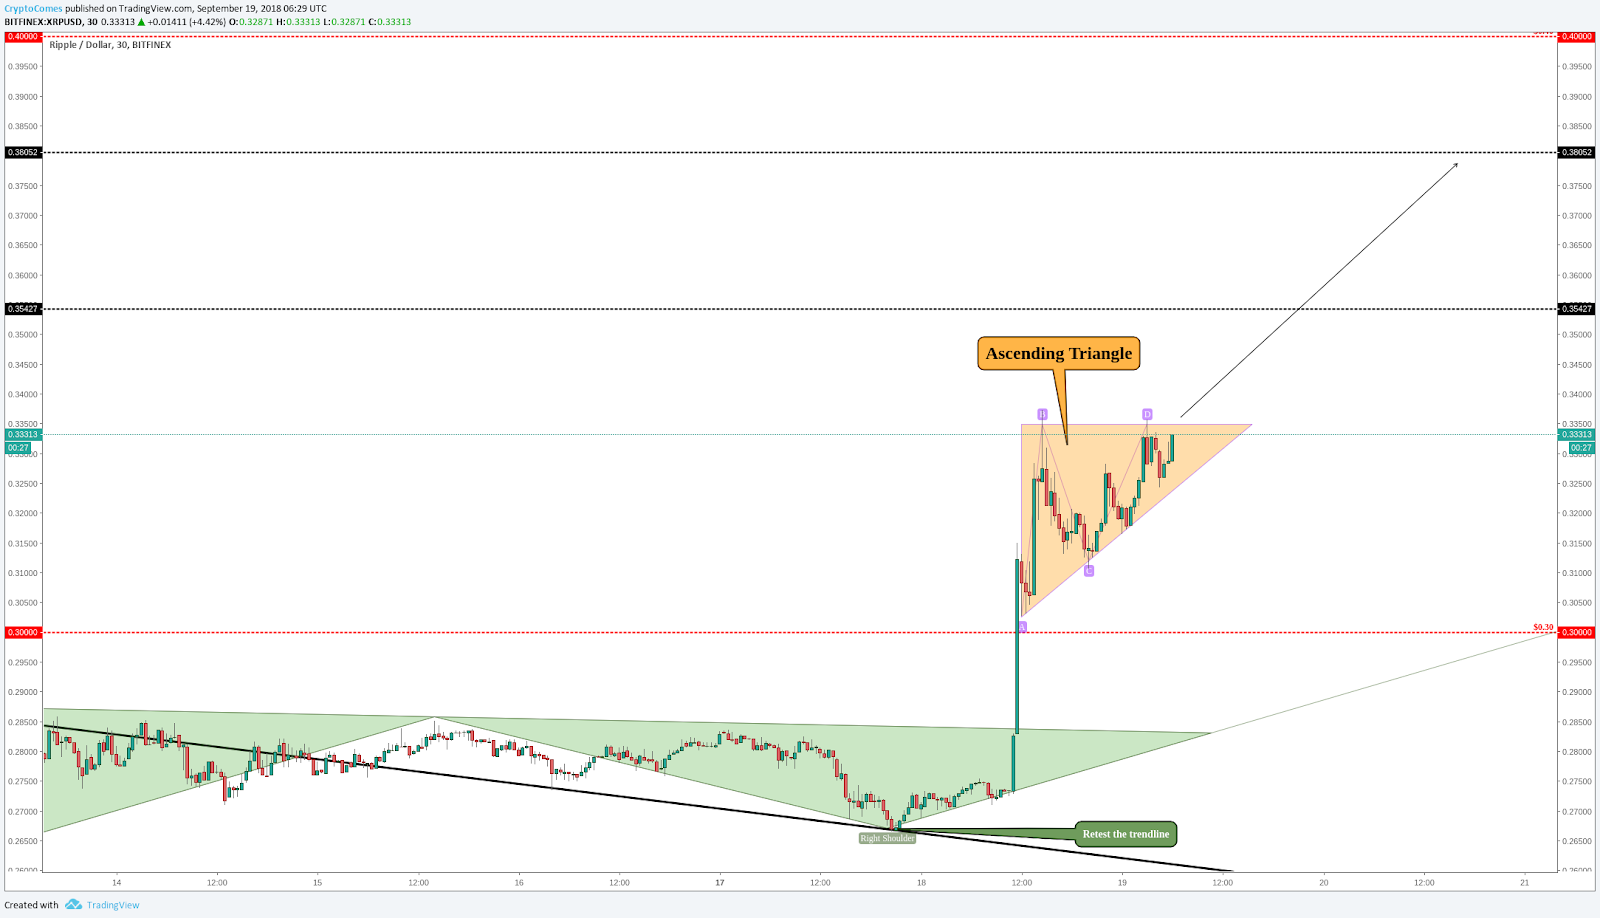
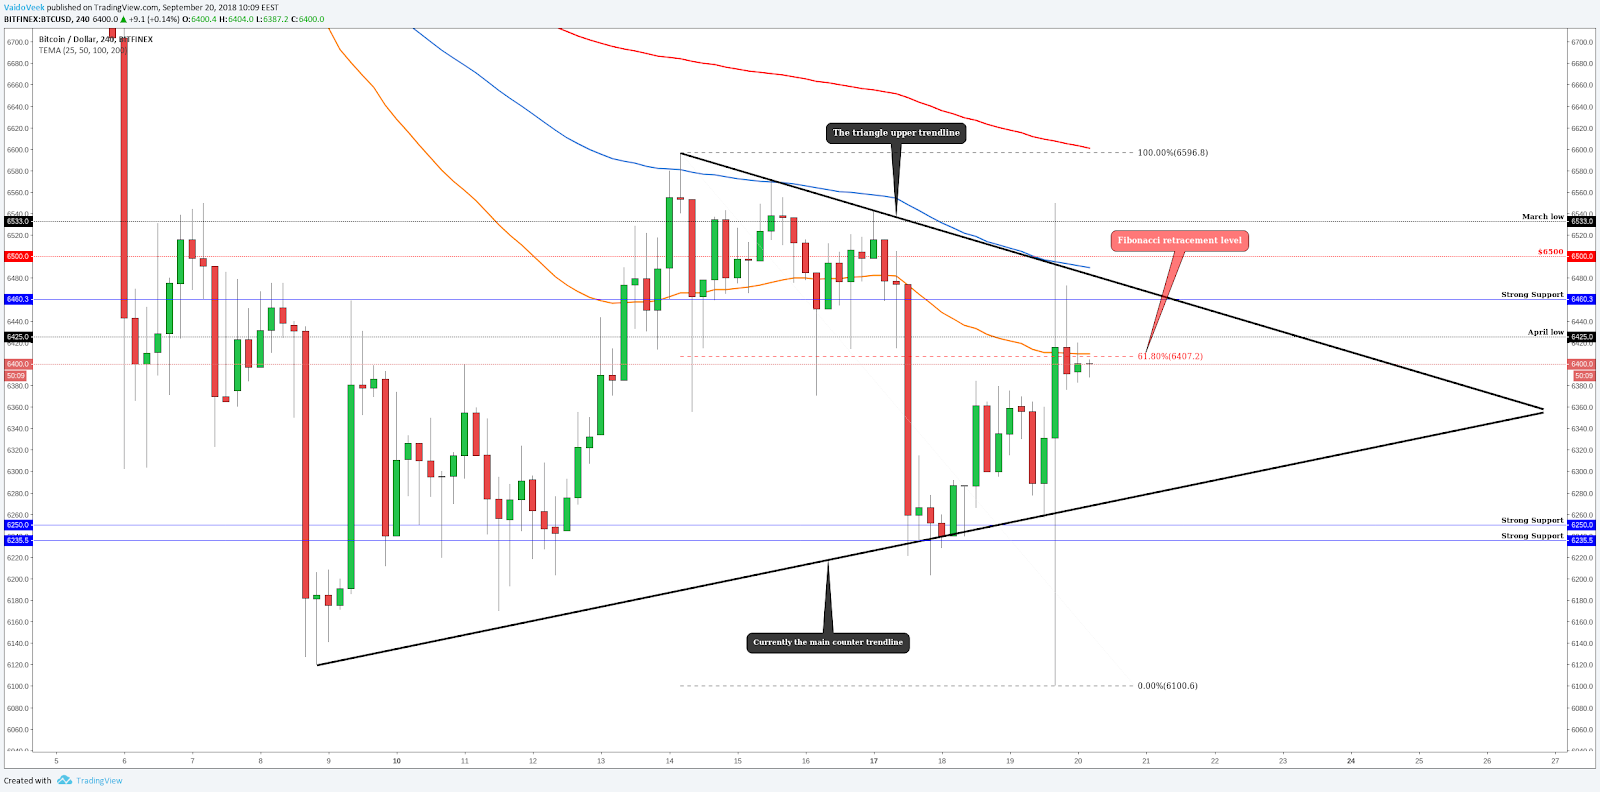
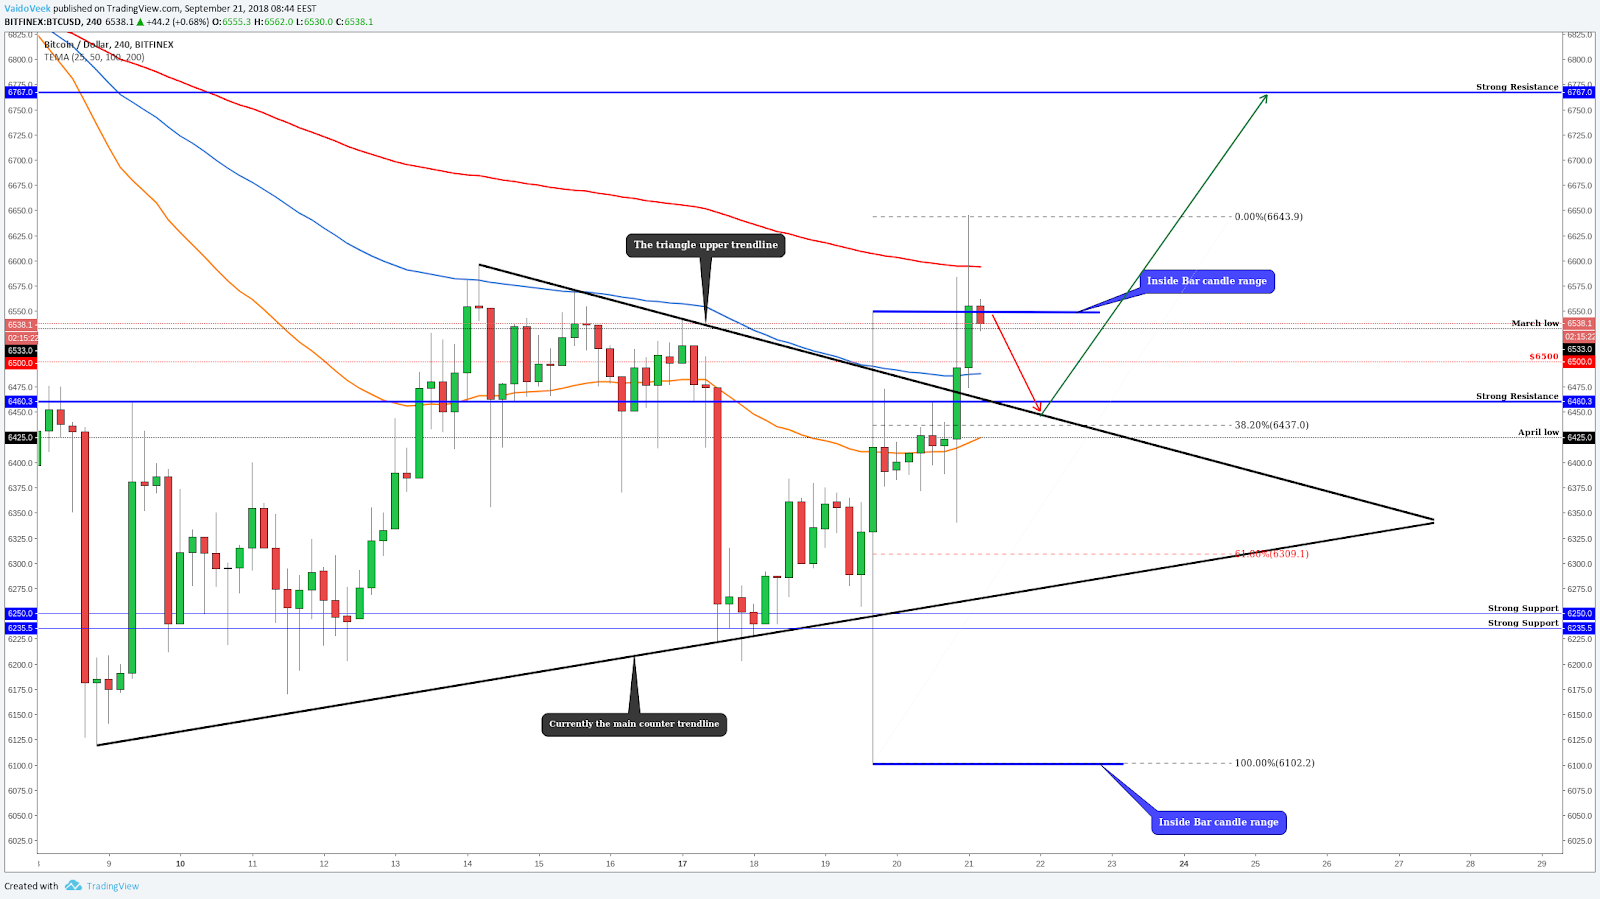
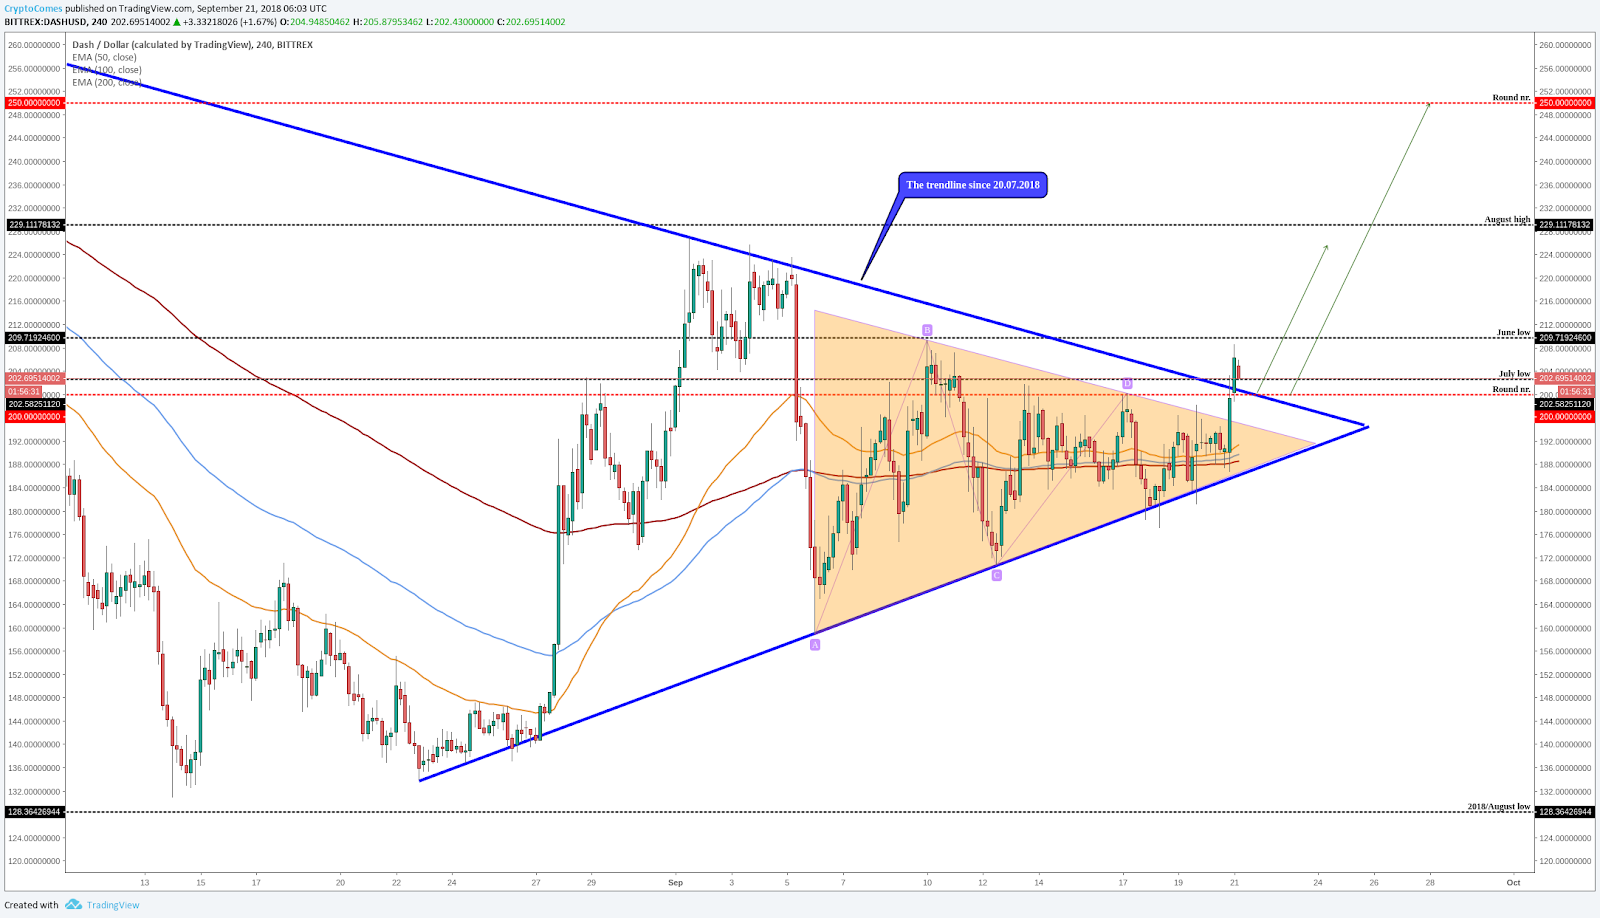
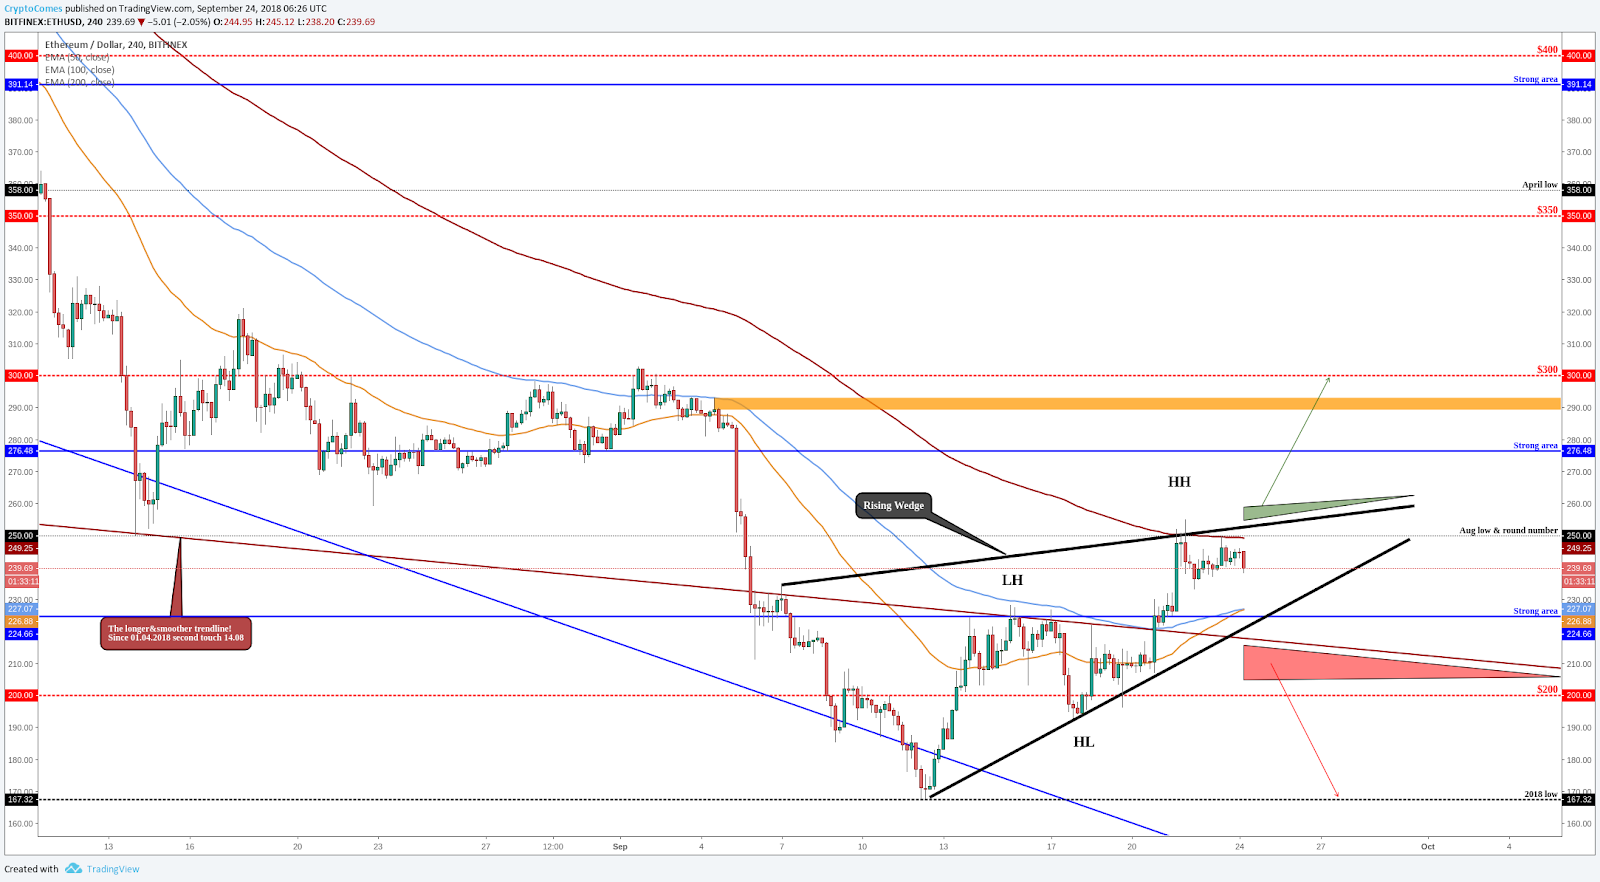
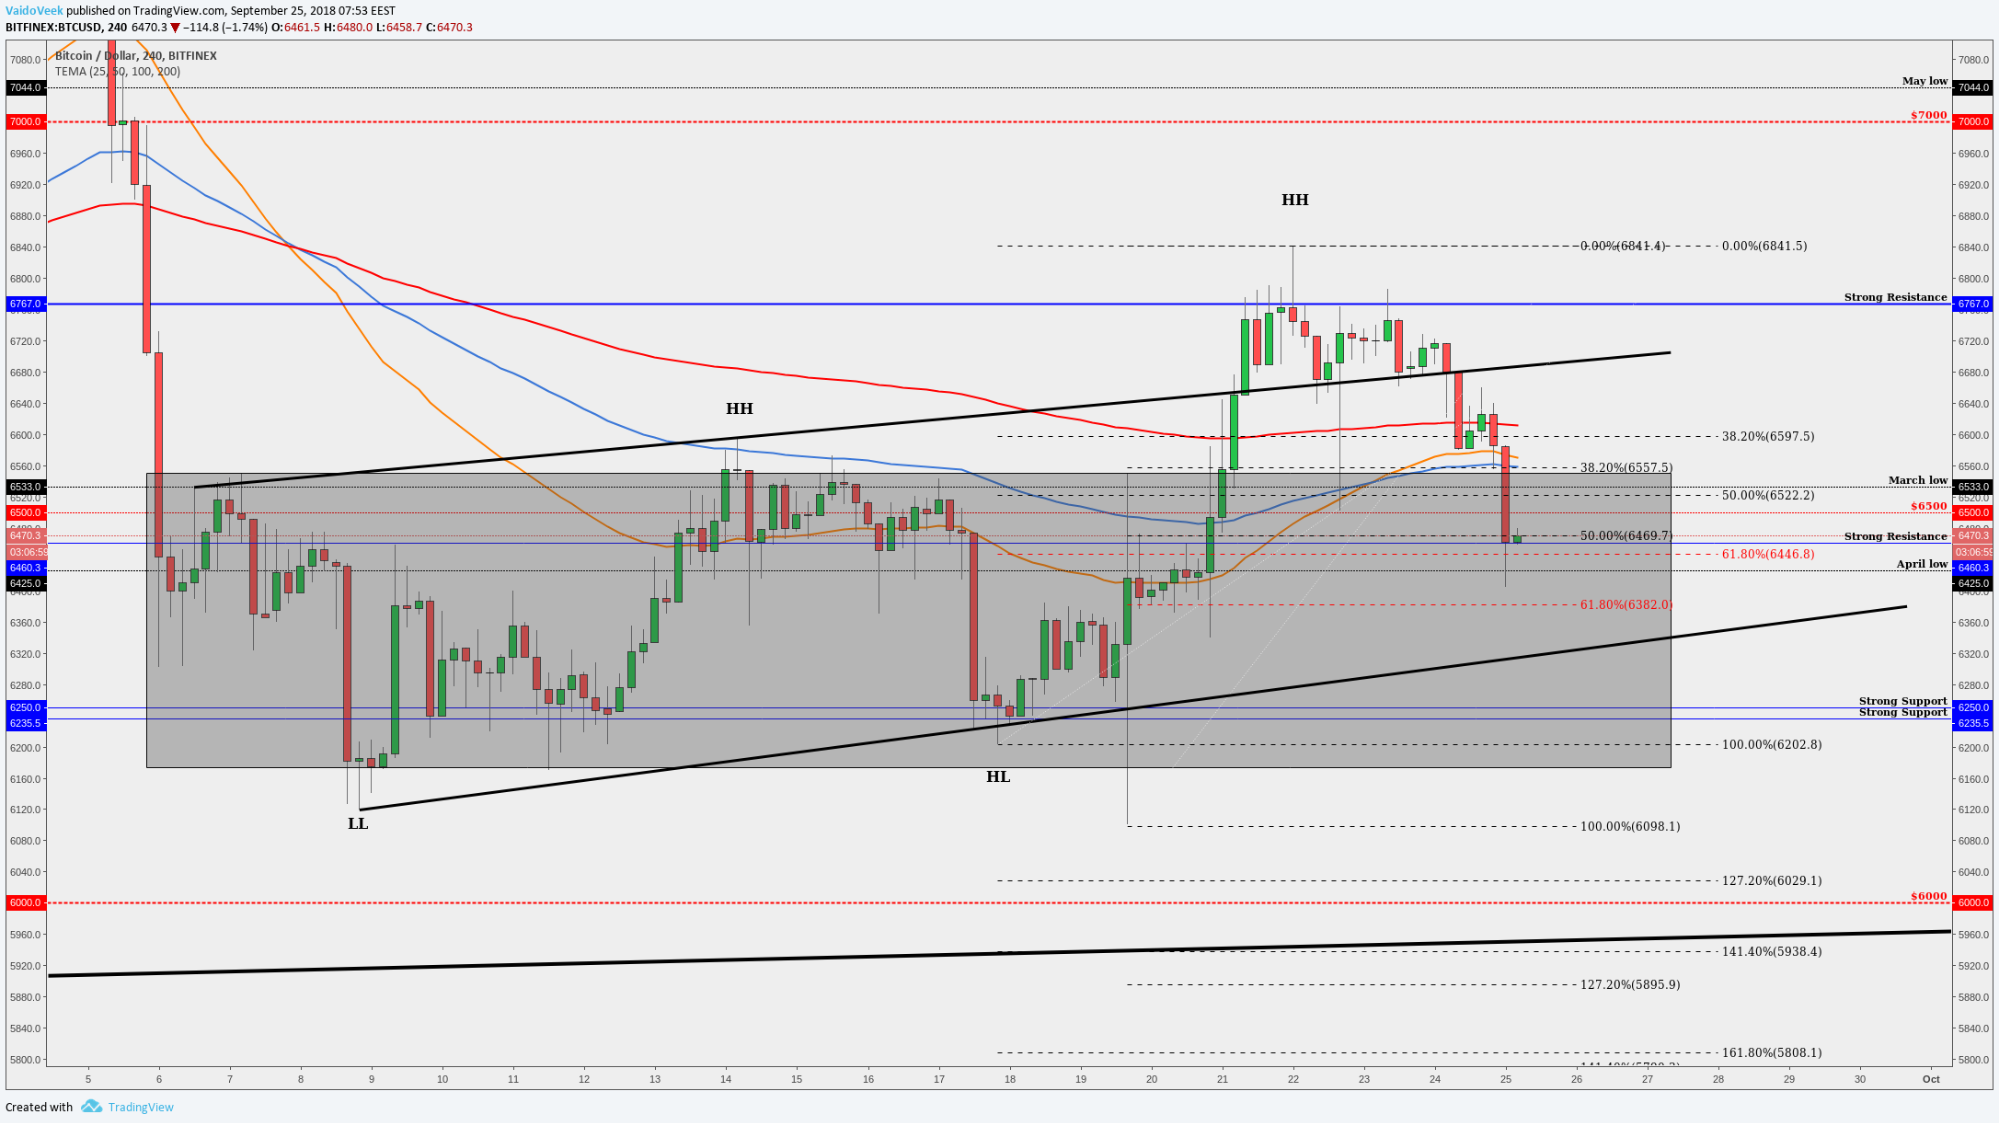
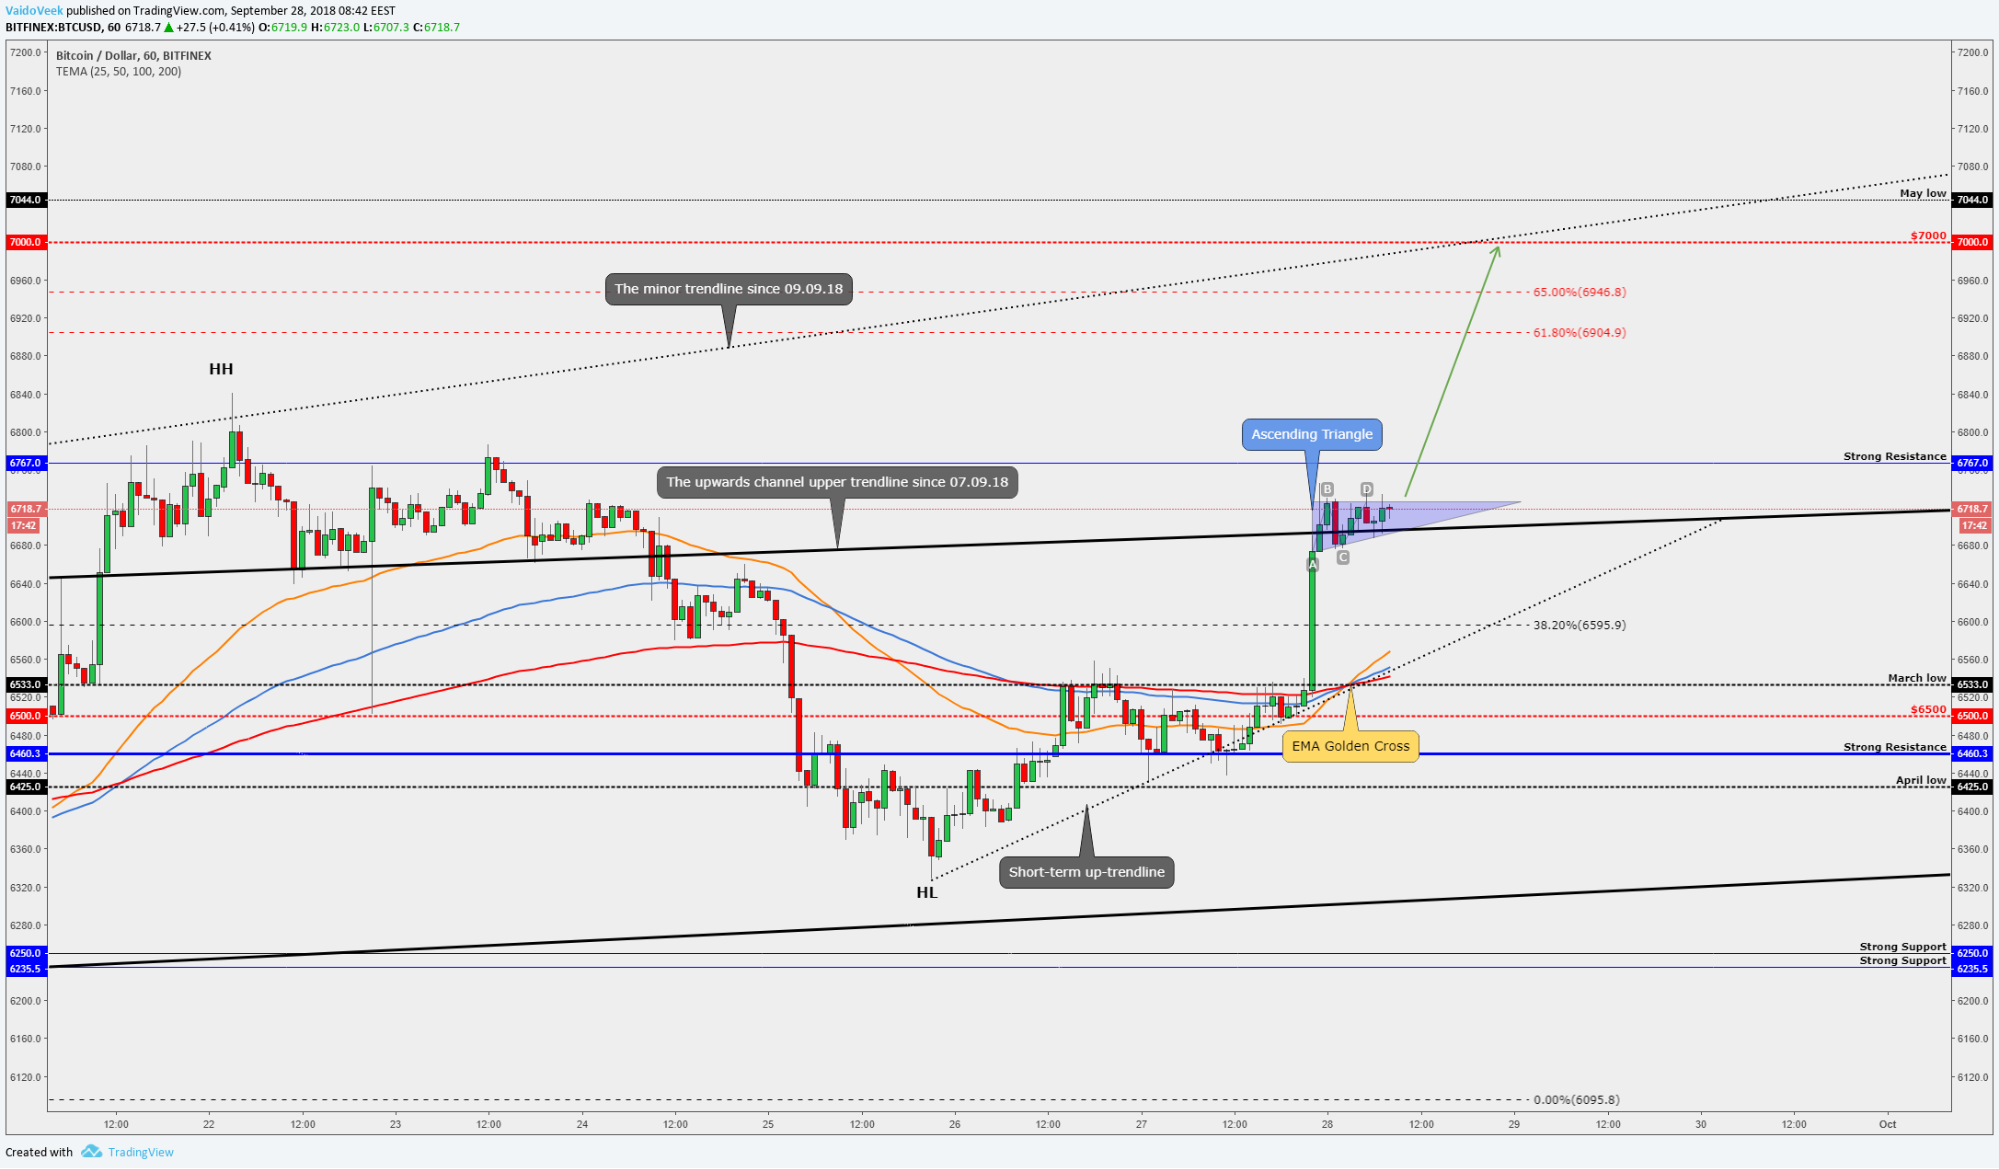
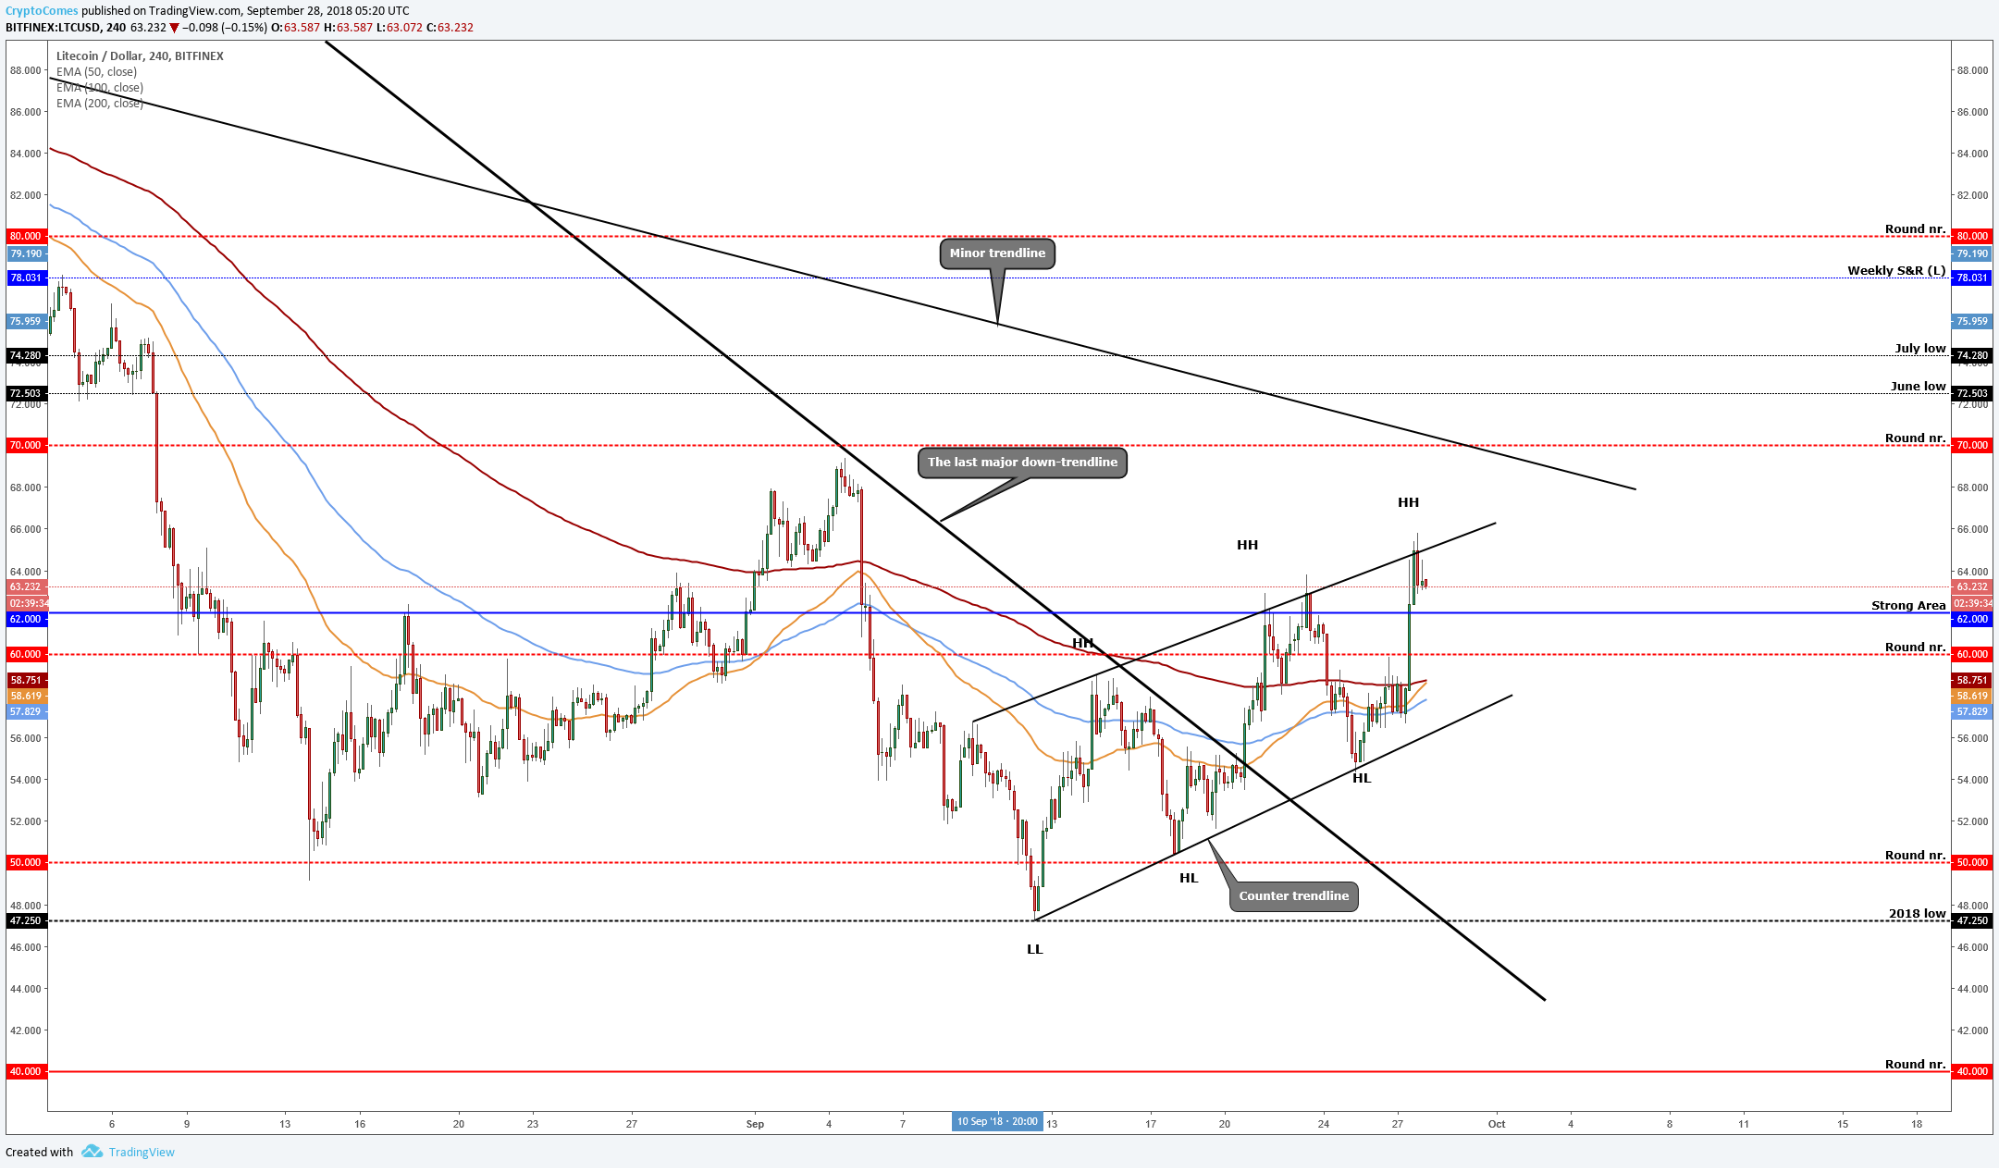
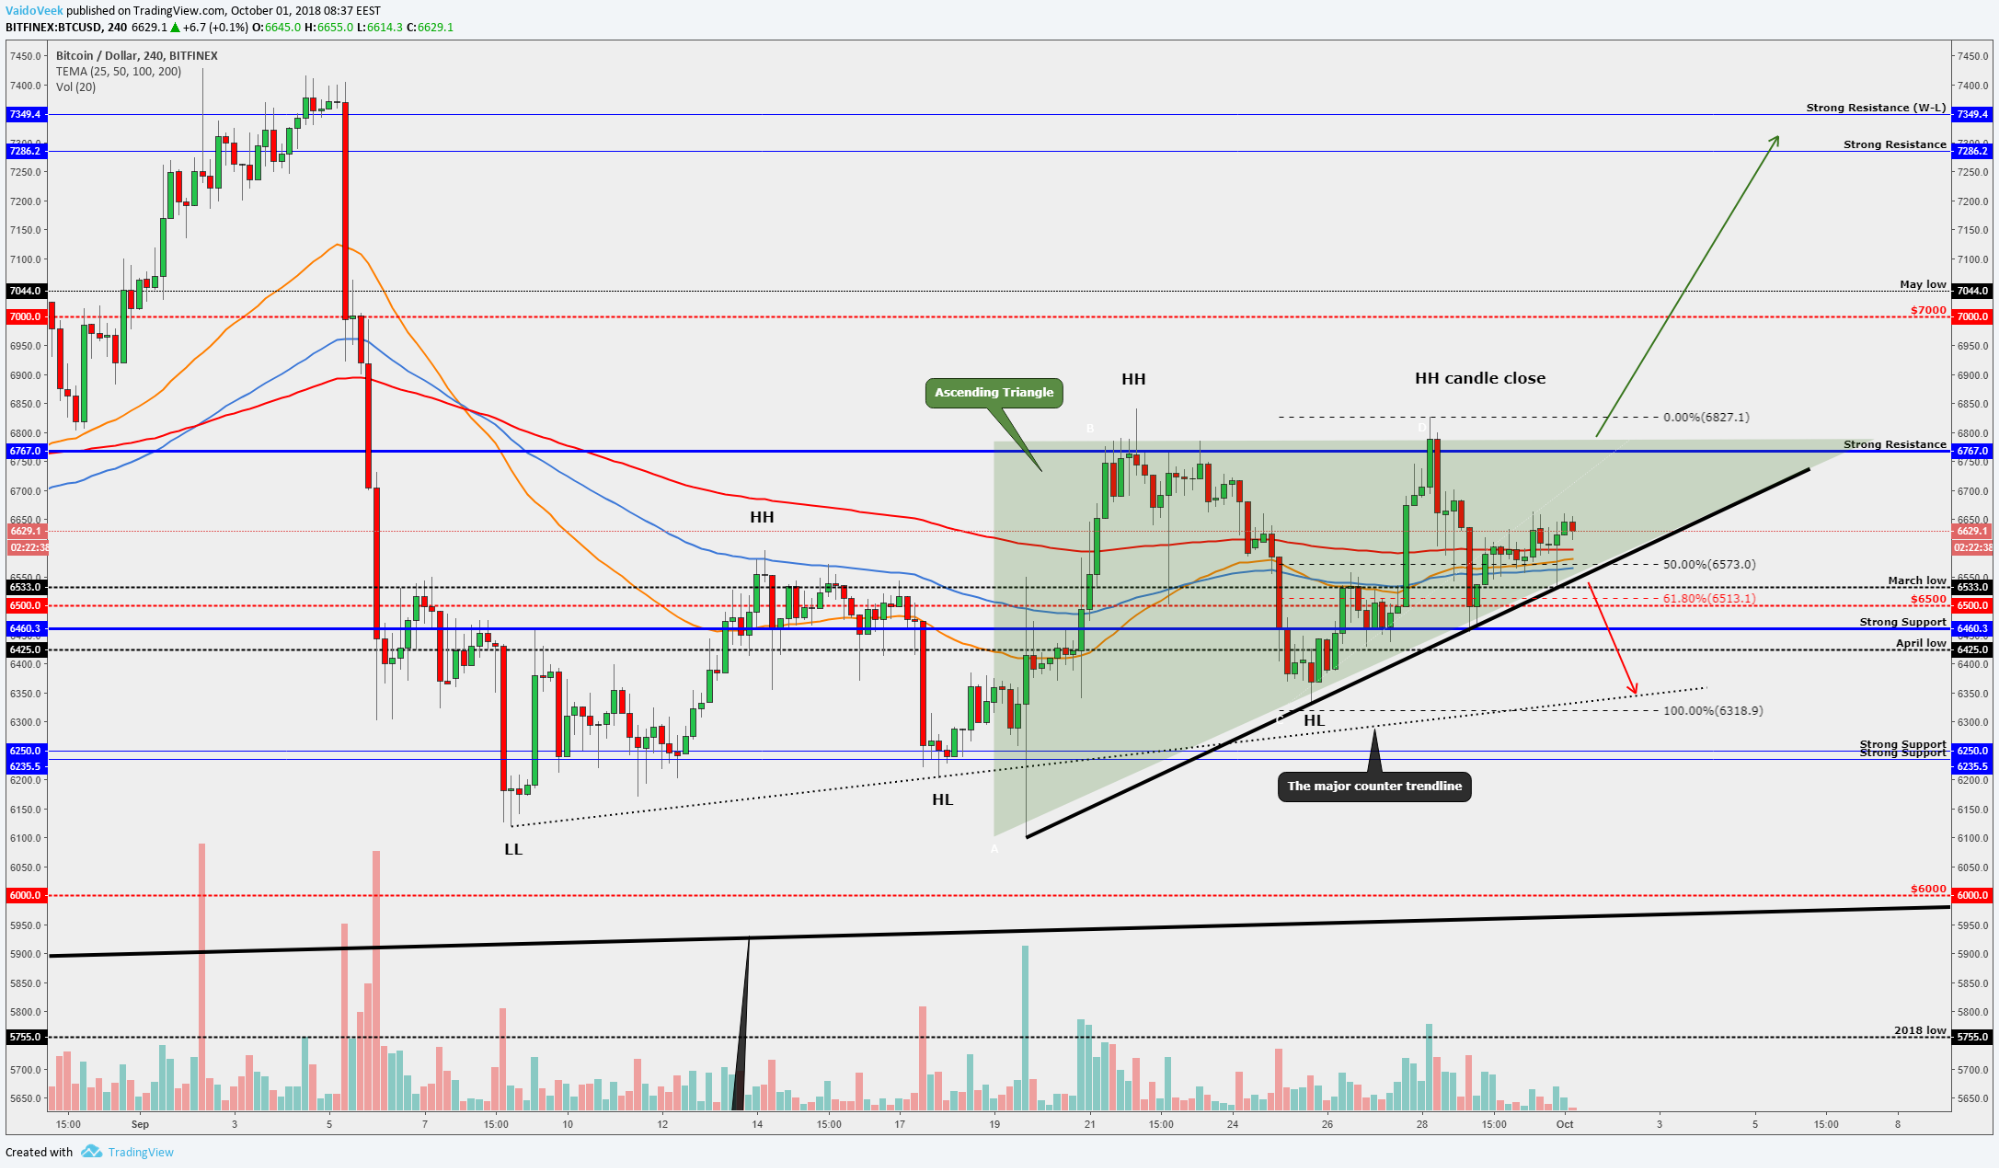
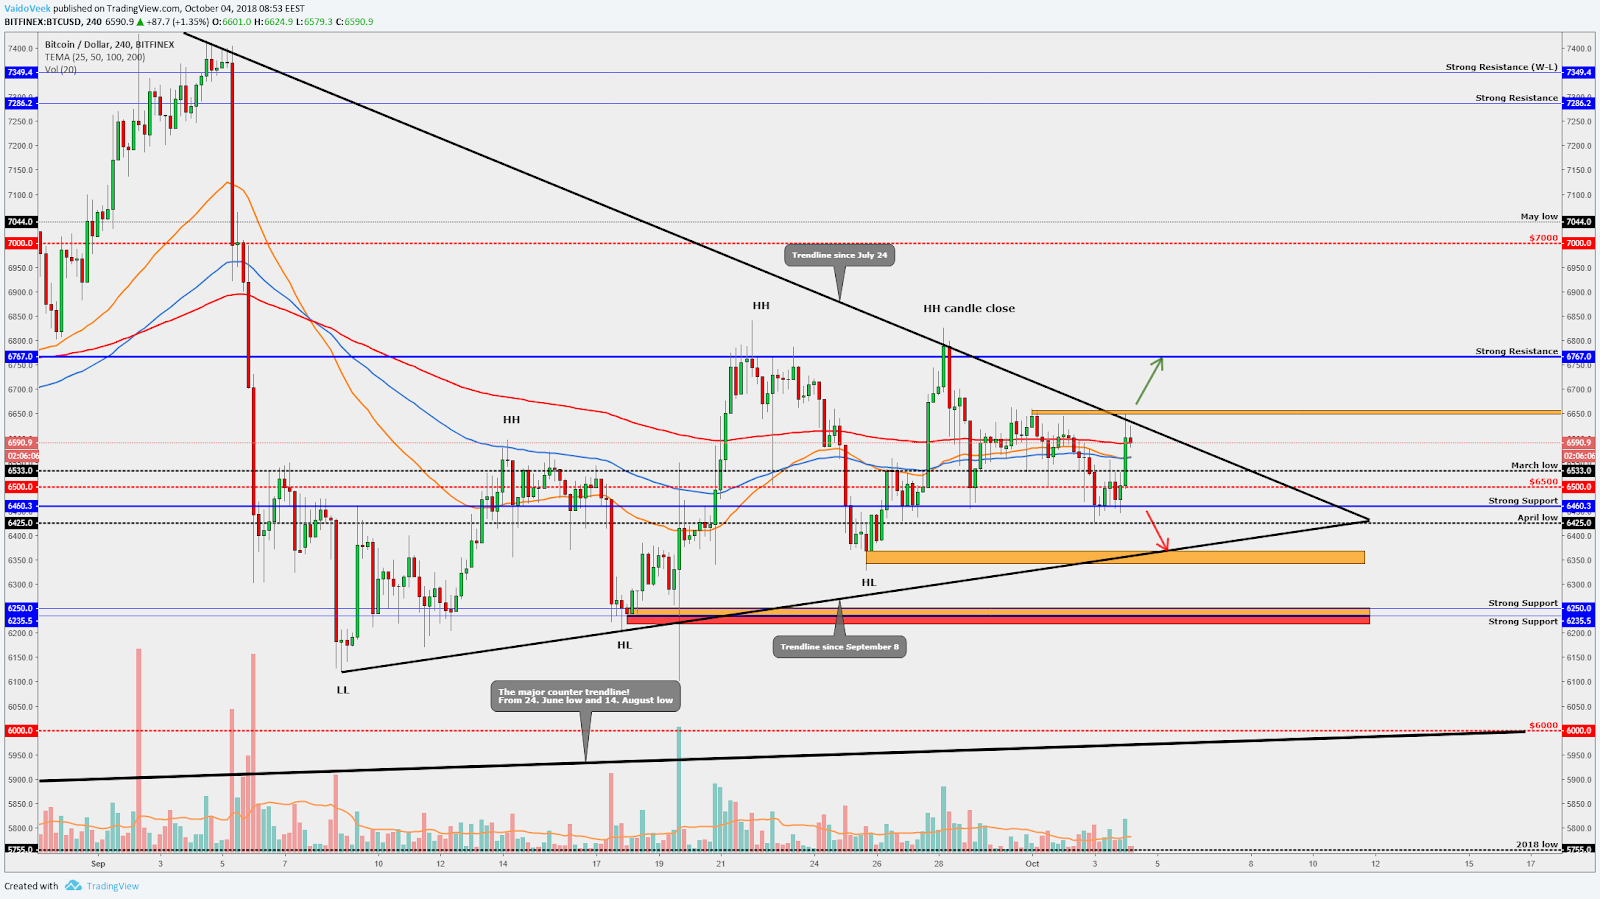
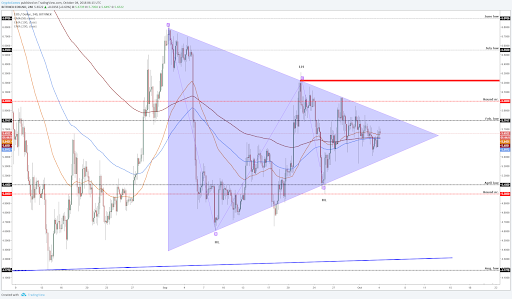
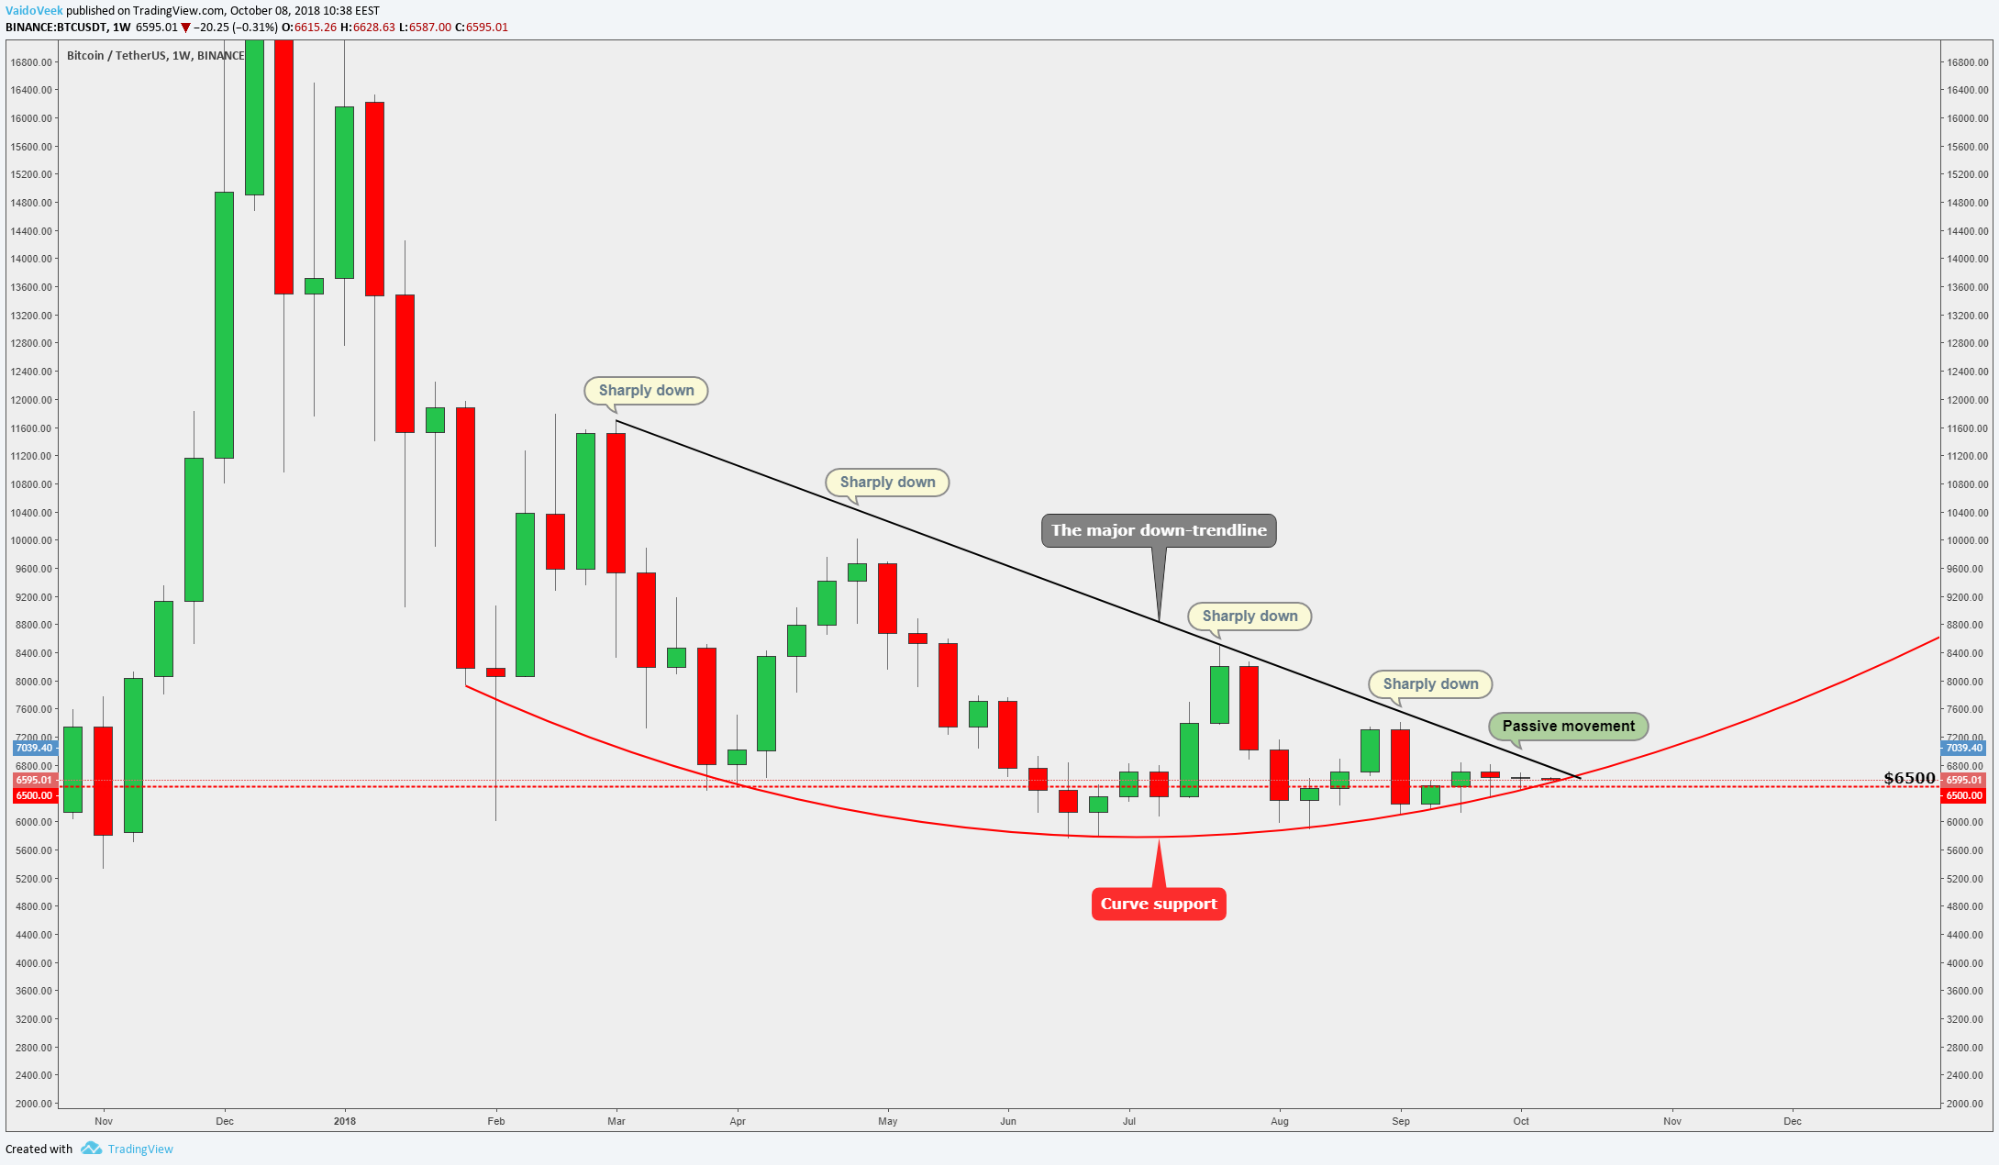
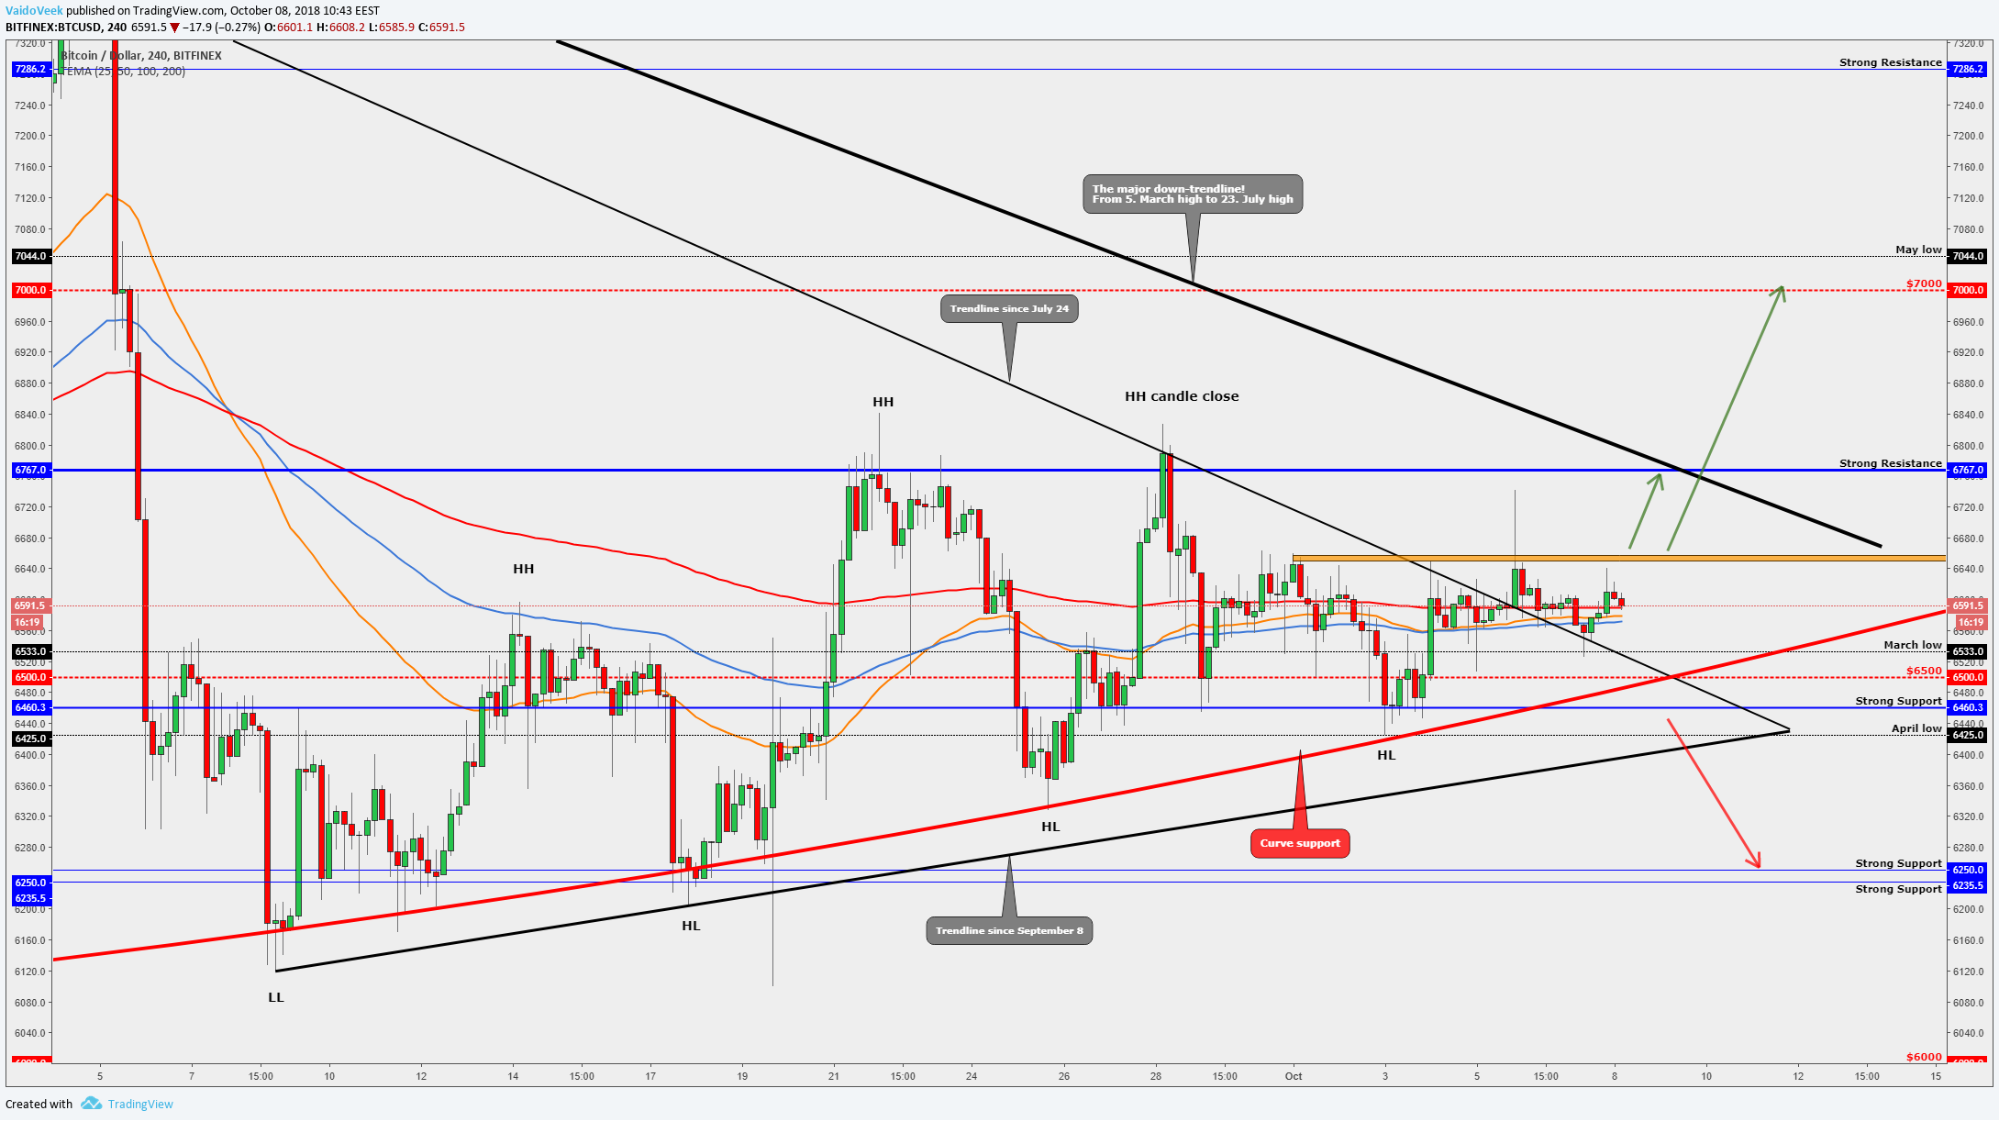
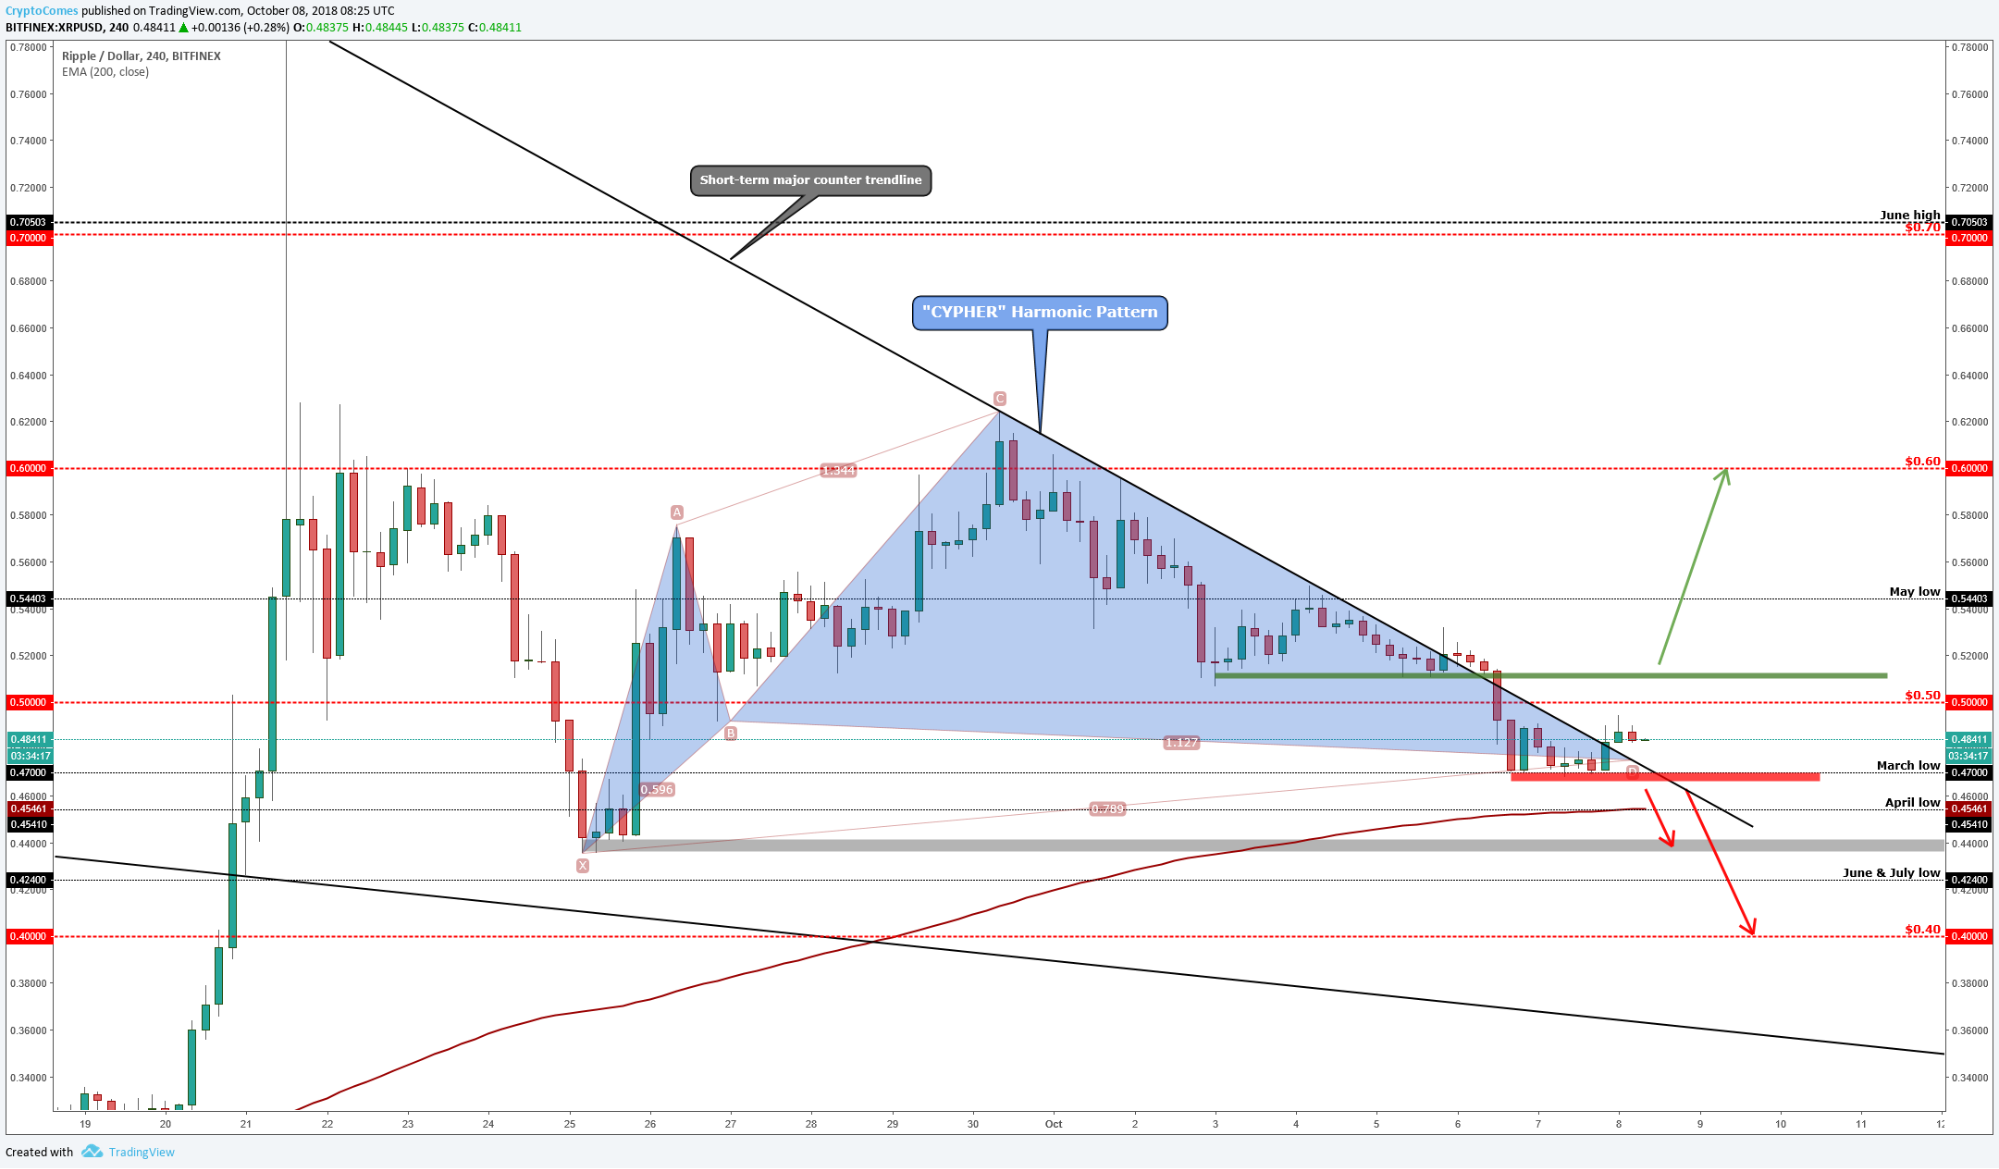
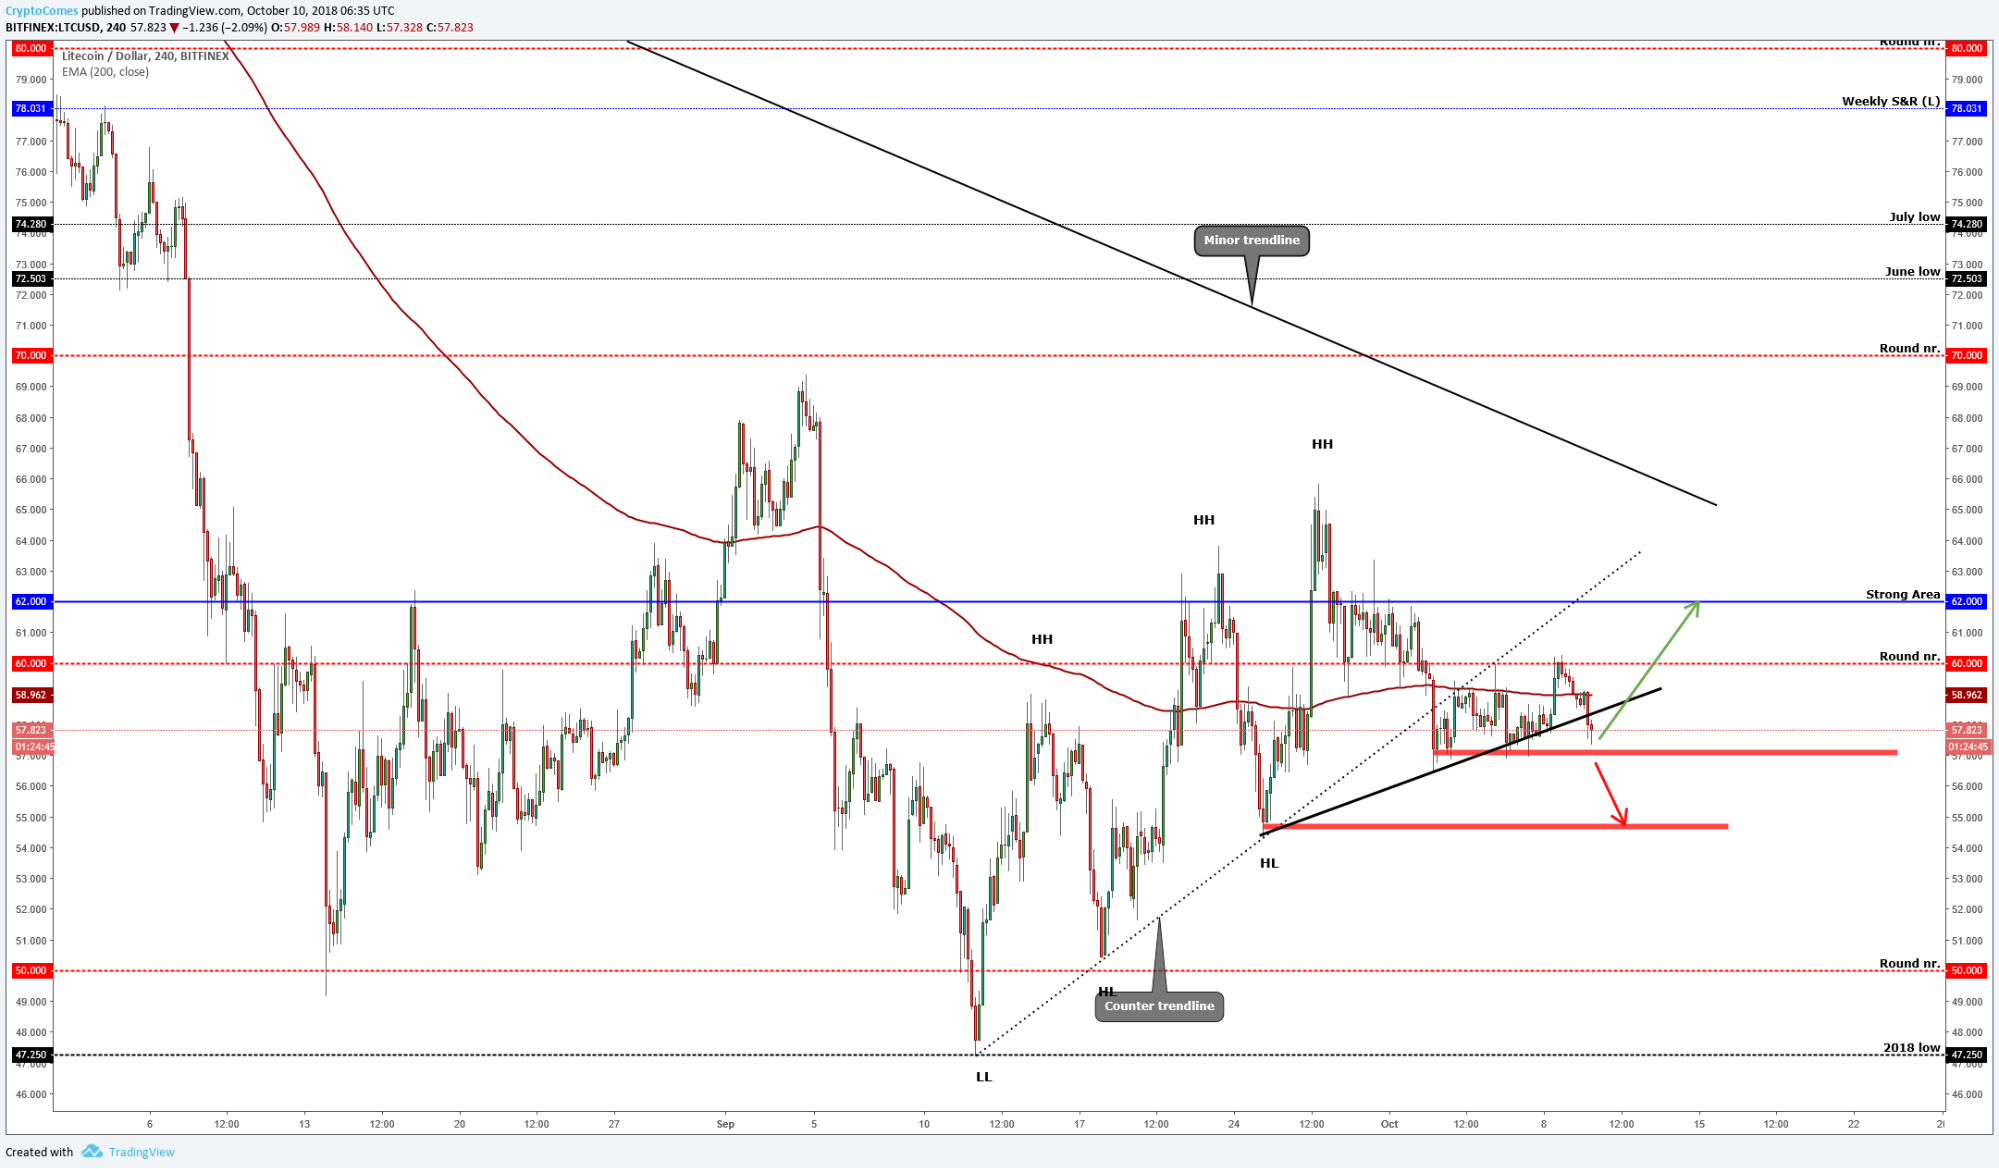
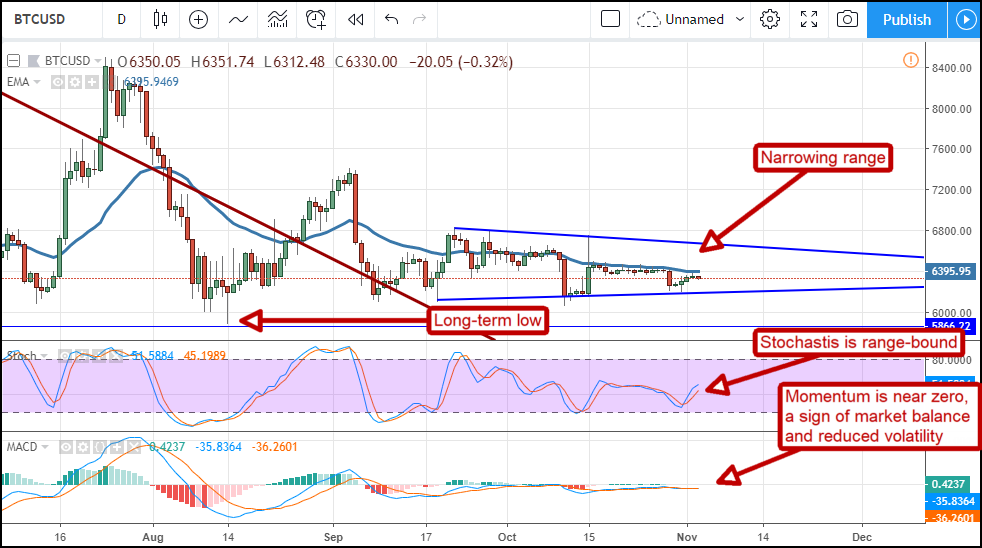
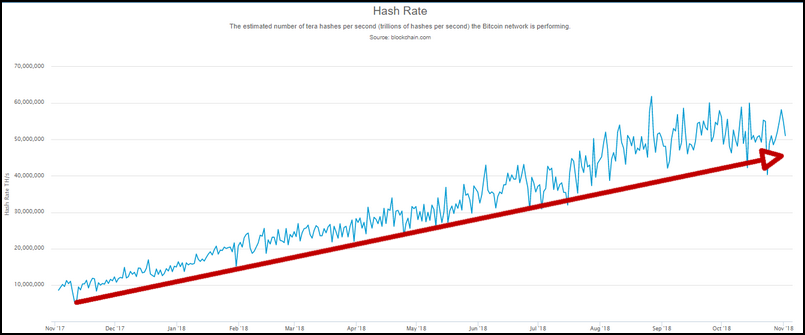
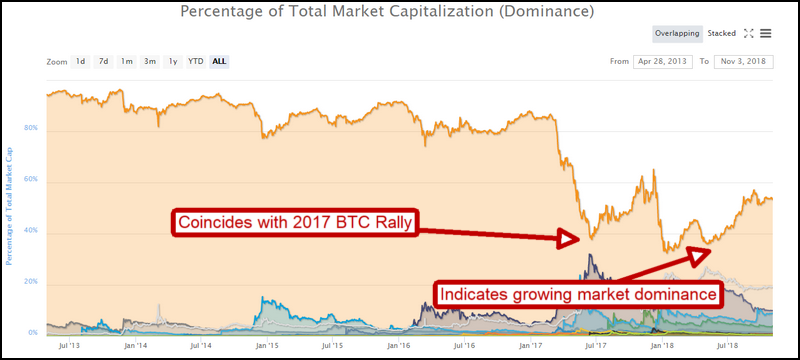