|
Title: Analysis of previous bubble corrections and impending crash Post by: TERA on November 17, 2013, 09:50:47 AM I have analyzed the bubbles of previous chart and have observed that there were always several corrections to the LONG daily ema (blue line on clarkmoody) which would facilitate capitulation, keep the rally strong and make the new price permanent. When the long daily ema corrections stop, the rally enters into a bubbling mode. The final steps which occur during this stage are:
1. The last correction to the long daily ema. 2. A correction to the short daily ema. 3. A correction above the daily ema. 4. A huge spike followed by the crash https://i.imgur.com/Xj9Kz36.png As you can see just like in march/april, we have stopped having corrections to the daily ema, have had a correction to the short daily ema, and have had a correction above the daily emas. At this point we enter into the bubbling mania phase, see a huge spike to ($700?) and then a crash. Maybe this part of my analysis is wrong, but in April the crash ended at the point of the last correction to the long daily ema, which was $50. Ours is around $200. I know $200 sounds ridiculous but that would be the result of us not having any serious corrections earlier and all that pent up dumping needing to occur. We would of course bounce off that level very quickly. EDIT: I do believe a correction to $200 is unlikely and that $300 is more likely. Title: Re: Analysis of previous bubble corrections and impending crash Post by: piramida on November 17, 2013, 09:54:04 AM Strangely, but I agree with you on where we are in this run up. The dip would be to 300 though, because previous ATH is an unbreakable support (was at $32 last crash and we really only approached levels 2x that). The highs could clip at anything from 700 to four digits.
Title: Re: Analysis of previous bubble corrections and impending crash Post by: TERA on November 17, 2013, 09:58:52 AM I agree that $200 is ridiculous and I was going solely by where that last correction was. I think the drop might actually connect with the trendline from October which will be somewhere around $300 at the time.
Title: Re: Analysis of previous bubble corrections and impending crash Post by: windjc on November 17, 2013, 09:59:41 AM I have analyzed the bubbles of previous chart and have observed that there were always several corrections to the LONG daily ema (blue line on clarkmoody) which would facilitate capitulation, keep the rally strong and make the new price permanent. When the long daily ema corrections stop, the rally enters into a bubbling mode. The final steps which occur during this stage are: 1. The last correction to the long daily ema. 2. A correction to the short daily ema. 3. A correction above the daily ema. 4. A huge spike followed by the crash https://i.imgur.com/Xj9Kz36.png As you can see just like in march/april, we have stopped having corrections to the daily ema, have had a correction to the short daily ema, and have had a correction above the daily emas. At this point we enter into the bubbling mania phase, see a huge spike to ($700?) and then a crash. Maybe this part of my analysis is wrong, but in April the crash ended at the point of the last correction to the long daily ema, which was $50. Ours is around $200. I know $200 sounds ridiculous but that would be the result of us not having any serious corrections earlier and all that pent up dumping needing to occur. We would of course bounce off that level very quickly. Well we broke out of that bearish wedge ;) But there is another major factor now ----> China is leading this rally. Although I think you may be correct. I think we could be in for another major run up, but Gox and Stamp have to get on board. They were not on board when China exploded up to 2600 in less than 5 hours and so the correction was fairly minor, lasting about a day and dipping about 25%-30%. For us to end this rally for a while, we probably will have to explode upwards with some synchronized momentum. The thing is EVERYONE is expecting a pull back right now. There are several reasons to assume it. Tomorrow is Sunday, the day of the last pull back. Monday and Tuesday are the congressional hearings and a LOT of the early adopters are paranoid anti-government types. And we are severely over bought. However, another possibility is we blow through 500 steady as she goes. If we do this, that might be enough to make people buy into a steeper mania, especially if the congressional hearings are seen as bullish. That could potentially be enough to get everything moving with more speed. But I agree - barring some real bearish news Mon/Tues or soon, the only way we see $200 again is to fly up fast and furious into the stratosphere. Title: Re: Analysis of previous bubble corrections and impending crash Post by: DeathAndTaxes on November 17, 2013, 10:00:55 AM I think the OP scenario is at least probable but like the other responses I think a fall to $200 is highly unlikely. Below $350 wouldn't surprise me. Below $300? Not sure. I will keep some bids down there but not sure if they will hit. Below $266 (prior ATH) seems dubious and <$200 just isn't going to happen.
Title: Re: Analysis of previous bubble corrections and impending crash Post by: wopwop on November 17, 2013, 10:01:13 AM wat a load of bullshit
Title: Re: Analysis of previous bubble corrections and impending crash Post by: Rupture on November 17, 2013, 10:04:33 AM People have been saying for a while they know when it will happen and the prices just keeps climbing merrily
Title: Re: Analysis of previous bubble corrections and impending crash Post by: windjc on November 17, 2013, 10:06:48 AM People have been saying for a while they know when it will happen and the prices just keeps climbing merrily Well, its either going to happen because of a huge run up or because of some bad news. Or a combination of both. Title: Re: Analysis of previous bubble corrections and impending crash Post by: goxed on November 17, 2013, 10:16:53 AM Title: Re: Analysis of previous bubble corrections and impending crash Post by: windjc on November 17, 2013, 10:20:34 AM The weekly charts make it look like we have a long way to go in this rally - at least several weeks more which would definitely put us in the stratosphere. Title: Re: Analysis of previous bubble corrections and impending crash Post by: sukiho on November 17, 2013, 12:06:19 PM another interesting graph is the log all time highs. if it goes past about 520 we enter uncharted territory, perhaps the start of the mythical s wave, but historically its only reached this point twice before, at the 30 & 260 bubble tops and both times there were big corrections
Title: Re: Analysis of previous bubble corrections and impending crash Post by: Wekkel on November 17, 2013, 02:56:37 PM Where does your 520 come from?
Title: Re: Analysis of previous bubble corrections and impending crash Post by: Zangelbert Bingledack on November 17, 2013, 03:59:07 PM So top out between $800 and maybe $1600? Sounds reasonable, though probably toward the higher end. We haven't even seen any double-exponential growth yet. It'd be a pretty pathetic mania phase if it didn't involve at least one doubling ($1000, from here...but of course there's no accounting for bad news).
I think if we have a mania $266-500 will be support, the new $50 if you will. Look how earily similar the the last 30 days are to March, even down to slope. https://i.imgur.com/QZBneVf.jpg If we follow the same pattern we'll go to $1300 and down to $266-ish, leveling out around $600-700. But history never repeats exactly. Infrastructure is more robust this time, it seems. But to take that into account may be biasing the assumption that MtGox failure ended the April rally prematurely, when it may have just been the straw than broke the back of a severely overheated market. Title: Re: Analysis of previous bubble corrections and impending crash Post by: sukiho on November 17, 2013, 04:20:01 PM Where does your 520 come from? if you run a line over the highest points of a log chartTitle: Re: Analysis of previous bubble corrections and impending crash Post by: laowai80 on November 17, 2013, 04:20:12 PM I kinda said the same a week ago here:
https://bitcointalk.org/index.php?topic=328823.msg3538774#msg3538774 but now I am not quite sure, I think maybe we were 1-2 steps below that, meaning we are just now at the March 15-20th price dynamics, but getting closer to the mania stage, definately not mania yet, but getting warmer :) Title: Re: Analysis of previous bubble corrections and impending crash Post by: JustAnotherSheep on November 17, 2013, 07:47:11 PM So top out between $800 and maybe $1600? Sounds reasonable, though probably toward the higher end. We haven't even seen any double-exponential growth yet. It'd be a pretty pathetic mania phase if it didn't involve at least one doubling ($1000, from here...but of course there's no accounting for bad news). It's amazing how similar it is, maybe my $1200 prediction will come true after all. I think if we have a mania $266-500 will be support, the new $50 if you will. Look how earily similar the the last 30 days are to March, even down to slope. https://i.imgur.com/QZBneVf.jpg If we follow the same pattern we'll go to $1300 and down to $266-ish, leveling out around $600-700. But history never repeats exactly. Infrastructure is more robust this time, it seems. But to take that into account may be biasing the assumption that MtGox failure ended the April rally prematurely, when it may have just been the straw than broke the back of a severely overheated market. Title: Re: Analysis of previous bubble corrections and impending crash Post by: oda.krell on November 18, 2013, 12:15:09 AM I have analyzed the bubbles of previous chart and have observed that there were always several corrections to the LONG daily ema (blue line on clarkmoody) which would facilitate capitulation, keep the rally strong and make the new price permanent. When the long daily ema corrections stop, the rally enters into a bubbling mode. The final steps which occur during this stage are: 1. The last correction to the long daily ema. 2. A correction to the short daily ema. 3. A correction above the daily ema. 4. A huge spike followed by the crash https://i.imgur.com/Xj9Kz36.png As you can see just like in march/april, we have stopped having corrections to the daily ema, have had a correction to the short daily ema, and have had a correction above the daily emas. At this point we enter into the bubbling mania phase, see a huge spike to ($700?) and then a crash. Maybe this part of my analysis is wrong, but in April the crash ended at the point of the last correction to the long daily ema, which was $50. Ours is around $200. I know $200 sounds ridiculous but that would be the result of us not having any serious corrections earlier and all that pent up dumping needing to occur. We would of course bounce off that level very quickly. EDIT: I do believe a correction to $200 is unlikely and that $300 is more likely. Eh. I give you credit for originality, but I doubt you're really onto something there. Just tried it myself, to see with which parameters you got your results, and a) you need to tweak the parameters to make it work both in April and now (as in: short and long daily EMA aren't the same), b) it doesn't fit at all the 2011 run-up. So it looks to me more like the result of curve fitting rather than actually having much predictive power. Title: Re: Analysis of previous bubble corrections and impending crash Post by: JakeGold on November 18, 2013, 12:42:08 AM b) it doesn't fit at all the 2011 run-up. So it looks to me more like the result of curve fitting rather than actually having much predictive power. The 2011 bubble was a bit of a wash. No one had any clue what bitcoin could do back then. If this run up has any relation to the last two, I'd say it will be more similar to the $260 peak than the $30 one. Title: Re: Analysis of previous bubble corrections and impending crash Post by: bitjoint on November 18, 2013, 12:43:40 AM Title: Re: Analysis of previous bubble corrections and impending crash Post by: jago25_98 on November 18, 2013, 12:47:01 AM Can we super-impose a graph of Chinese market share onto these graphs. I think that would be very revealing
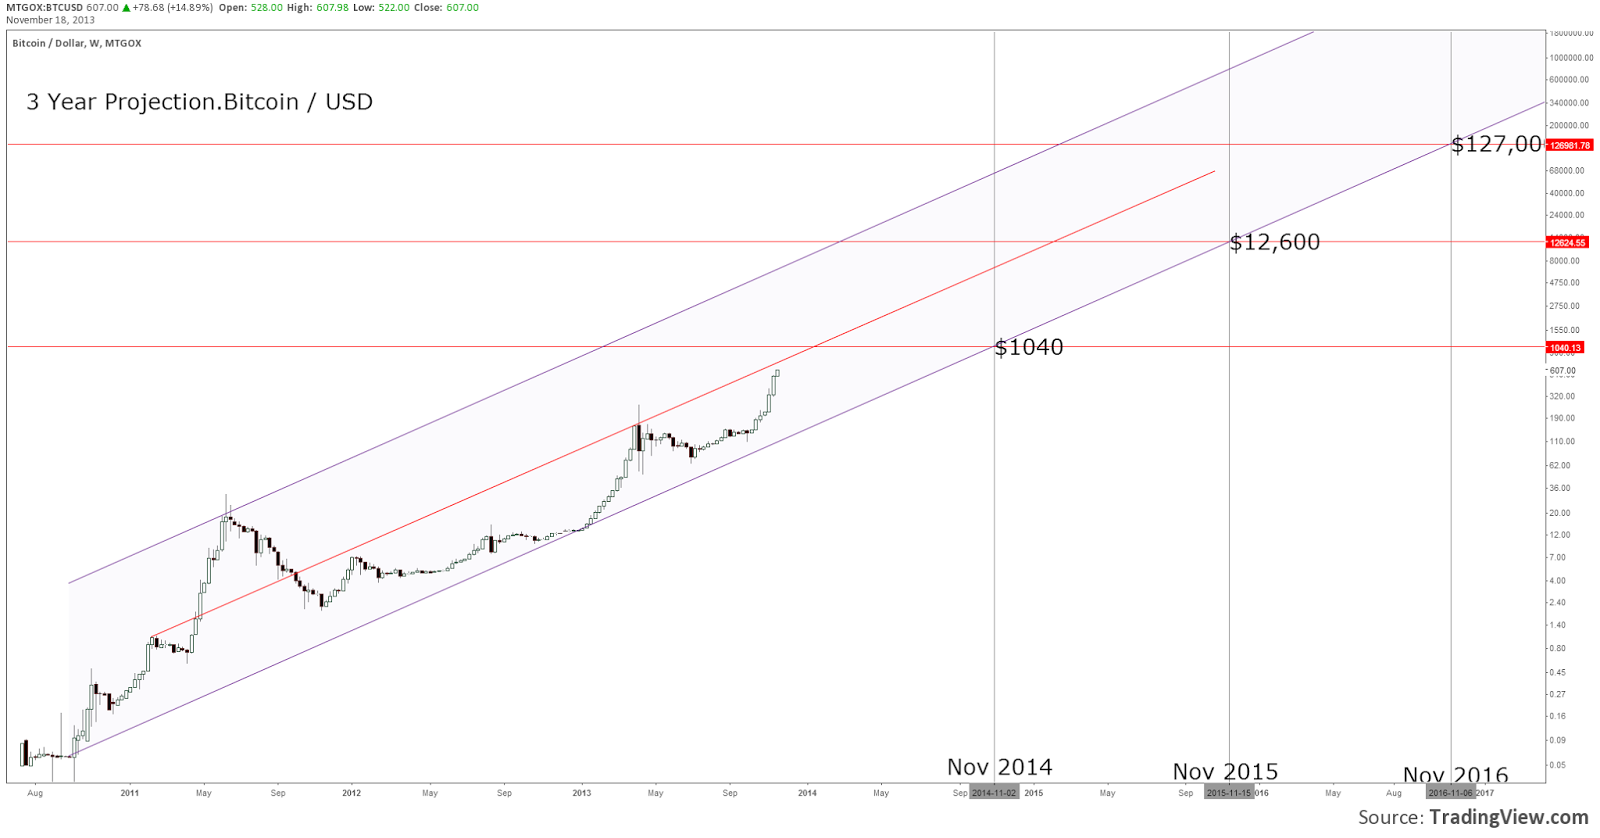
Title: Re: Analysis of previous bubble corrections and impending crash Post by: oda.krell on November 18, 2013, 01:04:44 AM Where does your 520 come from? if you run a line over the highest points of a log chartSlightly higher by my count, ~530 (mtgox), but that's negligible. We're right below that line at the moment. The way I see it, we either break through, then we've officially broken even the most optimistic estimations that were circulated so far, or we bounce off of it. Personally, I expect the latter. https://www.tradingview.com/x/KisEw0Sr/ Title: Re: Analysis of previous bubble corrections and impending crash Post by: Walsoraj on November 18, 2013, 01:15:29 AM Yup, too many charts in this thread.
/uninterested Title: Re: Analysis of previous bubble corrections and impending crash Post by: YoYa on November 18, 2013, 01:22:35 AM Yup, too many charts in this thread. /uninterested Put's down crack pipe.... Now listen here young man, if ya didn't want charts then ya shouldn't have well come in to a speculation forum. That's like going in to a whorehouse looking for a virgin. Picks back up crack pipe and goes back to work. Title: Re: Analysis of previous bubble corrections and impending crash Post by: mccoyspace on November 18, 2013, 01:49:34 AM Where does your 520 come from? if you run a line over the highest points of a log chartSlightly higher by my count, ~530 (mtgox), but that's negligible. We're right below that line at the moment. The way I see it, we either break through, then we've officially broken even the most optimistic estimations that were circulated so far, or we bounce off of it. Personally, I expect the latter. https://www.tradingview.com/x/KisEw0Sr/ Currently at $542 on Gox, so now what? Title: Re: Analysis of previous bubble corrections and impending crash Post by: TERA on November 18, 2013, 07:09:49 AM $607 now. It looks at least half of what I predicted is true so far. :P
Title: Re: Analysis of previous bubble corrections and impending crash Post by: Zangelbert Bingledack on November 18, 2013, 07:18:53 AM You gotta have a mania phase or it just ain't a bubble ;D
Title: Re: Analysis of previous bubble corrections and impending crash Post by: laowai80 on November 18, 2013, 07:27:09 AM It's amazing how similar it is, maybe my $1200 prediction will come true after all. I tend to agree, $1000-1500 is the range where the bubble is likely to pop this time. Not for long, unless there is no major disruptive development. Title: Re: Analysis of previous bubble corrections and impending crash Post by: MGUK on November 18, 2013, 09:01:58 AM 2011
http://bitcoincharts.com/charts/chart.png?width=940&m=mtgoxUSD&SubmitButton=Draw&r=60&i=&c=1&s=2010-06-03&e=2011-06-03&Prev=&Next=&t=S&b=&a1=&m1=10&a2=&m2=25&x=0&i1=&i2=&i3=&i4=&v=1&cv=0&ps=0&l=0&p=0& April 2013 http://bitcoincharts.com/charts/chart.png?width=940&m=mtgoxUSD&SubmitButton=Draw&r=360&i=&c=1&s=2012-04-08&e=2013-04-08&Prev=&Next=&t=S&b=&a1=&m1=10&a2=&m2=25&x=0&i1=&i2=&i3=&i4=&v=1&cv=0&ps=0&l=0&p=0& Now http://bitcoincharts.com/charts/chart.png?width=940&m=mtgoxUSD&SubmitButton=Draw&r=360&i=&c=1&s=2012-11-24&e=2013-11-19&Prev=&Next=&t=S&b=&a1=&m1=10&a2=&m2=25&x=0&i1=&i2=&i3=&i4=&v=1&cv=0&ps=0&l=0&p=0& Take what you will from this. Title: Re: Analysis of previous bubble corrections and impending crash Post by: Zangelbert Bingledack on November 18, 2013, 09:45:44 AM Log charts, please.
Title: Re: Analysis of previous bubble corrections and impending crash Post by: MGUK on November 18, 2013, 10:05:30 AM You can put it on log scale yourself if you'd like. I don't think the pattern is as clear on logarithmic scale, links:
2011: http://bitcoincharts.com/charts/mtgoxUSD#rg60zczsg2010-06-03zeg2011-06-03ztgSzm1g10zm2g25zvzcvzl April: http://bitcoincharts.com/charts/mtgoxUSD#rg360zczsg2012-04-08zeg2013-04-08ztgSzm1g10zm2g25zvzcvzl Now: http://bitcoincharts.com/charts/mtgoxUSD#rg360zczsg2012-11-24zeg2013-11-19ztgSzm1g10zm2g25zvzcvzl (note: they're also volume in currency. This makes more sense to me. As the price of a BTC goes up, of course volume of movement is going to go down because 1BTC costs more. Same amount of people come onto exchange with e.g. $100, but they can buy less volume in BTC.) I understand the logic of using log charts - it should supposedly be going exponential on a linear chart, as that's the same as linear on logarithmic, and that's how things grow, in relation to each other (percentage scale and whatnot.) But it bugs me a little. In 2011, and in April I pointed out the same things and the riposte of most was "nooo we're meant to be going up at this speed, log scales duuuh BTC to the moon $1000 by next hour herp" and low and behold, we crash. So people suggest we should be going exponential on linear, but if you look at the linear graph history of Bitcoin, it's pretty obvious that when we go exponential on linear, we crash shortly after. Could someone explain why this is? Title: Re: Analysis of previous bubble corrections and impending crash Post by: sukiho on November 18, 2013, 10:37:41 AM you dont need log but the scale of the last chart is not the same as the others, if you flatten out the lead up so its the same as the others then its probably only about half as high and got a long way to go
Title: Re: Analysis of previous bubble corrections and impending crash Post by: Inedible on November 18, 2013, 10:47:09 AM I think you're all forgetting the volumes of money required to take valuation up to $30 or $260 is different to taking it up to a valuation of $1600.
Title: Re: Analysis of previous bubble corrections and impending crash Post by: MGUK on November 18, 2013, 11:04:29 AM I think you're all forgetting the volumes of money required to take valuation up to $30 or $260 is different to taking it up to a valuation of $1600. You can't say that without knowing the state of the orderbook which isn't included in the graph. For all you know, there may only be one person left willing to sell Bitcoin and he's holding until $1600 (so $1600 would jump the price right up to $1600) or alternatively, everyone that's holding bitcoins maybe trying to sell them for $1000, in which case it's going to take a shed load more to get about $1000, let alone up to $1600. One thing I have noticed that is interesting (probably not worth drawing conclusions from, but interesting nonetheless) is the massive sells that seem to happen almost exactly 8 months before the crashes (that is assuming there's going to be a crash any day now.) 2011: start of Nov April: Aug - Sep Now: April If you look at 3 graphs in a vertical line, there's big red bars in exactly the same place on each (or within 2 weeks.) Most likely pure coincidence, but interesting:) you dont need log but the scale of the last chart is not the same as the others, if you flatten out the lead up so its the same as the others then its probably only about half as high and got a long way to go What makes you say that? Are you hinting at the bubble in April raised the start price of this bubble, and accounting for that, we have a way to go? Definitely possible. Although given what I mention above about the 8 month pre sells, the same could be said about all the graphs (there's a mini bubble that sets the start higher than the start of the graph.) Title: Re: Analysis of previous bubble corrections and impending crash Post by: Tzupy on November 18, 2013, 12:09:16 PM The crash started on Gox in the usual flash crash manner, but China performs it differently, and eventually Gox followed.
So far, it looks like China is going to perform an April 10th style crash, downward waves of increasing amplitude. Title: Re: Analysis of previous bubble corrections and impending crash Post by: oda.krell on November 18, 2013, 02:16:37 PM The way I see it, we either break through, then we've officially broken even the most optimistic estimations that were circulated so far, or we bounce off of it. Personally, I expect the latter. https://www.tradingview.com/x/KisEw0Sr/ And there we go. Uncharted territory :D It'll be a fun ride, I'm sure. EDIT: interestingly enough, looks like bitstamp refuses to play along. Title: Re: Analysis of previous bubble corrections and impending crash Post by: painlord2k on November 18, 2013, 06:00:03 PM The trend of bitcoin exchange value could, in my opinion, be divided in three phases thru now. The first, up until 32$, the second part from 32$ to 10$, then the current phase caused by the halving of the block reward. The two forces driving bitcoin prices were and are the internal inflation of Bitcoin (compared with the other fiat currencies) and the adoption rate from actual users that hold bitcoin and must buy them at the exchanges or for goods and services. The first force (inflation differential) was a negative force up until the halving of the block reward, because the internal inflation of bitcoin was (initially) a lot higher than the inflation of US$, , Yen, yuan, even of the Argentinian Pesos. But is was a predictable always diminishing force. And after the halving of the reward it become a zero or positive force (the internal inflation of the bitcoin is smaller than the internal inflation of US$, , Yen, Yuan, etc). The second force was the adoption rate, that was explosive initially and continue to grow at leaps and bounds. This is something near alway positive , as the network just never shrinked in the past. In the first part (0.001 to 32$) we had a lot of adoption, mainly for online gambling and selling some internet services. This was explosive and overcome brutally the negative forces of inflation. When it hit its limits, the negative of inflations took over and moved the price lower. At some point the diminishing negative force of inflation become to be equal to the grow of the network adoption and demand for bitcoin (when it hit the minimum of 2$). Some savvy investors could have anticipated the intersection point and bough bitcoin before the actual minimum could have happened (this is the nature of speculation and speculator). Then, for a "long" period, the two forces was nearly equally matched, when the BTC exchange rate risen from 2$ to 10$. Then the nearing halving of the reward, the increase size of the network and demand for hold bitcoin kicked in. The halving caused a reduction of the inflation rate of half, making the differential with other currencies positive (even if the network stopped to grow, the increase of bitcoin would be smaller compared to the increase of M1 of other fiat currencies, so BTC should increase in value compared with fiat currencies). Essentially, it is like the rivers and the creeks the salmons (purchasing power) go back to reproduce instead of staying on higher grounds moved back, so instead of swimming upstream the salmons found themselves swimming downstream. A lot easier. And a lot funnier for the bears (bitcoin holders) to catch a lot of them. The main problem would be in some places there would be more salmons than water to swim. Essentially, in my opinion, the media line of the trend channel depicted in the OP could be passed like butter, in the right circumstances. http://bitscanner.blogspot.co.uk/2013/11/btc-update-monday-18th-november.html (http://bitscanner.blogspot.co.uk/2013/11/btc-update-monday-18th-november.html) (for the OP and the chart) http://4.bp.blogspot.com/-m-tkM03HvvM/UonPqMfLs0I/AAAAAAAAA40/3o8h1aOiCTA/s1600/BTC+Update+18+November.png Title: Re: Analysis of previous bubble corrections and impending crash Post by: painlord2k on November 18, 2013, 06:29:13 PM If someone is good at designing charts he could make a chart showing the inflation rate of bitcoin intersecting the inflation rate of M1 of various currencies.
Then we could start comparing it with the USD/BTC chart and see what happen Title: Re: Analysis of previous bubble corrections and impending crash Post by: GreekGeek on November 18, 2013, 09:44:29 PM Title: Re: Analysis of previous bubble corrections and impending crash Post by: TERA on November 20, 2013, 08:23:07 AM Bumping my thread for reference.
Title: Re: Analysis of previous bubble corrections and impending crash Post by: Zangelbert Bingledack on December 07, 2013, 01:08:11 PM So top out between $800 and maybe $1600? Sounds reasonable, though probably toward the higher end. We haven't even seen any double-exponential growth yet. It'd be a pretty pathetic mania phase if it didn't involve at least one doubling ($1000, from here...but of course there's no accounting for bad news). I think if we have a mania $266-500 will be support, the new $50 if you will. Look how earily similar the the last 30 days are to March, even down to slope. https://i.imgur.com/QZBneVf.jpg If we follow the same pattern we'll go to $1300 and down to $266-ish, leveling out around $600-700. But history never repeats exactly. Infrastructure is more robust this time, it seems. But to take that into account may be biasing the assumption that MtGox failure ended the April rally prematurely, when it may have just been the straw than broke the back of a severely overheated market. I'm not the only one who was predicting "go to quadruple digits, crash, then level out in the mid/upper hundreds." Looks like we're getting better. Crash to $266-ish hasn't happened yet, though. Title: Re: Analysis of previous bubble corrections and impending crash Post by: Manna on December 07, 2013, 01:17:34 PM If we significant break under 266 than exspect a heav bear market for next months and maybe year. So its good for bitcoin that we haven´t touched it yet.
|