|
Title: wtf Post by: GeniuSxBoY on August 22, 2011, 02:04:46 AM There's a 10,000 bid at 11.14 on the order books that's not showing up on the mxgox chart.
Title: Re: wtf Post by: GeniuSxBoY on August 22, 2011, 02:05:19 AM figures it would pop up right after I hit send
Title: Re: wtf Post by: runlinux on August 22, 2011, 02:19:35 AM nope, i see it too.
dang... some one wants their bitcoins. Title: Re: wtf Post by: GeniuSxBoY on August 22, 2011, 02:25:19 AM It's north korea.
Want to show off their military power, but not use it. Title: Re: wtf Post by: Cluster2k on August 22, 2011, 10:46:09 AM It's north korea. Want to show off their military power, but not use it. Yeah, by buying bitcoins. The South is quaking as we speak. Title: Re: wtf Post by: Elwar on August 22, 2011, 11:01:07 AM That wall will fall with the first hit.
Title: Re: wtf Post by: julz on August 22, 2011, 11:17:54 AM That wall will fall with the first hit. What do you mean by that? (I saw about 40BTC nibbled off it earlier) Title: Re: wtf Post by: zby on August 22, 2011, 11:29:34 AM Hmm - another one: 1412BTC sold for 6.6667GBP/BTC (about 11USD, google currently says: 10.9927216) at britcoin where the usual daily volume is less than a 100.
Title: Re: wtf Post by: Cluster2k on August 23, 2011, 12:27:46 AM As predicted, that 'wall' fell quite quickly. It's just a logical reaction to the buy/sell price point approaching the 'wall': why stick around at a higher price when you can see it'll fall below very soon.
Title: Re: wtf Post by: EuSouBitcoin on August 23, 2011, 04:04:33 AM It was a GTC order - Good 'Til Close ;)
Title: Re: wtf Post by: julz on August 23, 2011, 04:10:03 AM I wasn't able to watch as the main wall disappeared - and the tradehistory on bitcoincharts only shows a very small window of trades.
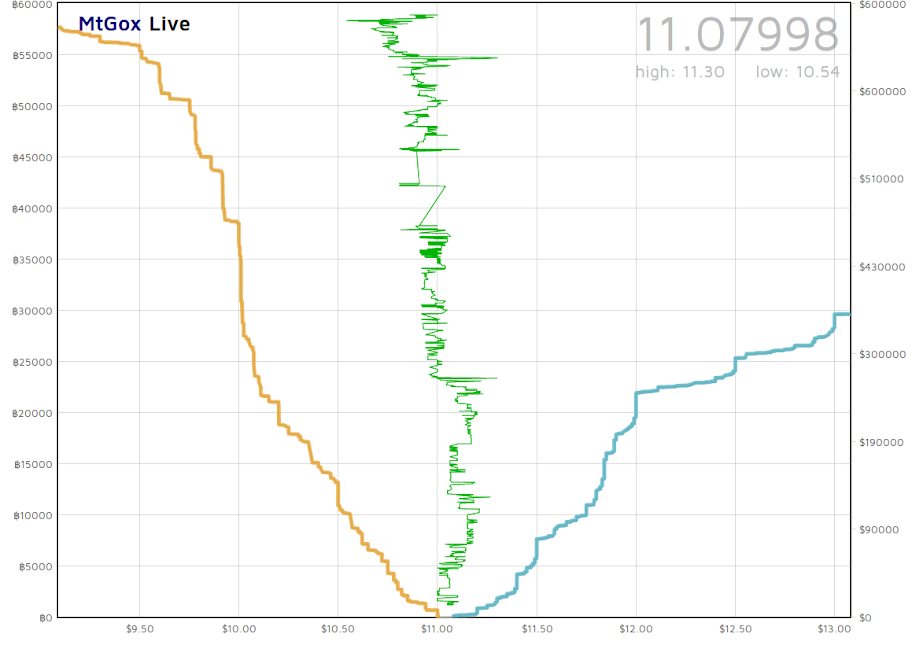
I guess if you are looking not long afterwards, you can deduce from the 'recent trade volume' whether a particularly large order was filled.. but is there a way to look at the trade history more directly? Title: Re: wtf Post by: oakpacific on August 23, 2011, 06:33:04 PM https://lh4.googleusercontent.com/-Qqgi_z5Mgb8/TlPxnDnQoJI/AAAAAAAABi8/tU0g47w43Sw/s912/mtgoxlive1.png
Yea the walls could be bogus but I haven't seen anything like that for a long time. Title: Re: wtf Post by: piramida on August 23, 2011, 09:16:26 PM Yea the walls could be bogus but I haven't seen anything like that for a long time. Well obviously that's because mtgoxlive changed the scale to be the same for BTC/USD sides of the graph. Before, even when BID side was 3 times higher than the ASK side, they displayed the same height. Now it's adjusted to reflect the actual ratio and you don't have to calculate yourself. Title: Re: wtf Post by: oakpacific on August 23, 2011, 09:57:09 PM Yea the walls could be bogus but I haven't seen anything like that for a long time. Well obviously that's because mtgoxlive changed the scale to be the same for BTC/USD sides of the graph. Before, even when BID side was 3 times higher than the ASK side, they displayed the same height. Now it's adjusted to reflect the actual ratio and you don't have to calculate yourself. Title: Re: wtf Post by: GeniuSxBoY on August 24, 2011, 01:53:14 AM Yeh, I was shocked at first, too, but it's the same graph, different scale.
Kinda cheap tactics if you ask me, but hey, there's suckers born every day, amirite? Title: Re: wtf Post by: bitcoinBull on August 24, 2011, 02:06:20 AM Yea the walls could be bogus but I haven't seen anything like that for a long time. Well obviously that's because mtgoxlive changed the scale to be the same for BTC/USD sides of the graph. Before, even when BID side was 3 times higher than the ASK side, they displayed the same height. Now it's adjusted to reflect the actual ratio and you don't have to calculate yourself. Yes, now it is much better than before (bid side was plotted in BTC and ask side was plotted USD). Now the asks are also plotted in BTC (the ask axis labels are still in USD). My preferred option would be to see both sides plotted and labeled in USD (with the BTC amounts in the mouseovers). Then one can see how much USD can be cashed in/out to reach a price point, at a glance and without using mouseovers. Title: Re: wtf Post by: gressen on August 24, 2011, 08:06:10 AM Yea the walls could be bogus but I haven't seen anything like that for a long time. Well obviously that's because mtgoxlive changed the scale to be the same for BTC/USD sides of the graph. Before, even when BID side was 3 times higher than the ASK side, they displayed the same height. Now it's adjusted to reflect the actual ratio and you don't have to calculate yourself. Yes, now it is much better than before (bid side was plotted in BTC and ask side was plotted USD). Now the asks are also plotted in BTC (the ask axis labels are still in USD). My preferred option would be to see both sides plotted and labeled in USD (with the BTC amounts in the mouseovers). Then one can see how much USD can be cashed in/out to reach a price point, at a glance and without using mouseovers. Well, now that both bid and ask are scaled you have BTC and USD axes scaled properly. That means 1000 BTC equals 11000 USD (or whatever the current rate is). Just take a closer look. You can read left graph from right axis and vice versa. |