|
Title: Elliott Wave Analysis Post by: bitcoinBull on October 22, 2011, 10:23:56 PM Edit: former title "Elliott Wave Educational Video Series", a series of seminars by Robert Prechter recorded over a decade ago.
In the first session, Prechter gives a fascinating historical perspective on economics: why Wave I from the 1932 DJI low topped in 1937, and started correcting (Wave II) from 1937 to 1942. Because, it looked like the Allied powers were going to lose WWII to the Axis powers (in other words, capitalism was losing to communism). When the Allies started winning in 1942, the Dow resumed the upward trend, starting the largest and most powerful Wave III of the Elliot Waves. http://stockcharts.com/freecharts/historical/djia1900.html (http://stockcharts.com/freecharts/historical/djia1900.html) - Dow historical chart Analagous bitcoin chart? (https://bitcointalk.org/index.php?topic=49264.msg586958#msg586958) Title: Re: Elliott Wave Educational Video Series Post by: netrin on October 23, 2011, 01:51:53 AM Thanks for the video links. While we're cross linking, I'll just drop this old thing (http://genaud.net/bitcoin/2011/20111019-0200-yearDailyS.png) here:
http://genaud.net/bitcoin/2011/20111019-0200-yearDailyS.png (http://genaud.net/bitcoin/2011/20111019-0200-yearDailyS.png)Discuss. http://stockcharts.com/freecharts/historical/images/djia1900s.png (http://stockcharts.com/freecharts/historical/images/djia1900s.png) Bitcoin wave V (April-June 2011) is definitely longer than III, which is a semi-unique feature of commodity charts. I don't expect a similar wave V extension from the DJIA. I think the Euro-American stock markets have peaked. Title: Re: Elliott Wave Educational Video Series Post by: netrin on October 24, 2011, 02:37:57 AM Video 1. Hour 1:00:20-40 "A correction usually finds its lowest point in the area of the fourth wave of the preceding impulse wave of the same degree."
http://bitcoincharts.com/charts/chart.png?s=2011-2-11&e=2011-4-6&noheader=1&height=200&width=300&m=mtgoxUSD&i=Hourly&c=1&l=1&t=W Title: Re: Elliott Wave Educational Video Series Post by: bitcoinBull on October 24, 2011, 06:17:52 AM Video 1. Hour 1:00:20-40 "A correction usually finds its lowest point in the area of the fourth wave of the preceding impulse wave of the same degree." Blood. Thirsty. Bull. Think you could stomach $0.75 now? ;) Quote Baron Rothschild, an 18th century British nobleman and member of the Rothschild banking family, is credited with saying that "The time to buy is when there's blood in the streets." He should know. Rothschild made a fortune buying in the panic that followed the Battle of Waterloo against Napoleon. But that's not the whole story. The original quote is believed to be "Buy when there's blood in the streets, even if the blood is your own." Buy When There's Blood In The Streets (http://www.investopedia.com/articles/financial-theory/08/contrarian-investing.asp) Title: Re: Elliott Wave Educational Video Series Post by: netrin on October 24, 2011, 05:21:07 PM Could you apply EWP to this well known asset before 2000?
http://genaud.net/bitcoin/2011/201110210since19801219aapl.png (http://genaud.net/bitcoin/2011/201110210since19801219aapl.png) Title: Re: Elliott Wave Educational Video Series Post by: netrin on October 24, 2011, 07:05:49 PM Think you could stomach $0.75 now? ;) I have no love for vampires, but neither am I long bitcoin. I don't trust < Daily resolution, but none the less, I see three upward impulses since Thursday and am concerned that today we're in a c followed soon by a strong up wave III. What do you see in the crystal ball? http://bitcoincharts.com/charts/chart.png?m=mtgoxUSD&v=0&t=S&c=1&s=2011-10-20&e=2011-10-25&i=30-min&width=900&noheader=1&height=500 Title: Re: Elliott Wave Educational Video Series Post by: sadpandatech on October 24, 2011, 08:29:13 PM Think you could stomach $0.75 now? ;) I have no love for vampires, but neither am I long bitcoin. I don't trust < Daily resolution, but none the less, I see three upward impulses since Thursday and am concerned that today we're in a c followed soon by a strong up wave III. What do you see in the crystal ball? http://bitcoincharts.com/charts/chart.png?m=mtgoxUSD&v=0&t=S&c=1&s=2011-10-20&e=2011-10-25&i=30-min&width=900&noheader=1&height=500 I don't think we've hit our II yet for the time period stated.... "I see three upward impulses since Thursday" I don't think it fits this yet; "..the preceding impulse wave of the same degree" Though admitedly I have not looked at it as carefully as you likely have.? Cheers Title: Re: Elliott Wave Educational Video Series Post by: netrin on October 25, 2011, 03:12:16 PM I don't think we've hit our II yet for the time period stated.... "I see three upward impulses since Thursday" I don't think it fits this yet; "..the preceding impulse wave of the same degree" Though admitedly I have not looked at it as carefully as you likely have.? This pink wave '4' should be a three wave corrective (ABC). The 5 waves I'm referring to are on an even smaller scale (A). To be sure, I don't trust anything less than a DAY in bitcoins. I posted the above link on the 24th before the little fall. I'll update it so it doesn't keep moving. http://bitcoincharts.com/charts/chart.png?m=mtgoxUSD&v=0&t=S&c=1&s=2011-10-20&e=2011-10-26&i=30-min&width=900&noheader=1&height=500 What I see (on the seven day chart) is the bottom pink '3' on the 19th at $2.05. We've moved up in three impulses forming an A night of 22 at almost $3.3. Then we've fallen into B. I believe we completed B last night at $2.5 and are moving up on the final C to my pink '4' which will not likely be higher than pink '1' in September. But again, I have never trusted the hour/day scales. We could just as well have hit pink '4' at $3.3 and are on our way down to '5' at (gulp) $1-ish. We'll see in the next 12-24 hours. http://genaud.net/bitcoin/2011/20111019-0200-yearDailyS.png Title: Re: Elliott Wave Educational Video Series Post by: sadpandatech on October 25, 2011, 03:50:15 PM I don't think we've hit our II yet for the time period stated.... "I see three upward impulses since Thursday" I don't think it fits this yet; "..the preceding impulse wave of the same degree" Though admitedly I have not looked at it as carefully as you likely have.? This pink wave '4' should be a three wave corrective (ABC). The 5 waves I'm referring to are on an even smaller scale (A). http://genaud.net/bitcoin/2011/20111019-0200-yearDailyS.png Looking at it I see what you are saying and you are probably more than accurate, atleast in the wave methods you are using. I can assure you, my understanding of this is WELL below what yours is. ;p I think I pretty much ignored your labeling and was refering to II. a. '2' as if it were labeled differntly. I.e., II. a. 1, 2, 3,,, all being the through and using the same but with II. b. 1, 2, 3,, as being the peaks. Back to your proper way of reading it, I see where pink '4' not breaking $3.3 could suggest the pink '5' will be so low. I suppose the only real hope in that situation is that pink '4' has not hit yet and will break $3.5+?... 8) Thank you in advance for entertaining my very vague understanding. Hopefully your explanations will help others that may be in the same posistion as me, not so familiar with these methods but willing to keep an open mind and learn. Cheers, Derek Title: Re: Elliott Wave Educational Video Series Post by: netrin on October 25, 2011, 07:37:34 PM As I understand Elliott, the only requirement we have for '4' is that it can not rise above '1' at $4.2.
http://bitcoincharts.com/charts/chart.png?m=mtgoxUSD&l=1&t=S&c=1&s=2011-9-1&e=2011-9-30&i=Daily&width=400&noheader=1&height=200 Title: Re: Elliott Wave Educational Video Series Post by: netrin on October 27, 2011, 12:24:56 AM I'm not sure why there should be a relationship to the golden ratio, nor whether there is a relationship. No matter how I slice the numbers for wave 'iii' and 'v', I don't get within 5% of the golden ratio. http://genaud.net/bitcoin/2011/20111019-0200-yearDailyS-nofib.png I've just came across a collection of realtime EWP on youtube (http://www.youtube.com/user/ElliottWaveAnalysis). One thing she says often is that if wave three expressed a Fibonacci relationship, then five is not likely and vise versa. I haven't yet applied that rule, but what do you guys think? I have a suspicion though that this is just mathematical slight of hand. The golden ratio asserts that x/y = 1±y/x, so given two wave pairs it seems highly likely that at least one will express either 0.618 or 1.618 within a small factor. Then, you'll often hear "usually equal to or greater", which seems to allow for absolutely any relationship at all, no? Title: Re: Elliott Wave Educational Video Series Post by: netrin on October 27, 2011, 01:29:01 AM http://genaud.net/bitcoin/2011/20111026-dji-today.png
you are probably more than accurate ... my understanding of this is WELL below what yours is ... your proper way of reading You flatter me. http://genaud.net/bitcoin/2011/20111026-dji-today-close.png I see where pink '4' not breaking $3.3 could suggest the pink '5' will be so low. I suppose the only real hope in that situation is that pink '4' has not hit yet and will break $3.5+?... 8) '4' must be lower than '1' and '5' must be lower than '4'. Otherwise, '4' doesn't tell us much about '5'. I don't know what you mean to imply by 'hope'. Do you want a rally or are you shorting? Pink '4' could be anywhere. I haven't labeled waves in the previous higher degree (the missing black in pink wave '3') but I suspect 3:iv could be appropriately close to $4. Likewise, wave c:5 could end anywhere, though our March wave 'IV' puts it in the $0.6-1.1 range. http://genaud.net/bitcoin/2011/20111026-2340-3monthCwaveSHourly.png Pink wave '2' probably should be shifted to the left (two days after '1') which forms a strong three wave correction up. Then 3:iii would be extended, 3:iv would ride along $4 with a powerful 3:v down. Another count puts wave 3:iv on 17,18 October, which would hint that wave 4 is just about over today. Title: Re: Elliott Wave Educational Video Series Post by: sadpandatech on October 27, 2011, 12:17:44 PM you are probably more than accurate ... my understanding of this is WELL below what yours is ... your proper way of reading You flatter me. I see where pink '4' not breaking $3.3 could suggest the pink '5' will be so low. I suppose the only real hope in that situation is that pink '4' has not hit yet and will break $3.5+?... 8) '4' must be lower than '1' and '5' must be lower than '4'. Otherwise, '4' doesn't tell us much about '5'. I don't know what you mean to imply by 'hope'. Do you want a rally or are you shorting? Thanks for explaining that. By 'hope', I was simply hoping that the numbers would hold true from a mathmatical viewpoint. Just to be clear, I have not engaged Bitcoin as an investment vehicle but would prefer a rally if it is caused by new money moving into the system and not a speculative bubble. Any movement in any direction leading to some sort of eventual equilibrium would be great. Pink '4' could be anywhere. I haven't labeled waves in the previous higher degree (the missing black in pink wave '3') but I suspect 3:iv could be appropriately close to $4. Likewise, wave c:5 could end anywhere, though our March wave 'IV' puts it in the $0.6-1.1 range. http://genaud.net/bitcoin/2011/20111026-2340-3monthCwaveSHourly.png Pink wave '2' probably should be shifted to the left (two days after '1') which forms a strong three wave correction up. Then 3:iii would be extended, 3:iv would ride along $4 with a powerful 3:v down. Another count puts wave 3:iv on 17,18 October, which would hint that wave 4 is just about over today. I will not add anything here as it would be pure guesswork on my part. I am still following along intently and will hopefully increase my grasp of the concepts enough to fully understand before you are done here. =) I do have I lied, one input. "which would hint that wave 4 is just about over today." If i am following correctly I agree, and it should nudge 4 to within +-.1 of $3.00. Thanks again for sharing this. Eventually I will free up some brain cycles and go check out the vids so I can follow along better. Cheers, Derek Title: Re: Elliott Wave Educational Video Series Post by: netrin on October 27, 2011, 03:16:26 PM I'm afraid the blind may be leading the blind or the doubter leading the faithful. I'm not even convinced I believe Elliott works (rather than any method which encourages looking at multiple scales, patience, and planning for negative confirmations). I am only posting my charts because I want to learn myself and welcome critique.
I appreciate your comments and questions. Just be aware that I do not consider myself to be experienced enough to give definitive answers; I can only explain my own thinking. I still have no clue what is happening during most corrections (such as pink '4' this past week, Monday's wave 'b' in particular) until they are long over. I no longer share your 'hope' for bitcoin. I am convinced crypto-currency will prevail. Bitcoin prices are volatile. That is a fact and won't change. I love bitcoin technology and I enjoy trading this volatile asset. They are two entirely separate entities which share few properties. I also believe bitcoin will rally and pop many more times. I believe bitcoin will hit triple digits in 2012. I don't hope that, I expect it, while preparing for zero. Are the gradients of pink '2' to '3' and '4' to '5' the same? And the gradients from pink '1' to '2' and '3 to '4'? Is this a requirement to fit into EWT? Great question. I appreciate symmetry and have a tendency to create symmetry. But I believe that is wrong according to Elliott (who uses different symmetries, Fibonacci, etc). I understand that in a five wave impulse, an orderly correction (2) will often be followed by a chaotic correction (4) and vise versa. I think you'll see that is true in II (November) and IV (March). I now favor an earlier pink '2' ending 12 September, but wanted to make my graph consistent with the graph I created at that time (and posted last week). Also, I am tempted to believe that pink '4' can not reach $4 because it would have to rise well above the clean monthly resistance. Is that unorthodox thinking? I lied, one input. "which would hint that wave 4 is just about over today." If i am following correctly I agree, and it should nudge 4 to within +-.1 of $3.00. We just bounced over $2.9 hit on 18 October. If my count is thus far correct, and we sustain prices over $3, then I think we are in a five wave impulse from the bottom 25 October to which $4 is a real possibility. This could be interesting: http://bitcoincharts.com/charts/chart.png?m=mtgoxUSD&l=1&t=S&c=1&s=2011-10-25&e=2011-11-1&width=900&noheader=1&height=300 Title: Re: Elliott Wave Educational Video Series Post by: netrin on October 30, 2011, 10:15:19 PM http://genaud.net/bitcoin/2011/20111028-1612-1month5CwaveSHourly.png
So, we didn't quite make $4, but $3.85 was pretty close and well within 3.iv (8-12 October). Notice that today 30 October, we've hit $3.2. On 23 October, 3.a peaked at $3.3. So, for all the rally bulls, either this little correction is gonna turn into an impressive third wave extension, or we've peaked at 4.c.v on our way down. http://bitcoincharts.com/charts/chart.png?m=mtgoxUSD&l=1&t=S&c=1&s=2011-10-8&e=2011-11-8&v=0&i=Hourly&width=900&noheader=1&height=400 As I explained here (https://bitcointalk.org/index.php?topic=49264.msg598837#msg598837) and here (https://bitcointalk.org/index.php?topic=1493.msg602827#msg602827), the green count (below) considers the unlikely case that the invalid fourth wave forms part of a massive upward impulsive third wave extension. The red count (below) is much more likely. I only considered the green count in response to 'what if?' questions. http://genaud.net/bitcoin/2011/20111030-1934-1month5CwaveSHourlyDown.png Title: Re: Elliott Wave Educational Video Series Post by: sadpandatech on October 31, 2011, 01:42:36 AM So, we didn't quite make $4, but $3.85 was pretty close and well within 3.iv (8-12 October). Notice that today 30 October, we've hit $3.2. On 23 October, 3.a peaked at $3.3. So, for all the rally bulls, either this little correction is gonna turn into an impressive third wave extension, or we've peaked at 4.c.v on our way down. Very interesting. And I am still following intently. =) I finally broke down and whipped out Ninja and G-bot (only ones I know that are cheap to free and not locked into predefined data brokers, etc, in order to give me more reason to follow all this a bit more closely. I have yet to check if there any pre-existing EWT scripts to run simulations off of though. Title: Re: Elliott Wave Educational Video Series Post by: netrin on November 02, 2011, 04:01:13 PM We are in a fourth wave correction since Monday (II.5.1.iv red), and no matter the outcome of these bounces, I expect bitcoin price will drop below $3.
http://genaud.net/bitcoin/2011/20111030-1934-1month5CwaveSHourlyNovember.png
http://genaud.net/bitcoin/2011/20111102-1245-4daysS5min.png Title: Re: Elliott Wave Educational Video Series Post by: S3052 on November 03, 2011, 09:37:39 PM As promised, some feedback on your EW count. Overall, I see the longterm wave count the same (I: big rise from Aug '10 to Jun '11. II: correction Jun '11 to date, III: huge rally once II is over). The only small issue is that the wave II correction can not be counted exactly that way. Wave a can't be counted in 5 waves and this is why the current c wave will also not be a 5 wave move. Wave II is not a simple a-b-c zigzag, but rather a more complex correction, i.e. a "double three". http://www.elliottwave.net/educational/basictenets/basics_images/fig_13.gif Title: Re: Elliott Wave Educational Video Series Post by: netrin on November 04, 2011, 06:10:53 PM Wave a can't be counted in 5 waves and this is why the current c wave will also not be a 5 wave move. Wave II is not a simple a-b-c zigzag, but rather a more complex correction, i.e. a "double three". http://www.elliottwave.net/educational/basictenets/basics_images/fig_13.gif Interesting. Do you think you could line up some of those points A, B, W, X with dates? The 12 June hack and sell off certainly messed up the trend :) http://bitcoincharts.com/charts/chart.png?s=2011-6-8&e=2011-11-8&m=mtgoxUSD&i=Hourly&c=1&l=1&t=S&width=450&noheader=1&height=200http://bitcoincharts.com/charts/chart.png?s=2011-6-9&e=2011-6-13&m=mtgoxUSD&i=Hourly&c=1&l=1&t=S&width=450&noheader=1&height=200 Title: Re: Elliott Wave Educational Video Series Post by: netrin on November 05, 2011, 09:00:17 PM While this (past?) week like most corrections has befuddled me, the downward meaning remains the same. Likewise, I have at least two alternative counts for the past week (no, BTCurious, none of them include a continuation of the corrective rally since 19 October). The hourly count (green) is typical bitcoin noise. Since Wednesday, I've recounted red iv as magenta ii, and the previous black 2 is now magenta iv. Neither count changes very much. We're trending down in all scales (seasonal II, monthly c, weekly 5, daily I, and magenta as either iii or v are both down).
http://genaud.net/bitcoin/2011/20111105-1607-1moSHour.png I'd be surprised to see a jump above $3 again for weeks. However, if that were to happen in the next few days, I'd say we're still in magenta ii (or iv Wednesday count) but the chart remains the same, just shifted forward for a longer round of bouncing. I believe S3052 is correct. My long term chart is technically invalid on the seasonal (II.a) scale. I considered the Mt. Gox hack to be invalid data. But I suppose that is not honest. It was a real event with major price implications. I'm still working on an alternate count. My eyeballs would make my old red b wave, S3052's X wave, and the implications could be more miserable than I have projected. We've got weeks before that would come into play before which I'll have a new yearly chart. Stock up on some rotten tomatoes. Thanks S3052 for the feedback. I appreciate it. Title: Re: Elliott Wave Educational Video Series Post by: netrin on November 07, 2011, 03:39:14 AM I'm playing with an alternate count based on S3052's comments. It does not necessarily change message, but does open up the possibility of further ugly corrective patterns (triangles, zig-zags, flats, oh my!), whereas the fifth impulsive wave of the final c should have been definitive.
Swannell (RIP September (http://www.tolivebychoice.com/life-goals/)) tells us that whereas upward fifth waves tend to be longest in commodities it is less true on down trends, where third waves tend to be longest for all asset classes. We'll have a better picture as we move out of the late October bear correction. Watch one, surf two and three, exit four, ride five. http://genaud.net/bitcoin/2011/20111106-2224-yearSDay9Oct9May.png http://genaud.net/bitcoin/2011/20111106-2338-7moSDay8June.png http://genaud.net/bitcoin/2011/20111107-0044-1moSHour.png Note: III is not five waves. The past week seems to have been and continues to be one big sideways corrections. Wednesday's count (https://bitcointalk.org/index.php?topic=49462.msg603999#msg603999) still looks as good as any. Title: Re: Elliott Wave Educational Video Series Post by: sadpandatech on November 07, 2011, 04:55:47 AM Good to see more of this from you, m8. Your labeling presentation and zooming has improved a lot, in the sense of someone like me being able to follow along easier. Thank you for sharing. Very unique person that Swannell, from what bit I have looked through so far on the link you posted. Humans have such short life spans, it makes it near impossible for those that wish to spread knowledge, love and good will to be able to do so as much as the world could surely use.... Cheers Title: Re: Elliott Wave Educational Video Series Post by: netrin on November 08, 2011, 04:27:40 AM Truth be told, I posted those only for the presentation. The above count has just been invalidated, now for two reasons. (1) Wave III was not itself five waves and (2) wave IV entered the price territory of wave one.
Earlier, I had rejected a count similar to that below only because sideways twos are half as likely as sharps (Swannell, 2003, p38 (http://ftp://ftp.elliottician.com/pub/ebooks/ERP1Results2003.pdf)). However, after this $3.2 pop up, not much else fits. Looking now at the smallest scales, I'm surprisingly happy with this count (stretching II from late October through this week). If correct, nothing prevents the price from rising above $3.5 or even up to $3.8 (beyond which the entire correction from 29 October comes into question). The dark bar demonstrates the fourth wave's violation of the first wave's price territory. The pink bar represents the expected price range of the retracement -- into the area of the fourth wave of the previous wave of the same degree. http://genaud.net/bitcoin/2011/20111108-0038-1moSHour.png Wednesday's count (https://bitcointalk.org/index.php?topic=49462.msg603999#msg603999) still looks pretty good, but the red i,ii,iii count fails on smaller scales (though bitcoin's low volume produces mostly noise on less than daily scales). We could be in any type of correction now, but if we allow for a very simple zig-zag or 3-3-5 flat for the previous and next few days, then we can expect a small impulse into the magenta iv range, around $3.3. We could just as easily fall from here. While the fourth wave of the previous downward impulse suggests a retracement between $3.2-3.3 (pink price band), it does not leave much room for a final five wave impulse for II.c. I have removed the count between magenta b and black II because I really don't know how it will play out. However, aside from negotiating pennies this week, none of these counts changes meaning significantly. We're in a small daily correction in a downward trend in all higher scales. http://genaud.net/bitcoin/2011/20111108-1133-2wkS30min.png Title: Re: Elliott Wave Educational Video Series Post by: netrin on November 09, 2011, 12:52:49 AM "Netrin, you've presented three different variations, but all of them result in a downward arrow. Why are you so bearish?"
http://genaud.net/bitcoin/2011/20111108-2023-3moSHour.png Notice the magenta bars mid September and most of October. Those represent the suggested corrective retracements ("A correction usually finds its [end] point in the area of the fourth wave of the preceding impulse wave of the same degree." -Robert Prechter 1988, if not earlier). It was hit dead center on 20 September and no less predictively on 29 October. Notice the grey bar 22 October through 8 November. This represents the 30 October failure of the hopeful fourth wave since the rally cum correction beginning 19 October. The fourth wave can not retrace into the price range of wave one nor two. That's not a suggestion, that's a rule. I and II must not be labeled 3 and 4. We should now expect, if we optimistically hope for a bullish rally, to see the third wave (cyan) manifest as a five wave (black) extension, labeled I,II,III,IV and 3.V on the chart above. Note that III must not be shorter than I (and likely longer), nor may IV retrace into the price range of I and II (cyan bar in the chart). 3.V should extend above III and given that bitcoin acts as a futures commodity we would expect prices ending well above $6, pehaps the double digits. It could happen. I'd love it. But I'm not holding my breath. Title: Re: Elliott Wave Educational Video Series Post by: S3052 on November 09, 2011, 12:09:16 PM There are multiple options in the short term and this leads to a lot of uncertainty in the outlook.
This is why it is best to step back and let the market make a decision. Long and mid term charts are still all pointing down . A prudent investor would either wait until btcusd rises above 5$ or wait until the pattern becomes clearer. Title: Re: Elliott Wave Educational Video Series Post by: netrin on November 10, 2011, 01:32:15 AM I agree that the short count on this sideways correction is difficult, but I believe the larger trends are unambiguously pointing down.
29-31 October is a five wave downward impulse with an extended third after mid October's textbook zig-zag. I see no other viable October count. Whether November has drawn a complex second wave or a fourth wave after a pathetic third, I am not sure. But the larger message seems clear. Gravity is a powerful force and bitcoins are heavy. "Paddle out and watch the first wave, dive under the second, ride the third, exit the fourth, ride the fifth." -- wave surfer, Elliott Island The drop from the II.c $3.2 peak early 8 Nov looks impulsive, though I'm not ready to label even the first wave on any scale. Title: Re: Elliott Wave Educational Video Series Post by: netrin on November 12, 2011, 10:43:45 PM http://genaud.net/bitcoin/2011/20111112-1737-1moSHour.png
Above, I have two counts. The count on the prices (above) are valid. Those below the prices (identical to the 30 October count (https://bitcointalk.org/index.php?topic=49462.msg603999#msg603999)) are not valid, but look more realistic as long as we don't look too closely at the hourly sub-waves. Magenta a above or black IV below (2 Nov. $3.45) display picture perfect three waves. Afterwards, it is not possible to count five waves, so corrective magenta b is better than impulsive 1.V (5 Nov. $2.85) though the cyan count looks better in my opinion. Wave W or 2 (8 Nov. $3.2) is definitely corrective. Wave 2 (below) returns dead center into the suggestive fourth wave (in the below count, bigger than the magenta bar, III-IV or $3.1-$3.4). The next magenta 'a' surprised me (today. $3.1). I expected to see at least one more wave down (there is no way to count five valid waves). The lower count black II looks pretty good (as long as the price stays below $3.2). Either way, a or II, it's corrective. I predict we'll drop down below $3 very soon, but what's next? I expect much lower, but I might exit my shorts just below $2.7. For giggles, here is 30 Oct's count (https://bitcointalk.org/index.php?topic=49462.msg603999#msg603999) with eleven more days of data: http://genaud.net/bitcoin/2011/20111112-2016-45daySHour-2NovRetro.png Something like this (as long as prices remain lower than $3.2, otherwise II could be 2, stop at $3.45): http://genaud.net/bitcoin/2011/20111112-2146-1moS30min.png Title: Re: Elliott Wave Educational Video Series Post by: ElectricMucus on November 14, 2011, 03:53:50 PM http://img707.imageshack.us/img707/3637/charto.png
Ok because of the invitation you'd have to endure my interpretation of Elliott Waves on the bitcoin price. Is there something fundamental wrong about it? (I made it according to your explanation.) I used the Aron Up Down indicator to get the most significant highs and lows to date. There are 5 waves and all end up on their respective most signifcant Aron values. (About the first wave, it could actually start as zero since bitcoin wasn't initially traded for currency and given away for free.) Title: Re: Elliott Wave Educational Video Series Post by: netrin on November 17, 2011, 02:41:41 AM http://genaud.net/bitcoin/2011/20111116-2230-1moSHourBlack.png
As for the yearly chart, my bet is on another zig-zag similar to mid August through mid October (x-a=zig, b-II=zag). It is unlikely (impossible?) that we'll see a fourth combined correction down (else we might just call bitcoins dead). Despite the massive bid wall at $2.1, I believe the price will continue into the $1's in the short term. However, no matter where V bottoms (even well below $2), the correction (cyan b below) will likely retrace back into the large price territory of wave IV $2.1-$2.6 before sliding back into the $1's not to return for a long time. http://genaud.net/bitcoin/2011/20111116-2200-1yearFebSday.png Title: Re: Elliott Wave Educational Video Series Post by: ElectricMucus on November 17, 2011, 03:02:40 AM No opinion on my interpretation?
Title: Re: Elliott Wave Educational Video Series Post by: netrin on November 18, 2011, 05:44:38 AM While Aroon, RSI, or other indicators might hint at peaks and troughs, I would not expect Aroon to be a reliable determinant. Even so, there are multiple significant Aroon peaks you overlook, such as January, several in April, May, and many others. Looking at your count specifically: Wave two (orange) can not drop lower than wave one (red). Though if we, as you suggest, assume wave one starts at $0, then wave three is the shortest wave of one, three, and five. So depending on your starting point, either rule #1 or #2 (http://en.wikipedia.org/wiki/Elliott_Wave_Principle#Elliott_wave_rules_and_guidelines) is violated. Rule #3 looks kosher: Wave four (purple) must not enter the price territory of either one or two. My long term chart specifically cuts out earlier Mt. Gox history (about two months later than your start date). Perhaps I'm guilty of selective data, but I simply find the early data unreliable and also avoid accounting for the 'missing' data since Satoshi's gensis block January 2009. Title: Re: Elliott Wave Educational Video Series Post by: ElectricMucus on November 18, 2011, 07:57:28 AM Ok, you are right there is something wrong if I interpret absolute peaks as endpoints of the waves.
However: If I use the "typical price" I get a wave which fully conforms to the requirements! The indicator doesn't make much sense here but I would still draw them this way if confronted with this chart. http://img502.imageshack.us/img502/3082/charttp.png Title: Re: Elliott Wave Educational Video Series Post by: netrin on November 18, 2011, 12:58:02 PM You present a valid count. I question why you ignore the all too obvious peak in February, March correction and impulse beginning early April. I don't deny, as you attempt to show, that Elliott waves have an aesthetic/subjective component. However, the market is reacting to this same publicly available aesthetic picture. The entire bitcoin community has agreed that there were doldrums during March and a huge impulse (some say bubble) April-June. Your Elliott waves should reflect and predict sentiment. As a side note, Swannell's work in the past decade includes a deterministic Elliott wave algorithm, real-time computation, and statistics with thousands of price histories across multiple asset classes. For example, his work questions Elliott's earlier assertion that within an impulse wave, subwaves 2 and 4 will often take alternate forms. His statistics find that wave 4 is most often sideways nearly irrespective of wave 2's form. And, as I mentioned in PM, the fifth wave bias of commodities are less pronounced during downward trends, in which case third waves are likely to be longest regardless of asset class. Title: Re: Elliott Wave Educational Video Series Post by: ElectricMucus on November 18, 2011, 05:17:29 PM The reason why I ignore the peak in February is just to demonstrate this subjectiveness.
Also since you quoted it yourself: In commodities wave 5 is usually the largest so I guess the whole point in whenever my count would turn out to be true is whenever bitcoin turns out to be mainly a commodity not a currency. So to say it in other words: If the bitcoin economy remains less relevant it could be possible that the price crashes much further than you would initially expect. There are people who are convinced that bitcoin is a classical speculative bubble and if this turns out to be true the wave count I presented here could match that conclusion. As for myself admit that I just don't know whenever bitcoin is a bubble or not and I think it is too early to say this for certain. There is a significant economic development taking place and if we are growing in the next couple of month I strongly believe that your wave count will be the best prediction. Its also some "gut feeling" I have that with current sediment the price could drop much further. The main reason for this I don't see a development into the direction of maturity taking place yet, there was a glimpse of hope when the "Bitcoin Foundation" was proposed but people weren't supportive enough. I mainly view the fundamentals to predict any long term price movements. It's the Gartner Hype Cycle I'm talking about. To be able to say that the price will be raising again would mean that we are at the slope of enlightenment. That means developments which will shape the future outlook for bitcoin in a permanent way will become apparant. So in short: If I see such a development during the next 2 months I'll support your thesis. Title: Re: Elliott Wave Educational Video Series Post by: netrin on November 18, 2011, 07:48:52 PM The reason why I ignore the peak in February is just to demonstrate this subjectiveness. Your subjective objective was obvious. Do not confuse objectivity with falsifiability nor subjectivity with lack thereof. Just because something is difficult to statistically control does not make it any less valuable or predictive, it only means you have to try harder if you're trying to publish a peer reviewed methodology. I've found Elliott waves to be enormously valuable, both predicting price movements and also for immediate in/validation which has allowed me to terminate positions with minimal loss. It is my subjective opinion that your count is inferior to mine and I believe you would agree. Your subjective point was made, but you will find no argument. All technical analysis is subjective, even if that subjectivity is programmed. There were obvious price channels you arbitrarily ignored. I could program (objective) software to make a best fit in retrospect. It would not come up with your chart. What is more difficult for (eyeballs or software written by) humans is to count Elliott waves in real time. This is an art form. But past performance can be objectively measured. Some humans are better at it than others. Computers can not yet play a decent game of go. While difficult to quantify (write an AI algorithm), it is no less possible to objectively claim that a professional has great skill, or race car driver, ballet dancer, football player, METAR/TAF weather forecaster... Quote Also since you quoted it yourself: In commodities wave 5 is Bitcoin has consistently expressed currency and commodity like properties rather than behaving like a stock chart. For example, the triangle from early this month took me off guard, because they've been rare ("Ending Diagonals appear in Wave 5 about three times as often in stock markets than commodities markets." Swannell, p59, 2003). If fact! I've just come across this again now, "Wave 2 can be any corrective wave except a Triangle" (Swannell, p63, 2003, but not Elliott). Just because commodity charts often exhibit longer fifth waves on up trends (whereas stock charts tend to exhibit longer third waves) does not at all mean that a fifth wave MUST be longest. Bitcoin's extended fifth wave April-June should not surprise us and lends weight to the assertion that bitcoins behave like currency and commodities but not stock. That does not mean that any 'ole longest five wave count is ideal. There are many other factors of which you are ignorant or have intensionally ignored. Most significantly is that every Elliott wave consists of smaller Elliott waves (and by implication, are members of larger Elliott waves). There are also suggestive price targets within each subwave which lend strength to a particular count. To count a single series on a single time scale is as good as rolling dice. "Wave three is usually the largest and most powerful wave in a trend (although some research suggests that in commodity markets, wave five is the largest)." (Wikipedia (http://en.wikipedia.org/wiki/Elliott_Wave_Principle#Elliott_Wave_personality_and_characteristics)) "Wave 3 must never be the shortest by price when compared to Waves 1 & 5" (Swannell p37, 2003) Quote So to say it in other words: If the bitcoin economy remains less relevant it could be possible that the price crashes much further than you would initially expect. ... Its also some "gut feeling" I have that with current sediment the price could drop much further. Drop further below $0.6 ?! $0.6 to $1.1 is suggested by the previous fourth wave. It is not guaranteed, but I give it about 70% likelihood. Quote There are people who are convinced that bitcoin is a classical speculative bubble and if this turns out to be true the wave count I presented here could match that conclusion. June was a bubble (which is typical of fifth waves), however bubbles collapse violently or symmetrically at best. The bubble and pop is over. Bitcoins are expressing a classic corrective pattern thus far. It could drop to zero, but I do not think so out of fundamental (not technical) conviction. Quote ...if we are growing in the next couple of month I strongly believe that your wave count will be the best prediction. ... So in short: If I see such a development during the next 2 months I'll support your thesis. I'm not sure you can say with a straight face that, if I am proven correct in a couple of months, then my prediction would have been best. My predictions HAVE BEEN accurate in the past and MIGHT continue to be proven correct in the future. Title: Re: Elliott Wave Educational Video Series Post by: ElectricMucus on November 18, 2011, 08:15:57 PM Yes, further than 0.6.
The reason being the diminishing incentive to use it as a currency the less stable the price is. I know these arguments: If it drops to (insert any low price) someone could buy up all the bitcoins in existence, etc.. My point being: They wouldn't want to. At a price of 0.1 - 0.2 USD all bitcoins ever to exist would still be worth 2.1 - 4.2 million USD. (less half on that with the ones currently issued) And while there are individuals which could buy alot of coins (some might) at this point it will be questionable if this is a wise investment. (While in fact it is not, it is just that bubbles can occur in 2 directions) Furthermore if you view bitcoin as a currency there would have to be much much wider use and a much bigger economy behind it. Statements that bitcoin could be just "an investment" because it is "scarce" are delusional IMO. Bitcoin needs the economy behind it which was the point to speculate which it in the first place, and I think to value this economy around above figure right now would be a pretty good estimate. I even think that the economy behind bitcoin is smaller than that yet, so that figure factors in a (healthy) amount of speculation. There are 2 different Schools of Thought at work here, lets see which one will turn out to be correct. Title: Re: Elliott Wave Educational Video Series Post by: netrin on November 18, 2011, 08:37:06 PM ...triangle from early this month took me off guard, because they've been rare ("Ending Diagonals appear in Wave 5 about three times as often in stock markets than commodities markets." Swannell, p59, 2003). If fact! I've just come across this again now, "Wave 2 can be any corrective wave except a Triangle" (Swannell, p63, 2003, but not Elliott). Hmm... So, while valid Elliott waves, my count present invalid "Swannell waves". What could that mean? Well if I respectfully favour the late Swannell (September 2011) over the late Elliott (January 1948), I'd have to squeeze the first two weeks of November into a fourth wave. Some of my previous counts actually do that: Remove black I-II; Move magenta iv to where black II was; Replace black III with magenta v, completing the first black I at $2.1 on 15 November. http://genaud.net/bitcoin/2011/20111116-2230-1moSHourTrangleIV.png I'd probably change the colours (black becomes cyan, magenta becomes black) to stay consistent with higher scale charts. I'd also probably favour a final zig-zag pattern cyan 5-3-5 until the very bottom of major blue wave II (seen far above in this thread). What difference would that make? Not a whole lot, except more extreme price ranges. Old black IV (now 'a') would be part of a new bigger second wave, that could find its peak in the price range of the previous grey iv triangle, $2.8. Is $2.8+ likely? So far it doesn't look likely (I still have my stops [ Yes, further than 0.6. The reason being the diminishing incentive to use it as a currency the less stable the price is. I know these arguments: If it drops to (insert any low price) someone could buy up all the bitcoins in existence, etc.. I'd like to stay on the "Elliott Education" topic, as there are already numerous threads discussing other technical, fundamental and seat-of-the-pants nonalysis. I'll respond from my/an Elliott perspective. "Wave two corrects wave one... Typically, the news is still bad. As prices retest the prior low, bearish sentiment quickly builds, and "the crowd" haughtily reminds all that the bear market is still deeply ensconced. Still, some positive signs appear for those who are looking: volume should be lower during wave two than during wave one, prices usually do not retrace more than 61.8%... of the wave one gains, and prices should fall in a three wave pattern. ... As wave three starts, the news is probably still bearish, and most market players remain negative; but by wave three's midpoint, "the crowd" will often join the new bullish trend. Wave three often extends wave one by a ratio of 1.618:1." (Wikipedia (http://en.wikipedia.org/wiki/Elliott_Wave_Principle#Elliott_Wave_personality_and_characteristics)) Since S3052's double three (https://bitcointalk.org/index.php?topic=49462.msg605848#msg605848) suggestion, and my later triple three (https://bitcointalk.org/index.php?topic=49462.msg609183#msg609183) combined correction, I've held the belief that any indication of a 'quadruple' combination signals the death of bitcoin. I personally am not so morbidly bearish. I would buy like mad at $0.6. Title: Re: Elliott Wave Educational Video Series Post by: ElectricMucus on November 18, 2011, 09:09:39 PM I'd like to stay on the "Elliott Education" topic, as there are already numerous threads discussing other technical, fundamental and seat-of-the-pants nonalysis. I'll respond from my/an Elliott perspective. Of course, but this is Economy, not the Speculation subforum. All I say is that there are (at least) 2 different ways to draw the waves, and each one corresponds to a particular economic development. And I think in case of bitcoin Elliott describes this choice. We are facing a crossroad which will determine the future role of bitcoin. I hope that your prediction turns out to be true, bitcoin would be far more useful if prices would recover quickly. But what someone wants and what could happen are 2 different things. We can continue our debate next year when we should have enough data to draw a preliminary conclusion. :) Title: Re: Elliott Wave Educational Video Series Post by: netrin on November 19, 2011, 04:11:56 AM :) Well, I'm not even the OP. I hijacked this thread from aptly named Mr. BitcoinBull.
All I say is that there are (at least) 2 different ways to draw the waves, There may be billions of ways to count waves, but not all counts are equal. I pay no heed to a chart which is blind to the April-June correction. Just as accurately, subjectively and superficially as facial recognition, I recognize April-June as the fourth wave of the yearly impulse. I don't 'want' bitcoin to reach $0.6-1.1; That price is suggested by the fourth wave. That count and its sub-waves have proved to be quite predictive. Counts on numerous scales form a lattice which reinforce each other and subsequent counts. My counts are generally built from six degrees. I analyze hourly charts (green and magenta) in order to execute daily trades (black and cyan) which build a reliable case for monthly scale counts (red and blue). Title: Re: Elliott Wave Educational Video Series Post by: S3052 on November 19, 2011, 10:09:39 AM Netrin: you are doing great with Elliott Wave analysis. Have you thought about a thread here: http://www.bitcoinbullbear.com/forum.html#/news/ (http://www.bitcoinbullbear.com/forum.html#/news/)
Title: Re: Elliott Wave Educational Video Series Post by: netrin on November 26, 2011, 10:54:10 PM Thanks S3052. I think there is more exposure here and even dismissive/troll-y posts force me to reconsider alternative counts, which is only good. But I'll move immediately if this forum drops embedded images.
http://genaud.net/bitcoin/2011/20111112-2016-45daySHour-26NovRetro.png (http://genaud.net/bitcoin/2011/20111112-2016-45daySHour-26NovRetro.png) Continuing with the preferred 30 October count (https://bitcointalk.org/index.php?topic=49462.msg603999#msg603999) (extended with new data above), our little rally (black wave 4, implied but not drawn on the chart) must not breach $2.8 (the real bottom of 1.v). $2.6-ish is a more likely peak. If the fifth wave fails to break below $2, then we begin a slow but grand yearly blue wave III toward new heights. My interpretation since 14 November is a corrective fourth wave extended/expanded flat. We are now in the c and final wave, which should exhibit five sub-waves, were hourly wave counts reliable. http://genaud.net/bitcoin/2011/20111102elliott5_clip_7_23_fall_flat.jpghttp://bitcoincharts.com/charts/chart.png?m=mtgoxUSD&l=1&t=W&c=1&s=2011-11-14&e=2011-12-1&i=30-min&width=350&noheader=1&height=200 Though I'm betting against it, if this rally peaks in the $2.8-$3.45, it would retro-actively suggest the "Swannell wave (https://bitcointalk.org/index.php?topic=49462.msg623265#msg623265)" count I shared last week. It would imply that the previous $3 sideways correction were a fourth wave, the drop a fifth wave, and our current rally a correction of a higher degree. Anything above $3.45 (before testing and possibly breaking below $2) invalidates all of my counts for the past month or two (reversal, month long triangle, downward impulsive failure). http://genaud.net/bitcoin/2011/20111126-2315-2moSHour19Oct19Dec.png
Title: Re: Elliott Wave Educational Video Series Post by: ElectricMucus on November 27, 2011, 08:59:17 PM It seems your prediction might turn out to be true after all, there seems to be some pump going on @2.46.
Whoever is doing this is still jumpy but at least he is careful enough to be safe from the shorts. Thanks for the warning if it really gets there :) Elliot seems to have predictive power where other mechanisms fail to indicate a specific direction (I use Aroon, as discussed) which was inconclusive during this day. I wonder if this is just random chance or a self fulfilling prophecy though, since I still don't get why market movements should always follow the 3 up 2 down wave pattern. It seems kind of arbitrary to me. I understand that there is a trend for repeating corrective series in any market, but why 5 waves? Title: Re: Elliott Wave Educational Video Series Post by: S3052 on November 27, 2011, 10:08:06 PM It seems your prediction might turn out to be true after all, there seems to be some pump going on @2.46. Whoever is doing this is still jumpy but at least he is careful enough to be safe from the shorts. Thanks for the warning if it really gets there :) Elliot seems to have predictive power where other mechanisms fail to indicate a specific direction (I use Aroon, as discussed) which was inconclusive during this day. I wonder if this is just random chance or a self fulfilling prophecy though, since I still don't get why market movements should always follow the 3 up 2 down wave pattern. It seems kind of arbitrary to me. I understand that there is a trend for repeating corrective series in any market, but why 5 waves? Some years ago I was similarily surprised like you about the predictive power of Elliott Waves. A great book that uncovered the fundamentals behind it is Elliott Wave Principle Key to Market Behavior http://www.elliottwave.com/books/ewp/default.aspx?code=ecg (http://www.elliottwave.com/books/ewp/default.aspx?code=ecg) This will probably answer some of your questions (I have no affiliation with ElliottWave.com or Robert Prechter) Title: Re: Elliott Wave Educational Video Series Post by: netrin on November 27, 2011, 10:58:13 PM I really don't know why impulses are five waves rather than say seven waves. However the question is a bit backwards (http://en.wikipedia.org/wiki/Anthropic_principle). As with any fractal, if the pattern were not self-similar on all scales, there would be no pattern at all.
S3052, does Pretcher argue convincingly for the Fibonacci series? I find 2/3 and 3/2 reasonable approximates, but unreliable. Corrections to the previous fourth wave however has been incredibly predictive. Title: Re: Elliott Wave Educational Video Series Post by: netrin on November 27, 2011, 11:18:25 PM A failed fifth wave often resembles a fourth wave triangle. A failed fourth wave (1,2,3,4) resembles a corrective reversal (a,b,c,1). A combined corrective zig-zag resembles an impulsive wave somewhat. There are many such seemingly ambiguous situations, however the previous waves indicate the present wave, which all fit within a model of a higher scale.
I've had incredible confidence regarding the correction during the last two weeks of October, but have been puzzled by the sideways correction early November, which is making it difficult to confidently count the present situation. This muddy count keeps me on the lookout for a reversal, impulsive failures, and triangles. I am very confident bitcoin is at or approaching the bottom as there are conflicting trends and tension on all scales. Title: Re: Elliott Wave Educational Video Series Post by: ElectricMucus on November 27, 2011, 11:20:36 PM I really don't know. However the question is a bit backwards (http://en.wikipedia.org/wiki/Anthropic_principle). As with any fractal, if the pattern were not self-similar on all scales, there would be no pattern at all. Not good enough, since it is possible to approximate any signal with any periodic oscillation. Sine Waves, sawtooth, triangle, square waves, wavelets, curvelets, etc.. S3052, does Pretcher argue convincingly for the Fibonacci series? I find 2/3 and 3/2 reasonable approximates, but unreliable. Corrections to the previous fourth wave however has been incredibly predictive. Now we are talking, yes if you consider the Fibonacci Series 3, 5 are a unique pair which can be enumerated as this impulse wave movement. However there is also 2,3 and 1,2 which has the same property plus there is 1,1 which has the inverse property of them all. Of course 3,5 would be the most complex and useful and the other ones are no doubt a subset but that shouldn't mean they couldn't serve as a primary wave. (As of carrier or first order or whatever it is called by Elliott) Some years ago I was similarily surprised like you about the predictive power of Elliott Waves. A great book that uncovered the fundamentals behind it is Elliott Wave Principle Key to Market Behavior http://www.elliottwave.com/books/ewp/default.aspx?code=ecg (http://www.elliottwave.com/books/ewp/default.aspx?code=ecg) This will probably answer some of your questions (I have no affiliation with ElliottWave.com or Robert Prechter) Thanks, let me guess the site requires a credit card, ironically... Title: Re: Elliott Wave Educational Video Series Post by: netrin on November 28, 2011, 12:16:42 AM Not good enough, since it is possible to approximate any signal with any periodic oscillation. Sine Waves, sawtooth, triangle, square waves, wavelets, curvelets, etc.. Sine waves are Now we are talking, yes if you consider the Fibonacci Series 3, 5 are a unique pair which can be enumerated as this impulse wave movement. There's some fun Fibonacci math: 3 corrective waves + 5 impulsive waves = 8 waves. The three corrective waves consist of 5+3+5 = 13 subwaves. The five impulsive waves consist of 5+3+5+3+5 = 21 subwaves. Together that's 34 subwaves. At a higher order, five + three + five = 21 + 13 + 21 = 55 corrective sub-subwaves preceded by five + three + five + three + five = 89 impulsive sub-subwaves for a grand total of 144 sub-subwaves. You can continue this math-erbation for higher scales and extend the sequence below: 0 , 1 , 1 , 2 , 3 , 5 , 8 , 13 , 21 , 34 , 55 , 89 , 144 , 233 , 377 , 610 , 987 , 1597 , 2584 , 4181 , 6765 , 10946 , 17711 , 28657 , 46368... But we should not be too surprised by the results of the application of the Fibonacci definition. Fibonacci as it relates to Elliott, as I understand Pretcher, is the ratio between any two elements of the sequence, not the sequence itself. In other words, the Golden ratio: (a+b)/a = a/b = 1:.61803... 2 / 3 = .66667... 21 / 34 = .61765... 233 / 377 = .61803... 2584 / 4181 = .61803... 28657 / 46368 = .61803... If an impulsive wave is 89 sub-subwaves, should we expect a 55 sub-subwave correction to retrace 1-.618 = 38.2% ? Well sure, except when it's 61.8% or 50% or 14.6% or 23.6% or 12.3456789% or... And that's the problem I have with Fib and prices. Wave price movements, in my experience, have only slightly better than no relationship to the golden ratio. BUT the golden ratio is an aesthetic. When I draw counts I place future counts where they 'look good' within various price suggestions and Elliott rules. 1/3, 2/3, and 3/2, tend to be more aesthetically pleasing than 1/2, and 2. I don't know why, but the market appreciates beauty. Title: Re: Elliott Wave Educational Video Series Post by: ElectricMucus on November 28, 2011, 01:18:56 AM BUT the golden ratio is an aesthetic. When I draw counts I place future counts where they 'look good' within various price suggestions and Elliott rules. 1/3, 2/3, and 3/2, tend to be more aesthetically pleasing than 1/2, and 2. I don't know why, but the market appreciates beauty. I never understood the whole Fibonacci numerology cult. No... As a somewhat hobby number theorist I have to say the following: The aesthetic ratios relate to prime numbers and that the ratios contained in the Fibonacci sequence are aesthetic is a mere coincidence. (or not depending on how you put it.) What is important is they are only a substet of particular aesthetic ratios. I traveled this road, all the way over the Phyllotaxis Spiral to the Riemann Hypothesis. We are dealing with only a miniscule part of the matrix, don't get me started ;) Did you know you can enumerate the elements of the old periodic Table perfectly to the basic audioactive decay elements of the look-and-say sequence? Nothing less than a conspiracy theory hidden in the fabric of math ;D Title: Re: Elliott Wave Educational Video Series Post by: netrin on November 28, 2011, 03:24:33 AM Please, get started...
Title: Re: Elliott Wave Educational Video Series Post by: ElectricMucus on November 28, 2011, 04:04:41 AM Ok but where?
Alright I'll try... Fibonacci Numbers and the golden Ratio occur in Nature although not as often as generally believed. The phyllotaxis is one of the few examples where the Sequence occurs in its actual form. The floret show arithmetic progressions with Fibonacci differences. They are also a particular efficient natural prime number sieve. Prime numbers occur in Nature every time a periodic system must minimize resonance effects. We experience these resonance effects as aesthetic the arising complexity of combinations as beauty. There is a way to calculate the aesthetics of a particular ratio, this was used by Euler to describe the aesthetics of musical intervals as a generalization. But it holds also true for other cases were ratios occur. The formula used describes a "Gradus Function" which attributes a rating to any integer. This rating is calculated by summing the product of its prime factors and their exponent. Implementing said function in a memory efficient way is related the PI function, the number of prime numbers below a certain limit. This function can only exactly formulated once there is an answer to the Riemann Hypothesis and only by using an assumption of truth and precomputed values can it be improved. This is my 1234th post ;D Title: Re: Elliott Wave Educational Video Series Post by: netrin on November 28, 2011, 05:23:19 AM Did you write this? It's an absolutely beautiful collection: http://www.vortexmath.com/a-fibonacci-phyllotaxis-prime-number-sieve
Prime numbers occur in Nature every time a periodic system must minimize resonance effects. We experience these resonance effects as aesthetic the arising complexity of combinations as beauty. We experience the resonance as beautiful in a minimal resonant system? Some perfect harmony between absolute order and total entropy, maybe? There is a way to calculate the aesthetics of a particular ratio, this was used by Euler to describe the aesthetics of musical intervals as a generalization. Do you have a reference to this specifically? What does this Gradus Function tell us? Are these correct? 6 --> (2+1) x (3+1) = 12 7 --> (7+1) = 8 8 --> (2+3) = 5 Title: Re: Elliott Wave Educational Video Series Post by: ElectricMucus on November 28, 2011, 07:15:56 AM Did you write this? It's an absolutely beautiful collection: http://www.vortexmath.com/a-fibonacci-phyllotaxis-prime-number-sieve No that's not me ;) But that's where I heard about that fact which inspired me to buy "the book of numbers" where this initially from. The guy behind this may bright but has wrong concepts about physics imo. He attributed particular importance to the number 10 and it in a circle-jerk about "quantum numerology". I view numerology as a misguided esoteric concept. (More on that later) We experience the resonance as beautiful in a minimal resonant system? Some perfect harmony between absolute order and total entropy, maybe? I haven't yet figured out if there is something as total entropy. It is said to be the golden ratio but according to Eulers theory this would hold true for any irrational number. There may be some merit to it since Phi is the most efficient way to arrange something like a sunflower daisy. Do you have a reference to this specifically? What does this Gradus Function tell us? Are these correct? 6 --> (2+1) x (3+1) = 12 7 --> (7+1) = 8 8 --> (2+3) = 5 The other way around and the one is also included for some reason (In the past it was considered prime) 6 --> 1 + 2*1 + 3*1 = 6 7 --> 1 + 7*1 = 8 8 --> 1 + 2*3= 7 Is called the "Tentamen novae theoriae musicae" and is of the rare cases google finds viable information because of the weird latin name :) The number used as the input is the least common denominator of all integers involved in a system. I think work very well to be used as a generalization of the so called Fibonacci Retracements. So while it would include the commonly used ratios it would also introduce new ones and we would be able to weight them according to their gradus function value. The only exception may be the ones including the prime factor of 5 because of the trend to have resistance levels around "whole" fractionals like 2, 2.5 2.25 and so on. In our culture we happen to use a basis of 10 number system which might suit us because we have 10 fingers but any other number system works the same and there is no particular unique property about it I know of. The mayas used 20 maybe they were also counting their toes. :D The whole concept of numerology is based upon the numbers 10 and 12 which have no unique property whatsoever form a purly mathematical standpoint if used as a number system. Btw the number system with the best entropy is trinary which is the best approximation of the idealistic (but unobtainable) value of e. It is for example most efficient to construct a multiple choice phone menu with a tree of 3 choices. Title: Re: Elliott Wave Educational Video Series Post by: netrin on November 29, 2011, 11:33:02 PM Today's decisive spike up just shy of $3, invalidated the 30 October count (https://bitcointalk.org/index.php?topic=49462.msg603999#msg603999) upon crossing above $2.8 (the grey bar). This leaves the "Swannell wave (https://bitcointalk.org/index.php?topic=49462.msg623265#msg623265)" as the most likely count.
Though ugly, it has a few advantages in retrospect. Cyan 2 moves perfectly into the price territory of the previous black wave IV (cyan bar $2.8-$3.45). It validated my extended green count and didn't have the 'squeeze' problem (three waves between $2.6 and $2.8) of the 30 October count. Interestingly enough, the Swannell count is the only strictly valid count on the magenta hourly scale that I've drawn since 2 November. Perhaps there's a lesson there? http://genaud.net/bitcoin/2011/20111129-1923-2moSHour19Oct19Dec.png Title: Re: Elliott Wave Educational Video Series Post by: sadpandatech on November 30, 2011, 12:06:15 AM Heya, just popping in to let you know I'm still lurking here. =) Thank you for continuing this and explaining what you are doing. It is also nice to see someone else joined in that actually understands some of this stuff.
Cheers Title: Re: Elliott Wave Educational Video Series Post by: netrin on November 30, 2011, 12:32:30 AM Please challenge, ask questions, spit on the floor. Otherwise, I'm just talking to myself.
Title: Re: Elliott Wave Educational Video Series Post by: ElectricMucus on November 30, 2011, 04:04:35 AM I have been thinking if it were possible to develop a program which parses the mtgox trade api data and enumerates the possible wave counts so that we see which possibilities are there. You mentioned that if taken that effort Elliot might not be the best choice, but there is something similar with sine functions which also forms a 1-dimensional fractal curve.
http://en.wikipedia.org/wiki/Weierstrass_function PS: Any thoughts on my suggestion on Fibonacci Retracements? Title: Re: Elliott Wave Educational Video Series Post by: netrin on November 30, 2011, 05:13:29 AM Re: fibonacci: I went on a serendipitous scavenger hunt through your references and somehow ended upon learning a bit of Haskell. I think it was something about simplified code beautification. :) My Latin is a bit rusty and didn't find much meat in English. I lost your train of thought from Fib to Gradus to Retracement.
I intend to go through my own charts and do some statistics on the previous fourth wave retracement; Wave 2 and 4 alternation; and longest of waves 3 and 5 (but my charts are already influenced by what I believe to be statistical likely). There are innumerable statistics to be obtained and it would be wonderful to remove the subjectivity. Swannell had many of these statistics but he went off to Fiji and died on us this summer. I've seen several pages of his results, but none of the raw data. Anyway, yes, It's possible and would be very interesting to write an Elliott calculator. I can already imagine how it might work, though I'm sure there are many demons in the details. It's no simple weekend project. You may note that Swannell added many new rules (beyond Elliott's three) to restrict the number of possible counts. I already think there's much too much variability in the corrective wave types. I'd rather say there are x impulsive types and y corrective types and when none or multiple fit, you'd have to say for example, it's 57% type a and 58% type b and only 12% type c. Whether the result would still be truly Elliott, I don't know, and perhaps I don't care, as long as it's predictive. Re: Weierstrass: Yup, this is why I had to add some pathological parenthetical tap-dancing around my statement that sine waves were 'never' self-similar. But where are you going with that? Title: Re: Elliott Wave Educational Video Series Post by: ElectricMucus on November 30, 2011, 05:50:12 AM The Weierstass function (or its generalization) could be matched to the chart/trade data. And we would receive some sort of prediction what could happen next.
I don't know whenever it would be better than an Elliott wave but it would be than a simple linear trendline since it would match periodic fluctuations. One thing however about all those predictive graphs: They cannot take into account the actions of the large players like the one who made the price drop from 3 in the first place and the individual placing the bidwalls at 2 and now 2.6. Also I don't think the extreme spikes necessarily invalidate a count if they are caused by bitcoinca forced liquidations. The rapid rise above 2.95 was the result of one (mine actually :-[, but I'm not complaining, gambling is what it is) My point being: I wouldn't have bought at those levels nor anybody else. So there are alot of things happening not happening in a normal market. Title: Re: Elliott Wave Educational Video Series Post by: netrin on November 30, 2011, 06:20:24 AM It's true that a single large player in a light market can screw up the predictive nature of Elliott, as it generally relies on herd mentality; Everyone reacting to everyone else, confirming or denying each other uncertainties. We are all looking at the chart and creating a model in our heads. We are all seeing similar patterns and will often react similarly. Those that see the most likely pattern first make the pattern occur.
If I can see that an up trend is developing and is likely, I will buy. If I was sympathetic to what others already saw (or will see as a result of my action) then a feedback is enforced, and the up trend is fulfilled. We've often seen a long sideways flat correction and then an impulsive move (down was most common in the past few months) followed by another flat correction. The market learned to fear another drop and so it will happen. Eventually (third impulse) weak players have learned the trend and the strong will take advantage. Heavy players react to the same information, but its less of a feedback loop if there are limited numbers of movers. I was not surprised by the drop down from $3. We could all see that the rally from late October had failed. We hoped that the price would rise from the flat correction, but we all feared it would drop. Very few wanted to make the first move. But once it happened our fears were confirmed. Yesterday was different, we had already seen a steady incline and were prepared for more. Elliott told us to expect a five wave C wave (though not necessarily how high - I certainly failed that prediction, relying on a poor early November count). There are times when it seems a single player makes a move and we all look at it and just think, "he must have bumped into his keyboard". It doesn't fit any pattern and so the price comes back immediately. Title: Re: Elliott Wave Educational Video Series Post by: netrin on December 01, 2011, 02:26:28 AM Before drawing the chart below, I described the green count and a peak at $3.1. While drawing the chart I decided to shift green 3 and 4 slightly to the right and up (a cup of tea in both time and price), thus predicting a peak just a splash above $3.1 (2.C.v.5 - that's big cyan 2, black C, magenta v, and little green 5 all in one) before returning to the impulsive downward trend toward $2 or below, despite the massive bid walls. The right-up shifted green 3 and 4 are preferred because:
http://genaud.net/bitcoin/2011/20111130-2200-3wkS30min19Nov9Dec.png Title: Re: Elliott Wave Educational Video Series Post by: bitcoinBull on December 01, 2011, 08:42:01 AM Wow. Epic thread.
I count Netrin making three stunning calls: 1) On Oct 26 (https://bitcointalk.org/index.php?topic=49462.msg595217#msg595217) he called a ~$4 top. The price popped then turned down on Oct 29. 2) On Nov 12 (https://bitcointalk.org/index.php?topic=49462.msg616405#msg616405) he predicted predicted a crash from ~$3.20. Price fell from $3.00 to $2.10 two days later on Nov 14. 3) On Nov 16 (https://bitcointalk.org/index.php?topic=49462.msg621276#msg621276) called a top at $2.6. Price had already started declining. Someone else should double-check the timestamps to verify these weren't made after the fact. Title: Re: Elliott Wave Educational Video Series Post by: bitcoinBull on December 01, 2011, 10:06:25 AM I have doubts that we're hitting a top around $3, before descending to test the lows. My non-Elliott reasoning leads me to bet that, this time, the trend has changed. The bid walls, trade volume vs. bitcoin supply, and a hunch that it will be easier for the heavy hitters to bank on a $2 reversal and push it upwards from here rather than downwards).
"Netrin, you've presented three different variations, but all of them result in a downward arrow. Why are you so bearish?" I have to reiterate this. I see that you're charting a triple three (https://bitcointalk.org/index.php?topic=49462.msg609183#msg609183) combined correction (WXYXZ). I suppose because you're aiming for that $1 pricepoint where "A correction usually finds its lowest point in the area of the fourth wave of the preceding impulse wave of the same degree." Though I'm betting against it, if this rally peaks in the $2.8-$3.45, it would retro-actively suggest the "Swannell wave (https://bitcointalk.org/index.php?topic=49462.msg623265#msg623265)" count I shared last week. It would imply that the previous $3 sideways correction were a fourth wave, the drop a fifth wave, and our current rally a correction of a higher degree. Anything above $3.45 (before testing and possibly breaking below $2) invalidates all of my counts for the past month or two (reversal, month long triangle, downward impulsive failure). I attempted an alternate, which counts a reversal at $2. I believe it still honors your past counts, because most of the waves coincide (impulse to impulse, corrective to corrective). I get a double three (WXY) rather than a triple three, by counting the first drop to $2.04 on Oct 19-20 as the third wave down, rather than the fifth and final. This way the third downward wave is the longest ("whereas upward fifth waves tend to be longest in commodities it is less true on down trends, where third waves tend to be longest for all asset classes.") The alternation looks good this way too (corrective wave II is sideways, and IV is sharp) [13.4 Principle of Alternation (http://www.forexhit.com/learn-forex/elliott-wave-principle.html)]. The fifth wave down just extends only $0.10 past the third (to the low of $1.9449), but I believe that's valid. Notice any violations? It's not an ideal shape, but I hope it does the job. You could probably come up with something prettier that doesn't test $2 again. Title: Re: Elliott Wave Educational Video Series Post by: netrin on December 01, 2011, 02:42:57 PM 1) On Oct 26 (https://bitcointalk.org/index.php?topic=49462.msg595217#msg595217) he called a ~$4 top. The price popped then turned down on Oct 29. 2) On Nov 12 (https://bitcointalk.org/index.php?topic=49462.msg616405#msg616405) he predicted predicted a crash from ~$3.20. Price fell from $3.00 to $2.10 two days later on Nov 14. 3) On Nov 16 (https://bitcointalk.org/index.php?topic=49462.msg621276#msg621276) called a top at $2.6. Price had already started declining. I like to think of these as all part of the same form (from 26 to what I call the 30 October count (https://bitcointalk.org/index.php?topic=49462.msg603999#msg603999)): http://genaud.net/bitcoin/2011/20111028-1612-1month5CwaveSHourly.png http://genaud.net/bitcoin/2011/20111030-1934-1month5CwaveSHourlyNovember.png http://genaud.net/bitcoin/2011/20111112-2016-45daySHour-26NovRetro.png However, I was quite wrong about a late November peak at around $2.8: http://genaud.net/bitcoin/2011/20111126-2315-2moSHour19Oct19Dec.png Which unambiguously invalidated the 30 October count, when prices surged above $3 just recently, leaving only the "Swannell wave (https://bitcointalk.org/index.php?topic=49462.msg623265#msg623265)" as a valid count: http://genaud.net/bitcoin/2011/20111129-1923-2moSHour19Oct19Dec.png BitcoinBull, you raise excellent points. I had been quite happy this north-summer with the single zig-zag since the June peak, but S3052 pointed out some unavoidable errors in my count. I am open to a count such as your own, as well as a double zig-zag followed by some bottoming out like a triangle. My only-human sentiment sensor tells me people already feel euphoria. As if we're in a new first wave (III.i), but I'm not sure how to count that, as I'm very confident in the October count (cyan a-b-c and its previous downward impulse). Could mid-November represent a failure (your C.v.5)? It would certainly explain my own egregious counts in the past few weeks. I'll look further into higher scale counts. Thanks for your posts! Title: Re: Elliott Wave Educational Video Series Post by: netrin on December 02, 2011, 01:58:46 AM Whether or not we've already reached a peak at $3.14, it's worth noting for yourself, whether the downward motion is three corrective (or variation) or five impulsive waves and on what scale. Elliott doesn't just show what's likely to come, but provides numerous methods of validation (and failure) along the way.
http://bitcoincharts.com/charts/chart.png?m=mtgoxUSD&l=1&t=S&c=1&s=2011-12-2&e=2011-12-3&i=1-min&width=900&noheader=1&height=400 For example, at the time of this writing (2 Dec, 01:40 UTC), I see three waves down, followed by a single rising wave up that though still below $3.14, would invalidate a previous impulsive three wave downward count. We could be in the B wave of a sideways (flat or triangle) correction or we might still be in the first wave of a large downward impulse. It's just too early to say. Title: Re: Elliott Wave Educational Video Series Post by: ElectricMucus on December 02, 2011, 02:04:59 AM I don't think you can see patterns on this timeframe. The 'noise' (bid-ask-spread) is a good fraction as large as all the actual price movement.
Too much are the result of individual decisions, you don't breathe after an Elliott Wave do you? ;D Title: Re: Elliott Wave Educational Video Series Post by: netrin on December 02, 2011, 02:36:44 AM I tend to agree about the noise on this timeframe. I don't generally even post the 'green' scale but I do count even lower because confirmation on subwaves gives strength to counts on higher scales. I hadn't thought of it, but your comment about spread sounds right; The prices in the spread are just a vacuum of quantum noise. But what's that about Elliott breathing?
Quote from: Confessions of an Elliott wave surfer, to be published when bitcoin reaches gold parity, 25 December, 2012
Title: Re: Elliott Wave Educational Video Series Post by: netrin on December 03, 2011, 10:11:02 AM In the impulse down from $3.8, 29 October to $2, 19 November, using the Swannell count, we may have seen a fifth wave failure (ending triangle) $3.1, 12 November to $2, 19 November.
Modifying the mid-November count slightly, we can count an extended third from $2.2, 21 November to $3.14, 1 December, beginning a fourth triangle or flat (A $2.99 late 1 December, B $3.14 early 2 December, perhaps C later today), or more likely, a fifth wave failure, followed by a drop. Though I'm betting against it, if this rally peaks in the $2.8-$3.45, it would retro-actively suggest the "Swannell wave (https://bitcointalk.org/index.php?topic=49462.msg623265#msg623265)" count I shared last week. It would imply that the previous $3 sideways correction were a fourth wave, the drop a fifth wave, and our current rally a correction of a higher degree. Anything above $3.45 (before testing and possibly breaking below $2) invalidates all of my counts for the past month or two (reversal, month long triangle, downward impulsive failure). I attempted an alternate, which counts a reversal at $2. I believe it still honors your past counts, because most of the waves coincide (impulse to impulse, corrective to corrective). I get a double three (WXY) rather than a triple three, by counting the first drop to $2.04 on Oct 19-20 as the third wave down, rather than the fifth and final. This way the third downward wave is the longest ("whereas upward fifth waves tend to be longest in commodities it is less true on down trends, where third waves tend to be longest for all asset classes.") The alternation looks good this way too (corrective wave II is sideways, and IV is sharp) [13.4 Principle of Alternation (http://www.forexhit.com/learn-forex/elliott-wave-principle.html)]. The fifth wave down just extends only $0.10 past the third (to the low of $1.9449), but I believe that's valid. Notice any violations? It's not an ideal shape, but I hope it does the job. You could probably come up with something prettier that doesn't test $2 again. https://i.imgur.com/0Thx7.jpg https://i.imgur.com/sDxWw.jpg Thanks again BitcoinBull for your counts. It's given me much to think about. We agree on the W count, and your Y count is good, though I am not fond of the 'look' of your zig-zag, specifically that Y.c so dwarfs Y.a. Your black IV (my red y-x) seems to be ignored on the higher scale. However, your Y.c count is solid, both black and cyan. Your fifth wave ("only $0.10 past the third") including a sub-fifth wave failure (adjusting your mid-November magenta count) would strongly suggest a reversal. Alternatively, I'm looking at my final third as a potential ending triangle with a $2 base and many more large bounces (3-3-3-3-3). Three waves from $3.8, 29 October down to $2 might be a cleaner fit than my numerous attempts at five waves (30 October count, Swannell, et all). Title: Re: Elliott Wave Educational Video Series Post by: netrin on December 03, 2011, 08:23:13 PM http://genaud.net/bitcoin/2011/20111203-1500-3wkSHour19Nov9Dec.png
This count is strictly valid (at least as far as the numbers labeled), but what is valid on these tiny scales, with huge spreads and light volume? Magenta iii ($3.14, 1 Dec) might have been the peak as in my previous green count (and would be be re-labeled II.z.C.v.5), otherwise we can expect a small jump up for the real magenta v (anything over $3.14) before returning to $2.9 and likely falling lower. The price drop to $2.9 had not been very informative. It falls nicely within the previous suggested fourth waves (green and gold (and magenta) bars). So either way, if we do see a new v peak or prices immediate collapse under $2.9, we can expect the price to first correct to about this same price territory. A price below $2.65 at any time would seriously discourage hope of a rally, continue the monthly downward trend, and I would expect prices to drop to $2 and perhaps below. Title: Re: Elliott Wave Educational Video Series Post by: meelba on December 03, 2011, 11:47:57 PM Fake Volumes on bitcoincharts.com
this is not the first time.... http://s53.radikal.ru/i142/1112/60/8baabf59ec6a.png Title: Re: Elliott Wave Educational Video Series Post by: netrin on December 04, 2011, 01:54:39 AM @Meelba: I did not watch it live, but 40K was roughly the size of the bid wall at $2.9. If you are presenting a conspiracy theory, it's certainly interesting and I'd like to discuss it elsewhere, but I'm afraid it's completely off topic here (Elliott waves).
The latest drop certainly looks impulsive. The first wave ($3.13 - $2.9) is roughly the same size as the third ($2.99 - $2.75). Therefore, one can expect either the third or the fifth to extend much lower. Of course, the drop may have only been corrective (perfect zig-zag), and then our fourth wave is really the beginning of a rally to new heights. That's also a reasonable position because even after three waves, bitcoin is still in the price territory of the fourth wave of the previous impulse of the same degree; In other words bitcoin has not yet dropped below the green bar. However, the pattern should be familiar to any bitcoin trading veteran, sharp second wave, a long sideways fourth triangle, followed by a collapse. The gamble is yours, but if it's bed time, you might want to place your stops and orders below $2.65 or above $2.98, depending on your bet. On bigger scales, I have counted a major expanded 3-3-5 flat correction since ($2.1, 14 Nov): A ($2.6, 16 Nov), B ($2, 18 Nov), C ($3.14, 3 Dec) although wave C, while certainly impulsive, only counts three strictly valid waves (extended third beginning ($2.17, 21 Nov). A drop below the magenta wave i ($2.5, 20 Nov) without a progressive correction would paradoxically invalidate yesterday's valid count, but honestly, I'd just accept the invalid count from earlier in the week and call $3.14 the fifth wave peak since 14 Nov. Title: Re: Elliott Wave Educational Video Series Post by: netrin on December 04, 2011, 04:15:04 PM Long bulls, who believe we are currently experiencing a correction in a major progression since $2, must accept that the drop from $3.13 yesterday displays an impulsive five waves. As of this morning (4 Dec), the fifth wave is truncated (the subwaves during the same day overlap). This implies either an extension down or reversal. None the less, zig-zags are the only corrective waves that begin with five subwaves. I estimate a B wave up to $2.9 (a half retracement to a very well established resistance), followed by another roughly equal five waves down, to about $2.4, certainly below the wave A low of $2.61.
Unfortunately, it's not a good time to make a definitive case for either the bulls or bears going forward. The bulls can make a good case for a truncated fifth and bottom ($2, 14-18 Nov), an impulsive first wave ($3.14, 2 Dec), and an on-going zig-zag second wave correction this week. Only a price below $2 would truly invalidate this scenario. A rise above $2.9 without first crossing below $2.61 would be a rally signal. Rather than a zig-zag, bears would expect an extra two waves down. The A-B-C of the zig-zag would be indistinguishable from the 1-2-3 of the regressive impulse. Regardless of your labeling, both of these counts carry the same short term message (5 down, 3 wave correction, 5 down) and should be profitably traded. However, the wave that follows would be very different. The bulls would expect an impressive rally, while the bears would expect a small correction followed by another low toward and likely below $2. Title: Re: Elliott Wave Educational Video Series Post by: netrin on December 04, 2011, 05:39:57 PM Mt. Gox hit exactly $2.9. Unfortunately other markets came nowhere near that level. I expect prices to fall now below $2.5 in five waves.
http://genaud.net/bitcoin/2011/20111204-1200-3wkSHour19Nov9Dec.png This chart does not add much in terms of predictions, only that the waves have so nicely fit within the suggestive bars thus far. If the price falls below the magenta bar $2.5, most likely completing a zig-zag, then the impulsive magenta rally (since B) has failed. The black scale does not technically fail until a drop under $2, but a drop below the first magenta wave (i) leaves absolutely no other valid count. A rise above the gold bar at $3.14 would confirm the continuation of the magenta fifth wave. However, given the extended third, magenta waves i and v should be about equal before a correction. That doesn't leave much room for v to rise above iii. There's much reason to believe the C.v already peaked at $3.14 even if I can't draw a valid count. The drop we've seen to about $2.6 already looks sufficiently corrective. Zig-zag B wave:
Zig-zag C wave:
Title: Re: Elliott Wave Educational Video Series Post by: netrin on December 05, 2011, 04:41:22 AM Pretcher's 200 year chart of the US economy published in 1977 (I'm not sure how the data was created) merged with 100 years of Dow Jones (source Wikipedia (http://en.wikipedia.org/wiki/File:DJIA_historical_graph_to_jan09_%28log%29.svg)). The charts don't line up perfectly. Sorry.
http://genaud.net/bitcoin/2011/comboUSMarkets1789-1977Dow1973-2011.png Title: Re: Elliott Wave Educational Video Series Post by: netrin on December 06, 2011, 05:58:53 AM Quote from: Pretcher and Frost, 1978 Zig-zag C wave:
The above count fulfills the first requirement and four of five guidelines (there may be more). However, I think one could more easily count the 'c' impulse (five subwaves) to mid-October, which would fulfill all five guidelines. I think one must ask oneself "did I create the count because I want it to be true?" I am unable to provide anything more convincing. Late October produced a picture perfect a-b-c zig-zag. I'm still not happy about my counts in early November from $3.8 to $2 and am entertaining the idea of three waves. The rise back up, peaking early December at $3.14 only counts three waves. Thus far, it is ambiguous. I would not be surprised if bitcoin bounces between $2 and $3 a few more times before... I don't know. It is entirely possible that the drop this past week to $2.6 is the fourth wave followed by a future fifth to new heights, precisely as I've counted the magenta and green waves earlier. The problem is that I either count five gold subwaves down from $3.14 to $2.61 or a zig-zag with a double-length c-wave which is most uncommon. Assuming the drop is five subwaves and bitcoin is in the fourth of five wave rally, then I'd expect another c-wave drop before rising on the fifth wave. Alternatively, assuming the same five subwaves, but that bitcoin is still correcting, then I'd expect the same drop not to return above $2.6 for a long time. http://genaud.net/bitcoin/2011/20111206-0200-3wkSHour19Nov9Dec.png $2.5 is the deciding line (below the lower magenta bar). A symmetrical zig-zag assumes but does not guarantee a 'c' wave below $2.5 just as a third impulsive wave is nearly always longer than the first wave. However a drop below $2.5 would invalidate the magenta count since black B ($1.99, 20 Nov) - invalidating hopes of a rally, signally a return to $2 or below. The dark channel vaguely represents a possible 'c' exit point. If a zig-zag is confirmed then the price will likely end within the dark channel near the bottom of the magenta bar. Green 'b' may rise up to but the zig-zag must not cross above $3.14. This would make room to complete a prettier (though flatter) sub-zig-zag iv.b.C (unlabelled gold C wave since 6 December, within green a-b since 4 December, within magenta iv since $3.14, 2 Dec). The higher green 'b' travels, the flatter the zig-zag will likely become, providing sufficient space for green 'c' to bottom out in the lower magenta bar, safely above $2.5. A price breach above $3.14 magenta would invalidate the green December count. Green 'a' would be relabelled magenta iv as before. Green 'b' would be relabeled somewhere in the third wave, and we'd expect a magenta 'v' peak well within $3's but not likely to reach $4 without a grand correction. I expect that simply crossing above $3.14 could trigger short stop loss thus igniting an extended fifth wave up. Title: Re: Elliott Wave Analysis Post by: dancupid on December 07, 2011, 03:37:01 PM I think the psychology of Elliot waves is fascinating - it's a black art like reading tarot cards. This is not a criticism - it seems to be a device that allows the natural pattern recognition abilities of the human mind to be harnessed - but maybe there is too much room for projection of subconscious desires. If it could be truly automated than maybe we could test it properly, but perhaps that misses the whole point of it.
Title: Re: Elliott Wave Analysis Post by: netrin on December 07, 2011, 04:08:03 PM Swannell has automated it and produced some nice statistics as well as challenged some of Elliott's original rules and guidelines. (Look back a few pages, I have a link to his 2003 paper). Pretcher has also refined Elliott's work. I think we generally consider Pretcher, Frost definitive.
It is a black art yes. One should be on guard against creating charts based on personal desire to prove an extant position or to create unnecessary doubt. Elliott does provide confirmations and invalidation, which are excellent for pulling out of a losing position with minial loss. In my own short experience, it's been very useful to analyze patterns greater and smaller than the scales I actually intend to trade. This is true with any methodology, but Elliott requires the scaled view and nicely ties multiple scales into the same forecast, which I have not found to be true of other analytic methods. Title: Re: Elliott Wave Educational Video Series Post by: bitcoinBull on December 08, 2011, 12:01:14 AM I don't think you can see patterns on this timeframe. The 'noise' (bid-ask-spread) is a good fraction as large as all the actual price movement. Too much are the result of individual decisions, you don't breathe after an Elliott Wave do you? ;D I have to agree with ElectricMucus. Because Elliott Waves are principles of mass psychology, you wouldn't expect them to work on the smaller timescales. Mass psychology tends to change on a day-to-day or year-to-year basis, not minute-to-minute and hour-to-hour. While the fractal nature of Elliott Waves is appealing, I doubt it scales more than a few orders of magnitude either way (bigger or smaller). This question is especially relevant to the 200-year dow chart you posted above. We're supposed to be at the peak of the fifth wave of a supercycle or a grand-supercycle, but it doesn't appear we've yet seen the first (impulsive) reversal wave down. Its mostly bounced back from the 2008 crash (mortgage crisis) and the 2011 one in October (euro crisis). Maybe IF the China "bubble" pops, that would be the tipping point. I'm not sure I buy Elliott Waves on such a long timescale (again, time long-past should have little effect on mass psychology). If we are at the beginning of a fifth wave down, I probably shouldn't be considering opening a short position on TLT, as cypherdoc recommended in his gold thread. http://static.seekingalpha.com/uploads/2011/11/29/saupload_DP_11-29-11_3.png (http://seekingalpha.com/article/310781-the-trade-of-the-decade) Title: Re: Elliott Wave Analysis Post by: netrin on December 08, 2011, 02:37:20 AM Each move within the spread is a single act just as easily toward the ask or bid. As unpredictable as quantum noise within a vacuum. Trends are generally easier to read on each greater scale assuming we could stand far enough away. I have no reason to believe this would not include the expansion of the universe if we sat in God's private theatre booth.
I may have doubts about the data but fewer about the theory. I am skeptical connecting the pre-industrial economy through the Dow Jones Industrial Average and I do not know how to reconcile the Mt. Gox hack and June sell off. Each bitcoin day has been informative in general and each week quite tradable. I hesitate to label overlapping waves within a single day but can most often discern distinct subwaves of entire waves within a week's duration. Fortunately resolution is enhanced with volatility not strictly with time. Quote While the fractal nature of Elliott Waves is appealing, I doubt it scales more than a few orders of magnitude either way (bigger or smaller). If I shared your doubt I would not be counting Elliott at all. The greater the number of scales in a lattice of confirmation, the greater my confidence in a count. I think you may be asking too much to call the day of the multi-century peak, but the decade? Well, I won't deny stocking up on dried food and bullets. The stock markets are unusually volatile. Just as bitcoin is more difficult to predict at a major bottom, the global markets are difficult to predict at the top. I don't know if Cypherdoc is correct, but his argumentation certainly opened my eyes. I think it's well worth everyone's read. Title: Re: Elliott Wave Analysis Post by: netrin on December 08, 2011, 03:30:47 AM As an example of uncertainty not typically seen on greater scales:
http://bitcoincharts.com/charts/chart.png?m=mtgoxUSD&l=1&t=S&c=1&s=2011-12-4&e=2011-12-9&i=15-min&width=900&noheader=1&height=300 DOWN5: ($3.14, 2 Dec) to ($2.61, 4 Dec) counts five clean waves. DOWN3: ($3.14, 2 Dec) to ($2.61, 4 Dec) counts three wave zig-zag. Some vague impulse ($3.14) to ($2.9, 3 Dec), correction ($2.99), and five invalid waves down (the fourth wave ($2.69-$2.8, 4 Dec) enters the price territory of one and two) UP3: extended three waves. The first wave ($2.61-$2.9, 4 Dec) is followed by a correction to the previous fourth ($2.72, 4 Dec). First subwave ($2.93, 5 Dec), sideways correction (~$2.88, 6 Dec), third subwave ($3.05, 6 Dec), followed by a multi-day sideways correction ($3 +/- 3%, 6-8+ Dec), and a fifth subwave up, thus finishing the extended third wave. UP5: five wave rally. Same as UP3, with a fifth impulsive wave breaching well above $3.14.
Bigger scales: Since June, bitcoin has trended down with unambiguous impulsive waves until recently hitting ($2, 19 Oct). 19 October began a perfect zig-zag correction to ($3.8, 29 Oct) and continued down from there. I anticipated five waves, a correction mid November and a continuation of the trend below $2. That never happened and my counts fell apart. http://bitcoincharts.com/charts/chart.png?m=mtgoxUSD&l=1&t=S&c=1&s=2011-10-20&e=2011-12-20&i=Hourly&width=900&noheader=1&height=300 Suppose we never completed the major correction since October? There is no mistaking the late October zig-zag, but that ($3.8, 29 Oct) zig-zag could represent only the first 'a' wave of a 3-3-5 flat (or 3-3-3-3-3 bounded triangle). The 'b' ($2, 19 Nov) is followed by the 'c' wave we experience today (7 Dec). Even a rise back up to $3.8 in five waves would not invalidate the flat. In fact, according to Pretcher, wave 'c' is most often 100-165% the height of 'a' ($3.8-$5). And what follows would be a continuation of the trend, a fall below $2, into the suggested price range of the March iv, about $1. Title: Re: Elliott Wave Analysis Post by: netrin on December 08, 2011, 06:13:19 PM http://bitcoincharts.com/charts/chart.png?m=mtgoxUSD&l=1&t=W&c=1&s=2011-12-4&e=2011-12-9&i=5-min&width=900&noheader=1&height=300 UP3: extended three waves. The first wave ($2.61-$2.9, 4 Dec) is followed by a correction to the previous fourth ($2.72, 4 Dec). First subwave ($2.93, 5 Dec), sideways correction (~$2.88, 6 Dec), third subwave ($3.05, 6 Dec), followed by a multi-day sideways correction ($3 +/- 3%, 6-8+ Dec), and a fifth subwave up, thus finishing the extended third wave. This count continues to 'look good' but has been invalidated in so many ways that one would be unwise to bet heavily on it. While the fourth wave (~$3, 6 Dec thru present) looks like a double zig-zag, the drop to $2.9 moments ago invalidates the entire count (again) as it enters the price territory of the first ($2.93, 5 Dec) and second waves. Alternatively, we could count the entire rally ($2.61 4 Dec) to ($3.05, 6 Dec) as a single wave, though So, again while this little rally 'looks good', it is not Elliott, and likely wishful thinking. The chart at this scale is at best only informative but at worst it's random noise. Whether up or down, the breakout is likely to be 15% or more. Title: Re: Elliott Wave Analysis Post by: netrin on December 11, 2011, 05:28:32 PM http://genaud.net/bitcoin/2011/20111211-1330-3moSHour12Oct12Jan-crop2moNovJan.png
Our impulse since $2.6 after pushing past $3.14 looks to have more power left in it. While gold subwaves are impossible to count, the green count is clean. Bitcoin appears to be in the third of a fifth. We should expect another small correction and climb before a major correction back to around $3. The top magenta price target (C) is based on the fourth wave all the way back from mid October. Similarly $3.8 represents the peak of the subsequent retracement late October. On higher scales, I have too many counts to bother presenting any of them. I'm just not sure if bitcoin has hit the bottom yet -- if this past month or so represents a single 3-3-5 flat correction or a terribly weak reversal. The black B and C imply the former, but I'm entirely open to alternatives. A major correction reversal within the fourth wave of this month's rally (lower magenta bar $2.6-$3.14) would be a positive signal and could lead to double digit heights. A drop below $2.5 could lead to $1. Title: Re: Elliott Wave Analysis Post by: zby on December 21, 2011, 08:05:58 PM Any updates to this?
Title: Re: Elliott Wave Analysis Post by: netrin on December 22, 2011, 04:46:11 AM The chart above is still valid.
In all honesty, it's been an ugly count going up. I don't see a better count than the one I created ten days ago. The drop (14 Dec, $3) invalidates my green count, but I don't have an alternate to replace it. It's tempting to label the drop from (20 Dec, $4.5) through today as a green '4', but that would make '1' three waves. Green '3' would be extended since (11 Dec, $3) with the same invalidation (14 Dec, $3), but imply another rally up without first crossing below $3. I really don't know. http://bitcoincharts.com/charts/chart.png?m=mtgoxUSD&l=1&t=S&c=1&s=2011-11-20&e=2012-1-12&i=Hourly&width=900&noheader=1&height=400 Title: Re: Elliott Wave Analysis Post by: zby on December 22, 2011, 06:37:59 AM At least now we have a clear triangle pattern.
Title: Re: Elliott Wave Analysis Post by: cloon on December 25, 2011, 05:38:02 PM some thoughts who rushed through my head:
elliott wave theoriy is based on self similarity, (like a fractal) if you zoom in, you'll find nearly the same forms like in large scale... the critical point is, that you find only NEARLY the same forms. imagine that if it would be calculable like the mandelbrot or Julia, it wuld make really good predictions. BUT the whole self-similarity is a result of mass-psycologic of optimistic and pessimistic thinking. the uncalculability of its self-similarity makes shortterm predictions nearly impossible. for example: take the mandelbrot. if you dont know, how it is calculated, you will not be able to say, how it looks if you zoom in 500 times, because self similatity if it is depending on relatives of the coordinates... (means it depens, where you zoom in) means: you'll find every self similarity, your searching for. if you compare the right coordinates and zooms.... now look at bitcoins: I see the point of self similatity but this system is a lot more chaotic and more uncaluculable than fractals and has much influence of the media, the forum, etc... IMO the Elliote wave theory is an interesting prediction machanism for long and midterm, but without others indicators, oscillators, and external information its worthless... have you had neary the same thoughts? ;-D (sry for my terrible english) Title: Re: Elliott Wave Analysis Post by: molecular on December 25, 2011, 05:47:12 PM have you had neary the same thoughts? ;-D yeah, I think so, but on a wholly different timescale. It was over in 3 nanoseconds, so I didn't really catch it. Title: Re: Elliott Wave Analysis Post by: Flappy on January 02, 2012, 08:36:22 PM I was reading that a 4th wave triangle could result in either a quick 5th wave or an elongated one.
In the first case would that also lead to a quick abc correction like the following? Is this a valid count? I wasn't sure where to measure the wedge. https://i.imgur.com/4Wylp.png Title: Re: Elliott Wave Analysis Post by: Flappy on January 02, 2012, 09:10:54 PM On second thought, now it's looking to me like:
5.1 ( $5.5 ) 5.2 ( $4.8 ) :o Title: Re: Elliott Wave Analysis Post by: netrin on January 03, 2012, 03:06:07 AM Flappy, the count you've drawn is valid on the scale you've labeled. However, I think you'd have trouble labeling the subwaves... but so it is. If I understand what you mean by 5.i ( $5.5 ), 5.ii ( $4.8 ), then yes, you should expect much higher prices. According to your count, waves 1 and 3 are about equal, which tends to imply an extended 5.
All counts continue to look ugly to me. For example, in your wave 5, there was a peak ($4.99, 31 Dec), a double top around ($5.5, 2 Jan), before a drop to ($4.8, 2 Jan). How do you reconcile that? Either your 5.i is only three subwaves, or the fourth wave was invalid. There's nothing wrong with your count, considering bitcoin's light trade volume. Indeed it's as good as any. It's just that you can't have huge confidence in any count unless it is also confirmed on higher and lower scales. I invite you to include sub-counts for discussion. ... Suppose you considered ($3.5, 22 Dec) as the beginning of wave 5 rather than the middle of a wave 4 triangle. Then you'd have a valid five counts up to the new year high before a major reversal. I'm not claiming it's better than your count. My intension is only to provide healthy doubt. Title: Re: Elliott Wave Analysis Post by: Flappy on January 03, 2012, 05:35:46 AM Either your 5.1 is only three subwaves, or the fourth wave was invalid. Shall I scrap the 4th wave triangle and redraw as follows? Doesn't this require a termination point for C near 3.5? https://i.imgur.com/xgMam.png Title: Re: Elliott Wave Analysis Post by: netrin on January 03, 2012, 05:51:07 AM Thanks for the subcount. Perhaps you could alternate 1,2,3,4,5 and i,ii,iii,iv,v for the color blind (https://bitcointalk.org/index.php?topic=49462.msg637914#msg637914) :) but anyway...
Shall I scrap the 4th wave triangle and redraw as follows? That's up to you. Neither count gives me warm fuzzies (none of mine either). But the sharp blue 4 looks like a motive three-waves, hits your previous fourth wave perfectly (3.iv), and the following blue wave 5 has a valid subcount. Doesn't this require a termination point for C near 3.5? First of all, the previous fourth wave is a suggestion, not a requirement. Secondly, it's anywhere in the entire fourth wave $3.5-$4.5, though you are correct, it tends to hit closer to the extreme. Given your count, I'd be inclined to call the (2 Jan, $4.8 ) drop your 'a'. It fits nicely in the previous magenta fourth wave. If the correction is a zig-zag, 'c' would likely and symmetrically end within the blue fourth as well. 'a' and 'c' of a zig-zag should be roughly equal and both express five subwaves (b is three waves). Since you shouldn't ignore that $4.8 drop, I think either your 'a' is much bigger or the drop is your 'a'. https://i.imgur.com/xgMam.png Also, I suggest you find parallel green channel lines. They can intersect the price action a bit, but an expanding impulse is not particularly informative. Title: Re: Elliott Wave Analysis Post by: Flappy on January 05, 2012, 07:21:53 AM So what does it mean when C fails to move back into the range of the 4th wave?
My thought is that the abc correction was simply cut short by a new wave of market exuberance. Any thoughts on whether the recent price action leading up to $6.3 is an extension of previous waves, or are we moving into new territory? As long as it stays within the up channel I'm inclined to believe it's an extension, but I don't know how to label it. And if it is an extension, the implication is that there will still be a correction into the 3.5-4.5 range. After a cursory look, I'm tempted to go back and label everything as a series of corrections. But that has no predictive value. Title: Re: Elliott Wave Analysis Post by: S3052 on January 05, 2012, 07:56:08 AM I have shared with subscribers a wave count, but I am sorry I can't share here as it is exclusive to subscribers.
Title: Re: Elliott Wave Analysis Post by: netrin on January 06, 2012, 08:12:34 PM So what does it mean when C fails to move back into the range of the 4th wave? It does not mean much. The fourth is only a suggestion. Similarly, three wave zig-zag corrections are common, but not guaranteed. The jump from $4.8 to $7.2 is something else entirely. I'm without internet and am missing all of this fun. My quick assessment however, is that we may see a small upward motion again, before a major downward correction. Bitcoin broke the channel yesterday and seems to be entering again. I'd expect it to soon cross below the channel over the midterm week(s). My thought is that the abc correction was simply cut short by a new wave of market exuberance. Maybe, but Elliott already tries to model market exuberance and despair. So trying to explain unexpected Elliott motion using the same terms is circular. Any thoughts on whether the recent price action leading up to $6.3 is an extension of previous waves, or are we moving into new territory? The channel I've 'drawn' using the edge of paper on chart since November cuts through the spike on 20 December (wave 3) and again 6 January (wave 5). After a cursory look, I'm tempted to go back and label everything as a series of corrections. Do it. Very often an alternate count looks much better after drawing or describing another idea. It's best to have a number of alternate counts in mind along with what new information would confirm or deny any one of them. If all counts predict the same result, then you can have more confidence in the prediction even if each count is vague. Title: Re: Elliott Wave Analysis Post by: Flappy on January 27, 2012, 05:31:31 AM I was reading that a 4th wave triangle could result in either a quick 5th wave or an elongated one. I guess we saw an extended 5th wave. A big distorted 5th, and a big distorted correction to match? This could still land in range of the 4th. (4.0 - 4.5) Title: Re: Elliott Wave Analysis Post by: dearbesz on May 10, 2016, 06:12:31 PM i believe that some of the predictions of the elliott waves are more
realistic in the long run, thats why i support their campaign anyway,.. :) Title: Re: Elliott Wave Analysis Post by: Jmild1 on May 10, 2016, 08:31:50 PM i believe that some of the predictions of the elliott waves are more realistic in the long run, thats why i support their campaign anyway,.. :) seeing those graph in the first page , I see that it is way realistic |
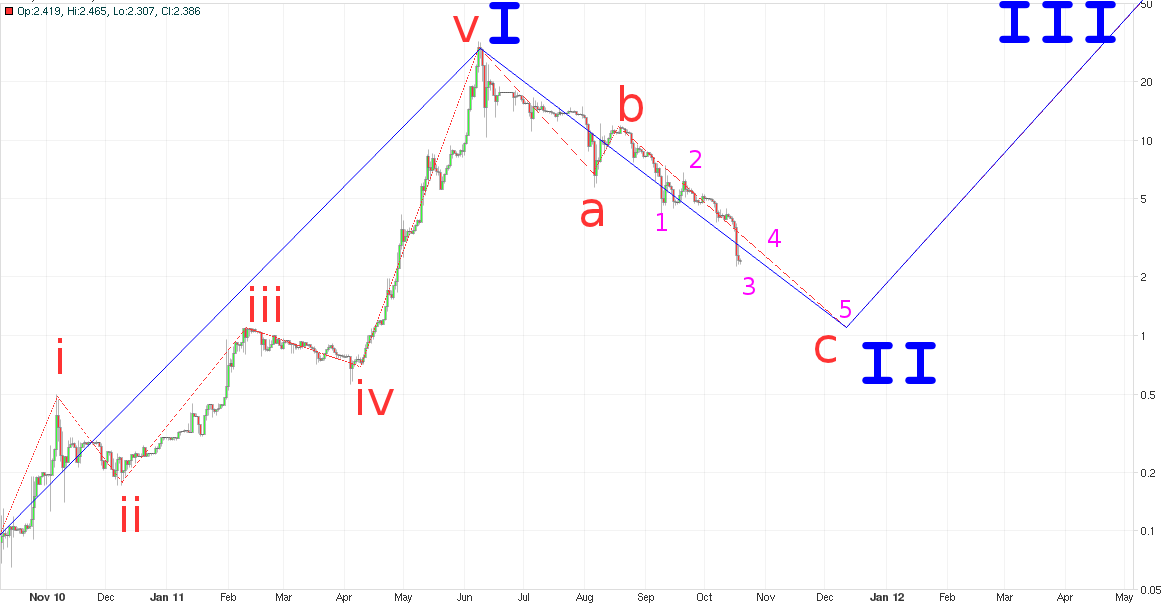
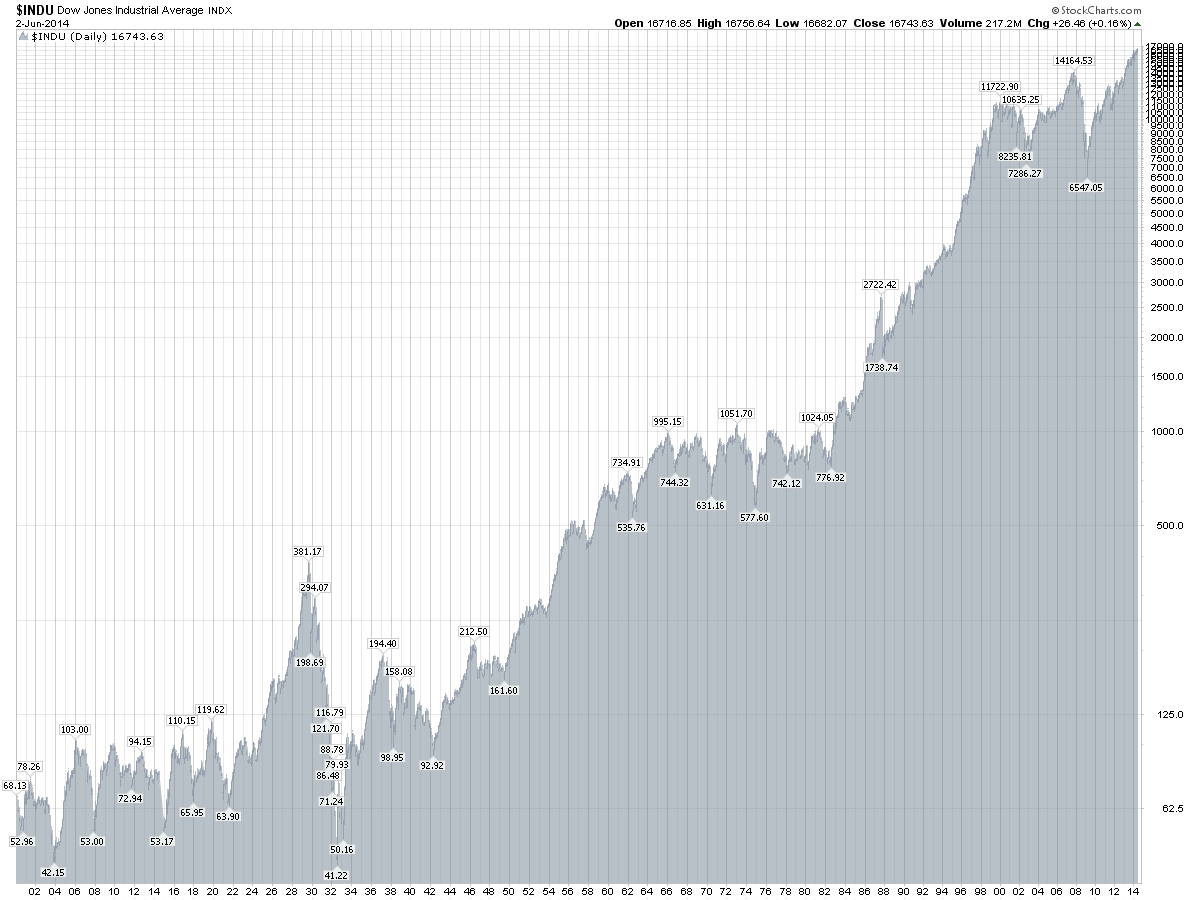
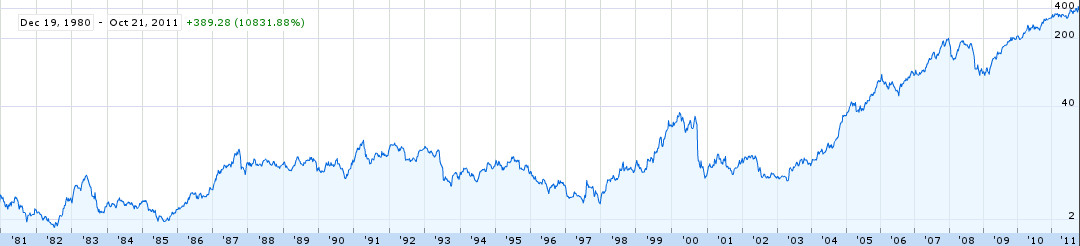
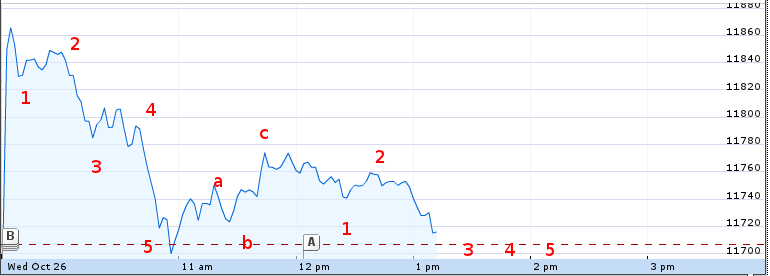
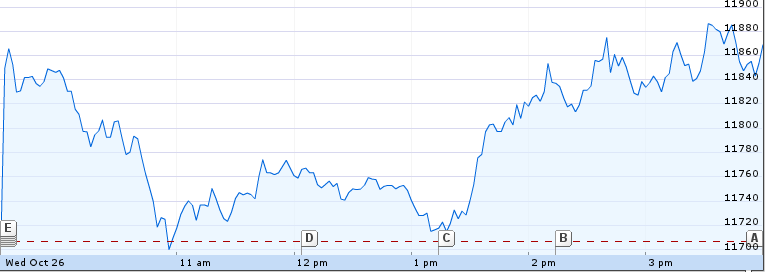
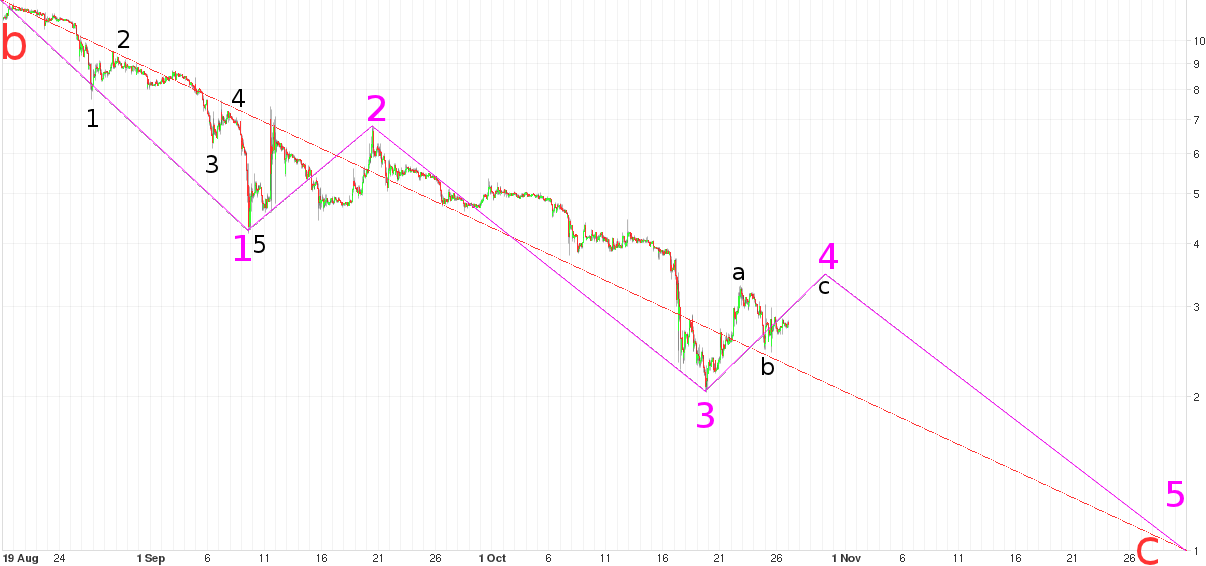
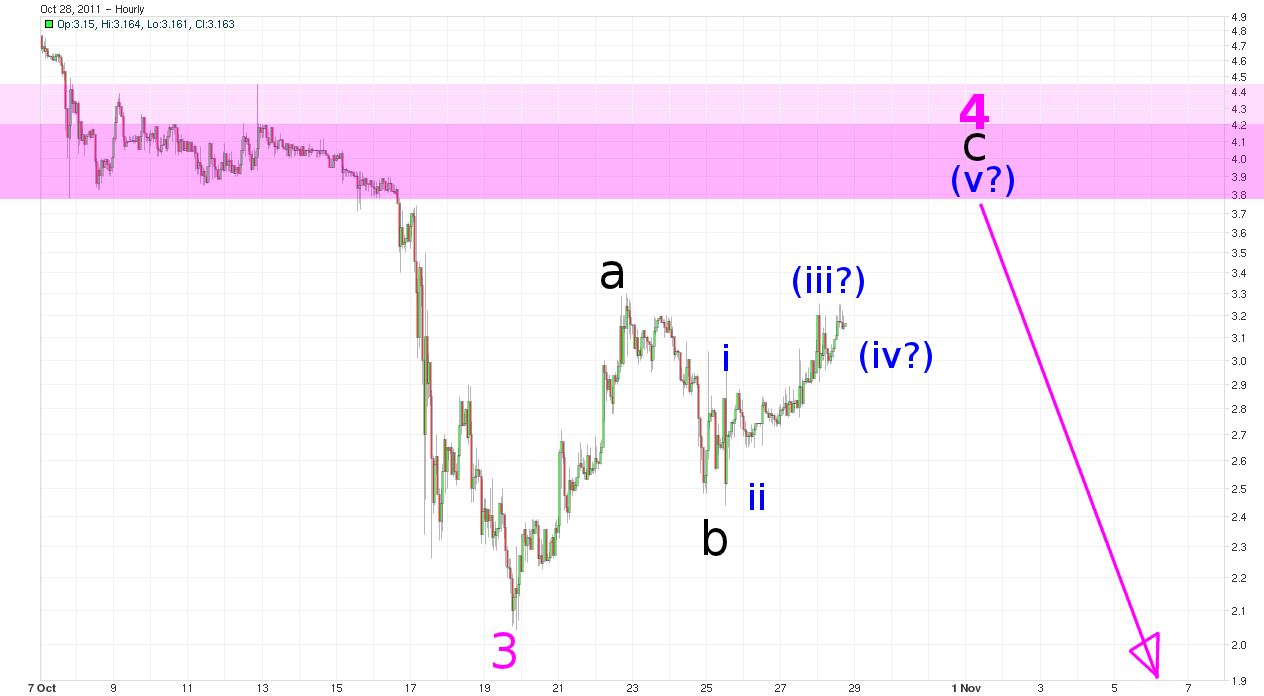
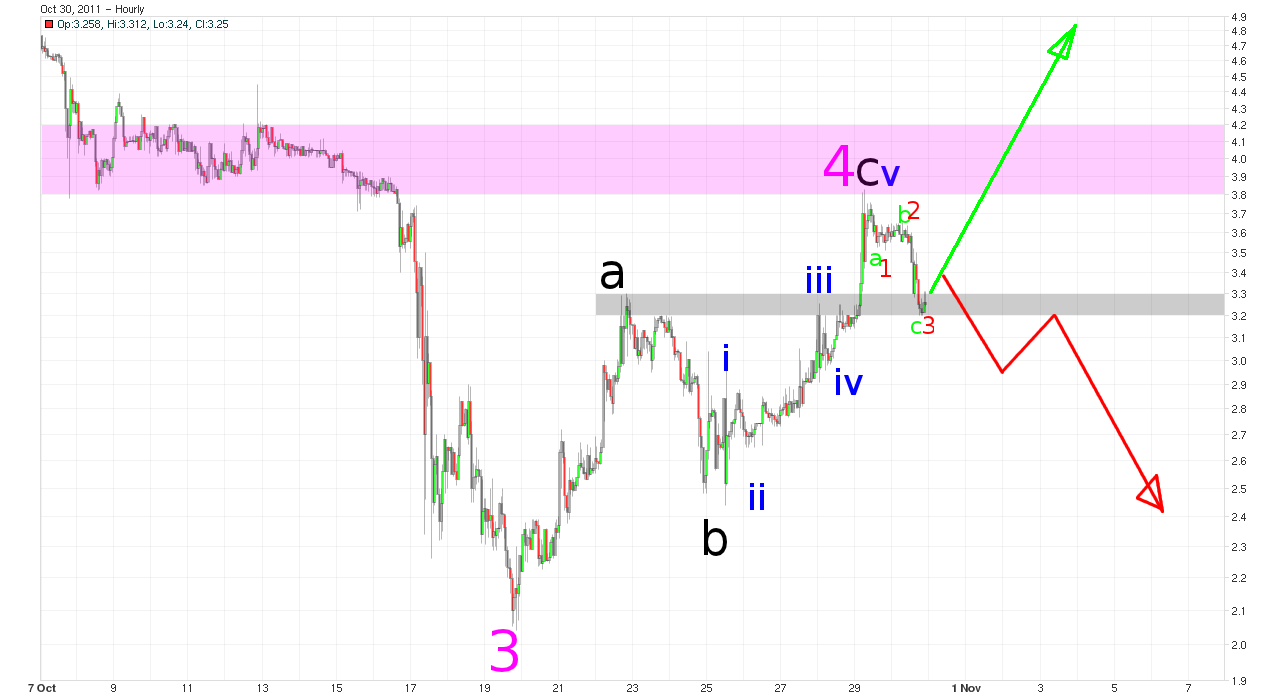
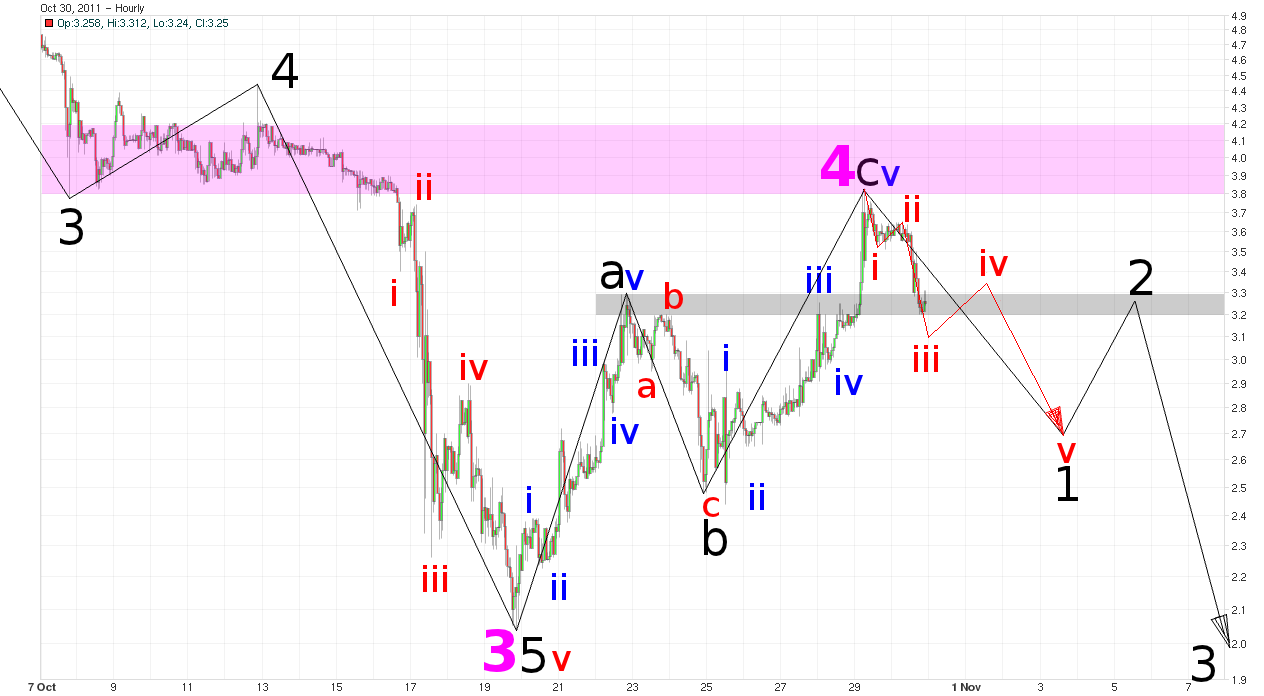
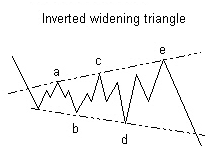
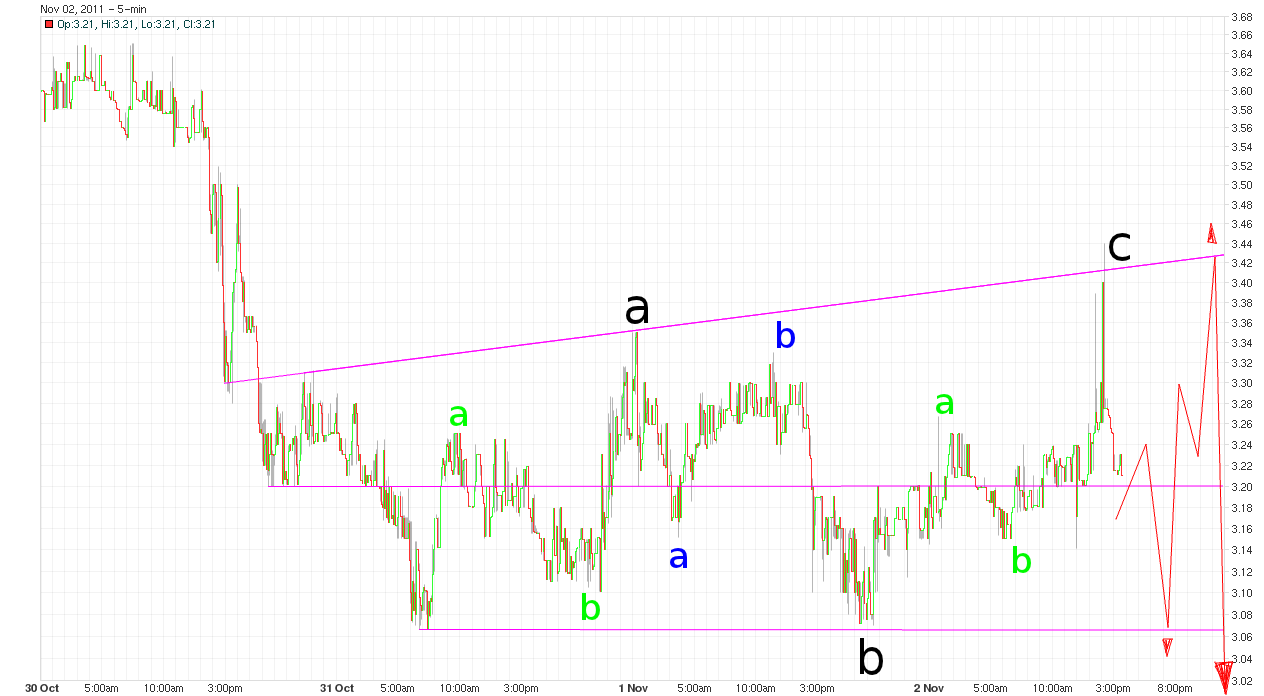
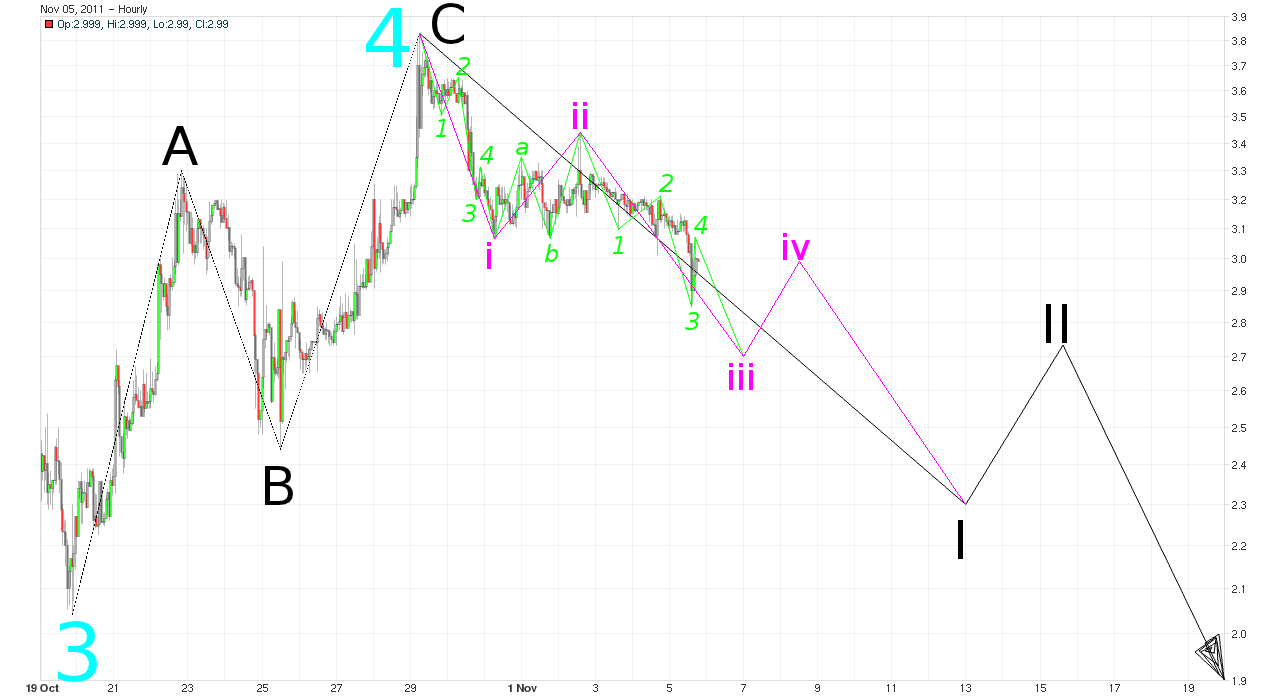
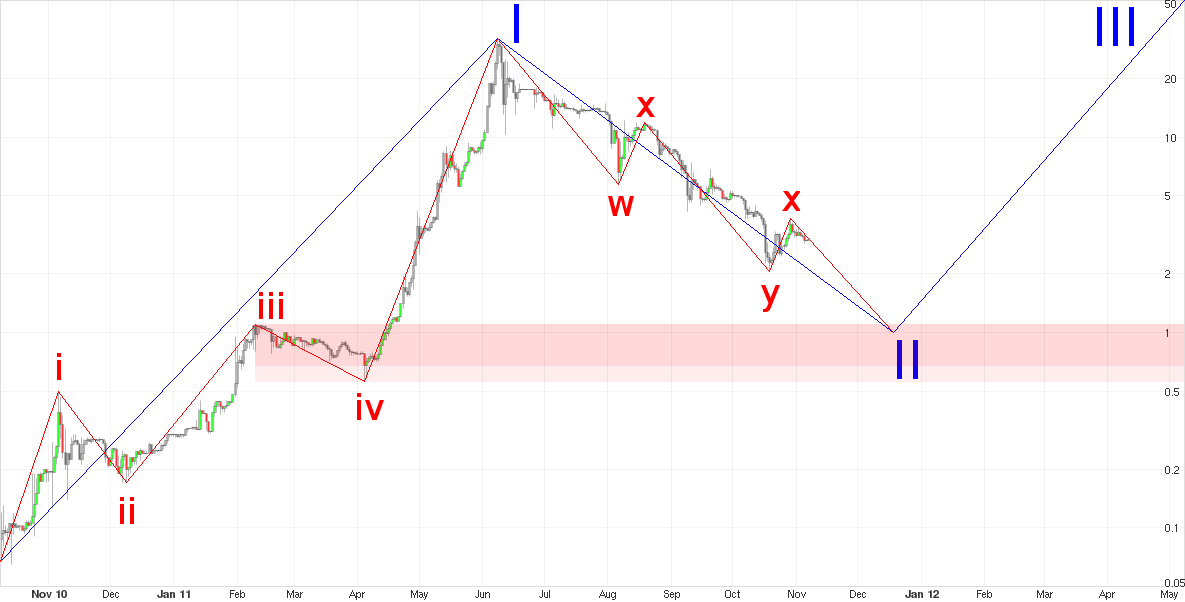
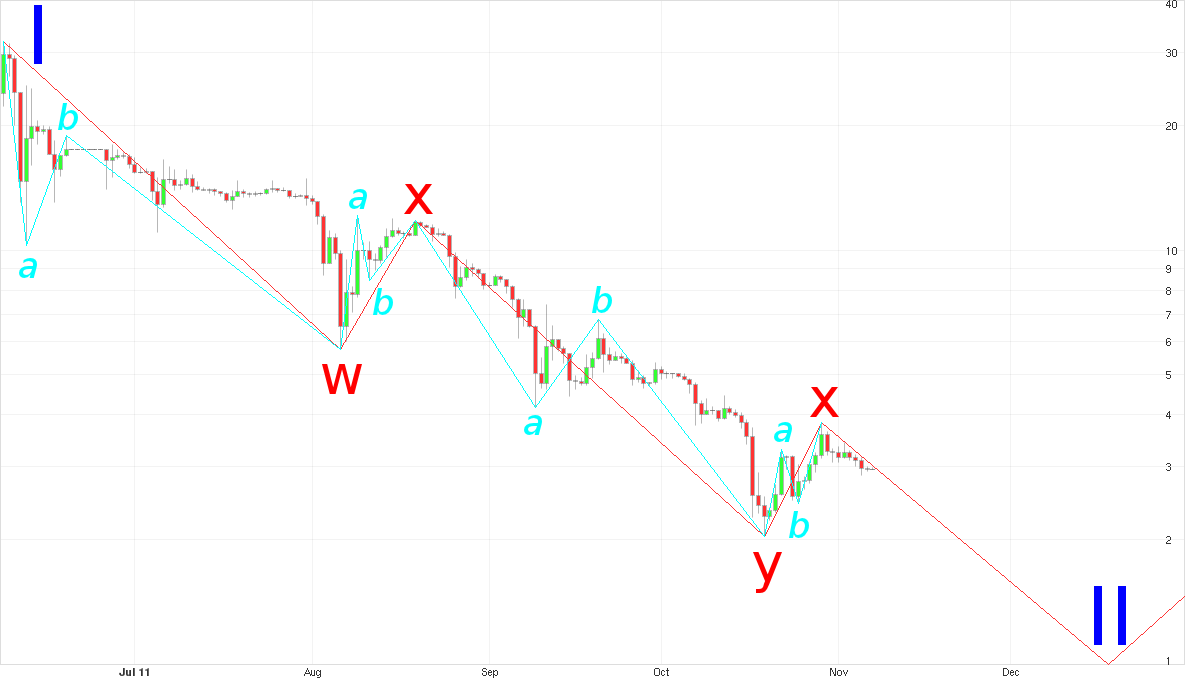
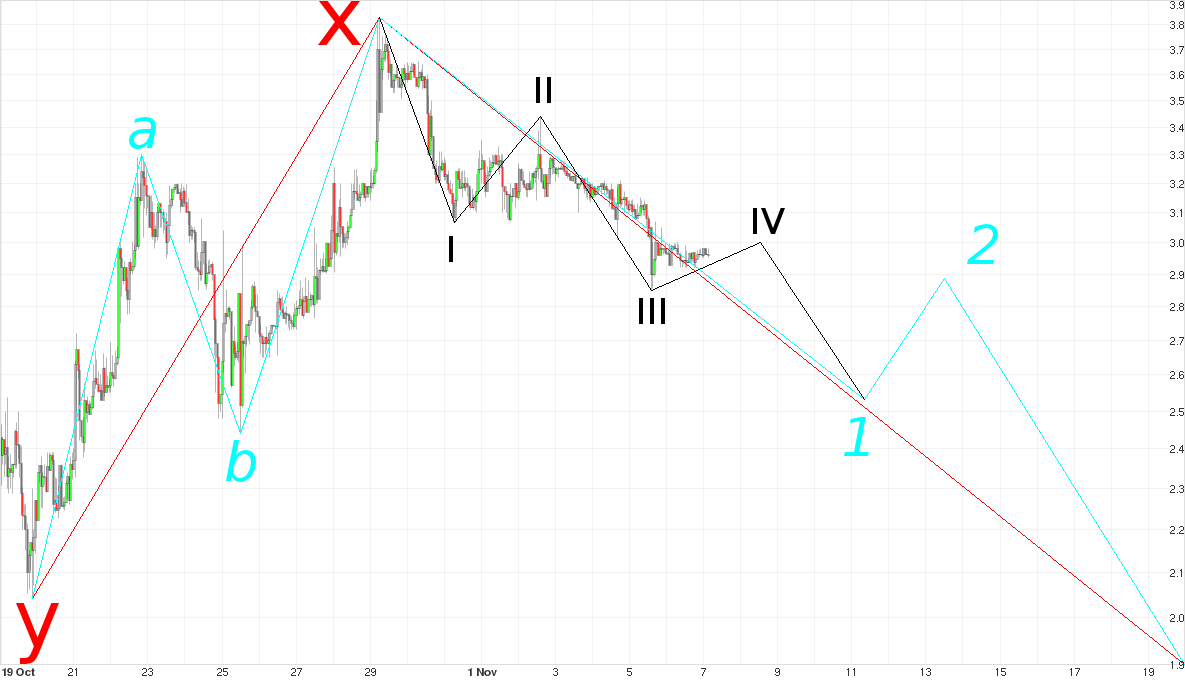
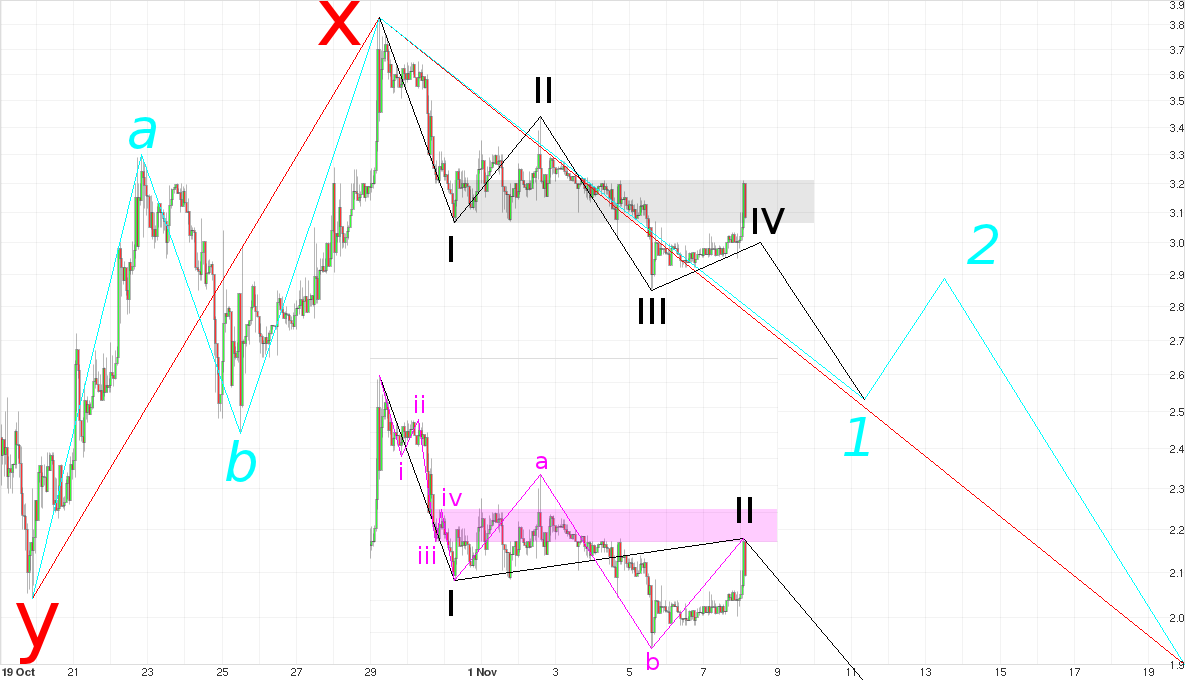
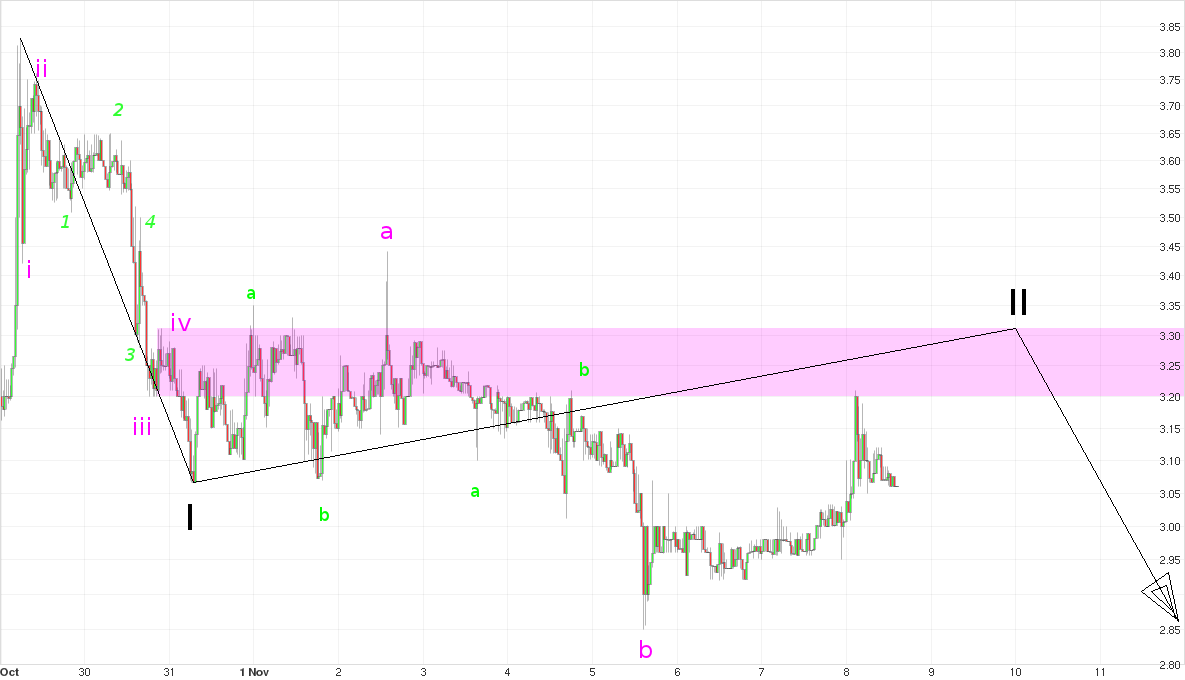
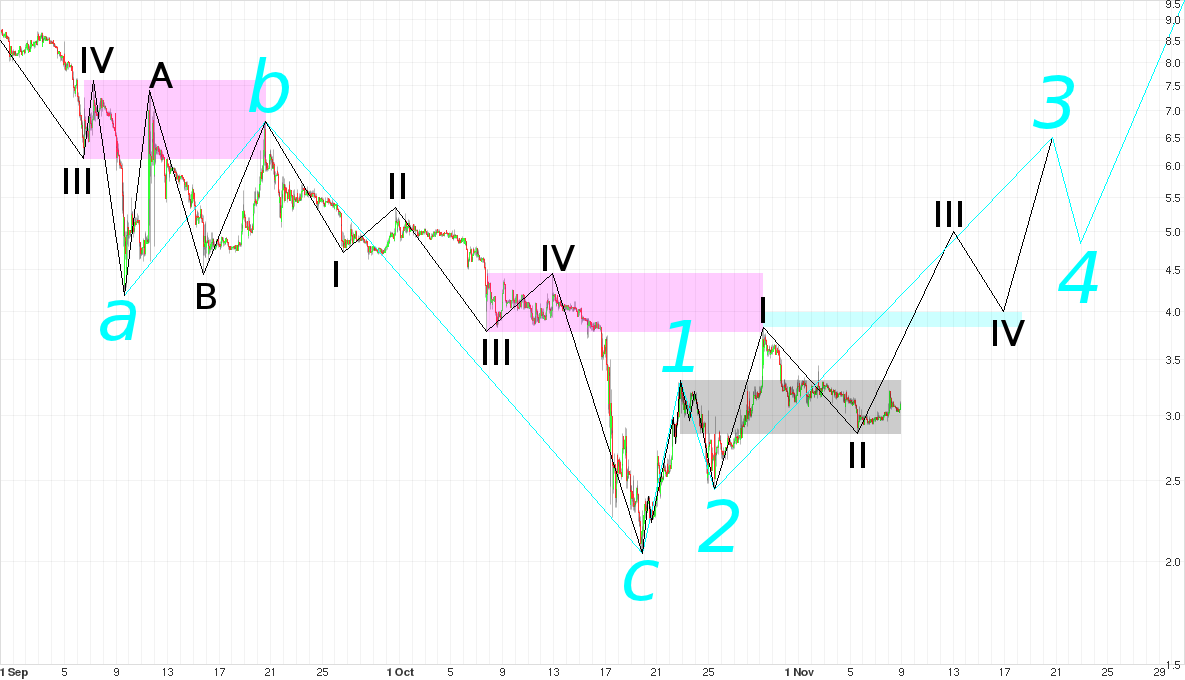
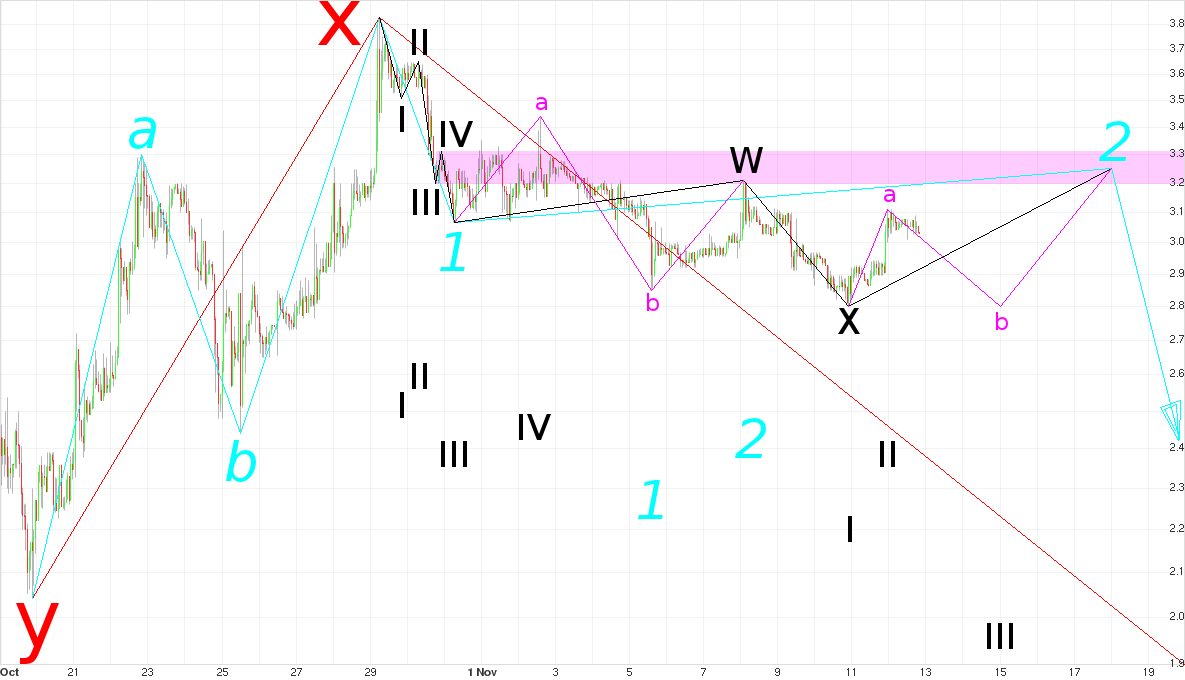
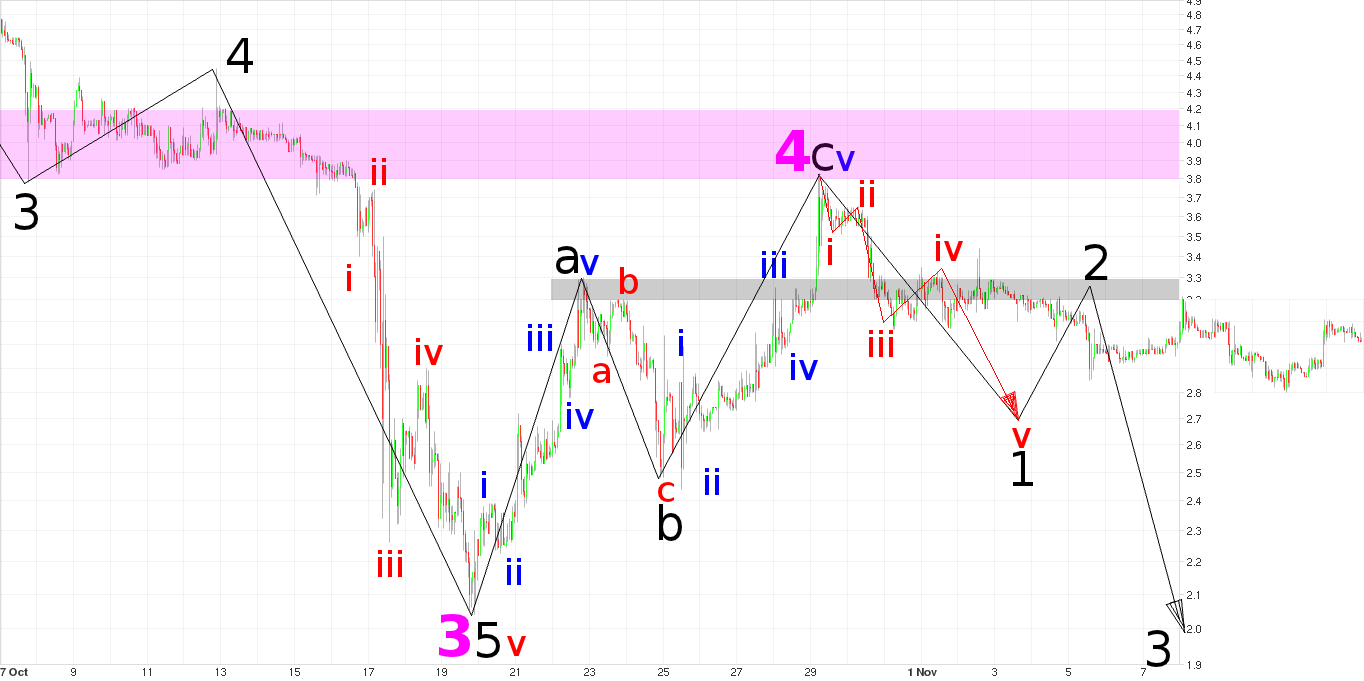
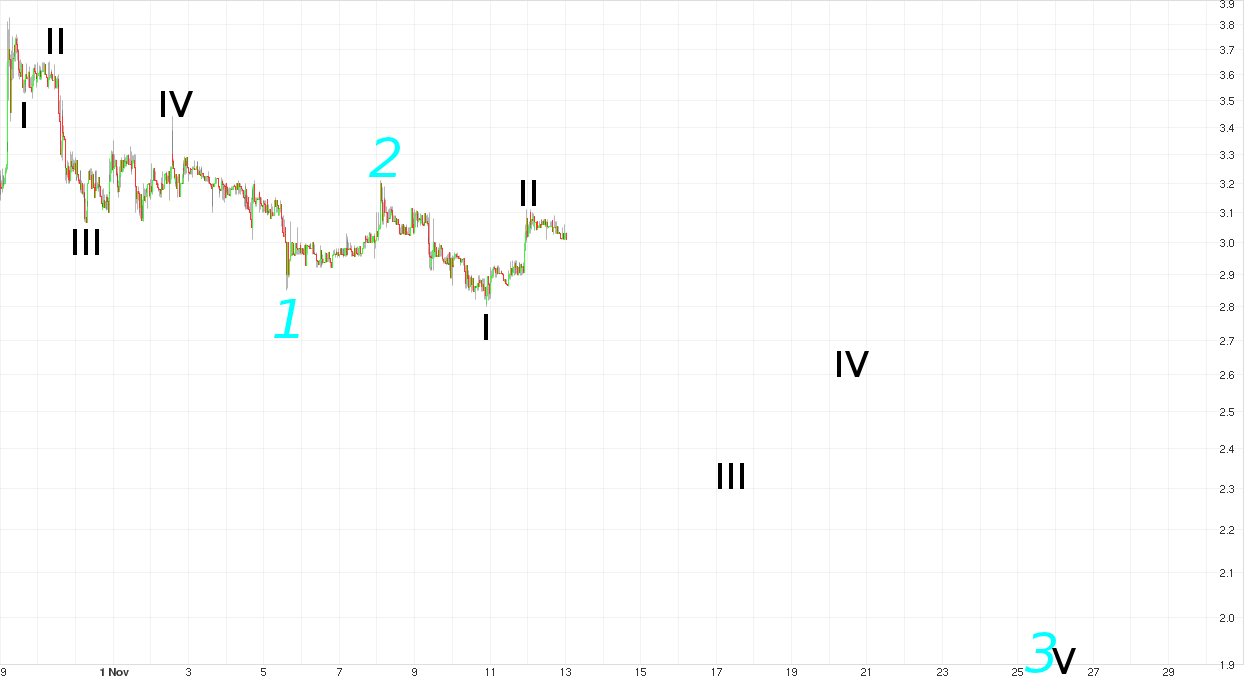
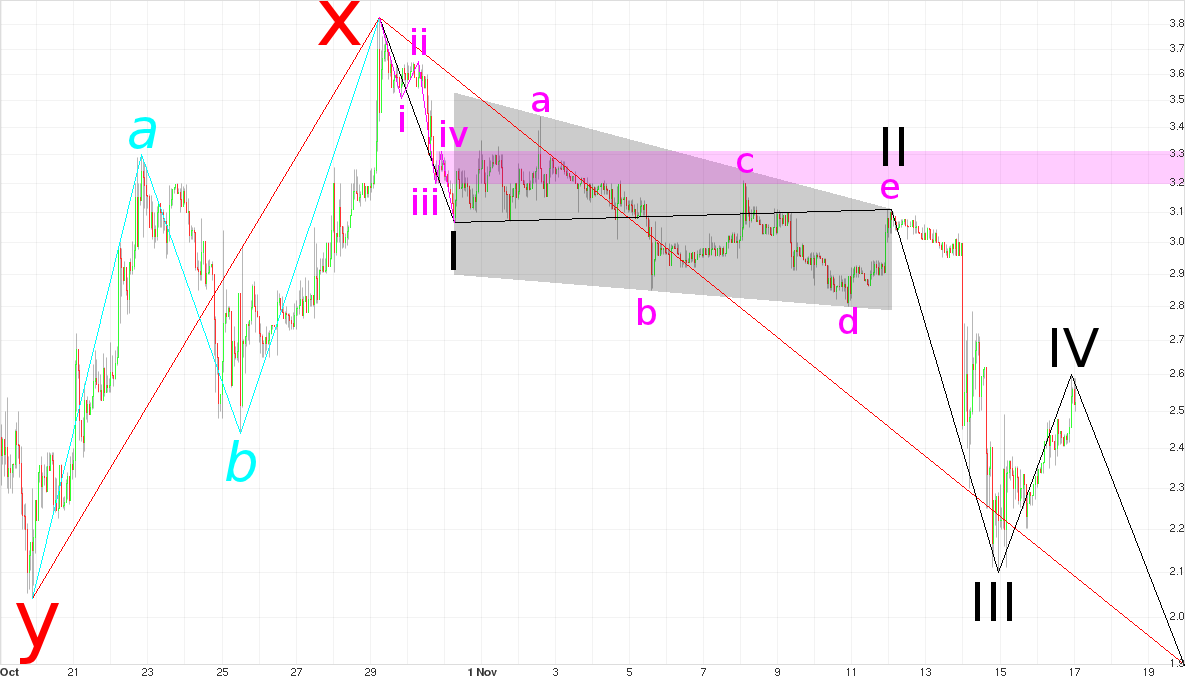
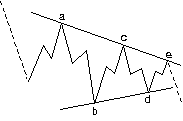
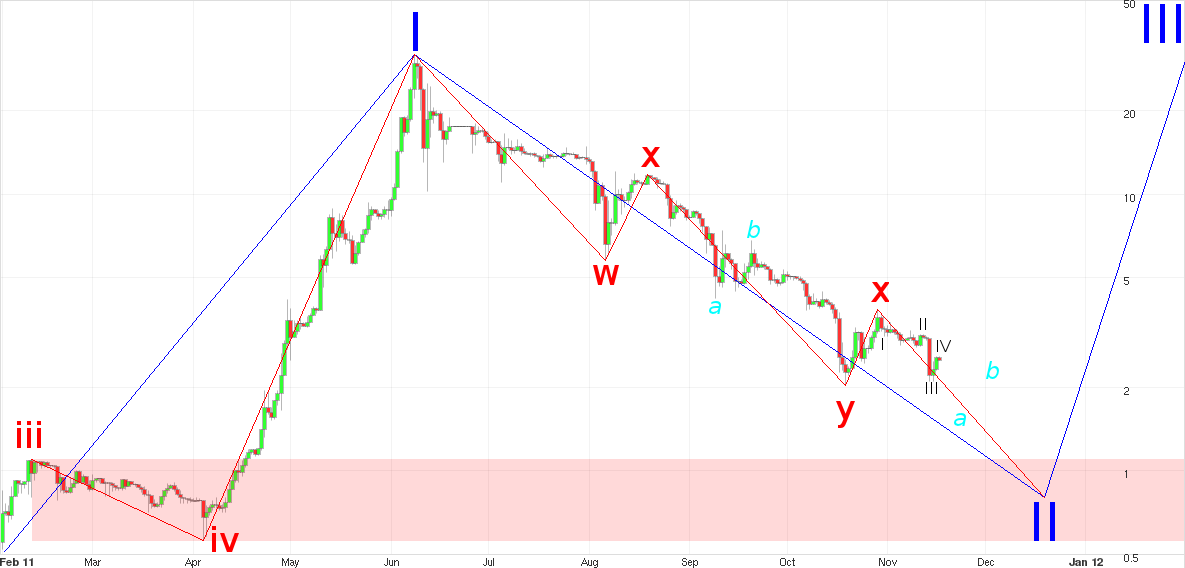
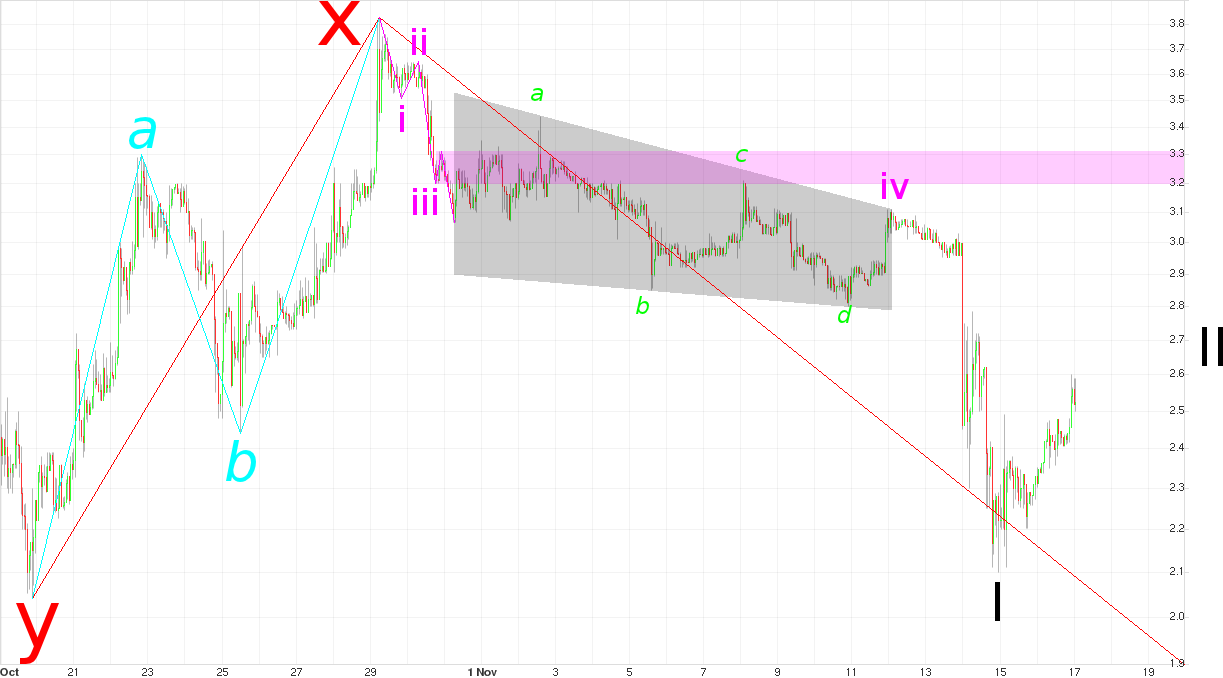
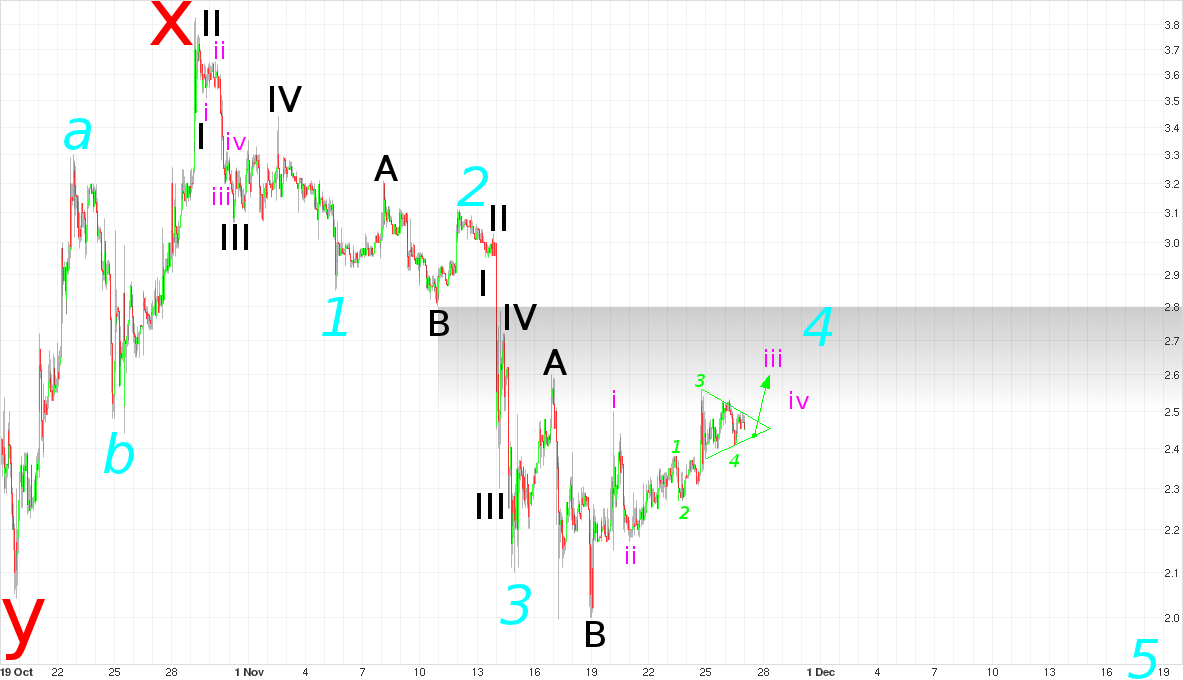
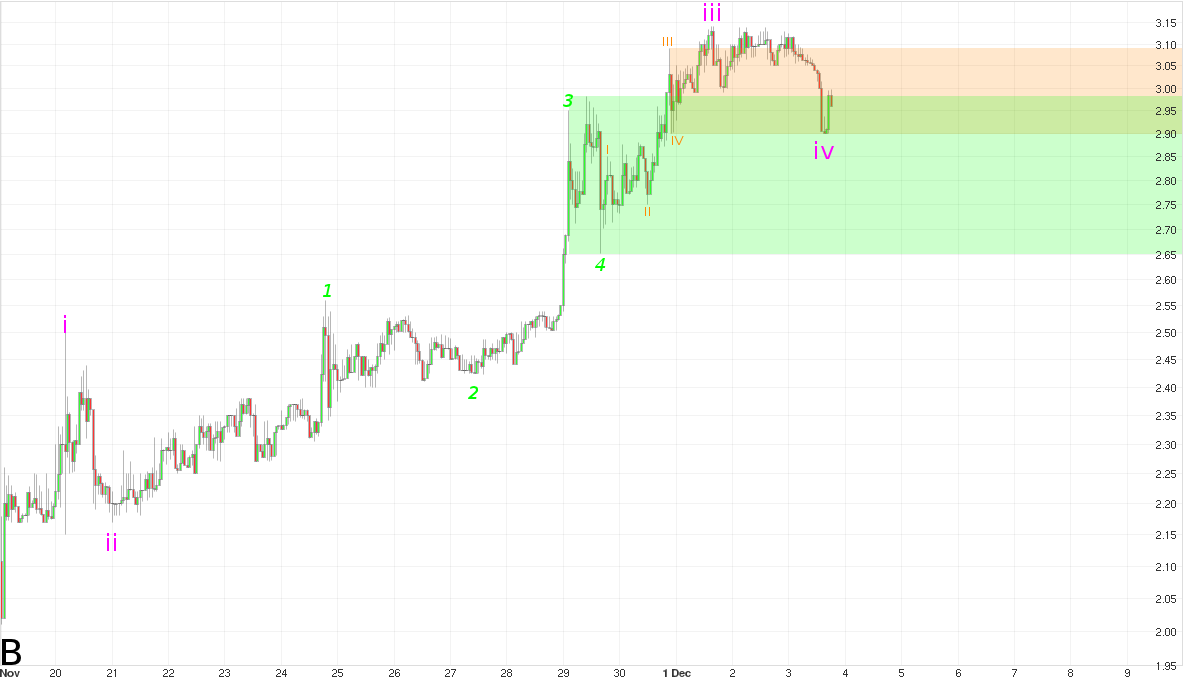
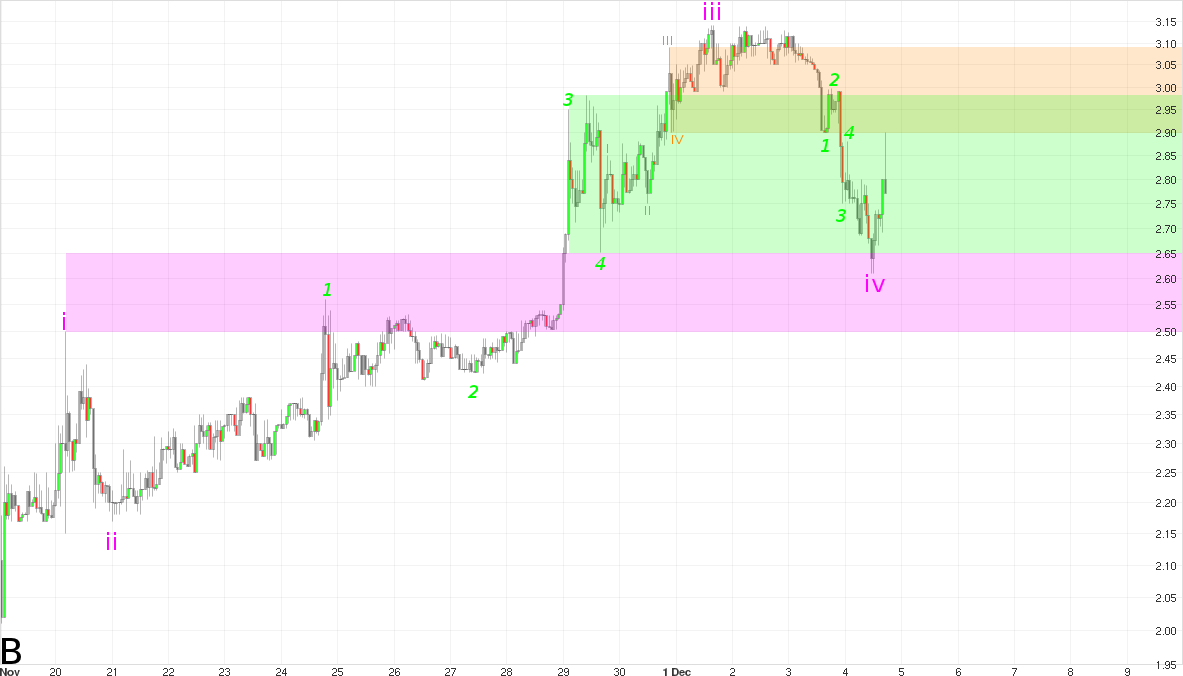
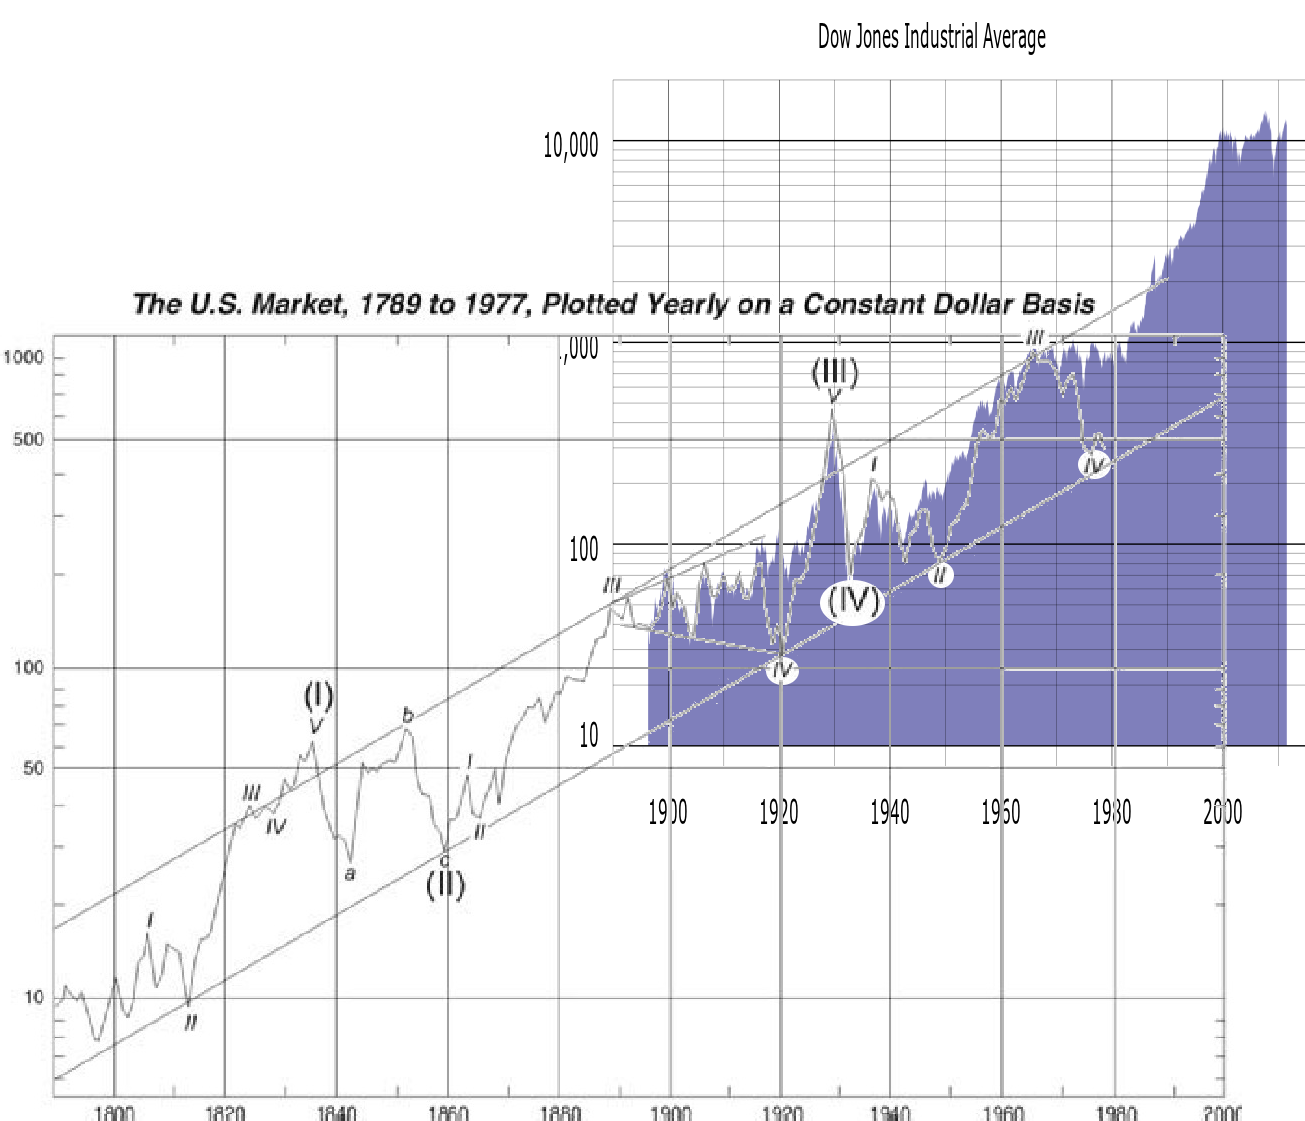
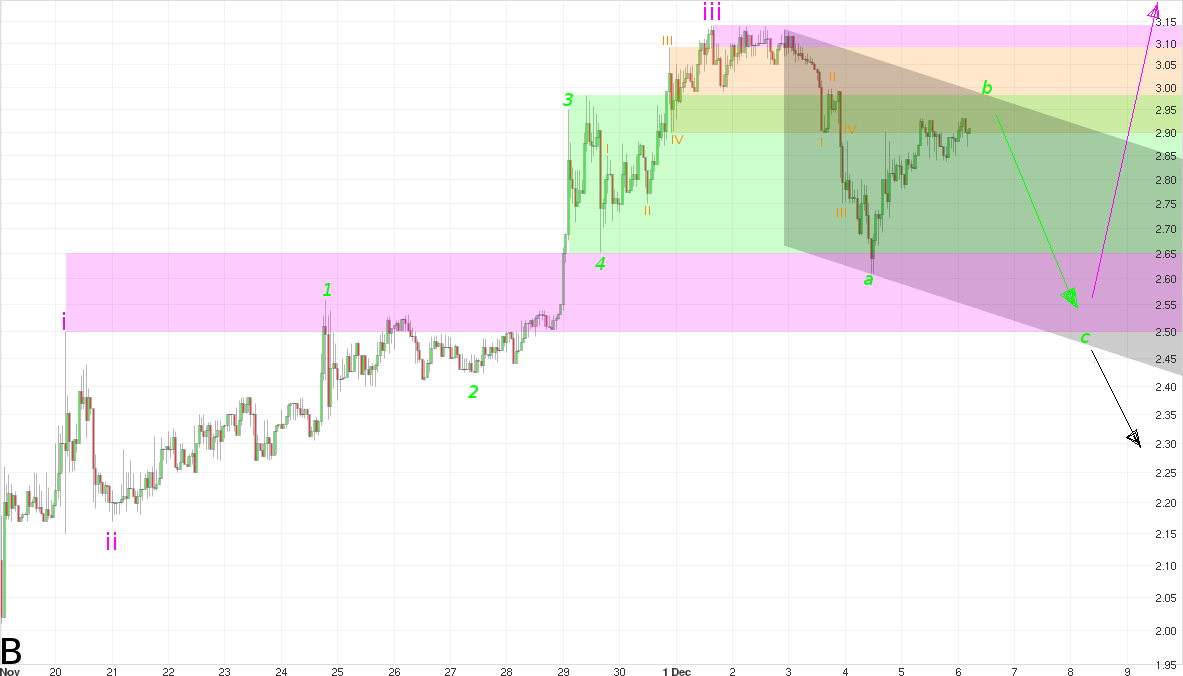
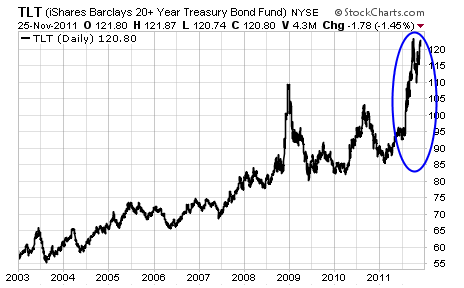