|
Title: Chart - Comparison - Very similar Post by: Mankov on June 30, 2019, 08:44:40 PM 2013
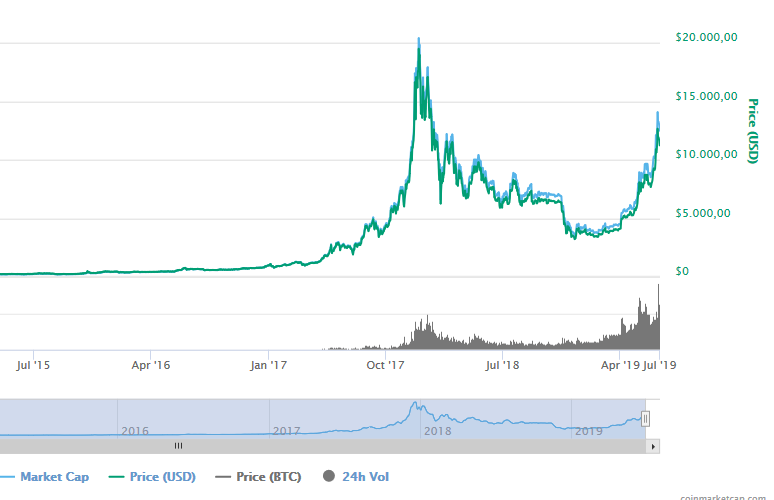
http://www.bitcoin2040.com/wp-content/uploads/2017/09/BTC-price-history.jpg 2018 https://s17.directupload.net/images/190630/xotifo8e.png Title: Re: Chart - Comparison - Very similar Post by: Payme21 on June 30, 2019, 08:47:52 PM History tends to repeat itself consistently and this is an evidence to that fact. Comparison is sometimes a strategy too
Title: Re: Chart - Comparison - Very similar Post by: Mankov on June 30, 2019, 08:50:33 PM ...yes, only the time periods are often much faster.
Title: Re: Chart - Comparison - Very similar Post by: AmoreJaz on June 30, 2019, 08:56:20 PM they have similarities but it doesnt mean it will imitate the trend all throughout. but of course, who doesnt want to repeat the ATH again???
be conservative on your speculations and lets be grateful if it really hits the ath again and who knows it might surpass the ATH in 2017... brace ourselves for whats coming!!! Title: Re: Chart - Comparison - Very similar Post by: pixie85 on June 30, 2019, 09:12:47 PM Many things change like the volume timespan and value but the charts still look very similar. We clearly have another peak but it can also go down without reaching a new high.
It won't be going to a new ATH every time. Oce there will be a bull run that will start like all the previous one and fail to beat the one before. Nothing in this world will gain value forever and make everyone who touches it rich. For now the similarity is striking and there's nothing to worry about but be careful. Title: Re: Chart - Comparison - Very similar Post by: exstasie on June 30, 2019, 10:14:14 PM It's certainly got the potential. However, until we break the ATH near $20K, there's still a possibility this $3K-$14K wave is a bull trap in a longer term bear market. I'd rate the probability of that pretty low, maybe 5-10% tops, but it's a nonzero possibility that inexperienced traders and investors never see coming.
Title: Re: Chart - Comparison - Very similar Post by: samcrypto on June 30, 2019, 10:56:10 PM Thats why expert says that history always repeat itself, and we are seeing an almost same pattern right now in the bull trend so we might see another ATH this year, depends on the trend. If we works accordingly base on that chart then bull run will be good. Though maybe it will took years again before it happen, just like the time frame on the above chart.
Title: Re: Chart - Comparison - Very similar Post by: WinslowIII on June 30, 2019, 10:59:34 PM Throw the charts out the window, there is no prior 4x price pump (or anything remotely near it) 1 year before the next halving. This price increase caught everyone off guard - pretty much because we are all focusing on past price patterns.
Title: Re: Chart - Comparison - Very similar Post by: pooya87 on July 01, 2019, 03:18:10 AM this is the worst comparison i have ever seen. you are comparing (the first chart) a time where price was already half way through the bull market and had surpassed the previous ATH of $1200 and was already 4 times higher than that with (the second chart) the time where we have just started the reversal and are barely in the bull market no to mention we have not yet even reached the ATH.
you should change the first chart to reflect the same thing if you actually want to compare. that means panning to the left until your end time frame is at somewhere in 2015 where similar to today we have just began the reversal and price was at $400ish coming up from $150 Title: Re: Chart - Comparison - Very similar Post by: davis196 on July 01, 2019, 06:40:48 AM ...guess, we see a new alltime-high, soon. The current bitcoin price is 10,900 USD.If by "soon" you mean next year,then yes,it will reach a new ATH at the summer of 2020.This comparison is kinda wrong and pointless,because the 2013 and 2017 price movements were caused by other factors.It's wrong to compare two price patterns without proper comparison of the factors that were causing them. Title: Re: Chart - Comparison - Very similar Post by: adaseb on July 01, 2019, 07:45:03 AM The charts might look similar but I can show you hundreds of stock charts which look similiar and half of those will be parabolic runners and the others might trade sideways or even go down. So its not good to compare just the charts.
Look at the Google trends for "BITCOIN" search term, https://trends.google.com/trends/explore?date=today%205-y&q=bitcoin We are nowhere near the 2017 high, even though its the highest high of the last year. So for Bitcoin to go to $100,000 according to your chart there needs to be enough buyers to bring us to that number. I don't think we are there yet. Title: Re: Chart - Comparison - Very similar Post by: figmentofmyass on July 01, 2019, 09:50:18 AM The charts might look similar but I can show you hundreds of stock charts which look similiar and half of those will be parabolic runners and the others might trade sideways or even go down. So its not good to compare just the charts. this. context is everything. it's possible the market blew its wad on $14k and will stagnate for months now. the bottom of the bear market was only 6 months ago, so we should probably expect some corrections and sideways along the way like we saw in 2016 and early 2017. Title: Re: Chart - Comparison - Very similar Post by: YuginKadoya on July 01, 2019, 11:57:29 AM It is too good to be true that we might get at that kind of level but we should not stay in an analytical outcome where it will be the same as before because it is not, Everything is possible we can have a dip and would have the Rise next year, But even if the chart and all that history will repeat itself thing is viable for us, We should not compare every detail, But one thing is sure about this movement we can surely see another All time high but I can not say when that is.
Title: Re: Chart - Comparison - Very similar Post by: boyptc on July 01, 2019, 05:32:43 PM I'm not really good at reading charts or analyzing it.
But everyone has been giving such high expectation for this year. I'll be confident after the halving but let's see on how this will turn before this year ends. Title: Re: Chart - Comparison - Very similar Post by: BitHodler on July 01, 2019, 07:24:51 PM I think most of these comparisons are done by crypto influencers on YouTube so that they have content for their videos, and people as easy as they are to be convinced of something swallow it without resistance.
Charts, regardless of the asset, contain similarities throughout the whole time of their existence. It so easy to find a similar time frame and chart patterns that you can make a chart look as bullish or bearish as you want. In hindsight you're either right or wrong. If you're wrong I'm sure we won't be hearing about it from you, but when you're right you'll make sure people know that you were right, and that while it was just a lucky shot. Title: Re: Chart - Comparison - Very similar Post by: Pipdips on July 01, 2019, 08:16:10 PM My feeling is that BTC will starting going down to the $8,000 area before it moves up again.
Title: Re: Chart - Comparison - Very similar Post by: exstasie on July 01, 2019, 08:33:37 PM My feeling is that BTC will starting going down to the $8,000 area before it moves up again. Is that based on TA or gut feeling? I'm on the fence here. This $10K area is pretty key, which is why bulls are trying to paint a double bottom off $9,950 on the 1-hour chart. I'd like to see whether a bullish reaction occurs here. Otherwise there are some pretty tasty targets between the $7,500 and $9,000 areas. Title: Re: Chart - Comparison - Very similar Post by: Pipdips on July 01, 2019, 08:41:24 PM Is that based on TA or gut feeling? It is just my own simplistic and basic view of the BTC charts. Despite all the amazing news surrounding BTC, I see BTC going down to the 8K territory after the parabolic. Who knows. It is a blood bath. Title: Re: Chart - Comparison - Very similar Post by: 1Referee on July 01, 2019, 09:46:46 PM It is just my own simplistic and basic view of the BTC charts. Despite all the amazing news surrounding BTC, I see BTC going down to the 8K territory after the parabolic. Who knows. It is a blood bath. Not entirely impossible. I wouldn't mind one major shake-off before we go back up again, but with how difficult it is to get a clear picture of the market, I'm not sure what to expect. It doesn't happen that often for me that I prefer to stay neutral for the time being, but this is a case where I will be neutral. If charts look ugly, confusing, that means one thing..... Hodl. Fundamentally speaking, with the block halving coming closer and closer, I will look to make use of whatever levels we will crash to in order to stack up satoshis. I do expect the $20,000 level to be broken through before we actually see the event take place. Don't let this current correction distract you. Don't feed the whales. Title: Re: Chart - Comparison - Very similar Post by: Dodoymabs on July 02, 2019, 06:57:19 AM If the case happen, it would be great especially those who holds a lot of coins because they can definitely pay off their long term of holding. This year seems to be good because of the increased value which it again gives hope to those who have faith in cryptocurrencies volatile characteristic.
Title: Re: Chart - Comparison - Very similar Post by: figmentofmyass on July 02, 2019, 07:20:33 AM My feeling is that BTC will starting going down to the $8,000 area before it moves up again. not a bad call so far! at least you can take solace in the fact that it actually went down after you sold. now that we've plowed through the previous $10.3k low and lost $10k as well, i'd be surprised if sellers didn't start coming out the woodworks. $8k is certainly possible. Title: Re: Chart - Comparison - Very similar Post by: Mankov on July 03, 2019, 09:25:52 AM Chart looks good, now.
I think we will reach more than 16 K, soon. Title: Re: Chart - Comparison - Very similar Post by: leowonderful on July 03, 2019, 10:00:48 AM Seems like we went a bit under $10K a few hours ago and we've bounced up nicely from that area of support to around $11K at the moment. Still seems like there is some selling pressure keeping us down, but it's looking good for a move up, potentially past the previous high we had near $1400. A lower high wouldn't be good though.
Title: Re: Chart - Comparison - Very similar Post by: el kaka22 on July 03, 2019, 04:21:30 PM I don't understand these people, I mean have you been in bitcoin for only couple weeks now?
Why is it so hard to understand that nothing in bitcoin world repeats itself ever again in the same manner. For example, the big increase in 2014 November was nothing like the 2017 peak one, they both went up but they were never the same thing. This increase for example, it was nothing like the 2014 nor 2017 neither. There is always changes in bitcoin world, not just bitcoin neither, crypto as well. One time bitcoin goes up and all others went down, one time bitcoin goes up and all others follow bitcoin. Just learn already that nothing that happened before will ever happen again the same possible way, it will once again go up and it will once again go down but never the same way twice. |