|
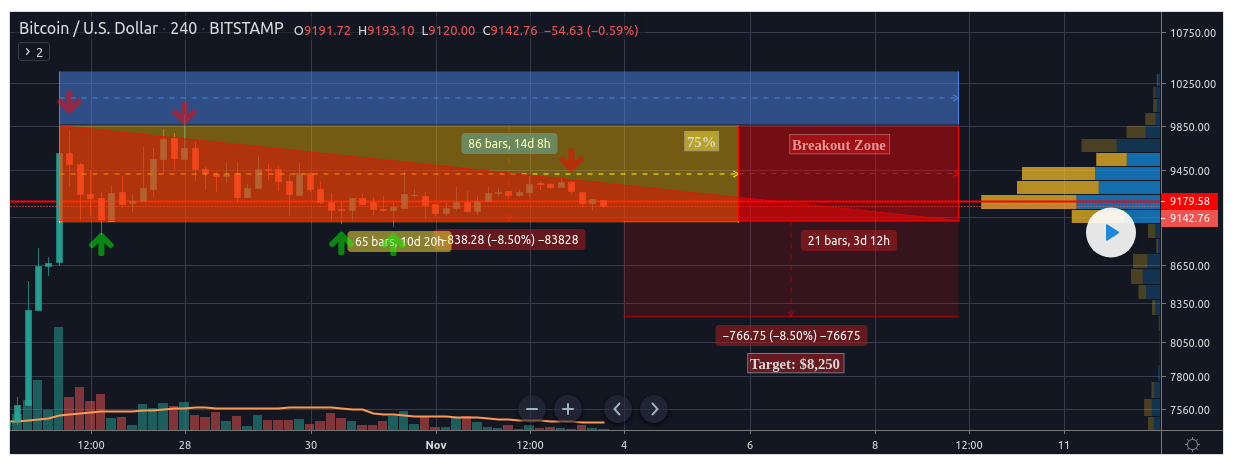
Title: Ascending Triangle...we are about to break bullish. 10.5K within a week. Post by: DrBitcoin on November 02, 2019, 11:38:33 PM I believe within one week from today we will break bullish and reach 10.5K. Maybe higher.
Ascending triangle has formed. Lets see. http://img4.imagetitan.com/img4/small/20/20_d9f8dc16-8711-4295-bfc0-c58c28bff929.jpeg (http://img4.imagetitan.com/img.php?image=20_d9f8dc16-8711-4295-bfc0-c58c28bff929.jpeg) Title: Re: Ascending Triangle...we are about to break bullish. 10.5K within a week. Post by: Pearls Before Swine on November 02, 2019, 11:42:50 PM $10,500 within a week? Okay, bump this thread in a week and we'll see if you're right. I've no idea what an ascending triangle is or means, but it sounds like one of those geometry gems that traders trade on. Am I right? I'm very bullish on bitcoin but I'm also hoping it doesn't pull a 2017 on us all. Increasing by $1000 in a week might be a little too much...but we'll see, right? Title: Re: Ascending Triangle...we are about to break bullish. 10.5K within a week. Post by: DrBitcoin on November 02, 2019, 11:45:39 PM $10,500 within a week? Okay, bump this thread in a week and we'll see if you're right. I've no idea what an ascending triangle is or means, but it sounds like one of those geometry gems that traders trade on. Am I right? I'm very bullish on bitcoin but I'm also hoping it doesn't pull a 2017 on us all. Increasing by $1000 in a week might be a little too much...but we'll see, right? Im not a trader. And I am an amateur. But Ive been in Bitcoin since 2014. I sense that things have settled and we are moving up. Just my feeling. Title: Re: Ascending Triangle...we are about to break bullish. 10.5K within a week. Post by: STT on November 02, 2019, 11:53:46 PM Try a bigger graph, I cant see the time scale. I have a decending trend that needs to be broken, its a triangle with some slight incline at the bottom also. The main deal is we are above the 200 day average at the moment.
My tiny chart also : https://i.imgur.com/z4FyqVQ.png Two possible negative trends, we beaten the more aggressive one and a higher trend of lower highs lines up with 200 day average for the moment but there is also an area 9500 to 10k roughly it needs to confirm above to stay positive. Title: Re: Ascending Triangle...we are about to break bullish. 10.5K within a week. Post by: InvoKing on November 02, 2019, 11:55:15 PM $10,500 within a week? Okay, bump this thread in a week and we'll see if you're right. I've no idea what an ascending triangle is or means, but it sounds like one of those geometry gems that traders trade on. Am I right? I'm very bullish on bitcoin but I'm also hoping it doesn't pull a 2017 on us all. Increasing by $1000 in a week might be a little too much...but we'll see, right? Im not a trader. And I am an amateur. But Ive been in Bitcoin since 2014. I sense that things have settled and we are moving up. Just my feeling. Triangle and other sophisticated analysis are a way to predict the tendances of the price. However bitcoin is very fluctuating vs other currencies and with such volatility it is hard to give a good prediction... I predict +$10k in the next weeks too since at the end of the year we saw almost the best price during the year Title: Re: Ascending Triangle...we are about to break bullish. 10.5K within a week. Post by: error08 on November 03, 2019, 01:01:32 AM Well, it may be true, look at the market charts, look at the market sentiment, look at the TAs.
Bitcoin's trend has changed from "sell" to "buy" right now. https://i.imgur.com/MEjmzip.png Another prediction from BitFink (https://www.tradingview.com/chart/BTCUSD/So4rVNxL-The-more-I-stare-at-this-the-more-sense-this-makes/) It's time to buy more and accumulate more bitcoin to your wallet. The white line is halving https://i.imgur.com/YV30Dlm.png Title: Re: Ascending Triangle...we are about to break bullish. 10.5K within a week. Post by: adaseb on November 03, 2019, 02:57:24 AM In my opinion it's about 50/50. Sure we got this triangle and we are in a large bull flag but keep in mind that there is a CME gap that hasn't filled yet and since $9000 support broke a few weeks ago we are now in resistance areas if you look at the weekly chart.
Hence this is why price action is important and you should wait for a move first before taking any action. This is similar to what happened last November we basically were trading sideways until mid November 2018 were we broke support and kept going downwards and downwards and downwards. So wait for the move and then enter the trade. Title: Re: Ascending Triangle...we are about to break bullish. 10.5K within a week. Post by: boltz on November 03, 2019, 04:07:41 AM I believe within one week from today we will break bullish and reach 10.5K. Maybe higher. Ascending triangle has formed. Lets see. http://img4.imagetitan.com/img4/small/20/20_d9f8dc16-8711-4295-bfc0-c58c28bff929.jpeg (http://img4.imagetitan.com/img.php?image=20_d9f8dc16-8711-4295-bfc0-c58c28bff929.jpeg) Triangles in bitcoin charts form every month and they never break until now to huge spikes so I doubt it will happen now but hey if it does , I think we're all happy , right ? It would be time to break that 10k$ range again in hoping we will never see Bitcoin under 10k as we stayed to much into the bear market so its time for a change of winds as the signs of bulls being here are quite visible into the markets with strong accumulate zones. Title: Re: Ascending Triangle...we are about to break bullish. 10.5K within a week. Post by: wajik-tempe on November 03, 2019, 04:25:19 AM I believe within one week from today we will break bullish and reach 10.5K. Maybe higher. Ascending triangle has formed. Lets see. http://img4.imagetitan.com/img4/small/20/20_d9f8dc16-8711-4295-bfc0-c58c28bff929.jpeg (http://img4.imagetitan.com/img.php?image=20_d9f8dc16-8711-4295-bfc0-c58c28bff929.jpeg) Price chart looks strong on 9,2k resistance and stand still for a week. I think not much longer the price will move either it's going to 10k or it will have more correction to 9k. We hope the market will green next week because i've already invest some in BTC. 10,5k would be the next resistance if BTC can break it. But always prepare for the worst chance that btc can go down to 9k again, if it failed to reach it's next resistance on 10k+ Title: Re: Ascending Triangle...we are about to break bullish. 10.5K within a week. Post by: jrrsparkles on November 03, 2019, 05:53:40 AM I believe within one week from today we will break bullish and reach 10.5K. Maybe higher. Not much of movement in the daily graph for the past few days so are you sure we are going to break 10K again?Ascending triangle has formed. Lets see. http://img4.imagetitan.com/img4/small/20/20_d9f8dc16-8711-4295-bfc0-c58c28bff929.jpeg (http://img4.imagetitan.com/img.php?image=20_d9f8dc16-8711-4295-bfc0-c58c28bff929.jpeg) Maybe for a short term but people will again rush to sell their bitcoins once it reaches 10K level so it is going to be gambling on the speculating things until the bitcoin halve. Title: Re: Ascending Triangle...we are about to break bullish. 10.5K within a week. Post by: Tylev on November 03, 2019, 06:03:57 AM I have been convinced more than once that Bitcoin is not amenable to any technical forecasts. It begins to fall or rise in price very often contrary to expectations and forecasts. So far, I see that the price of bitcoin practically stands still at around $ 9,300. In general, this is a good price for it, but at the end of the year we expect a significant increase in the price in the cryptocurrency market. Now, bitcoin at any moment can begin to grow rapidly in price, and can stand still for a long time.
Title: Re: Ascending Triangle...we are about to break bullish. 10.5K within a week. Post by: pooya87 on November 03, 2019, 06:12:01 AM you are getting too excited again by seeing a small movement in a certain direction. you did that with the drop to $8k where you were expecting $6800 "soon and going lower from there", and you are doing it again with this rise.
the fact is that it is not possible to predict price movements at times like this. specifically when you are predicting a "break out" which is proven to be hard at times when price is to break a big psychological resistance such as $10k. not to mention that if it is broken then the price could shoot up a lot more again similar to all previous breakouts. so we should technically see at least $13k. Title: Re: Ascending Triangle...we are about to break bullish. 10.5K within a week. Post by: Oasisman on November 03, 2019, 06:25:20 AM I have been convinced more than once that Bitcoin is not amenable to any technical forecasts. It begins to fall or rise in price very often contrary to expectations and forecasts. So far, I see that the price of bitcoin practically stands still at around $ 9,300. In general, this is a good price for it, but at the end of the year we expect a significant increase in the price in the cryptocurrency market. Now, bitcoin at any moment can begin to grow rapidly in price, and can stand still for a long time. It is somehow amenable to some extent, specially to those who are following TA's, and there are quite a huge number of them but that doesn't mean the market always follow where the technical forecast is heading. Charts aren't even a very reliable source because it cannot fully control the emotions of the traders and investors. Yet, it has the closest outcome more than just random predictions coming from the big names in business industry. Title: Re: Ascending Triangle...we are about to break bullish. 10.5K within a week. Post by: sheenshane on November 03, 2019, 06:53:33 AM That is a spirit of bullish mind but I think breaking $10.5k is too high level if we technically predicting by next week and probably less than by that. I believed there is a bullish trend awaiting and I saw technical forecasts from different well-known people like Prophecy of Asuka (https://www.newsbtc.com/2019/10/31/bitcoin-pump-halloween-prophecy-of-asuka/) and the tweet of Binance CEO on this thread (https://bitcointalk.org/index.php?topic=5197975). They are technically forecasting that Bitcoin will get in touch to $16k soon and probably that was the start of the next halving event.
But as of now the current price of Bitcoin is in the $9.2k in the CMC, it is not hard to reach even $13k within a day just like what happened last week it was rapidly moving upward from $7.4k up to $10.5k. But let just see what happens and accumulating is the best option by now. Title: Re: Ascending Triangle...we are about to break bullish. 10.5K within a week. Post by: exstasie on November 03, 2019, 06:57:23 AM I've no idea what an ascending triangle is or means, but it sounds like one of those geometry gems that traders trade on. Am I right? http://thepatternsite.com/at.html Thomas Bulkowski's backtesting says they break upward 63% of the time. They more commonly appear as continuation patterns rather than reversal patterns, but the OP's fractal could play out like this: https://i.imgur.com/Sjnbzlr.png Title: Re: Ascending Triangle...we are about to break bullish. 10.5K within a week. Post by: Kyraishi on November 03, 2019, 08:35:46 AM Bit of a hard to see chart, try and make it a bit bigger just via paint, or take a larger screenshot of the application you are looking at, just to make it easier on the eyes for other people.
With the pump happening last week, it seems like the main course of action for everyone is the buy, and I am definitely seeing a lot of that happen with the current market. For it to bump over 10 percent during a week though, that sounds a bit too much, it's been done before, not sure about this time though. Title: Re: Ascending Triangle...we are about to break bullish. 10.5K within a week. Post by: Sadlife on November 03, 2019, 08:45:15 AM I believe within one week from today we will break bullish and reach 10.5K. Maybe higher. the last time i see a thread created by you is very Bearish and you have predicted that bitcoin price will go below %7k and drop to 6k$ but it doesnt happen though very close since we step down to almost below $7k Ascending triangle has formed. Lets see. http://img4.imagetitan.com/img4/small/20/20_d9f8dc16-8711-4295-bfc0-c58c28bff929.jpeg (http://img4.imagetitan.com/img.php?image=20_d9f8dc16-8711-4295-bfc0-c58c28bff929.jpeg) so from that i know i can find you reliable in prediction,now that you turns to bullish i think i love waiting this 1 week duration and will be glad if this happen,goodluck to us . Title: Re: Ascending Triangle...we are about to break bullish. 10.5K within a week. Post by: LFC_Bitcoin on November 03, 2019, 08:58:47 AM I believe within one week from today we will break bullish and reach 10.5K. Maybe higher. Ascending triangle has formed. Lets see. http://img4.imagetitan.com/img4/small/20/20_d9f8dc16-8711-4295-bfc0-c58c28bff929.jpeg (http://img4.imagetitan.com/img.php?image=20_d9f8dc16-8711-4295-bfc0-c58c28bff929.jpeg) Always good to see bullish, realistic charts/projections. I hope youre right OP, itd be nice to get & stay above $10,000 before New Year. Title: Re: Ascending Triangle...we are about to break bullish. 10.5K within a week. Post by: arwin100 on November 03, 2019, 09:38:28 AM I believe within one week from today we will break bullish and reach 10.5K. Maybe higher. Ascending triangle has formed. Lets see. http://img4.imagetitan.com/img4/small/20/20_d9f8dc16-8711-4295-bfc0-c58c28bff929.jpeg (http://img4.imagetitan.com/img.php?image=20_d9f8dc16-8711-4295-bfc0-c58c28bff929.jpeg) Always good to see bullish, realistic charts/projections. I hope youre right OP, itd be nice to get & stay above $10,000 before New Year. It seems realistic really but there's no bad things blockings it's growth so provably we can see a 10k$ or maybe even more in this succeeding months. And we should remember that halving is coming so provably people set aside those negativity that's why we can see a positive prediction like this coming. Title: Re: Ascending Triangle...we are about to break bullish. 10.5K within a week. Post by: AliMan on November 03, 2019, 10:12:32 AM I believe within one week from today we will break bullish and reach 10.5K. Maybe higher. Ascending triangle has formed. Lets see. http://img4.imagetitan.com/img4/small/20/20_d9f8dc16-8711-4295-bfc0-c58c28bff929.jpeg (http://img4.imagetitan.com/img.php?image=20_d9f8dc16-8711-4295-bfc0-c58c28bff929.jpeg) Always good to see bullish, realistic charts/projections. I hope youre right OP, itd be nice to get & stay above $10,000 before New Year. It seems realistic really but there's no bad things blockings it's growth so provably we can see a 10k$ or maybe even more in this succeeding months. And we should remember that halving is coming so provably people set aside those negativity that's why we can see a positive prediction like this coming. More positive thoughts are coming now, we should be careful on that because it might not be so good if we're expecting too much. Possible frustration will occur for everybody who always looks after on bullish trend, and it's good to see if we're just maintaining a calm attitude while waiting for the right time. However it that's going to perform gracefully this coming weeks, let's see what would happen in due time. Title: Re: Ascending Triangle...we are about to break bullish. 10.5K within a week. Post by: barota on November 03, 2019, 10:31:06 AM I believe within one week from today we will break bullish and reach 10.5K. Maybe higher. Ascending triangle has formed. Lets see. http://img4.imagetitan.com/img4/small/20/20_d9f8dc16-8711-4295-bfc0-c58c28bff929.jpeg (http://img4.imagetitan.com/img.php?image=20_d9f8dc16-8711-4295-bfc0-c58c28bff929.jpeg) Always good to see bullish, realistic charts/projections. I hope youre right OP, itd be nice to get & stay above $10,000 before New Year. It seems realistic really but there's no bad things blockings it's growth so provably we can see a 10k$ or maybe even more in this succeeding months. And we should remember that halving is coming so provably people set aside those negativity that's why we can see a positive prediction like this coming. yes the probabelity can become possible. prices may touch level 13000 usd per btc and stable above 10000 usd per btc at latest before new year or 2020 ;prices now above 9000 usd per btc and it seem this a good support ligne and for sure another green day with small pump will make price at 10.5k usd per btc ; of course this rise in prices bitcoin can happend this week . who know? Title: Re: Ascending Triangle...we are about to break bullish. 10.5K within a week. Post by: Wexnident on November 03, 2019, 01:14:18 PM $10,500 within a week? Okay, bump this thread in a week and we'll see if you're right. I've no idea what an ascending triangle is or means, but it sounds like one of those geometry gems that traders trade on. Am I right? I'm very bullish on bitcoin but I'm also hoping it doesn't pull a 2017 on us all. Increasing by $1000 in a week might be a little too much...but we'll see, right? I do hope for a bullish run at times, but well that is just hoping for me anyhow. Title: Re: Ascending Triangle...we are about to break bullish. 10.5K within a week. Post by: dragonvslinux on November 03, 2019, 01:46:09 PM As an update, this ascending triangle broke down this morning. The double top on smaller-time frames was still bullish, but the bearish RSI divergence that appeared wasn't apparently.
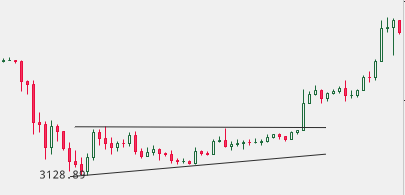
https://www.tradingview.com/x/NFcWqk9h/ There's an argument for an ascending broadening wedge however, with the 200 Day MA acting as the ascending trend-line in dotted gold. https://www.tradingview.com/x/0D4I7yKz/ Own work (https://bitcointalk.org/index.php?topic=1159946.msg51280905#msg51280905): dragononcrypto (https://www.tradingview.com/u/dragononcrypto/) https://excellenceassured.com/wp-content/uploads/2016/06/Ascending-Broadening-Wedges.png Source (https://excellenceassured.com/trading/trade-chart-patterns/broadening-patterns-wedges) As opposed to claiming that "Ascending Braodening Wedge...we are about to break bullish", I'd argue there's a high enough probability of breaking bullish, with confirmation only. Be cautious of this descending triangle (https://bitcointalk.org/index.php?topic=5198331.0) on a larger time-frame, that as per usual would be bearish if we close (confirm) a 4hr candle below $9,020: https://talkimg.com/images/2023/09/10/m8lEJ.png (https://bitcointalk.org/index.php?topic=5198331.0) Own work (https://bitcointalk.org/index.php?topic=1159946.msg51280905#msg51280905): dragononcrypto (https://www.tradingview.com/u/dragononcrypto/) Title: Re: Ascending Triangle...we are about to break bullish. 10.5K within a week. Post by: Wysi on November 03, 2019, 07:24:26 PM I believe within one week from today we will break bullish and reach 10.5K. Maybe higher. Ascending triangle has formed. Lets see. http://img4.imagetitan.com/img4/small/20/20_d9f8dc16-8711-4295-bfc0-c58c28bff929.jpeg (http://img4.imagetitan.com/img.php?image=20_d9f8dc16-8711-4295-bfc0-c58c28bff929.jpeg) Always good to see bullish, realistic charts/projections. I hope youre right OP, itd be nice to get & stay above $10,000 before New Year. It seems realistic really but there's no bad things blockings it's growth so provably we can see a 10k$ or maybe even more in this succeeding months. And we should remember that halving is coming so provably people set aside those negativity that's why we can see a positive prediction like this coming. More positive thoughts are coming now, we should be careful on that because it might not be so good if we're expecting too much. Possible frustration will occur for everybody who always looks after on bullish trend, and it's good to see if we're just maintaining a calm attitude while waiting for the right time. However it that's going to perform gracefully this coming weeks, let's see what would happen in due time. Nice to see so many positive posts after a very long time, but it would be great if we witness a gradual increase rather than sudden pump and unexpected dump. Our mind is filled with so many negative thought after a year long bearish market and I feel skeptic whether it's a bull trap or genuine increase after so many bull trap which we have witnessed. Let's not make any hasty decisions right now unless we are traders. Title: Re: Ascending Triangle...we are about to break bullish. 10.5K within a week. Post by: exstasie on November 03, 2019, 08:19:20 PM As an update, this ascending triangle broke down this morning. The double top on smaller-time frames was still bullish, but the bearish RSI divergence that appeared wasn't apparently. https://www.tradingview.com/x/NFcWqk9h/ Triangles aren't usually reversal patterns (though it happens). So when I saw the OP charting an ascending triangle off the bottom, I was skeptical. Then I saw it was on the hourly chart and I was doubly skeptical. No surprises here. Chart patterns work best for me on the daily and higher time frames. So much noise at intraday time frames..... Title: Re: Ascending Triangle...we are about to break bullish. 10.5K within a week. Post by: dragonvslinux on November 03, 2019, 08:34:48 PM As an update, this ascending triangle broke down this morning. The double top on smaller-time frames was still bullish, but the bearish RSI divergence that appeared wasn't apparently. https://www.tradingview.com/x/NFcWqk9h/ Triangles aren't usually reversal patterns (though it happens). So when I saw the OP charting an ascending triangle off the bottom, I was skeptical. Then I saw it was on the hourly chart and I was doubly skeptical. No surprises here. Chart patterns work best for me on the daily and higher time frames. So much noise at intraday time frames..... Not sure I'd consider that triangle a reversal, more of a continuation as part of a bull flag, but it's subject and I do see your point as it came from the relative lows. As you said: smaller the time frame, the less reliable the pattern. Title: Re: Ascending Triangle...we are about to break bullish. 10.5K within a week. Post by: 1Referee on November 03, 2019, 11:13:33 PM Triangles aren't usually reversal patterns (though it happens). It was a major one this year. Before the price exploded from $4000 to $5000 we were perfectly completing an ascending triangle with a ~$1000 measured move, which is exactly what we got. The only thing is that people weren't talking about it back then, where nowadays everyone and their dog knows about them, which weakens their actual effect, so I expect triangle breakouts to result in sideways price action more often until a longer time frame pattern breaks. We had a time where short squeezes were hyped up, then head and shoulders patterns, bart patterns, triangle patterns, etc. What's next? Title: Re: Ascending Triangle...we are about to break bullish. 10.5K within a week. Post by: figmentofmyass on November 03, 2019, 11:53:09 PM Triangles aren't usually reversal patterns (though it happens). It was a major one this year. Before the price exploded from $4000 to $5000 we were perfectly completing an ascending triangle with a ~$1000 measured move, which is exactly what we got. The only thing is that people weren't talking about it back then, where nowadays everyone and their dog knows about them, which weakens their actual effect, so I expect triangle breakouts to result in sideways price action more often until a longer time frame pattern breaks. We had a time where short squeezes were hyped up, then head and shoulders patterns, bart patterns, triangle patterns, etc. What's next? i never even noticed that. you're right, it's a perfect example of an ascending triangle. https://i.imgur.com/ZfQTDnl.png nobody took notice at the time because everyone was bearish IMO. most people consider ascending triangles to be bullish, so they ignored it. everybody plays to their biases....... Title: Re: Ascending Triangle...we are about to break bullish. 10.5K within a week. Post by: dragonvslinux on November 04, 2019, 12:00:38 AM Triangles aren't usually reversal patterns (though it happens). It was a major one this year. Before the price exploded from $4000 to $5000 we were perfectly completing an ascending triangle with a ~$1000 measured move, which is exactly what we got. The only thing is that people weren't talking about it back then, where nowadays everyone and their dog knows about them, which weakens their actual effect, so I expect triangle breakouts to result in sideways price action more often until a longer time frame pattern breaks. We had a time where short squeezes were hyped up, then head and shoulders patterns, bart patterns, triangle patterns, etc. What's next? i never even noticed that. you're right, it's a perfect example of an ascending triangle. https://talkimg.com/images/2023/09/10/m882N.png nobody took notice at the time because everyone was bearish IMO. most people consider ascending triangles to be bullish, so they ignored it. everybody plays to their biases....... I think the reason this particular ascending triangle was ignored was due to only have two touch-points along the ascending trend-line support (with a relevant distance between these contact points). Most consider the pattern as relevant with 3 touch-points minimum per support/resistance trend-line, which is the basic confirmation requirement of any triangle based pattern. Traders that ignore ascending triangles and only acknowledging descending triangles (and visa versa) are clearly not very clever traders ::) Unfortunately for many traders, the third touch-point never occurred to properly confirm this ascending triangle, even if hindsight is a great afterthought. Title: Re: Ascending Triangle...we are about to break bullish. 10.5K within a week. Post by: figmentofmyass on November 04, 2019, 12:58:42 AM i never even noticed that. you're right, it's a perfect example of an ascending triangle. https://i.imgur.com/ZfQTDnl.png nobody took notice at the time because everyone was bearish IMO. most people consider ascending triangles to be bullish, so they ignored it. everybody plays to their biases....... I think the reason this particular ascending triangle was ignored was due to only have two touch-points along the ascending trend-line support (with a relevant distance between these contact points). Most consider the pattern as relevant with 3 touch-points minimum per support/resistance trend-line, which is the basic confirmation requirement of any triangle based pattern. Traders that ignore ascending triangles and only acknowledging descending triangles (and visa versa) are clearly not very clever traders ::) Unfortunately for many traders, the third touch-point never occurred to properly confirm this ascending triangle, even if hindsight is a great afterthought. whose rules are those? i was always taught that two touches are required to form a triangle's trendlines. https://www.investopedia.com/terms/a/ascendingtriangle.asp Quote A minimum of two swing highs and two swing lows are required to form the ascending triangle's trendlines. the fifth wave in triangles (wave E in elliott wave terms) providing a third touch is the textbook ideal but it often doesn't happen. Title: Re: Ascending Triangle...we are about to break bullish. 10.5K within a week. Post by: STT on November 04, 2019, 03:12:58 AM Earlier this year I noticed the rising lows and it was quite regular and a reliable pattern. The mistake was I didnt put enough weight behind what then occurs when people notice it held, switching from a negative sentiment to the possibility of Bitcoin rising just by itself that was worth a buy. Also another thing I'm not great on is when we break up, the price is higher but price actually holding past that previous resistance again is bullish and worth a trade, the mistake is not being confident at those times. Buying at the higher price is hard to do imo, people want to believe they can buy at the lows.
I dont see anything like that now, we got noise and maybe this or that and it'll clear eventually but I'd guess we bounce around like a squash court :O Quote 200 Day MA acting as the ascending trend-line MA is an indicator, short term price will rebound off alot of things but I dont reckon averages can stop price movement as its an indicator not the actual trend itself. If that were to play out now, price is at 200 DMA but if we are negative it should be going to like 8500 as thats a trend or extrapolation of previous pricing. Title: Re: Ascending Triangle...we are about to break bullish. 10.5K within a week. Post by: dragonvslinux on November 04, 2019, 03:25:01 AM i never even noticed that. you're right, it's a perfect example of an ascending triangle. https://talkimg.com/images/2023/09/10/m8g49.png nobody took notice at the time because everyone was bearish IMO. most people consider ascending triangles to be bullish, so they ignored it. everybody plays to their biases....... I think the reason this particular ascending triangle was ignored was due to only have two touch-points along the ascending trend-line support (with a relevant distance between these contact points). Most consider the pattern as relevant with 3 touch-points minimum per support/resistance trend-line, which is the basic confirmation requirement of any triangle based pattern. Traders that ignore ascending triangles and only acknowledging descending triangles (and visa versa) are clearly not very clever traders ::) Unfortunately for many traders, the third touch-point never occurred to properly confirm this ascending triangle, even if hindsight is a great afterthought. whose rules are those? i was always taught that two touches are required to form a triangle's trendlines. https://www.investopedia.com/terms/a/ascendingtriangle.asp It comes from the basic rules of statistics that I follow, which I find very relevant when calculating risk/reward probabilities based on chart patterns, that in themselves are unreliable enough as it is. For example: 1 is anomaly, 2 is coincidence, 3+ is a pattern. I'm therefore not interested in coincidental patterns, but confirmed ones. Ie from a numbers perspective, you can't analyze two or less numbers statistically speaking, but three or more is possible to do. Quote from: Chart school Four (4) Points: At least 2 points are required to form a trend line and 2 trend lines are required to form a symmetrical triangle. Therefore, a minimum of 4 points are required to begin considering a formation as a symmetrical triangle. The second high (2) should be lower than the first (1) and the upper line should slope down. The second low (2) should be higher than the first (1) and the lower line should slope up. Ideally, the pattern will form with 6 points (3 on each side) before a breakout occurs. I care about the precision of the pattern, so 3 touch-points is a must for me otherwise it screws with probability. I also like things that are ideal, as opposed to the bare minimum to be honest :D Title: Re: Ascending Triangle...we are about to break bullish. 10.5K within a week. Post by: alexsandria on November 06, 2019, 04:09:22 AM I believe within one week from today we will break bullish and reach 10.5K. Maybe higher. Ascending triangle has formed. Lets see. http://img4.imagetitan.com/img4/small/20/20_d9f8dc16-8711-4295-bfc0-c58c28bff929.jpeg (http://img4.imagetitan.com/img.php?image=20_d9f8dc16-8711-4295-bfc0-c58c28bff929.jpeg) May be it would break sooner or later. Maybe this ascending triangle will soon be break depending on the current events happening around. But I think it will last song 'cause of there is a lot of big names out there that start adopting crypto currency such as China, Starbucks and so on. Though it is not as definite as we think but at least it is there. Title: Re: Ascending Triangle...we are about to break bullish. 10.5K within a week. Post by: Getmon on November 06, 2019, 04:23:54 AM I believe within one week from today we will break bullish and reach 10.5K. Maybe higher. Ascending triangle has formed. Lets see. http://img4.imagetitan.com/img4/small/20/20_d9f8dc16-8711-4295-bfc0-c58c28bff929.jpeg (http://img4.imagetitan.com/img.php?image=20_d9f8dc16-8711-4295-bfc0-c58c28bff929.jpeg) Let us see where this ascending triangle will bring us. If there will be no big news, whether positive or negative, about Bitcoin or anything that would affect its price in the coming few days, this ascending triangle might really bring us to the $11,000 price, similar to the price in Argentina, where the people are caught by a falling economy. But with the current red of Bitcoin getting lower and lower, a long green might take over and break $10,000 sooner rather than later. |