|
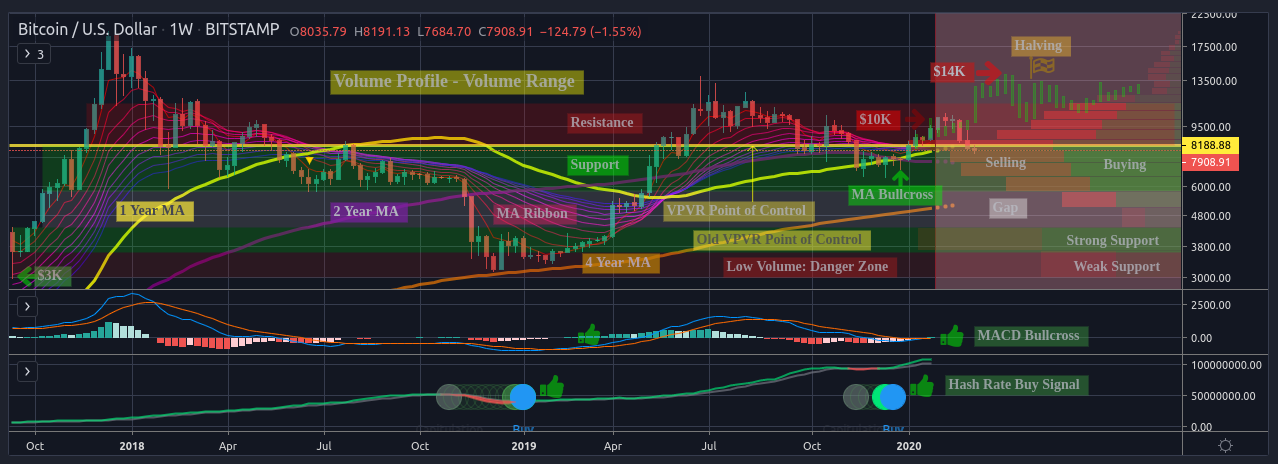
Title: [Chart] VPVR Part 1: Volume Profile Accumulation Zone $5,910 - $8,630 Post by: dragonvslinux on January 21, 2020, 11:26:19 PM Part 1: Volume Profile Accumulation Zone $5,910 - $8,630 (VPVR) https://talkimg.com/images/2023/09/10/mBTuP.png (https://www.tradingview.com/chart/BLX/fYAFsDj8-BTCUSD-Volume-Profile-Accumulation-Zone-5-910-8-630/) Source: TradingView (https://www.tradingview.com/chart/BLX/fYAFsDj8-BTCUSD-Volume-Profile-Accumulation-Zone-5-910-8-630/), February 3rd 2020. Screenshot: June 5th 2020.
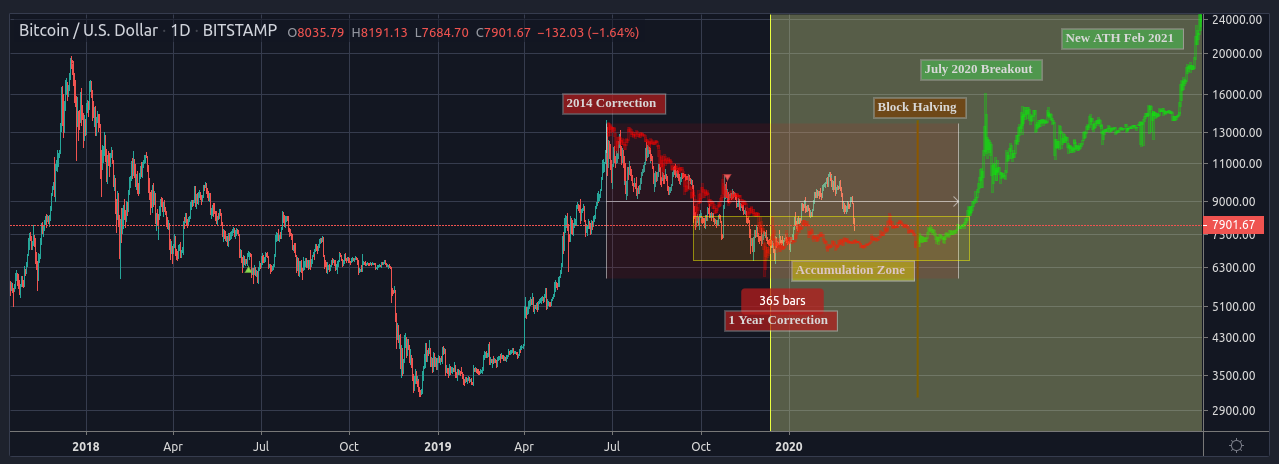
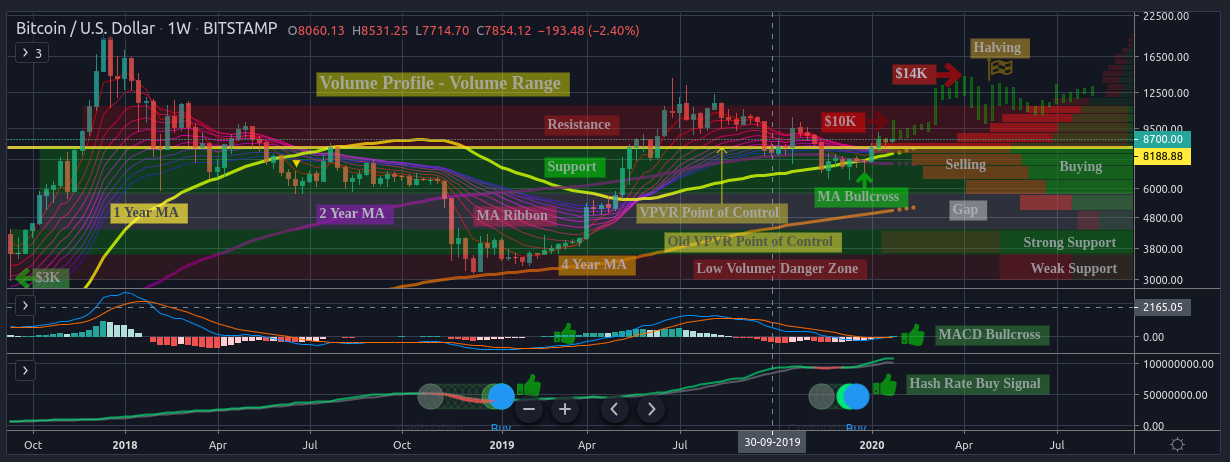
Part 2: Bitstamp Volume Point of Control $8,188 Now Turned Support (https://bitcointalk.org/index.php?topic=5221059.0) https://talkimg.com/images/2023/09/10/mBtFq.png (https://www.tradingview.com/chart/BTCUSD/aV6MM1zp-BTCUSD-VPVR-Part-2-Volume-Point-of-Control-Now-Turned-Support/) Continued TA from Extrapolating 2014 Correction: Could $6,500 Be The Low For Bitcoin? (https://bitcointalk.org/index.php?topic=5209110.0) https://talkimg.com/images/2023/09/10/mBzoj.png (https://bitcointalk.org/index.php?topic=5209110.0) Title: Re: [Chart] Volume Profile Accumulation Zone $5,910 - $8,630 (VPVR) Post by: Coin_trader on January 21, 2020, 11:33:36 PM That range is a bit too wide and a play safe chart. This is the first time I see a Weekly timeframe that used in crypto. I agree on this if you are a lifetime hodler and have a steel balls in trading but if you are a regular trader.
Maybe you can refer to this one. https://www.tradingview.com/chart/BTCUSD/gqlvf0n0-BITCOIN-Final-Steps-Before-CLEAR-Up-Trend/?utm_source=notification_email&utm_medium=email&utm_campaign=notification_publish Title: Re: [Chart] Volume Profile Accumulation Zone $5,910 - $8,630 (VPVR) Post by: dragonvslinux on January 22, 2020, 10:15:40 AM That range is a bit too wide and a play safe chart. Yes very true. This is much more of a macro perspective (based on the past 2.25 years), as opposed to a shorter-term time-frame of the past 6 months or a year. Hence why I felt it useful to share while most people (including myself) are zooming into the smaller picture trying to understand immediate price direction, it might be worth understanding why/where the price has been where it is in the past few months and the implications volume wise. Hence, this is an educational chart, rather than speculative TA. Title: Re: [Chart] Volume Profile Accumulation Zone $5,910 - $8,630 (VPVR) Post by: el kaka22 on January 22, 2020, 07:46:38 PM The main topic here is not that price could be "6k to 8.5k" it just means the volume was mainly there which is why there is less volume above, if you reach above levels it will be easier to go up and down. That is why we were able to rush to 20k so easily, after breaking 10k, there are not many sellers, sure there are not many buyers as well but those buyers could come around when they see the price going up and hope that sellers do not show up when that happens. Just even last year we managed to get from 3k to 13k all thanks to less volume at higher levels.
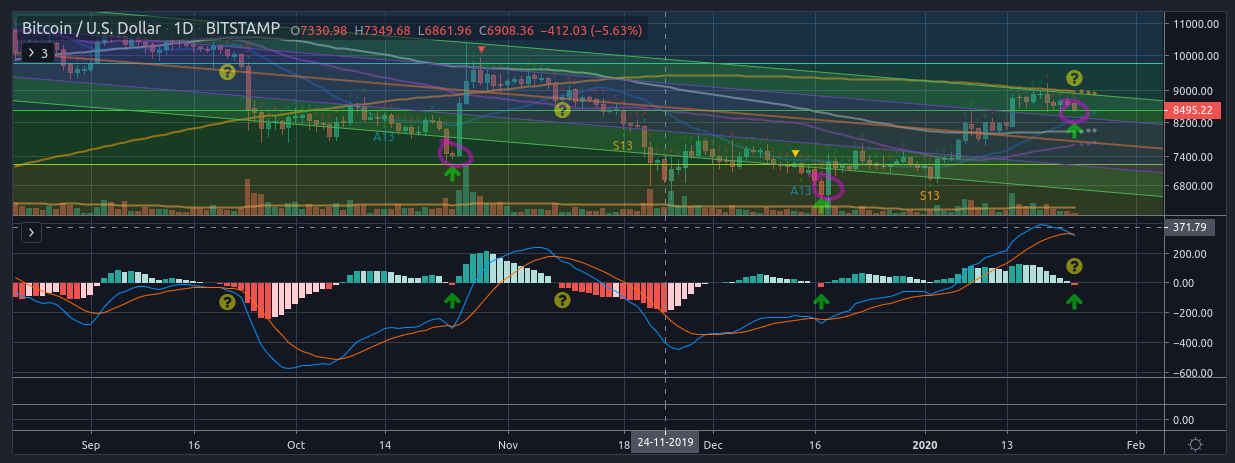
If we could manage to break 11.5k one day, it will be once again easier to break towards 15k yet again since it requires less money since there are less sellers. You end up buying all sellers coins (most of them at least) after you reach to 9-10k anyway. Title: Re: [Chart] Volume Profile Accumulation Zone $5,910 - $8,630 (VPVR) Post by: exstasie on January 22, 2020, 09:55:46 PM Suggested accumulation zone: $5,910 - $8,630. This is where the bulk of the volumes lies in the past 27 months. Thanks for the chart. That's a fat volume area, alright. The recent downtrend/recovery seems to have confirmed it as support. Now once the market starts consistently climbing above it, sellers from the range will be squeezed into buying back. This should help create a positive feedback loop that progresses into a full on bull market. There's so much bullish potential in the high time frame charts right now. Title: Re: [Chart] Volume Profile Accumulation Zone $5,910 - $8,630 (VPVR) Post by: dragonvslinux on January 23, 2020, 07:43:15 AM The main topic here is not that price could be "6k to 8.5k" it just means the volume was mainly there which is why there is less volume above, if you reach above levels it will be easier to go up and down. That is why we were able to rush to 20k so easily, after breaking 10k, there are not many sellers, sure there are not many buyers as well but those buyers could come around when they see the price going up and hope that sellers do not show up when that happens. Just even last year we managed to get from 3k to 13k all thanks to less volume at higher levels. If we could manage to break 11.5k one day, it will be once again easier to break towards 15k yet again since it requires less money since there are less sellers. You end up buying all sellers coins (most of them at least) after you reach to 9-10k anyway. Yup, basically that. Suggested accumulation zone: $5,910 - $8,630. This is where the bulk of the volumes lies in the past 27 months. There's so much bullish potential in the high time frame charts right now. This too. To share some analysis for today (https://www.tradingview.com/chart/BTCUSD/lbZMjUvt-BTCUSD-MACD-Fakeout-or-Trend-Change/), which ideally would confirm either way by tomorrow's Daily close: MACD Fakeout or Trend Change? https://talkimg.com/images/2023/09/10/mB6v2.png (https://www.tradingview.com/chart/BTCUSD/lbZMjUvt-BTCUSD-MACD-Fakeout-or-Trend-Change/) Quote from: TradingView As the MACD shows on the Daily chart , we are currently facing a not-yet-confirmed bear-cross today, lasts seen December 17th 2019 at $6,612. Since the breakdown from $10K last September we have seen 4 bear crosses, twice causing the price to drop 20-25% (September 21st & November 9th 2019), the other two two times were not-so-obvious bear traps before price rallied 40% (October 24th at $7,435 and as previously referenced). Needless to say, there is more upside with this becoming a MACD fakeout, than a trend change to bearish on the Daily chart . It's also worth noting that while the Daily is bear-crossing, the Weekly MACD (https://bitcointalk.org/index.php?topic=178336.msg53674851#msg53674851) is still close to bull-crossing, implying a lack of confluence. Weekly MACD close to a bull-cross (first time since February 2019, that would confirm a long-term trend change): https://www.tradingview.com/x/BwRfVGDT/ Monthly MACD bear-crossed (but is now trying to bull-cross again the following month creating potential as well for a "macd fakeout") https://www.tradingview.com/x/GaS4nndR/ Weekly bulls vs Daily bears and exhausted Monthly bears. Still waiting for volatility given the indecision on different time-frames... Also, don't trust the macd, clearly it can give out "fake" signals ;) Again, I'm focusing more on education than TA at the moment (while remaining neutral & awaiting confirmation) so appreciate others filling in the gaps :-* Title: Re: [Chart] Volume Profile Accumulation Zone $5,910 - $8,630 (VPVR) Post by: dragonvslinux on January 23, 2020, 08:16:23 AM In classic BTC fashion, we've bounce $100 from the $8500 area in the past hour or so, now defending the 0.5 fib retracement level for a third time:
https://www.tradingview.com/x/RkU196hh/ Title: Re: [Chart] Volume Profile Accumulation Zone $5,910 - $8,630 (VPVR) Post by: hugeblack on January 23, 2020, 03:36:59 PM Agree. :D but the rise above the levels of $ 10,000 has more psychological dimensions than being true as (price related to speculation) because it is possible to collect faster profits as there is no historical resistance at those levels so the speculator impressions are very random, just as happened when We increased to $ 10,000 levels during 2017.
In other words, it is uncertainty and speculation that makes it easy to break borders after $ 10,000. Title: Re: [Chart] Volume Profile Accumulation Zone $5,910 - $8,630 (VPVR) Post by: dragonvslinux on January 26, 2020, 12:49:23 PM A zoomed in view of the VPVR Year-To-Date (past 12 Months, mini bull and mini bear combined).
Shows the shorter-term volume control is around $7950, that also lines up as strong horizontal support. https://www.tradingview.com/x/vbneGfJX/ Interestingly enough, Bitstamps VPVR is considerably different from BLX, showing a point of control around $8300, as opposed to $6250 level. This is using the same 27 Month volume data from mid $3K in September 2017. https://www.tradingview.com/x/PfINz57M/ Given Bitstamp is one of the much older exchanges, to me this implies that ₿ OG's are buying at higher level than exchange averages. Not that the volume difference is far from minor, compared to the BLX volume profile, even if within the same wide range: https://www.tradingview.com/x/1KR2M7bs/ Title: Re: [Chart] Volume Profile Accumulation Zone $5,910 - $8,630 (VPVR) Post by: CucakRowo on January 26, 2020, 06:24:40 PM Based on the weekly chart that you make. It looks like there will be a price support test once again. Plus, this week's total marketcap is down compared to last week's. The decrease is not too big, only down around $ 3M. (Total marketcap last week was around $ 238M).
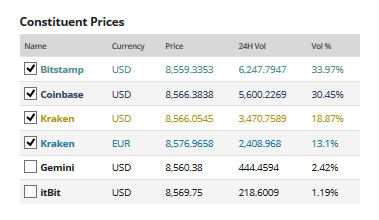
Title: Re: [Chart] Volume Profile Accumulation Zone $5,910 - $8,630 (VPVR) Post by: exstasie on January 26, 2020, 08:57:19 PM Interestingly enough, Bitstamps VPVR is considerably different from BLX, showing a point of control around $8300, as opposed to $6250 level. This is using the same 27 Month volume data from mid $3K in September 2017. Given Bitstamp is one of the much older exchanges, to me this implies that ₿ OG's are buying at higher level than exchange averages. Not that the volume difference is far from minor, compared to the BLX volume profile, even if within the same wide range: Very interesting observation! I've never thought to use a volume profile on BLX. Since BLX is volume-weighted and Bitstamp is always one of its constituent exchanges, I would think it gives the most accurate picture of key price levels. This is the current breakdown of constituents: https://i.imgur.com/zQOxZ76.png It might be interesting to see a more granular VPVR. Title: Re: [Chart] Volume Profile Accumulation Zone $5,910 - $8,630 (VPVR) Post by: dragonvslinux on January 27, 2020, 01:20:30 PM Interestingly enough, Bitstamps VPVR is considerably different from BLX, showing a point of control around $8300, as opposed to $6250 level. This is using the same 27 Month volume data from mid $3K in September 2017. Given Bitstamp is one of the much older exchanges, to me this implies that ₿ OG's are buying at higher level than exchange averages. Not that the volume difference is far from minor, compared to the BLX volume profile, even if within the same wide range: Very interesting observation! I've never thought to use a volume profile on BLX. Since BLX is volume-weighted and Bitstamp is always one of its constituent exchanges, I would think it gives the most accurate picture of key price levels. This is the current breakdown of constituents: https://talkimg.com/images/2023/09/10/mBXZW.png It might be interesting to see a more granular VPVR. Thanks for the reference, I have a feeling the VPVR is different as doesn't include all trading data throughout the day, only the Daily closes. Given that Coinbase is in confluence with Bistamp VPVR, and this is the majority of the volume, it seems that the BLX VPVR maybe much less relevant/accurate. Hence publishing this "again" using Bistamp data to provide a more accurate picture: https://talkimg.com/images/2023/09/10/mBdkJ.png (https://www.tradingview.com/chart/BTCUSD/aV6MM1zp-BTCUSD-VPVR-Part-2-Volume-Point-of-Control-Now-Turned-Support/) Title: Re: [Chart] VPVR Part 1: Volume Profile Accumulation Zone $5,910 - $8,630 Post by: dragonvslinux on February 09, 2020, 08:39:34 AM Next level of VPVR resistance on BLX (as well as Coinbase chart) is around $10,300, based on a 7 month ish view:
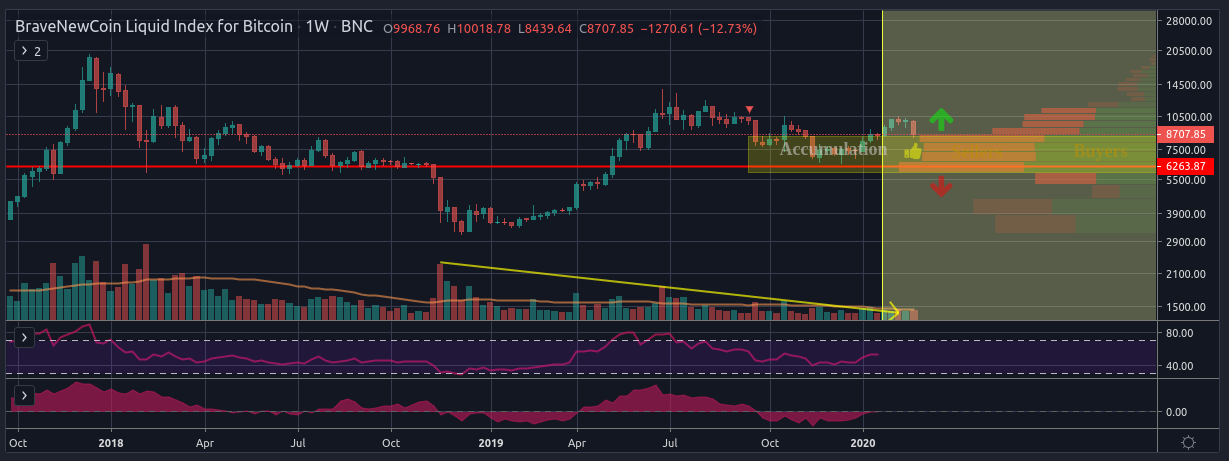
https://www.tradingview.com/x/YzZGxe5s/ By comparison on Bitstamp (OG exchange), the point of control is notably lower at $8,133: https://www.tradingview.com/x/UyOaQrzH/ Make of it what you will. Title: Re: [Chart] VPVR Part 1: Volume Profile Accumulation Zone $5,910 - $8,630 Post by: dragonvslinux on February 29, 2020, 10:31:35 AM Coming back to this original VPVR analysis on BLX, we are currently testing the accumulation zone upper support level of $8,630.
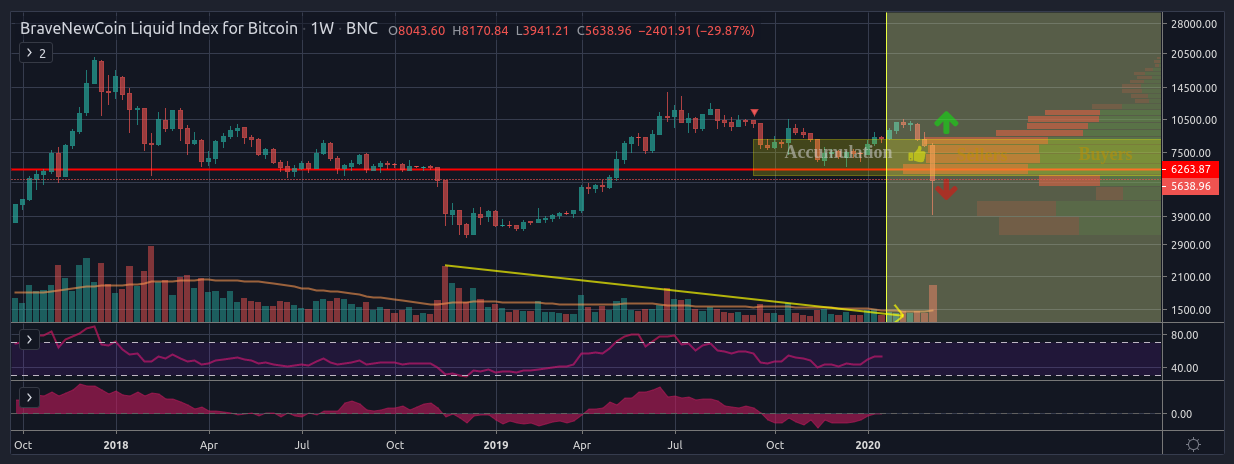
Volume has stopped declining, but far from notably increased, as well as the volatility, so there is still plenty of room for an increase in both in the coming weeks. https://talkimg.com/images/2023/09/10/m7Wqd.png (https://www.tradingview.com/chart/BLX/fYAFsDj8-BTCUSD-Volume-Profile-Accumulation-Zone-5-910-8-630/) By comparison, looking at the same time-frame (from September 25th 2017) on OG exchange Bitstamp, the point of control is at $8,292: https://www.tradingview.com/x/mJYlZ17c/ To put this into perspective, the past 29 months of volume (2 years and 5 months) is concentrated between $7,960 and $8,640. As anticipated earlier this week, this volume support is close to the confluence of 0.5 fib retracements ($8,462 and $8501), as well as the 21 & 50 Week MA ($8,456 and $8,483): If you're wondering why buyers are stepping in at these levels to defend the price, then you're not paying attention to the bigger picture. This doesn't mean we can't fall lower, but that the longe-term support starts here so don't be surprised to see prices bounce back at any moment. HODL Title: Re: [Chart] VPVR Part 1: Volume Profile Accumulation Zone $5,910 - $8,630 Post by: dragonvslinux on March 09, 2020, 11:09:17 AM Despite many people believing Bitcoin wouldn't return to this accumulation zone, we have now re-entered these price levels after briefly leaving this zone of suport.
https://talkimg.com/images/2023/09/10/m76W5.png (https://www.tradingview.com/chart/BLX/fYAFsDj8-BTCUSD-Volume-Profile-Accumulation-Zone-5-910-8-630/) Needless to say, I believe current prices are within the long-term macro accumulation levels, with $5.9K being the floor of this support. For all those who missed the accumulation zone last year, I believe the current sell off has provided us with another great opportunity to acquire Bitcoin at very reasonable prices. Furthermore, it's unsurprisingly that shorter-term bearish speculation has sold the top or this accumulation range (the break below $8,630), in order to buy back at the lower levels of the range. However, similar to last year, I find it unlikely that Bitcoin will reach the bottom of this accumulation zone, or lower lows than $6.4K, given the increasing volume support if (https://bitcointalk.org/index.php?topic=5229364.msg53993829#msg53993829) prices continue to move lower. "Everything is fine". BTFD Furthermore, if the Fear & Greed Index (https://alternative.me/crypto/fear-and-greed-index) is anything to go by (it usually is), this confirms that accumulating at current prices is not only within the long-term accumulation zone, but additionally at current oversold conditions, it would be doing so when the market is experiencing extreme fear, hence my relative greed right now. "Be greedy and others are fearful", from the infamous Bitcoin critic Warren Buffet (https://finance.yahoo.com/news/greedy-others-fearful-175705877.html). https://alternative.me/crypto/fear-and-greed-index.png Title: Re: [Chart] VPVR Part 1: Volume Profile Accumulation Zone $5,910 - $8,630 Post by: dragonvslinux on March 14, 2020, 01:03:35 PM As a quick update, contrary to my belief of this highlighted area acting as an accumulation zone, given the breakout in volume that was overdue, in hindsight it should now be considered as a distribution zone (long-term selling) as opposed to accumulation (long-term buying), at least until proving otherwise. Given the strong selling volume from this area, it's safe to assume that $5,910 starts as the resistance level of re-entering distribution/accumulation levels, with the $6,266 point of control acting as strong resistance.
https://talkimg.com/images/2023/09/10/m5pO8.png (https://www.tradingview.com/chart/BLX/fYAFsDj8-BTCUSD-Volume-Profile-Accumulation-Zone-5-910-8-630/) A bullish perspective remains however, while we cut through this level like a hot knife through butter, it is completely possible to break through again above $8,630 with an equal amount of volume and volatility, although with the current market sentiment I find this very unlikely in the near future. The more realistic neutral perspective would be that this zone could act as a magnet for the price to return to, given the overwhelming amount of volume that was built there, as well as re-test and confirm either the accumulation or distribution theory. Title: Re: [Chart] VPVR Part 1: Volume Profile Accumulation Zone $5,910 - $8,630 Post by: dragonvslinux on March 18, 2020, 01:01:26 PM Looking at the 3 Day chart (for a change) over on Bitstamp, there are definitely some bearish concerns given current price movements. Candle bodies are being rejected by the old 6-month bear flag structure - ironically we need to get back into the old bear channel to provide a bullish opportunity, which is not something inherently bullish in itself.
https://www.tradingview.com/x/vESifPY2/ The 0.236 fib retracement - "the last line of defense for the bulls" at $5,645 (from the $3.2 to $13.8K swing move) is additionally acting as resistance, which is another bad sign. We had a TD 9 confirm on the 13th (that usually call tops & bottoms on the 3 Day), but failing to move about $6K by the end of day would print a Red 1, to start another 1-9 TI count (or continue into a TD countdown phase, depending on your perspective). We have built up a decent amount of volume around $4.95K and $5.37K, but otherwise with price based in the middle of this, it's not indicating anything bullish. A move above $6K is needed for the bullish argument. Title: Re: [Chart] VPVR Part 1: Volume Profile Accumulation Zone $5,910 - $8,630 Post by: dragonvslinux on May 01, 2020, 09:27:44 AM OP screenshot updated. Yesterdays selling pressure closed $6 below the resistance level of the accumulation/distribution level of $8,630. While the week isn't over, this is the expected selling pressure from leaving the long-term accumulation zone to the upside. We've now broken above and below this zone in recent months, but failed to remain outside of it for enough time in either direction. This is why I previously described it as a "magnet zone" - as price is drawn back to this high-volume buying & selling zone.
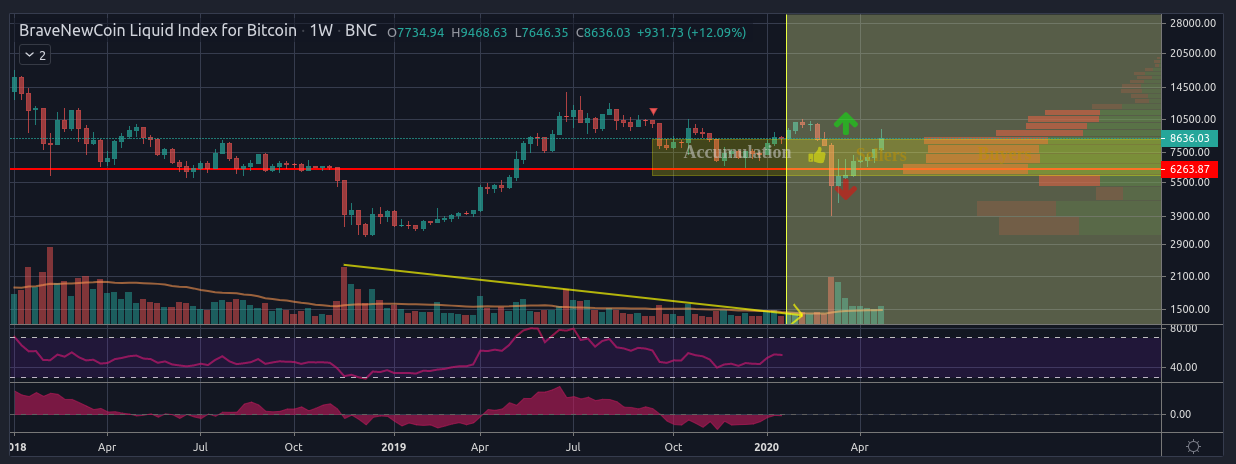
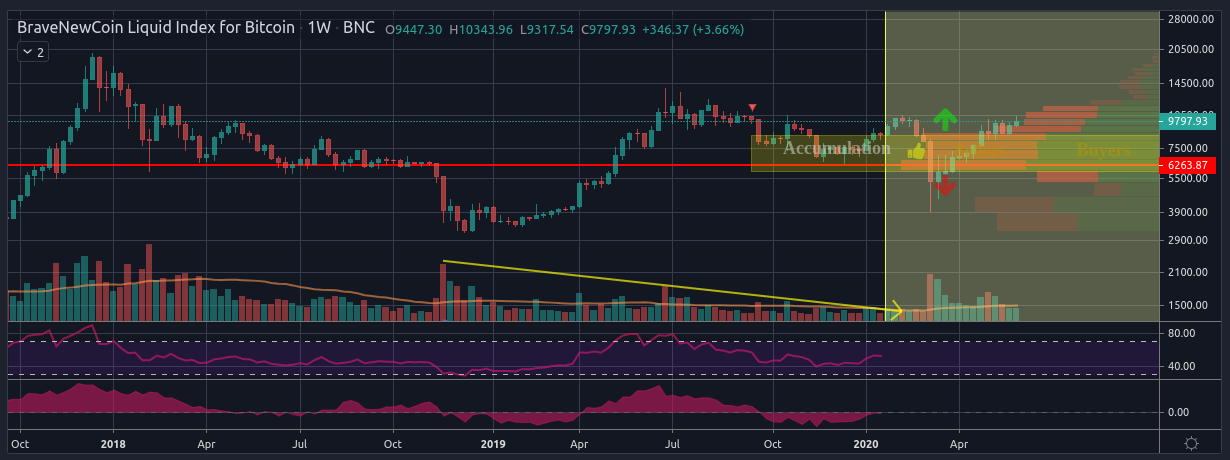
https://talkimg.com/images/2023/09/10/m5jxI.png (https://www.tradingview.com/chart/BLX/fYAFsDj8-BTCUSD-Volume-Profile-Accumulation-Zone-5-910-8-630/) A re-test of the zone's support level around $5.9K wouldn't be out of question and would line up with the 200 Week MA, especially if current prices are the short-term top before a correction to the downside. This would mean we have closed above the zone, closed below it, then wicked above and wicked below - which seems entirely reasonable from a horizontal support & resistance level prespective. A more conservative pull-back would otherwise be to the mid-level of this zone around $7-7.5K, which would be my first target for any fresh long positions, as well as creating the potential for a macro sized bullish inverse head & shoulders. For now, we will have to wait and see what occurs. Title: Re: [Chart] VPVR Part 1: Volume Profile Accumulation Zone $5,910 - $8,630 Post by: dragonvslinux on June 05, 2020, 10:31:43 AM OP updated. Not much to add from January 2020 accumulation zone analysis, while Bitcoin now attempts to turn the $8,630 accumulation resistance level into support.
https://talkimg.com/images/2023/09/10/m5Vog.png (https://www.tradingview.com/chart/BLX/fYAFsDj8-BTCUSD-Volume-Profile-Accumulation-Zone-5-910-8-630/) An updated view nearly 6 months later remains more or less the same, with the point of volume control remaining at $6,263, a re-test of the accumulation support level is therefore not out of the question: https://www.tradingview.com/x/tkhBEgpi/ The only relevant change is the the accumulation zone has become more spread with a "stairs" pattern upto $10,750, given the past 6 months of price action testing $8,630 - $10,550 price levels. |