|
Title: Wavetrend Bitcoin Trading Terminal Post by: pywizard on January 11, 2021, 09:33:32 PM WAVETREND V1.3.1 Binary and Source Code Download Link: https://github.com/pywizard/wavetrend (https://github.com/pywizard/wavetrend) Introduction Wavetrend version 1.3 is a trading terminal for Bitcoin, Altcoins and Instruments such as CFDs, Currencies and Metals. It fetches and displays real-time market data in a convenient way. This market data is displayed so that the user can analyse the markets to make buy and sell decisions on the specific financial exchange. The Wavetrend software currently supports three Bitcoin/Altcoin exchanges, these are:
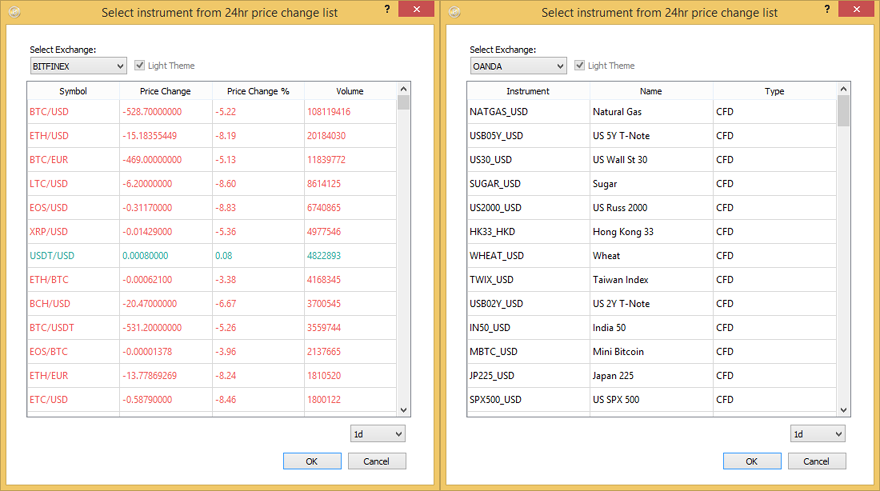
It allows to view nearly all available instruments (such as BTC/USD, LTC/USD, ETH/USD etc.) for the specific exchange in real time. The Wavetrend software supports the Oanda (https://oanda.com) exchange to display charts and market analysis tools for markets other than Bitcoins and Altcoins. Exchange and Instrument Selection When the Wavetrend software is launched it shows the instrument selection dialog. At the top left of the window the user can select the desired exchange that should be used to display the market data for a specific instrument. This selection is named "Select Exchange". Once the user selects the exchange the instruments are loaded below. https://raw.githubusercontent.com/pywizard/wavetrend/master/manual/Wavetrend%20V1.3%20Software%20Manual/Pictures/Exchange%20and%20Instrument%20Selection.PNG The loaded instruments are displayed different for each exchange: Bitfinex Exchange
Binance Exchange
Oanda Exchange
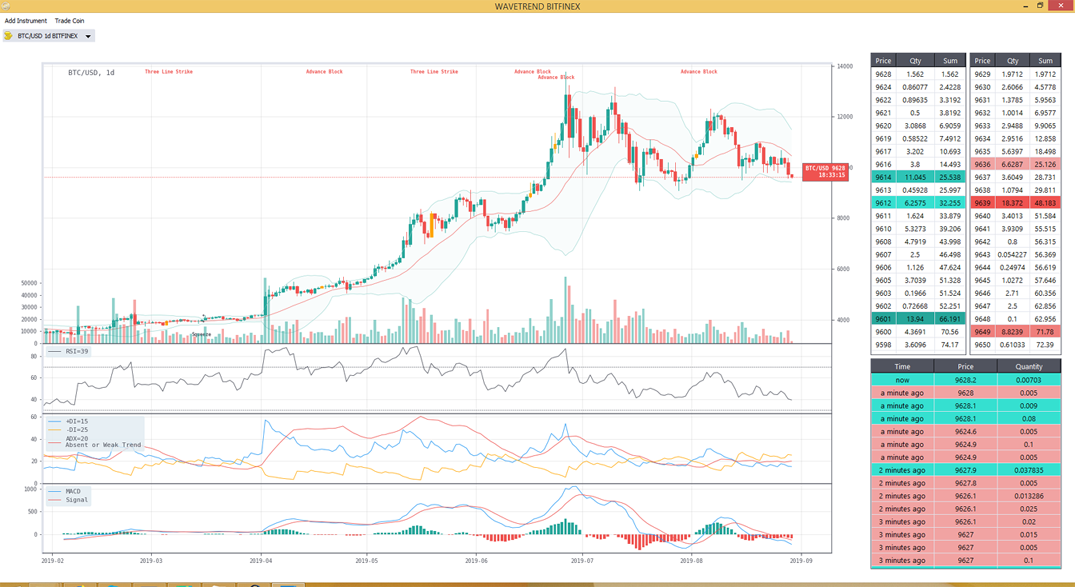
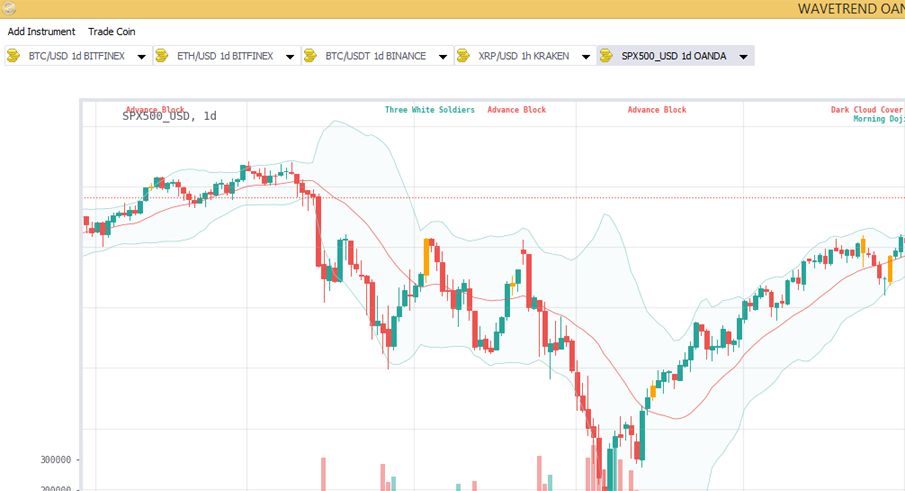
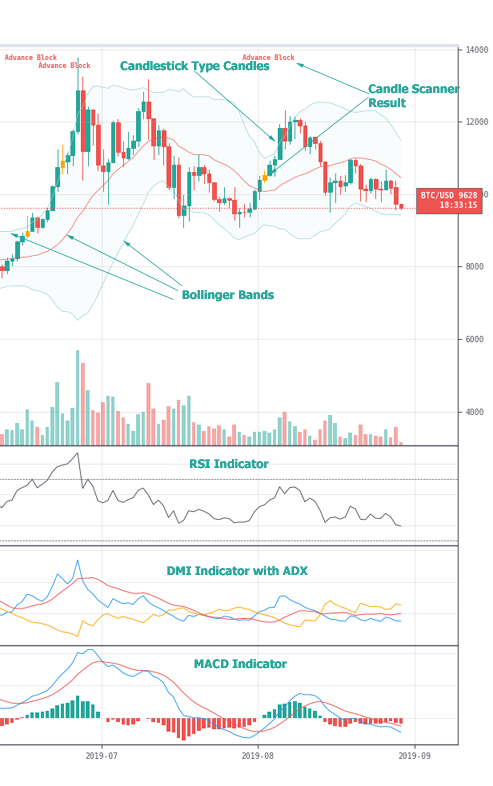
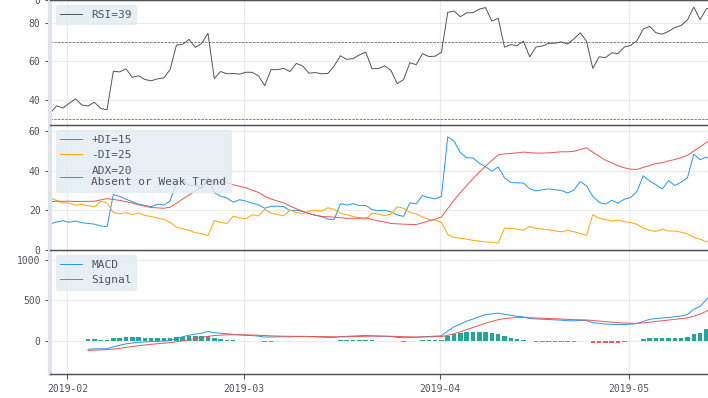
Timeframe selection Below the instrument selection there is another field that must be selected and is very important for the market analysis. It selects the timeframe the chart and other market analysis tools will be displayed in. Each exchange has its own set of timeframe selection. For the Bitfinex exchange for example the user will be able to select these timeframes: 1d (One Day Chart), 12h (Twelve Hour Chart), 6h (Six Hour Chart) ... and so on, then the minute charts: 30m (Thirty Minute Chart), 15m (Fifteen Minute Chart), 5m (Five Minute Chart) etc. Finally the 1w (One Week Chart). Theme selection Wavetrend Version 1.3 has two themes / styles the user can select during startup, these are the Dark and Light Themes. The Dark Theme shows a nearly black application background and the colors are adjusted to the black background, the Light Theme shows a white application background and the colors are adjusted to the white background. Once the theme is selected the application runs using this theme until the user exits the application. Main View Once the instrument has been selected the main view opens. For each instrument added the application adds a new tab at the top of the main view. When you have several instruments added in the tabbed view the tabs can be switched into with the mouse or using the F1-F12 hot-keys. The initial view shows the instruments Chart and instrument Volume of the Chart at the top region. On top of the Chart there is a price display on the right side showing the price and time of the instrument. Below from the Chart the indicators are shown. On the right side of the window there is displayed the Orderbook and Trades control. https://raw.githubusercontent.com/pywizard/wavetrend/master/manual/Wavetrend%20V1.3%20Software%20Manual/Pictures/Main%20View.PNG Main View Of The Application https://raw.githubusercontent.com/pywizard/wavetrend/master/manual/Wavetrend%20V1.3%20Software%20Manual/Pictures/Tabbed%20View.PNG The Tabbed View With Many Instruments Chart and Indicators For the initial loaded instrument view the chart is displayed the following way:
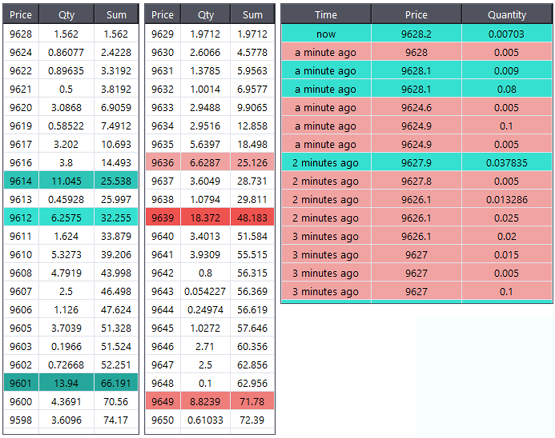
https://raw.githubusercontent.com/pywizard/wavetrend/master/manual/Wavetrend%20V1.3%20Software%20Manual/Pictures/Main%20View%20Detailed.PNG Right Side Of Main View With Details https://raw.githubusercontent.com/pywizard/wavetrend/master/manual/Wavetrend%20V1.3%20Software%20Manual/Pictures/Main%20View%20Detailed%202.PNG Left Side Bottom Of Main View With The Indicators And Current Indicator Values Orderbook and Trades View For Bitcoin / Altcoin markets there is displayed an Orderbook and a Trades View. The Orderbook consists of a listing of current bids and asks, each listing has three columns. The bids are ordered descending and the asks are ordered ascending. Each bid and ask has three columns inside the Orderbook table. The Price, Quantity and Sum. The Price column displays the current price for the bid and ask at the given price level. The Quantity displays the amount the instrument is to be bought or sold at the given price. The Sum displays the accumulated bid and ask amount. For both bid and asks the three biggest quantities currently traded are displayed. The biggest bids are shown in green color and the biggest asks are shown in red color. The deeper the color the higher is the quantity shown in the second column. The Trades View displays the historic trades done. It has three columns, these are Time, Price and Quantity. The Time column shows how many seconds, minutes and hours the trade was executed at. The Price column shows at what price the trade was executed at. The quantity shows the amount of the symbol that has been bought or sold in the past. The rows of the Trades View are colored green and red, the colors indicate more specifically in case of green that the "Maker" of the trade was on the buy side and in the case of red indicate that the "Maker" of the trade was on the sell side. https://raw.githubusercontent.com/pywizard/wavetrend/master/manual/Wavetrend%20V1.3%20Software%20Manual/Pictures/Orderbook%20and%20Trades%20View.PNG Orderbook and Trades View Chart Options Once the chart is loaded there are several options available in the charts tab. When the user clicks on the triangle at the charts tab a menu opens with the following options that change the chart:
|