|
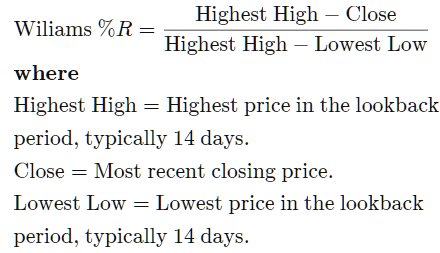
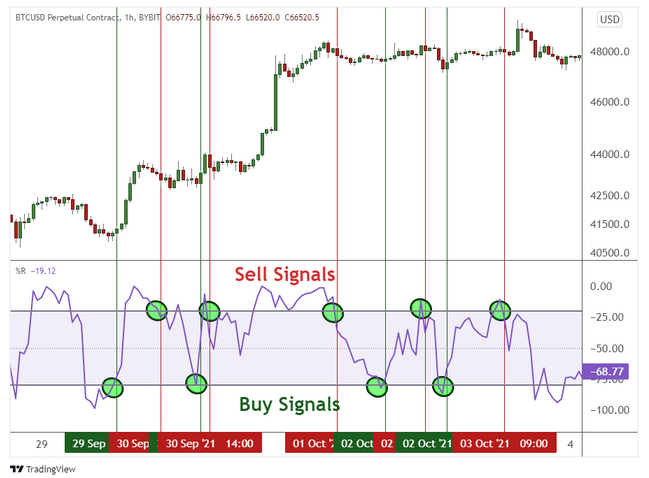
Title: [GUIDE] Williams %R Indicator Post by: Husires on June 13, 2022, 03:18:56 PM Disclaimer: This article is intended for and only to be used for reference purposes only, Google it again, check sources and DYOR. Table of contents 1. What Is the Williams %R Indicator? (#post_point1) 2. %R formula (#post_point2) 3. how to use Williams %R Indicator (#post_point3) 4. current Williams %R value (#post_point4) https://investoo.com/wp-content/uploads/2013/09/41William1290913.png Source: https://www.fidelity.com/learning-center/trading-investing/technical-analysis/technical-indicator-guide/williams-r What Is the Williams %R Indicator? Let's go back in time to 1973 when the US officially removed itself from the gold standard where inflation was high and rising and took steps to rein in inflation and because of those policies many commodities saw strong trends, just as they are now and therefore in the current uncertainty using momentum indicators will help you determine the direction of the market To determine entry and exit points. Williams %R aka Williams Percent Range, is a type of momentum indicator that moves between (0 to -100) and measures overbought and oversold levels. %R formula In short, it is a process of determining how close the current price is to a recent high or low, %R is a limited oscillator so as to make the oscillation range between zero or less than -100. A reading above -20 is considered the peak area, which means that a correction may be close, and therefore it is an exit or selling point for the assets. The exact opposite happens to the reading below -80, the oversold area, and therefore it is an entry or buying point for assets. Sometimes the limitation of the oscillator causes the price to stay in the peak area for a long time. how to use Williams %R Indicator To get the best areas to enter when an asset is oversold and below -80, the trader can buy as soon as the market crosses upwards above -80. Then the trader can wait for the market to cross up below 20. current Williams %R value Williams %R -20.542 Buy Source https://www.investing.com/indices/bitcoin-real-time-technical Source and more https://school.stockcharts.com/doku.php?id=technical_indicators:williams_r Title: Re: [GUIDE] Williams %R Indicator Post by: tbct_mt2 on June 14, 2022, 03:16:16 AM Indicators are good and bad depend on how people use it. Indicators can not save your capital if you apply it incorrectly.
Let's look at history of news stories on Bitcoin is dead: https://www.bitcoinisdead.org/ More than 450 times it was called as dead but it is fine and it will still be fine in future. However, now the market is in chaos and lot of fud, risk of liquidation on institutional, project accounts to personal, retail accounts. So my advice is just it is time to protect your capital, with spot position only. Let's say no with leverage in this period. Then months later you will be fine. Title: Re: [GUIDE] Williams %R Indicator Post by: okorieemmanuel on June 14, 2022, 08:47:15 AM Disclaimer: This article is intended for and only to be used for reference purposes only, Google it again, check sources and DYOR. Table of contents 1. What Is the Williams %R Indicator? (#post_point1) 2. %R formula (#post_point2) 3. how to use Williams %R Indicator (#post_point3) 4. current Williams %R value (#post_point4) https://investoo.com/wp-content/uploads/2013/09/41William1290913.png Source: https://www.fidelity.com/learning-center/trading-investing/technical-analysis/technical-indicator-guide/williams-r What Is the Williams %R Indicator? Let's go back in time to 1973 when the US officially removed itself from the gold standard where inflation was high and rising and took steps to rein in inflation and because of those policies many commodities saw strong trends, just as they are now and therefore in the current uncertainty using momentum indicators will help you determine the direction of the market To determine entry and exit points. Williams %R aka Williams Percent Range, is a type of momentum indicator that moves between (0 to -100) and measures overbought and oversold levels. %R formula In short, it is a process of determining how close the current price is to a recent high or low, %R is a limited oscillator so as to make the oscillation range between zero or less than -100. A reading above -20 is considered the peak area, which means that a correction may be close, and therefore it is an exit or selling point for the assets. The exact opposite happens to the reading below -80, the oversold area, and therefore it is an entry or buying point for assets. Sometimes the limitation of the oscillator causes the price to stay in the peak area for a long time. how to use Williams %R Indicator To get the best areas to enter when an asset is oversold and below -80, the trader can buy as soon as the market crosses upwards above -80. Then the trader can wait for the market to cross up below 20. current Williams %R value Williams %R -20.542 Buy Source https://www.investing.com/indices/bitcoin-real-time-technical Source and more https://school.stockcharts.com/doku.php?id=technical_indicators:williams_r This williams indicator looks too good. But you never mentioned the timeframe for this chart. Please tell me so that I can test it myself with the current value of -20.542 Title: Re: [GUIDE] Williams %R Indicator Post by: palle11 on June 14, 2022, 10:46:42 AM Just an observation to the indicator. I hope it has timeframe to work with especially lower timeframe to suit the day traders and scalpers too because if there are no timeframe, it will be difficult to trade rightly. Having that said I think it is nice seeing the chart reading and analysis from the indicator.
Title: Re: [GUIDE] Williams %R Indicator Post by: Husires on June 14, 2022, 05:51:30 PM More than 450 times it was called as dead but it is fine and it will still be fine in future. You are confusing two different concepts. When we look for news, we are looking for its psychological impact on new investors (weak hands), which is a completely different concept from technical analysis, which is intended to follow patterns to determine entry and exit points using several indicators such as support and resistance levels, Fibonacci analysis, and others.FUD: Fear, uncertainty, and doubt (often shortened to FUD) is a propaganda tactic used in sales, marketing, public relations, politics, polling and cults. Source: https://en.wikipedia.org/wiki/Fear,_uncertainty,_and_doubt Technical analysis is a trading discipline employed to evaluate investments and identify trading opportunities in price trends and patterns seen on charts. Source: https://www.investopedia.com/terms/t/technicalanalysis.asp This williams indicator looks too good. But you never mentioned the timeframe for this chart. Please tell me so that I can test it myself with the current value of -20.542 it is not about chart but number of oscillator is based on it and you can judge the entry or exit points. current Williams value Williams %R -4.617 Overbought Just an observation to the indicator. I hope it has timeframe to work with especially lower timeframe to suit the day traders and scalpers too because if there are no timeframe, it will be difficult to trade rightly. Having that said I think it is nice seeing the chart reading and analysis from the indicator. The indicator is used with a group of indicators to come up with an integrated vision. For example, at the moment the indicators are: Quote RSI(14) 45.631 Neutral STOCH(9,6) 95.694 Overbought STOCHRSI(14) 100.000 Overbought MACD(12,26) -559.320 Sell ADX(14) 29.104 Buy Williams %R -4.617 Overbought CCI(14) 76.1190 Buy ATR(14) 573.9212 Less Volatility Highs/Lows(14) 0.0000 Neutral Ultimate Oscillator 57.934 Buy ROC 2.546 Buy Bull/Bear Power(13) 160.2752 Buy Source: https://www.investing.com/indices/bitcoin-real-time-technical Title: Re: [GUIDE] Williams %R Indicator Post by: webtricks on June 16, 2022, 08:19:48 AM Good thread. Williams %R is one of the handy tools in TA. However, it is not an absolute measure. We always take Williams %R as relative measure in cumulation with the price movements. So, the following observation from you may not be entirely correct:
.. A reading above -20 is considered the peak area, which means that a correction may be close, and therefore it is an exit or selling point for the assets. The exact opposite happens to the reading below -80, the oversold area, and therefore it is an entry or buying point for assets. .. Reading above -20 as an absolute measure shows an overbought position but such overbought position isn't a signal of upcoming correction/fall unless we see sharp downtrend in the prices along with the simultaneous decline in William %R below -20. |