|
Title: 4hr chart! Post by: Mark301 on July 05, 2022, 06:09:46 AM The 4hr chart shows bitcoin hovering around the upper level of the bollinger band. This has resulted in rapid dumping of corn throughout 2022, so now is not the time to fomo.
Title: Re: 4hr chart! Post by: Wind_FURY on July 05, 2022, 07:48:52 AM The 4hr chart shows bitcoin hovering around the upper level of the bollinger band. This has resulted in rapid dumping of corn throughout 2022, so now is not the time to fomo. It might not be for "traders" like you, but for HODLers, their mouths are salivating, and waiting for more, and lower DIPs! Trader vs. HODLer, zoom out the chart to the maximum, who made more in fiat, and who HODLs more Bitcoin. There's higher probability it's the HODLer in my opinion. 8) Title: Re: 4hr chart! Post by: dansus021 on July 05, 2022, 08:07:35 AM I don't use the Bollinger band but here guys I give you the 4hr chart as you can see that the price can't break the resistance level 20.3 or Fibbo 1.272 sorry to say this but if we can't break that level the bear market was most likely still be here
https://s3.tradingview.com/snapshots/e/eLEry0fm.png Title: Re: 4hr chart! Post by: SuperMariob on July 05, 2022, 02:39:42 PM The 4hr chart shows bitcoin hovering around the upper level of the bollinger band. This has resulted in rapid dumping of corn throughout 2022, so now is not the time to fomo. I think we just simply entered an accumulation phase. Title: Re: 4hr chart! Post by: bittraffic on July 05, 2022, 03:04:19 PM Gives us the hope when price spiked today. I did look my chart over and over today thinking something is change my speculation of the trend. Zooming in to 1hr and 4hr chart will still be good accumulate by trading. I'm also not a Bolinger user but the indicators I use have served me well in the past. It will take weeks to months before we see a real bounce to change the market trend. September perhaps won't be the usual Sept. Title: Re: 4hr chart! Post by: palle11 on July 05, 2022, 03:12:11 PM The 4hrs chart that I'm seeing is still pretty dropping some coins unfortunately. I don't think there is going to be a break for bull anytime soon from that spike happening in 4hrs because it continued the bearish movement getting price dropping below its opening today. The bull hodlers expectations is cut short so far with this continued bear.
Title: Re: 4hr chart! Post by: SuperMariob on July 05, 2022, 03:47:03 PM Gives us the hope when price spiked today. I did look my chart over and over today thinking something is change my speculation of the trend. Zooming in to 1hr and 4hr chart will still be good accumulate by trading. I'm also not a Bolinger user but the indicators I use have served me well in the past. It will take weeks to months before we see a real bounce to change the market trend. September perhaps won't be the usual Sept. Better not to look at the charts too often these days ;D Title: Re: 4hr chart! Post by: hugeblack on July 05, 2022, 05:27:57 PM I don't know, but I was expecting some charts, unfortunately predicting the price in a very short range is almost impossible, so charts like the bollinger band will not be useful, especially with the changing volumes of liquidity.We started forming strong support and resistance levels between the 18.2 to 22.3 barrier, which we have been floating around for a while.
Title: Re: 4hr chart! Post by: Bitcoin_Arena on July 05, 2022, 08:04:39 PM The 4hr chart shows bitcoin hovering around the upper level of the bollinger band. This has resulted in rapid dumping of corn throughout 2022, so now is not the time to fomo. If only you made this post with chart, It would be nice and easier to interpret from your point of view, but yeah bear market is still on. We won't get out of it overnight.Better not to look at the charts too often these days ;D Does this also apply to day or intraday traders? ;DTitle: Re: 4hr chart! Post by: samcrypto on July 05, 2022, 09:15:40 PM I don't use the Bollinger band but here guys I give you the 4hr chart as you can see that the price can't break the resistance level 20.3 or Fibbo 1.272 sorry to say this but if we can't break that level the bear market was most likely still be here This is a confirmation that we are still on a bear market and we might see another drama in the coming days. This is not a time for FOMO, but its time to analyze again and know when to buy. I dont suggest to buy because of FOMO because you might not be able to buy at the right price. The volume is not enough to push Bitcoin and break that resistance, we will stay on that level for now. https://s3.tradingview.com/snapshots/e/eLEry0fm.png Title: Re: 4hr chart! Post by: gunhell16 on July 06, 2022, 06:22:21 AM The 4hr chart shows bitcoin hovering around the upper level of the bollinger band. This has resulted in rapid dumping of corn throughout 2022, so now is not the time to fomo. When I used the 4hour in the chart, I could easily predict what could be the price in the future, though its not accurate but most of the time almost close unto it. I also practice my analysis as well when I do the actual trade in exchange platform. And this time was bear period where we hace a lot of opportunity to buy a coins in the exchange at their lowest value. Title: Re: 4hr chart! Post by: Baofeng on July 06, 2022, 08:12:41 AM The 4hr chart shows bitcoin hovering around the upper level of the bollinger band. This has resulted in rapid dumping of corn throughout 2022, so now is not the time to fomo. I think it's pretty obvious that we will see a continues dump this year, might not be rapid at it will take months, up to the end of the year at least. As for FOMO? I think it should be opposite, smart investors should be accumulating at this point. No need to FOMO, it is only in bull market. Now is the time to buy cheap bitcoin and then just HODL, there is no simpler formula than that in a bear market. Title: Re: 4hr chart! Post by: Adbitco on July 06, 2022, 10:29:59 AM Market recovery maybe around December to January looking from the candle above there is a strong resistance between the Buyers and Holders. Which will actually cause panic among holders to sell off but with all indications viewing from 1 week chart we might expect $16k to $14k dump in price.
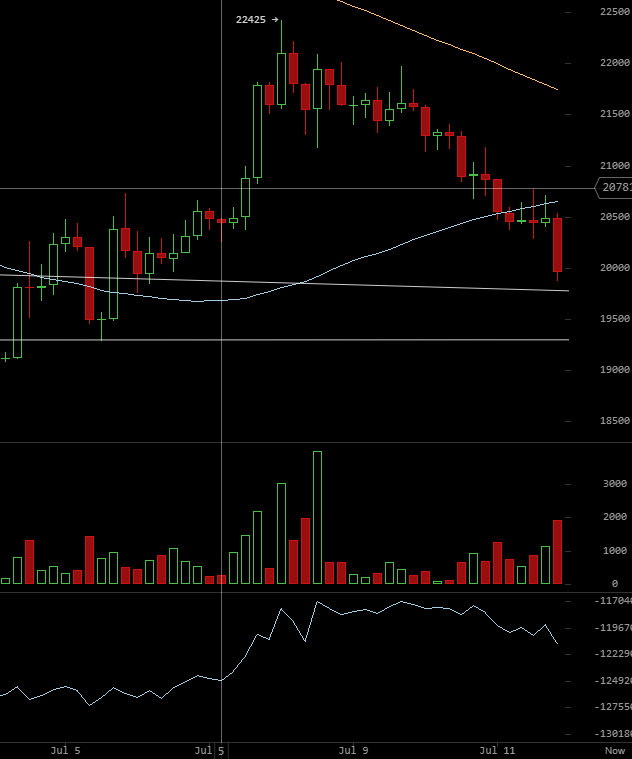
https://i.imgur.com/iBXgege.png That is my personal view and analysis though we can't fully predict what outcome maybe. Title: Re: 4hr chart! Post by: GreatArkansas on July 09, 2022, 11:51:18 AM Market recovery maybe around December to January looking from the candle above there is a strong resistance between the Buyers and Holders. Which will actually cause panic among holders to sell off but with all indications viewing from 1 week chart we might expect $16k to $14k dump in price. Yeah, I agree with this. With the very long run upward last year to the market, I don't think the correction or dumps recently will only last in just a short period of time. As others said, "Crypto Winter" so for me, it will take more months or even years.https://i.imgur.com/iBXgege.png That is my personal view and analysis though we can't fully predict what outcome maybe. Let's just be ready for anything. Not every day is Christmas day. Title: Re: 4hr chart! Post by: Gozie51 on July 10, 2022, 04:41:44 PM As others said, "Crypto Winter" so for me, it will take more months or even years. Let's just be ready for anything. Not every day is Christmas day. I think also that we are just going to wait a little more. For now everything still looks like the continuous trend since some montgs ago is still continuing and until we have a serious news that will change all that fears of down move, for this time it has been a fud around the market and that is kind of scaring out investment. Title: Re: 4hr chart! Post by: dansus021 on July 11, 2022, 03:12:01 AM I update the 4hr chart here we go, as we can see after breaking the $20.300 price bitcoin price now still testing this as new support for previous resistance even not yet closed but we can see a bounce price in 1-hour timeframe
https://s3.tradingview.com/snapshots/i/IEd7I07j.png Title: Re: 4hr chart! Post by: crwth on July 11, 2022, 02:23:38 PM This is what it looks like with the Bollinger bands (with the default parameter settings)
https://i.imgur.com/njDgisA.png With the current price, it has already touched the bottom Bollinger band. It could indicate that it can reach higher now. It should be paired with another indicator so you would have at least reliable data on whether you will trade it or not. Title: Re: 4hr chart! Post by: tbterryboy on July 11, 2022, 07:04:35 PM Market recovery maybe around December to January looking from the candle above there is a strong resistance between the Buyers and Holders. Which will actually cause panic among holders to sell off but with all indications viewing from 1 week chart we might expect $16k to $14k dump in price. Yeah, I agree with this. With the very long run upward last year to the market, I don't think the correction or dumps recently will only last in just a short period of time. As others said, "Crypto Winter" so for me, it will take more months or even years.https://i.imgur.com/iBXgege.png That is my personal view and analysis though we can't fully predict what outcome maybe. Let's just be ready for anything. Not every day is Christmas day. This is why people now are buying because they think this bear will end soon. People here are now ready for the bull run but there might be some that is still ready for the real bottom, that is why they are preparing a good amount of cash, in case it suddenly occurs. Title: Re: 4hr chart! Post by: dragonvslinux on July 11, 2022, 07:18:53 PM I update the 4hr chart here we go, as we can see after breaking the $20.300 price bitcoin price now still testing this as new support for previous resistance [...] https://s3.tradingview.com/snapshots/i/IEd7I07j.png Similar outlook based on volume, $20.3K level was previous resistance that now bulls are attempting to turn into support, and will need to do so to avoid falling further. This was also the break-out level of the resistance trend-line from symmetrical triangle break-out a few days ago, so a fair amount of confluence at this level. Not forgetting the "physiological" aspect of $20,000. Price is now at the volume point of control on the 4hr chart, where price needs to find buyers to continue higher and avoiding dropping to $19K support: https://s3.tradingview.com/snapshots/u/uURCmGuW.png Title: Re: 4hr chart! Post by: STT on July 12, 2022, 12:57:18 AM 4hr is the best chart for forex or anything especially global, needs a few of these bars to have the price moving in a specially serious way.
https://talkimg.com/images/2023/06/12/AsH2c.png Really hard for gains to occur denominated in Dollars when DXY at highs never seen in the entirety of BTC lifetime. BTC is doing better then it appears is my take. Here is a pullback to prior action but the volume only kicks in at the end as we near 20k; notice OBV (below vol) not dropping at rate at which price does and this is why. If we could hold this point it should be summed up as bullish higher low and helps us going forward. Title: Re: 4hr chart! Post by: Fundamentals Of on July 12, 2022, 02:00:43 AM This is also what a few are warning. It seems I trust these objective warnings more than those who are predicting the price with always a bullish TA. I've recently read the same warning coming from a Bitcoin supporter himself and it seems it is objective enough.
But does this mean that those who want to buy at the bottom or near the cheapest price that Bitcoin could get to could put it off for a while because the price could still go down much lower? Title: Re: 4hr chart! Post by: Silberman on July 13, 2022, 06:19:21 PM This is also what a few are warning. It seems I trust these objective warnings more than those who are predicting the price with always a bullish TA. I've recently read the same warning coming from a Bitcoin supporter himself and it seems it is objective enough. Even if we were to only use our common sense I think we could get to the same conclusion, the bear market is still strong and bitcoin is unable to go above the 22k level, and when it gets to 21k we immediately see actions by the bears to keep it down, and when we think about how long we will have to wait until the next halving then I think it is expected that bitcoin can still drop in price even further during the next months, which will cause a great deal of people to capitulate and sell their coins for massive losses.But does this mean that those who want to buy at the bottom or near the cheapest price that Bitcoin could get to could put it off for a while because the price could still go down much lower? |