|
Title: 2025 Elliott Wave Post by: xxxx123abcxxxx on February 02, 2025, 10:42:44 AM 2025 Elliott Wave
Speculatively forecasting the price of Bitcoin via subjectively using the Elliott Wave principle. Analysis is conjecture with sporadic fortnightly to monthly updates. Previous thread: 2024 Elliott Wave (https://bitcointalk.org/index.php?topic=5485551.0) Title: Re: 2025 Elliott Wave Post by: xxxx123abcxxxx on February 02, 2025, 10:43:58 AM BTC/USD
https://12345abcdewxyz.wordpress.com/wp-content/uploads/2025/02/20250201-bncblx.png (https://12345abcdewxyz.wordpress.com/wp-content/uploads/2025/02/20250201-bncblx.png) https://12345abcdewxyz.wordpress.com/wp-content/uploads/2025/02/20250201-btcusd.png (https://12345abcdewxyz.wordpress.com/wp-content/uploads/2025/02/20250201-btcusd.png) Title: Re: 2025 Elliott Wave Post by: xxxx123abcxxxx on February 02, 2025, 10:44:29 AM ETH/USD
https://12345abcdewxyz.wordpress.com/wp-content/uploads/2025/02/20250201-ethusd.png (https://12345abcdewxyz.wordpress.com/wp-content/uploads/2025/02/20250201-ethusd.png) Title: Re: 2025 Elliott Wave Post by: xxxx123abcxxxx on February 02, 2025, 10:44:59 AM SOL/USD
https://12345abcdewxyz.wordpress.com/wp-content/uploads/2025/02/20250201-solusd.png (https://12345abcdewxyz.wordpress.com/wp-content/uploads/2025/02/20250201-solusd.png) Title: Re: 2025 Elliott Wave Post by: xxxx123abcxxxx on February 02, 2025, 10:45:47 AM MSTR
https://12345abcdewxyz.wordpress.com/wp-content/uploads/2025/02/20250201-mstr.png (https://12345abcdewxyz.wordpress.com/wp-content/uploads/2025/02/20250201-mstr.png) Title: Re: 2025 Elliott Wave Post by: xxxx123abcxxxx on February 02, 2025, 10:46:10 AM GOLD
https://12345abcdewxyz.wordpress.com/wp-content/uploads/2025/02/20250201-gold.png (https://12345abcdewxyz.wordpress.com/wp-content/uploads/2025/02/20250201-gold.png) Title: Re: 2025 Elliott Wave Post by: xxxx123abcxxxx on February 02, 2025, 10:46:38 AM DJIA 30
https://12345abcdewxyz.wordpress.com/wp-content/uploads/2025/02/20250201-m-djia30-1.png (https://12345abcdewxyz.wordpress.com/wp-content/uploads/2025/02/20250201-m-djia30-1.png) Title: Re: 2025 Elliott Wave Post by: franky1 on February 07, 2025, 02:23:09 AM BTC/USD https://12345abcdewxyz.wordpress.com/wp-content/uploads/2025/02/20250201-bncblx.png (https://12345abcdewxyz.wordpress.com/wp-content/uploads/2025/02/20250201-bncblx.png) you show a ATH in late 2025 of $219k(3?) and then another ATH in 2026 of $379k(5?)..hmm seems your estimated timings are off i dont see a extra ATH happening in 2026(5?) as there were no ATH in pattern of 2022, 2018, 2014, the years 2022,2018,2014 were the low seasons. so 2026 would be a low, not a new ATH also i feel the $379k might be the top test of late 2025 ATH Title: Re: 2025 Elliott Wave Post by: Moreno233 on February 07, 2025, 05:38:34 AM BTC/USD you show a ATH in late 2025 of $219k(3?) and then another ATH in 2026 of $379k(5?)..hmm seems your estimated timings are offhttps://12345abcdewxyz.wordpress.com/wp-content/uploads/2025/02/20250201-bncblx.png (https://12345abcdewxyz.wordpress.com/wp-content/uploads/2025/02/20250201-bncblx.png) i dont see a extra ATH happening in 2026(5?) as there were no ATH in pattern of 2022, 2018, 2014, the years 2022,2018,2014 were the low seasons. so 2026 would be a low, not a new ATH also i feel the $379k might be the top test of late 2025 ATH Title: Re: 2025 Elliott Wave Post by: xxxx123abcxxxx on February 07, 2025, 09:57:31 AM you show a ATH in late 2025 of $219k(3?) and then another ATH in 2026 of $379k(5?)..hmm seems your estimated timings are off i dont see a extra ATH happening in 2026(5?) as there were no ATH in pattern of 2022, 2018, 2014, the years 2022,2018,2014 were the low seasons. so 2026 would be a low, not a new ATH also i feel the $379k might be the top test of late 2025 ATH The projections are indicative of wave structure, not timings nor wave sizes. Title: Re: 2025 Elliott Wave Post by: xxxx123abcxxxx on February 07, 2025, 10:13:42 AM I noticed a little error in the labelling because for the Elliot Wave principle to hold, one of the requirements is that wave 3 must not be the shortest wave. In the labelling, both wave 1 and the projected wave 5 of the primary wave are longer than motive wave 3 which invalidates the entire thing. This is the reason I don't believe that projection of an ATH of $379 in 2026. Maybe if the EW is recounted, then we will be able to see a different view and draw a different conclusion. It is increasingly becoming difficult to know what the ATH of this market cycle will be given the reluctance of the market to proceed despite that everything that would have added momentum to the market has already happened. Elliott Wave rule is third wave cannot be the shortest, unless in a Leading Diagonal or Ending Diagonal. Elliott Waves are measured in points not percentages; hence, no rule has been violated in the analysis. In commodity markets, fifth waves are occasionally the longest and extended; and appears to be the same for Bitcoin who knows, could be $1M by 2030...?! https://12345abcdewxyz.wordpress.com/wp-content/uploads/2025/02/20250207-btcusd.png Title: Re: 2025 Elliott Wave Post by: pizzapotential on April 18, 2025, 10:20:38 AM What if that was the cycle top?
Title: Re: 2025 Elliott Wave Post by: xxxx123abcxxxx on April 18, 2025, 01:11:15 PM What if that was the cycle top? Then it would imply a CYCLE-II bear market is underway, with perhaps a -80% to -90% decline. Probably unlikely because the current top was an Irregular B-wave, rather than an orthodox final fifth wave. Title: Re: 2025 Elliott Wave Post by: nabu05 on April 19, 2025, 08:47:52 PM So down we go to $60k-ish?!
Title: Re: 2025 Elliott Wave Post by: xxxx123abcxxxx on April 19, 2025, 09:06:26 PM So down we go to $60k-ish?! Guessing somewhere between $50K to $60K ought to be the bottom. Title: Re: 2025 Elliott Wave Post by: josegines on April 20, 2025, 11:59:40 AM So down we go to $60k-ish?! Guessing somewhere between $50K to $60K ought to be the bottom. Unless you're mistaken about your irregular B wave ending at 60k. Of course, we've been waiting for many months to see if you're right or wrong. I'd say the idea of the irregular flat originated here, when you declared wave 1 complete: https://bitcointalk.org/index.php?topic=5485551.msg64037630#msg64037630 When you finished that wave 1, you thought everything that came after would be wave 2. Title: Re: 2025 Elliott Wave Post by: Tzupy on May 21, 2025, 11:29:41 PM So down we go to $60k-ish?! Guessing somewhere between $50K to $60K ought to be the bottom. Your bearish count was invalidated. Would you post a new one? Title: Re: 2025 Elliott Wave Post by: xxxx123abcxxxx on May 22, 2025, 02:11:54 AM A daily/weekly close above the Fibonacci 2.618% extension (i.e. $114,000) would suggest the BULL scenario is underway...
https://12345abcdewxyz.wordpress.com/wp-content/uploads/2025/05/20250522-btcusd.png Title: Re: 2025 Elliott Wave Post by: josegines on May 24, 2025, 04:23:36 AM A daily/weekly close above the Fibonacci 2.618% extension (i.e. $114,000) would suggest the BULL scenario is underway... You've spent a year insisting on the bearish scenario with the irregular flat. Finally, a year later, you have a bullish alternative count. What I don't understand is why, for a year now, you haven't considered both scenarios, bearish and bullish. ??? https://bitcointalk.org/index.php?topic=5485551.msg64106795#msg64106795 Title: Re: 2025 Elliott Wave Post by: xxxx123abcxxxx on May 24, 2025, 05:57:07 AM You've spent a year insisting on the bearish scenario with the irregular flat. Finally, a year later, you have a bullish alternative count. What I don't understand is why, for a year now, you haven't considered both scenarios, bearish and bullish. ??? https://bitcointalk.org/index.php?topic=5485551.msg64106795#msg64106795 Have said since NOV/DEC 2024 that beyond $114,000 would suggest an elimination of the B-wave bearish scenarios... https://bitcointalk.org/index.php?topic=5485551.msg64799443#msg64799443 Title: Re: 2025 Elliott Wave Post by: bbc.reporter on May 25, 2025, 04:32:08 AM You've spent a year insisting on the bearish scenario with the irregular flat. Finally, a year later, you have a bullish alternative count. What I don't understand is why, for a year now, you haven't considered both scenarios, bearish and bullish. ??? https://bitcointalk.org/index.php?topic=5485551.msg64106795#msg64106795 Have said since NOV/DEC 2024 that beyond $114,000 would suggest an elimination of the B-wave bearish scenarios... https://bitcointalk.org/index.php?topic=5485551.msg64799443#msg64799443 However, this is my question. If bitcoin does not breakout beyond $114k within 2 months, you are predicting that it is a certainty that it will dump to $50k again or will the predictions change depending on the chart again? If predictions chance depending on the chart again, I reckon these are not real predictions that can be used for trading bitcoin. Title: Re: 2025 Elliott Wave Post by: xxxx123abcxxxx on May 25, 2025, 06:44:43 AM However, this is my question. If bitcoin does not breakout beyond $114k within 2 months, you are predicting that it is a certainty that it will dump to $50k again or will the predictions change depending on the chart again? If predictions chance depending on the chart again, I reckon these are not real predictions that can be used for trading bitcoin. Bitcoin could go sideways for the next 2 months, and still both the bull and bear scenarios would remain in play. Title: Re: 2025 Elliott Wave Post by: pizzapotential on May 25, 2025, 05:23:18 PM Being able to use the EW model doesn't prevent you from being wrong, right.
Predicting the individual moves within a cycle is harder than predicting that there will be a cycle. You're always going to have to back-track and recount. Title: Re: 2025 Elliott Wave Post by: bbc.reporter on May 26, 2025, 03:11:03 AM However, this is my question. If bitcoin does not breakout beyond $114k within 2 months, you are predicting that it is a certainty that it will dump to $50k again or will the predictions change depending on the chart again? If predictions chance depending on the chart again, I reckon these are not real predictions that can be used for trading bitcoin. Bitcoin could go sideways for the next 2 months, and still both the bull and bear scenarios would remain in play. My question is on this elliot waves. Will this always depend on what the market is doing presently or are these predictions real predictions where it can say where or what the market will do on the next 6 months? If the expert eliot waves predictors change their predictions depending on what might presently occur on the market, can they declare always that the elliot waves really is a good market indicator? Title: Re: 2025 Elliott Wave Post by: xxxx123abcxxxx on May 26, 2025, 03:41:53 AM My question is on this elliot waves. Will this always depend on what the market is doing presently or are these predictions real predictions where it can say where or what the market will do on the next 6 months? If the expert eliot waves predictors change their predictions depending on what might presently occur on the market, can they declare always that the elliot waves really is a good market indicator? There is no such accurate prediction indicator or model of any event in this world: nor weather, nor sporting events, nor genetic mutations, nor elections results, nor stock prices. If forecasting and prediction was 100% accurate, and if all the outcomes of all events could be known and calculated in advance, then there would be no free-will. Like all prediction models, the Elliott Wave theory provides probabilistic outcomes; whereby, the forecast is monitored and adjusted to incoming data. Successful trading is largely based on account management; i.e. stop-losses and limits, balancing margin and hedging. For now, the Elliott Wave model presented here suggests Bitcoin may decline to $50,000 to $60,000 during 3Q-4Q of 2025, and then, the bull market resumes. If however, Bitcoin advances in an impulsive five-wave structure beyond $114,000 with a weekly close, then it may suggest the bull market is already resuming. Title: Re: 2025 Elliott Wave Post by: bbc.reporter on May 27, 2025, 02:48:46 AM @xxxx123abcxxxx. Does that imply that elliot wave experts are no better traders than trendlines experts? I reckon traders who will choose one of these methods will both of them not have an accurate prediction. We can also be quite certain that other traders who are using different methods would also not have an accurate prediction.
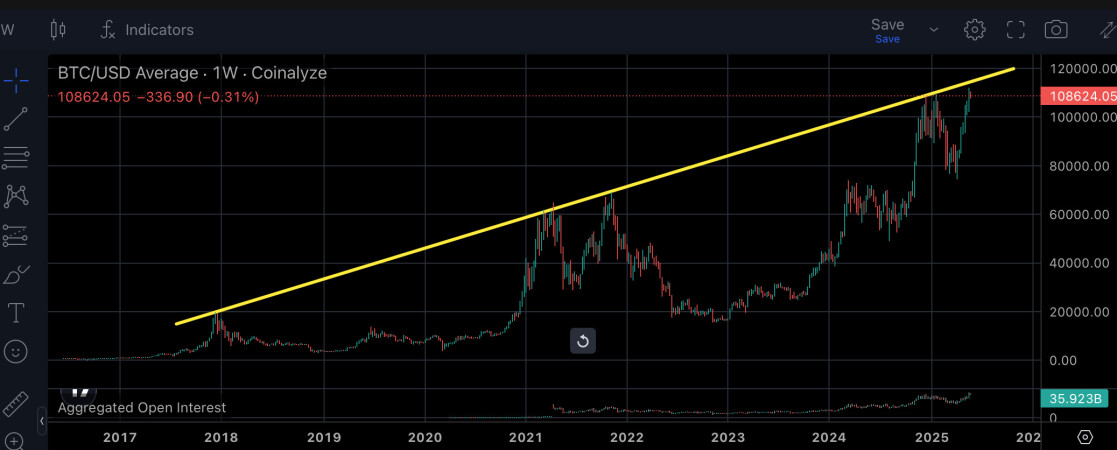
Also, we have a similar assessment that the market will dump lower, however, to dump on $50k is very headshaking. This is very low. We can be quite certain that many investors who are waiting to buy more bitcoin will buy before it dumps to this price. This is the trendline that I have been observing. Can you also draw an elliot waves for this? https://imgvb.com/images/2025/05/27/613517adc370afe7941a0b66f92e7a20.jpg Title: Re: 2025 Elliott Wave Post by: xxxx123abcxxxx on May 27, 2025, 05:08:24 AM @xxxx123abcxxxx. Does that imply that elliot wave experts are no better traders than trendlines experts? I reckon traders who will choose one of these methods will both of them not have an accurate prediction. We can also be quite certain that other traders who are using different methods would also not have an accurate prediction. Also, we have a similar assessment that the market will dump lower, however, to dump on $50k is very headshaking. This is very low. We can be quite certain that many investors who are waiting to buy more bitcoin will buy before it dumps to this price. This is the trendline that I have been observing. Can you also draw an elliot waves for this? https://imgvb.com/images/2025/05/27/613517adc370afe7941a0b66f92e7a20.jpg Whether using Elliott Waves, or Trendlines, or Momentum Oscillators, or a combination of all any model will work some of the time, but not all of the time. https://12345abcdewxyz.wordpress.com/wp-content/uploads/2025/05/20250527-btcusd.png Title: Re: 2025 Elliott Wave Post by: XenoxCapital on June 15, 2025, 07:20:27 AM @xxxx123abcxxxx, I've been following you for a while now and I truly admire your work! I've also been working with Elliott Wave analysis for some time, and I believe there are a few points where the wave count might be off.
In my view, we're still within the first major wave, and currently in an extended wave 3. The initial (sub)wave 1 began in July 2011 at $15, followed by a corrective wave 2 in line with the rule of alternation. This should eventually develop into a complex wave 3 and 4, after which wave 5 will complete the third wave within the first major wave. See my projections: BTC https://www.tradingview.com/x/ABJGEfVR/ and DJI https://www.tradingview.com/x/ybclgrCG/ After that, I expect a prolonged cooling-off period in the market. If we look at the Dow Jones Industrial Average (DJI) starting in 1896, according to my analysis that was only wave 4 of the first major wave. Wave 5 wasn't completed until 32 years later, in July 1929. What followed was a corrective phase that lasted 32.8 years. I believe we're entering a similar phase again and that includes the DJI as well. Title: Re: 2025 Elliott Wave Post by: xxxx123abcxxxx on June 15, 2025, 11:17:19 AM @xxxx123abcxxxx, I've been following you for a while now and I truly admire your work! I've also been working with Elliott Wave analysis for some time, and I believe there are a few points where the wave count might be off. In my view, we're still within the first major wave, and currently in an extended wave 3. The initial (sub)wave 1 began in July 2011 at $15, followed by a corrective wave 2 in line with the rule of alternation. This should eventually develop into a complex wave 3 and 4, after which wave 5 will complete the third wave within the first major wave. See my projections: BTC https://www.tradingview.com/x/ABJGEfVR/ and DJI https://www.tradingview.com/x/ybclgrCG/ After that, I expect a prolonged cooling-off period in the market. If we look at the Dow Jones Industrial Average (DJI) starting in 1896, according to my analysis that was only wave 4 of the first major wave. Wave 5 wasn't completed until 32 years later, in July 1929. What followed was a corrective phase that lasted 32.8 years. I believe we're entering a similar phase again and that includes the DJI as well. Interesting count, thank you for sharing. However, unsure if your count considers the duration of waves in relation to degree of waves. While exact time spans may vary, the customary order of wave degrees is reflected in the following sequence...
Title: Re: 2025 Elliott Wave Post by: XenoxCapital on June 15, 2025, 04:02:02 PM Thanks for your thoughtful reply you raise a great point regarding the relationship between wave degree and time duration.
I fully agree that Elliott Wave theory depends heavily on the proportionality between wave degree and time, and Id like to expand a bit further on my perspective. What most people miss and what Ive come to realize over the years is that every chart begins with what you dont see. Thats the real starting point of any wave structure. Let me walk you through how I arrived at this idea. For years, Ive studied the oldest available charts across multiple cryptocurrencies not just Bitcoin, but also Ethereum, Dogecoin, ICON, EOS, and XRP. What stood out to me is that each of these coins starts its visible chart at a different point, yet when you study them side by side, they collectively tell a much deeper story. That story is this: when applying the Trend-Based Fibonacci Extension, youll notice that the true structural beginning always tracks back to 0.00000. Thats not just a technicality its a foundational signal. It implies that we are not just seeing the start of a Primary or Cycle wave were potentially witnessing the early formation of a Grand Supercycle structure. Let me give some broader historical context, using the Dow Jones Industrial Average (DJI): Supercycle wave 4 was formed around July 1, 1896. This was followed by the fifth and final wave of the Supercycle, ending in January 1930, with a truncated top marking the end of Grand Supercycle wave 1. Grand Supercycle wave 2 bottomed in July 1934. This creates a clear 12 structure at the highest wave degree, which we can use as a reference. I believe something similar is unfolding in BTC but compressed in time due to technological adoption and asset class maturity. To zoom in: BTC since 2011 can be interpreted as a Cycle-degree wave. We are currently in an extended Primary wave 3 within that structure. This extended wave behavior is consistent with other historical examples: DJI in the 1920s, or NASDAQ in the late 1990s. And just like those moments in history, it requires stepping back and recognizing the bigger wave in motion not just the visible highs and lows. That said, I completely agree: its essential to stay flexible and always validate wave degrees with both structure and real market behavior. I truly appreciate feedback and alternate counts because thats how we refine our view as a community. Thanks again for your insights and for continuing the conversation. Title: Re: 2025 Elliott Wave Post by: xxxx123abcxxxx on June 15, 2025, 06:36:27 PM .... That story is this: when applying the Trend-Based Fibonacci Extension, youll notice that the true structural beginning always tracks back to 0.00000. Thats not just a technicality its a foundational signal. It implies that we are not just seeing the start of a Primary or Cycle wave were potentially witnessing the early formation of a Grand Supercycle structure. .... No asset can be tracked back to 0.00000 this would imply the asset was worthless at some point in history. Neither gold, nor oil, nor bitcoin, nor either the DJIA index can be tracked back to 0.00000 Bitcoin Technically speaking, when bitcoin was launched in JAN-2009, it had no market value. So, the effective "price" was $0 but there was no chart, nor market nor trading yet, just mined for free. Once a market was established, the lowest price of bitcoin was $0.00099 (about 1/10th of a cent). Dow Jones Industtrial Average 26-MAY-1896: initial 'launch' value was 40.94 points. 08-AUG-1896: lowest ever closing value of 28.48 points, after launch. Most tech IPOs from the Dotcom Bubble (mid-1990 to 2000) eventually dropped below their first traded price. And so, the rise during that mania was considered a B-wave in those assets; or a final fifth wave in the NASDAQ index. Title: Re: 2025 Elliott Wave Post by: XenoxCapital on June 15, 2025, 07:57:15 PM Thanks for your thoughtful response you raise a very good point about the relationship between wave degree and duration within Elliott Wave analysis.
I completely agree that correctly assigning wave degrees requires consideration of time frames. But Id like to offer some additional context based on my own research and experience.One thing Ive learned over the years is this: every chart starts with what you dont see. That hidden beginning is often more important than the visible part we analyze. Let me explain. Ive spent years studying the earliest available price charts of multiple crypto assets not just Bitcoin, but also Ethereum, Dogecoin, ICON, EOS, and XRP. One thing that stood out to me is how each of these assets starts at different times with different early structures. But taken together, they seem to tell a collective story a hidden symmetry in their early movements. That led me to an interesting observation: When you apply the Trend-Based Fibonacci Extension tool, the starting point often appears to be 0.00000. Let me be clear: Im not suggesting that any asset literally traded at zero. I'm fully aware that no asset whether its gold, oil, bitcoin, or the Dow Jones has ever had a real market value of 0.00000. Here are a few facts to clarify that:
So when I refer to 0.00000, Im not talking about a historical fact its a tool-based construct within technical analysis. It represents a theoretical origin the visual zero which Fibonacci extensions often use to define trend relationships. And understanding that invisible start helps interpret whats coming next. That being said, I want to make something very clear: This is simply how I see it. Im not trying to convince anyone. This method just works really well for me personally, and Im sharing it in case it resonates with others nothing more, nothing less. Looking at it from that perspective, we may be seeing not just Primary or Cycle-degree waves, but possibly the early stages of a Grand Supercycle especially with Bitcoin, where exponential growth and early-stage adoption can distort our perception of wave proportions. This also connects with historical cycles in the Dow Jones:
That creates a 12 structure at the highest wave degree, and I believe were seeing something similar unfolding in BTC albeit over a compressed timeframe due to rapid technological acceleration. Zooming in further:
As with those historical cases, the key is to zoom out, avoid getting fixated on surface-level moves, and stay open to the idea that we might be part of a much larger unfolding structure. That said, I completely agree with your point: flexibility, constant re-evaluation, and a strong understanding of wave structure and duration are essential. Thoughtful feedback like yours helps refine these counts and strengthens the community as a whole. Thanks again for engaging with the idea. I genuinely appreciate it. Title: Re: 2025 Elliott Wave Post by: xxxx123abcxxxx on June 16, 2025, 12:05:04 AM Thanks for your thoughtful response you raise a very good point about the relationship between wave degree and duration within Elliott Wave analysis. I completely agree that correctly assigning wave degrees requires consideration of time frames. But Id like to offer some additional context based on my own research and experience.One thing Ive learned over the years is this: every chart starts with what you dont see. That hidden beginning is often more important than the visible part we analyze. Let me explain. Ive spent years studying the earliest available price charts of multiple crypto assets not just Bitcoin, but also Ethereum, Dogecoin, ICON, EOS, and XRP. One thing that stood out to me is how each of these assets starts at different times with different early structures. But taken together, they seem to tell a collective story a hidden symmetry in their early movements. That led me to an interesting observation: When you apply the Trend-Based Fibonacci Extension tool, the starting point often appears to be 0.00000. Let me be clear: Im not suggesting that any asset literally traded at zero. I'm fully aware that no asset whether its gold, oil, bitcoin, or the Dow Jones has ever had a real market value of 0.00000. Here are a few facts to clarify that:
So when I refer to 0.00000, Im not talking about a historical fact its a tool-based construct within technical analysis. It represents a theoretical origin the visual zero which Fibonacci extensions often use to define trend relationships. And understanding that invisible start helps interpret whats coming next. That being said, I want to make something very clear: This is simply how I see it. Im not trying to convince anyone. This method just works really well for me personally, and Im sharing it in case it resonates with others nothing more, nothing less. Looking at it from that perspective, we may be seeing not just Primary or Cycle-degree waves, but possibly the early stages of a Grand Supercycle especially with Bitcoin, where exponential growth and early-stage adoption can distort our perception of wave proportions. This also connects with historical cycles in the Dow Jones:
That creates a 12 structure at the highest wave degree, and I believe were seeing something similar unfolding in BTC albeit over a compressed timeframe due to rapid technological acceleration. Zooming in further:
As with those historical cases, the key is to zoom out, avoid getting fixated on surface-level moves, and stay open to the idea that we might be part of a much larger unfolding structure. That said, I completely agree with your point: flexibility, constant re-evaluation, and a strong understanding of wave structure and duration are essential. Thoughtful feedback like yours helps refine these counts and strengthens the community as a whole. Thanks again for engaging with the idea. I genuinely appreciate it. Although not perfect, a momentum oscillator such as the RSI (Relative Strength Index) can be used to help determine the degree of wave. The deeper and more oversold the momentum oscillator, the more significant the wave degree of either a wave-2 or wave-4 pullback. Ralph Nelson Elliott died in 1948; and, technical indicators such as the RSI were invented during the late 1970s. So, using technical indicators to determine Elliott Waves, may not be widely accepted or highly regarded by Elliott Wave purists. For example...
https://12345abcdewxyz.wordpress.com/wp-content/uploads/2025/06/20250616-btcusd-1.png https://12345abcdewxyz.wordpress.com/wp-content/uploads/2025/06/20250616-djia30.png Title: Re: 2025 Elliott Wave Post by: XenoxCapital on June 16, 2025, 01:19:59 PM Of course, no tool is perfect. Wave analysis requires flexibility and continuous revision to best align with the markets dynamics. Thank you for sharing your insights; it enriches the discussion and hopefully helps everyone gain a clearer understanding. Regards
Title: Re: 2025 Elliott Wave Post by: xxxx123abcxxxx on June 21, 2025, 09:39:04 AM https://12345abcdewxyz.wordpress.com/wp-content/uploads/2025/06/20250621-bncblx-1.png (https://12345abcdewxyz.wordpress.com/wp-content/uploads/2025/06/20250621-bncblx-1.png)
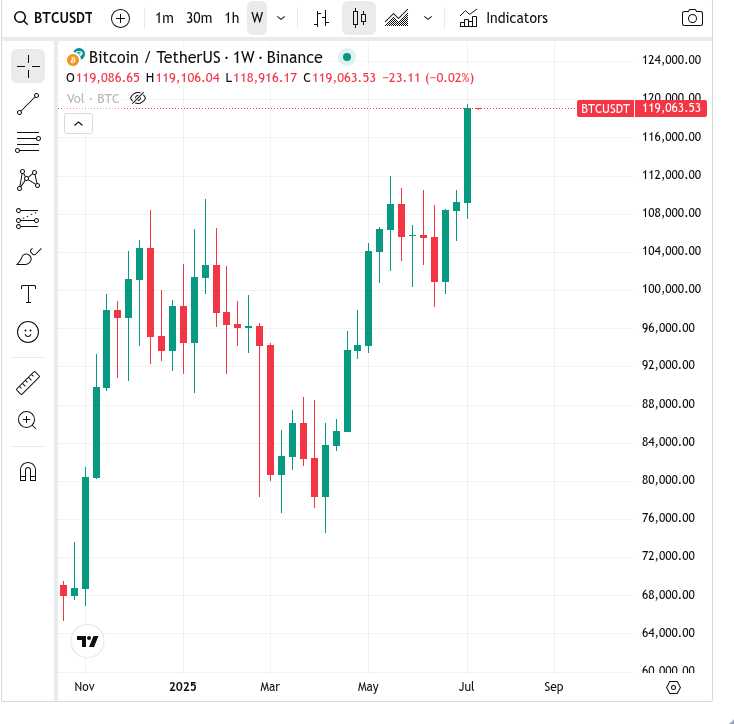
https://12345abcdewxyz.wordpress.com/wp-content/uploads/2025/06/20250621-btcusd.png (https://12345abcdewxyz.wordpress.com/wp-content/uploads/2025/06/20250621-btcusd.png) Title: Re: 2025 Elliott Wave Post by: josegines on June 23, 2025, 02:40:02 PM ... I wonder why you keep insisting on the bearish option. And of course, the situation in Iran serves as an excuse for you to think that what you've been waiting for a year will finally happen. According to you, the $114k is the key to everything. It will be the key to whether your bearish option expires, or, as always happens with Elliott, there is another option, which you have been timidly pushing into the background for many months. Where you see a potential crisis due to the US bombing, others may see a play that the market has taken advantage of to liquidate longs and thus continue rising. The $114k is the key. Will we finally see a bullish option in this thread??? Title: Re: 2025 Elliott Wave Post by: xxxx123abcxxxx on June 23, 2025, 02:53:09 PM I wonder why you keep insisting on the bearish option. And of course, the situation in Iran serves as an excuse for you to think that what you've been waiting for a year will finally happen. According to you, the $114k is the key to everything. It will be the key to whether your bearish option expires, or, as always happens with Elliott, there is another option, which you have been timidly pushing into the background for many months. Where you see a potential crisis due to the US bombing, others may see a play that the market has taken advantage of to liquidate longs and thus continue rising. The $114k is the key. Will we finally see a bullish option in this thread??? The chart and projection was posted 12 hours before the US bombed Iran. Bullish scenario arises when either of the following occurs... 1. A daily/weekly close above $114,000; or, 2. A decline to around $65,000 Title: Re: 2025 Elliott Wave Post by: josegines on June 25, 2025, 02:00:30 AM I wonder why you keep insisting on the bearish option. And of course, the situation in Iran serves as an excuse for you to think that what you've been waiting for a year will finally happen. According to you, the $114k is the key to everything. It will be the key to whether your bearish option expires, or, as always happens with Elliott, there is another option, which you have been timidly pushing into the background for many months. Where you see a potential crisis due to the US bombing, others may see a play that the market has taken advantage of to liquidate longs and thus continue rising. The $114k is the key. Will we finally see a bullish option in this thread??? The chart and projection was posted 12 hours before the US bombed Iran. Bullish scenario arises when either of the following occurs... 1. A daily/weekly close above $114,000; or, 2. A decline to around $65,000 You've been waiting for BTC to fall to $50k for over a year, with or without an irregular flat. And your only mention of a bullish alternative count is: "that the bearish option will be invalidated above $114k." This isn't Elliott, this is your bearish thread. The norm in Elliott, especially in long-term terms, is to have two alternatives, one bullish and one bearish. You've been using only one for a year: going for $50k. https://bitcointalk.org/index.php?topic=5485551.msg64037630#msg64037630 Title: Re: 2025 Elliott Wave Post by: xxxx123abcxxxx on June 26, 2025, 01:19:57 AM You've been waiting for BTC to fall to $50k for over a year, with or without an irregular flat. And your only mention of a bullish alternative count is: "that the bearish option will be invalidated above $114k." This isn't Elliott, this is your bearish thread. The norm in Elliott, especially in long-term terms, is to have two alternatives, one bullish and one bearish. You've been using only one for a year: going for $50k. https://bitcointalk.org/index.php?topic=5485551.msg64037630#msg64037630 This is not my "bearish thread" :) Personally, I think bitcoin may surpass the marketcap of gold; and, if that were to happen at today's gold price, then bitcoin would be around $1,200,000 https://companiesmarketcap.com/assets-by-market-cap/ Title: Re: 2025 Elliott Wave Post by: josegines on July 11, 2025, 09:49:33 PM You've been waiting for BTC to fall to $50k for over a year, with or without an irregular flat. And your only mention of a bullish alternative count is: "that the bearish option will be invalidated above $114k." This isn't Elliott, this is your bearish thread. The norm in Elliott, especially in long-term terms, is to have two alternatives, one bullish and one bearish. You've been using only one for a year: going for $50k. https://bitcointalk.org/index.php?topic=5485551.msg64037630#msg64037630 This is not my "bearish thread" :) Personally, I think bitcoin may surpass the marketcap of gold; and, if that were to happen at today's gold price, then bitcoin would be around $1,200,000 https://companiesmarketcap.com/assets-by-market-cap/ It won't reach 1200,000 this year, or next. However, it could rise to 200,000 or 300,000. I'm here to see some lines drawn pointing upwards, to try to predict the new ATH, in date and price, but we've only been aiming for 50,000 for a year now. No alternative count. Two days left to see if BTC closes the week above $114,000. Title: Re: 2025 Elliott Wave Post by: josegines on July 14, 2025, 12:11:36 AM BTC closed the week above $114k
Will there be a bullish count, or do you still want it to go to $50k after a whole year of waiting, with no bullish alternate count? https://i.postimg.cc/qvf7TPbw/Selecci-n-035.jpg (https://postimages.org/) https://i.postimg.cc/Kz4bLfp4/Selecci-n-036.jpg (https://postimages.org/) Title: Re: 2025 Elliott Wave Post by: xxxx123abcxxxx on July 14, 2025, 08:03:55 AM https://12345abcdewxyz.wordpress.com/wp-content/uploads/2025/07/20250714-w-btcusd.png (https://12345abcdewxyz.wordpress.com/wp-content/uploads/2025/07/20250714-w-btcusd.png)
https://12345abcdewxyz.wordpress.com/wp-content/uploads/2025/07/20250714-d-btcusd.png (https://12345abcdewxyz.wordpress.com/wp-content/uploads/2025/07/20250714-d-btcusd.png) Title: Re: 2025 Elliott Wave Post by: josegines on July 18, 2025, 01:33:04 AM Are fractals of any use in Elliot?
https://i.postimg.cc/xTrT2XcF/Selecci-n-062.jpg (https://postimages.org/) Title: Re: 2025 Elliott Wave Post by: xxxx123abcxxxx on July 18, 2025, 01:58:42 AM Are fractals of any use in Elliot? https://i.postimg.cc/xTrT2XcF/Selecci-n-062.jpg The very nature of Elliott Waves are fractal. Title: Re: 2025 Elliott Wave Post by: bhadz on July 18, 2025, 04:01:50 AM This is like a man cave and people don't come here and try to look how enthusiastic what this elliott wave's show. I've seen some real life elliott wave traders and they're also bullish for Bitcoin. Looking at that with the projection of potentially getting $500k early 2026, it's still possible. So we're on the 4th wave already and waiting for the 5th one to reach.
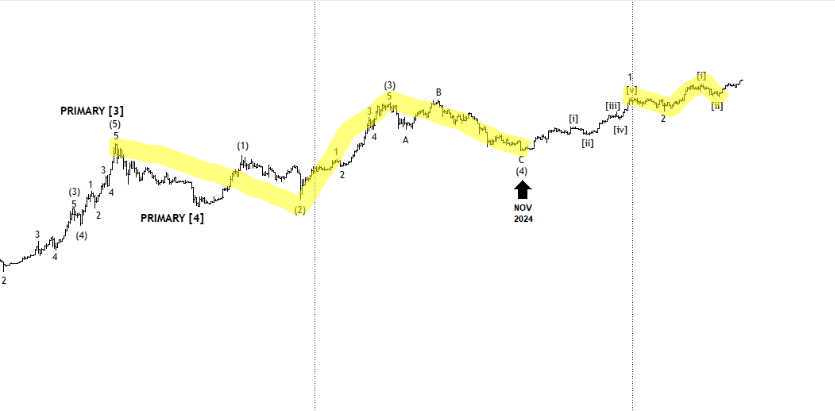
or do you still want it to go to $50k after a whole year of waiting, with no bullish alternate count? That would indicate the bear market if ever it goes back to $50k.Title: Re: 2025 Elliott Wave Post by: xxxx123abcxxxx on July 18, 2025, 06:13:17 AM This is like a man cave and people don't come here and try to look how enthusiastic what this elliott wave's show. I've seen some real life elliott wave traders and they're also bullish for Bitcoin. Looking at that with the projection of potentially getting $500k early 2026, it's still possible. So we're on the 4th wave already and waiting for the 5th one to reach. or do you still want it to go to $50k after a whole year of waiting, with no bullish alternate count? That would indicate the bear market if ever it goes back to $50k.Better to be in a man cave, rather than a bear cave ! The Elliott Waves of Bitcoin are starting to act like commodity markets, in two behaviours... 1. The first waves are developing as Leading Diagonals and the fifth waves are developing as Ending Diagonals. This formation of Diagonal waves are overlapping 3-3-3 structures as opposed to impulsive 1-2-3-4-5 wave structures. Consequently, when such Leading/Ending Diagonals are developing in early stages, it is often an assumption to consider such waves as Irregular B-waves at first. 2. The fifth wave is extended and longest; i.e. INTERMEDIATE(5) within PRIMARY[5] is subdividing and extending, which started from the NOV-2024 low. When the fifth wave is extending and the longest, a completion price target is derived as a Fibonacci 1.618 times the length from the start of first wave to the end of the third wave, projected from the low of the fourth wave. This provides a possible price target of approx $2.3M by around the year 2030, that is, assuming the current uptrend of INTERMEDIATE(5) wave continues along the trendline starting from the NOV-2024 low... https://12345abcdewxyz.wordpress.com/wp-content/uploads/2025/07/20250718-btcusd.png (https://12345abcdewxyz.wordpress.com/wp-content/uploads/2025/07/20250718-btcusd.png) Title: Re: 2025 Elliott Wave Post by: ahmedabubakarabbo on July 18, 2025, 05:01:58 PM Appreciate you sharing that always cool to see different takes on the market even if it is speculative Elliott Wave can give some structure to the chaos. I will check in on the updates now and then just to see how it plays out who knows maybe 2025 follows the wave perfectly
Title: Re: 2025 Elliott Wave Post by: bhadz on July 18, 2025, 08:45:45 PM This is like a man cave and people don't come here and try to look how enthusiastic what this elliott wave's show. I've seen some real life elliott wave traders and they're also bullish for Bitcoin. Looking at that with the projection of potentially getting $500k early 2026, it's still possible. So we're on the 4th wave already and waiting for the 5th one to reach. or do you still want it to go to $50k after a whole year of waiting, with no bullish alternate count? That would indicate the bear market if ever it goes back to $50k.Better to be in a man cave, rather than a bear cave ! The Elliott Waves of Bitcoin are starting to act like commodity markets, in two behaviours... 1. The first waves are developing as Leading Diagonals and the fifth waves are developing as Ending Diagonals. This formation of Diagonal waves are overlapping 3-3-3 structures as opposed to impulsive 1-2-3-4-5 wave structures. Consequently, when such Leading/Ending Diagonals are developing in early stages, it is often an assumption to consider such waves as Irregular B-waves at first. 2. The fifth wave is extended and longest; i.e. INTERMEDIATE(5) within PRIMARY[5] is subdividing and extending, which started from the NOV-2024 low. When the fifth wave is extending and the longest, a completion price target is derived as a Fibonacci 1.618 times the length from the start of first wave to the end of the third wave, projected from the low of the fourth wave. This provides a possible price target of approx $2.3M by around the year 2030, that is, assuming the current uptrend of INTERMEDIATE(5) wave continues along the trendline starting from the NOV-2024 low... https://12345abcdewxyz.wordpress.com/wp-content/uploads/2025/07/20250718-btcusd.png (https://12345abcdewxyz.wordpress.com/wp-content/uploads/2025/07/20250718-btcusd.png) Title: Re: 2025 Elliott Wave Post by: kunt3p3r on July 21, 2025, 07:53:44 AM This is like a man cave and people don't come here and try to look how enthusiastic what this elliott wave's show. I've seen some real life elliott wave traders and they're also bullish for Bitcoin. Looking at that with the projection of potentially getting $500k early 2026, it's still possible. So we're on the 4th wave already and waiting for the 5th one to reach. or do you still want it to go to $50k after a whole year of waiting, with no bullish alternate count? That would indicate the bear market if ever it goes back to $50k.Better to be in a man cave, rather than a bear cave ! The Elliott Waves of Bitcoin are starting to act like commodity markets, in two behaviours... 1. The first waves are developing as Leading Diagonals and the fifth waves are developing as Ending Diagonals. This formation of Diagonal waves are overlapping 3-3-3 structures as opposed to impulsive 1-2-3-4-5 wave structures. Consequently, when such Leading/Ending Diagonals are developing in early stages, it is often an assumption to consider such waves as Irregular B-waves at first. 2. The fifth wave is extended and longest; i.e. INTERMEDIATE(5) within PRIMARY[5] is subdividing and extending, which started from the NOV-2024 low. When the fifth wave is extending and the longest, a completion price target is derived as a Fibonacci 1.618 times the length from the start of first wave to the end of the third wave, projected from the low of the fourth wave. This provides a possible price target of approx $2.3M by around the year 2030, that is, assuming the current uptrend of INTERMEDIATE(5) wave continues along the trendline starting from the NOV-2024 low... https://12345abcdewxyz.wordpress.com/wp-content/uploads/2025/07/20250718-btcusd.png (https://12345abcdewxyz.wordpress.com/wp-content/uploads/2025/07/20250718-btcusd.png) Greetings. According to this count primary 2-4 channel has broken. This bothers me. I am considering 15k low might be primary 4. W3 could count somehow imo. Title: Re: 2025 Elliott Wave Post by: xxxx123abcxxxx on July 23, 2025, 02:25:12 AM Greetings. According to this count primary 2-4 channel has broken. This bothers me. I am considering 15k low might be primary 4. W3 could count somehow imo. https://i.ibb.co/S7P8Z7bw/EW-Channel.png Title: Re: 2025 Elliott Wave Post by: kunt3p3r on July 23, 2025, 09:11:59 AM Greetings. According to this count primary 2-4 channel has broken. This bothers me. I am considering 15k low might be primary 4. W3 could count somehow imo. https://i.ibb.co/S7P8Z7bw/EW-Channel.png https://i.ibb.co/v4Np0VKz/2-5-1400x788.jpg https://www.elliottwave.com/waveopedia/channeling/ Can W5 override this rule by touching or breaking channel lower band? Title: Re: 2025 Elliott Wave Post by: xxxx123abcxxxx on July 23, 2025, 09:24:38 AM https://i.ibb.co/v4Np0VKz/2-5-1400x788.jpg https://www.elliottwave.com/waveopedia/channeling/ Can W5 override this rule by touching or breaking channel lower band? Channelling is a guide, not a rule. Channels may be broken, just like support and resistance is broken. https://www.elliottwave.com/waveopedia/throw-over/ Title: Re: 2025 Elliott Wave Post by: xxxx123abcxxxx on August 03, 2025, 07:06:20 PM https://12345abcdewxyz.wordpress.com/wp-content/uploads/2025/08/20250803-w-btcusd.png (https://12345abcdewxyz.wordpress.com/wp-content/uploads/2025/08/20250803-w-btcusd.png)
https://12345abcdewxyz.wordpress.com/wp-content/uploads/2025/08/20250803-d-btcusd.png (https://12345abcdewxyz.wordpress.com/wp-content/uploads/2025/08/20250803-d-btcusd.png) Title: Re: 2025 Elliott Wave Post by: josegines on August 07, 2025, 12:14:08 AM Wow, I can't imagine a "2026 Elliott Wave" thread +.
"2027 Elliott Wave" thread +. "2028 Elliott Wave" thread +. "2029 Elliott Wave" thread. Title: Re: 2025 Elliott Wave Post by: xxxx123abcxxxx on August 07, 2025, 05:32:04 AM Wow, I can't imagine a "2026 Elliott Wave" thread +. "2027 Elliott Wave" thread +. "2028 Elliott Wave" thread +. "2029 Elliott Wave" thread. Neither can I, its getting quite boring and we still can't get it right ! Title: Re: 2025 Elliott Wave Post by: pizzapotential on August 23, 2025, 08:29:33 AM I find the current long term count unlikely as that would have wave 5 be longer in time than wave 3 (primary). Having a bull market until 2029 seems absurd given what we've seen.
Title: Re: 2025 Elliott Wave Post by: xxxx123abcxxxx on August 23, 2025, 11:48:31 AM I find the current long term count unlikely as that would have wave 5 be longer in time than wave 3 (primary). Having a bull market until 2029 seems absurd given what we've seen. There is no Elliott Wave rule violation: Elliott Waves are measured in points, not in percentages nor time; and hence, the third PRIMARY[3] wave isn't the smallest. Title: Re: 2025 Elliott Wave Post by: pizzapotential on August 23, 2025, 01:18:10 PM The issue is not validity, it's likelihood.
Title: Re: 2025 Elliott Wave Post by: xxxx123abcxxxx on August 25, 2025, 08:58:25 PM https://12345abcdewxyz.wordpress.com/wp-content/uploads/2025/08/20250825-btcusd.png (https://12345abcdewxyz.wordpress.com/wp-content/uploads/2025/08/20250825-btcusd.png)
Title: Re: 2025 Elliott Wave Post by: SoniBTC on September 06, 2025, 06:38:56 AM |