|
Title: Geez! You know this chart, guys?! Post by: Dump3er on August 07, 2014, 12:42:20 PM Title: Re: Geez! You know this chart, guys?! Post by: wachtwoord on August 07, 2014, 01:10:03 PM Everyone knows that graph. We're currently at the very end of it. Time for the next cycle :)
Title: Re: Geez! You know this chart, guys?! Post by: zby on August 07, 2014, 01:13:06 PM The "anotomy of the buble" chart is a different one - sorry!
Title: Re: Geez! You know this chart, guys?! Post by: Dump3er on August 07, 2014, 01:22:10 PM The "anotomy of the buble" chart is a different one - sorry! Nope. The other chart is for plain dumpers, without any further skills, like fontas or mmitech. Title: Re: Geez! You know this chart, guys?! Post by: tarmi on August 07, 2014, 04:18:35 PM The "anotomy of the buble" chart is a different one - sorry! Nope. The other chart is for plain dumpers, without any further skills, like fontas or mmitech. whose alter dumper ego are you? :D Title: Re: Geez! You know this chart, guys?! Post by: pungopete468 on August 07, 2014, 04:45:01 PM My interpretation of that chart tells me that final capitulation hasn't happened yet...
Compress the Bitcoin chart and it looks like final capitulation won't be for another few months. Title: Re: Geez! You know this chart, guys?! Post by: maker88 on August 07, 2014, 07:34:08 PM But if you don't artificially compress it to meet your views, it's pretty clear those two charts do not match at all.
Title: Re: Geez! You know this chart, guys?! Post by: ensurance982 on August 07, 2014, 07:46:41 PM So, are you proposing that we've reached the 'real bottom' now once and for all, or do you say we might see another bubble after this one? I think those are two polar opposite positions one could assume here. The bubble you are showing us actually suggests that things are done, but bitcoin experiences bubble over bubble, it seems! Title: Re: Geez! You know this chart, guys?! Post by: fdiini on August 07, 2014, 08:28:53 PM Look like law of gravity at work.
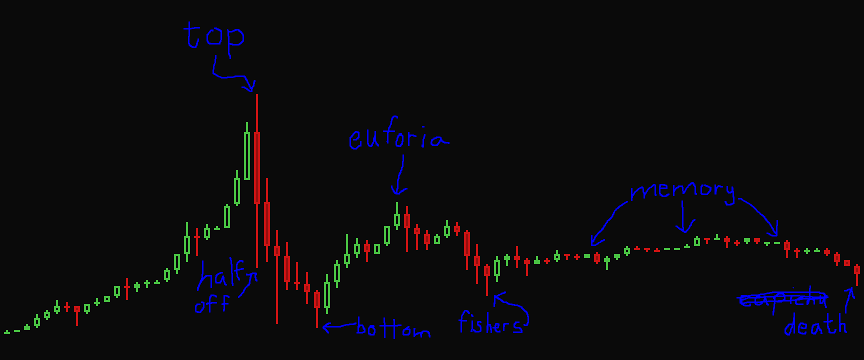
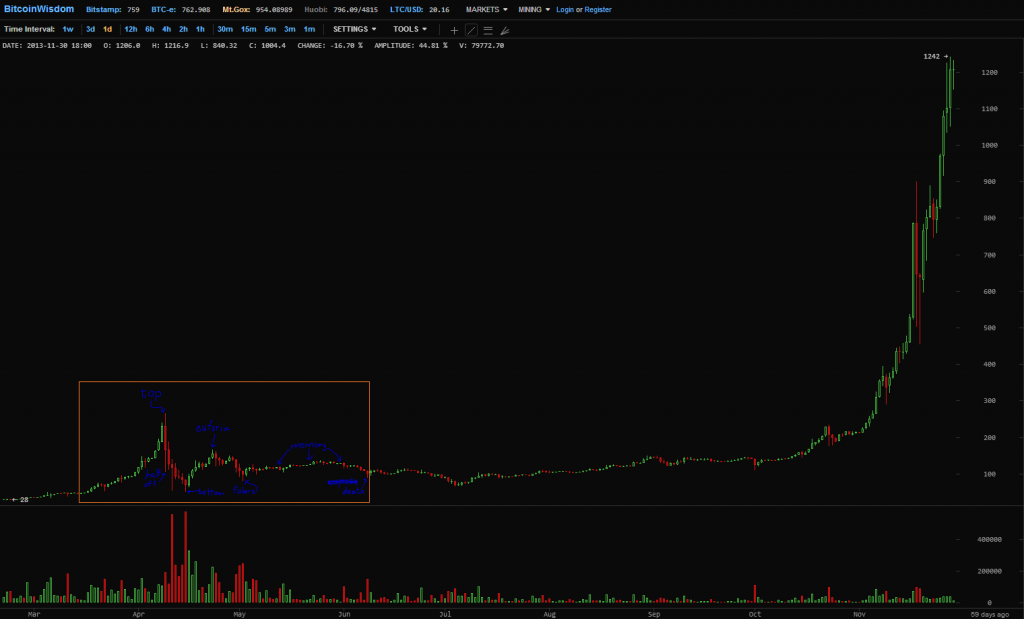
What goes up, must come down. Title: Re: Geez! You know this chart, guys?! Post by: ensurance982 on August 07, 2014, 08:37:08 PM Look like law of gravity at work. What goes up, must come down. Has Bitcoin ever cared about what it 'must'? You know, the Honeybadger just doesn't care. Bitcoin has 'violated' so many laws markets are supposed to work according to. I wouldn't be surprised if we were in for a few more surprises to come! Title: Re: Geez! You know this chart, guys?! Post by: pungopete468 on August 07, 2014, 10:06:01 PM But if you don't artificially compress it to meet your views, it's pretty clear those two charts do not match at all. Neither chart has a timescale associated, therefore compressing the Bitcoin chart doesn't alter the relevance of the trend data... Since the chart is just a representation of a typical bubble cycle it actually makes sense to change the timescale of the Bitcoin chart to where it matches the trend closest. Of course, neither chart is really valuable for predicting the future price of Bitcoin when the market is so illiquid that even modestly wealthy single entities can be major market movers; that alone makes it utterly unpredictable... Title: Re: Geez! You know this chart, guys?! Post by: Wilhelm on August 07, 2014, 10:30:02 PM It looks a lot like "The Chart" :D 8)
http://cdn.uncommonwisdomdaily.com/media/uwd/issues/2013/040313-pm-img-01.jpg Title: Re: Geez! You know this chart, guys?! Post by: ensurance982 on August 07, 2014, 10:33:23 PM It looks a lot like "The Chart" :D 8) http://cdn.uncommonwisdomdaily.com/media/uwd/issues/2013/040313-pm-img-01.jpg To be honest, though: Bitcoin hasn't seen that sharp corrections. I know those charts are exaggerated and are only supposed to illustrate a certain movement, or behavior, but a correction to levels at the start of before the bubble even began, is unseen when it comes to Bitcoin. Wait, I may be wrong... 2012? Title: Re: Geez! You know this chart, guys?! Post by: Schickeria on August 07, 2014, 10:41:41 PM But if you don't artificially compress it to meet your views, it's pretty clear those two charts do not match at all. Neither chart has a timescale associated, therefore compressing the Bitcoin chart doesn't alter the relevance of the trend data... Since the chart is just a representation of a typical bubble cycle it actually makes sense to change the timescale of the Bitcoin chart to where it matches the trend closest. Of course, neither chart is really valuable for predicting the future price of Bitcoin when the market is so illiquid that even modestly wealthy single entities can be major market movers; that alone makes it utterly unpredictable... Very reasonable posting. Even if this chart was posted as a joke or for trolling, it shows a typical development of a bubble. Each bubble has a proper progress and second capitulation can't be ruled out. Analyzing trading, the hard resistances etc. I give it a good chance, but it's no obligation. Title: Re: Geez! You know this chart, guys?! Post by: Schickeria on August 07, 2014, 10:46:00 PM To be honest, though: Bitcoin hasn't seen that sharp corrections. I know those charts are exaggerated and are only supposed to illustrate a certain movement... Your quoted bubble is an illustration, the other picture looks like the NASDAQ. Title: Re: Geez! You know this chart, guys?! Post by: ensurance982 on August 07, 2014, 10:51:56 PM To be honest, though: Bitcoin hasn't seen that sharp corrections. I know those charts are exaggerated and are only supposed to illustrate a certain movement... Your quoted bubble is an illustration, the other picture looks like the NASDAQ. Yeah but if we compare Bitcoin bubbles to past bubbles from the regular good old financial sector, we can see for example that the Bitcoin bubbles don't go as far down as the Dot Com bubble did after it went bust. The whole ecosystem took years to recover. Bitcoin remains at about 2-4x pre-bubble-prices Title: Re: Geez! You know this chart, guys?! Post by: Schickeria on August 07, 2014, 11:11:40 PM To be honest, though: Bitcoin hasn't seen that sharp corrections. I know those charts are exaggerated and are only supposed to illustrate a certain movement... Your quoted bubble is an illustration, the other picture looks like the NASDAQ. Yeah but if we compare Bitcoin bubbles to past bubbles from the regular good old financial sector, we can see for example that the Bitcoin bubbles don't go as far down as the Dot Com bubble did after it went bust. The whole ecosystem took years to recover. Bitcoin remains at about 2-4x pre-bubble-prices The NASDAQ bubble has developed over several years. To compare those two in the bigger picture (as you do) you should look at the NASDAQ years 94 - 98. So the real boom has not even started. It depends all on the timeframe we choose. But this very, very speculative. http://www.wirtschaftswurm.net/wp-content/uploads/2013/03/Nasdaq-Index-Dotcomblase.png Title: Re: Geez! You know this chart, guys?! Post by: ensurance982 on August 07, 2014, 11:17:49 PM The NASDAQ bubble has developed over several years. To compare those two in the bigger picture (as you do) you should look at the NASDAQ years 94 - 98. So the real boom has not even started. But this very, very speculative. It depends all on the timeframe we choose. http://www.wirtschaftswurm.net/wp-content/uploads/2013/03/Nasdaq-Index-Dotcomblase.png Interesting! So you are basically implying that we may still be in for the 'really big' bubble that will make the previous ones look like small spikes. But the outcome of that mega-bubble will then decide about the future of bitcoin? Title: Re: Geez! You know this chart, guys?! Post by: Schickeria on August 07, 2014, 11:27:52 PM Interesting! So you are basically implying that we may still be in for the 'really big' bubble that will make the previous ones look like small spikes. But the outcome of that mega-bubble will then decide about the future of bitcoin? I don't know! ;-) Bitcoin is very different from the NASDAQ, but humans and their emotions like greed and fear are the same. Title: Re: Geez! You know this chart, guys?! Post by: fred930 on August 07, 2014, 11:32:51 PM I know those charts are exaggerated and are only supposed to illustrate a certain movement, or behavior It's too easy to try to make real charts fit these exaggerated charts. I doubt the real charts are ever a perfect match to them. Title: Re: Geez! You know this chart, guys?! Post by: rogerwilco on August 07, 2014, 11:55:40 PM http://i222.photobucket.com/albums/dd21/shadyparadox/FUDscribbles_zps07e9384c.png http://i222.photobucket.com/albums/dd21/shadyparadox/FUD_zpsc898d4d6.png Title: Re: Geez! You know this chart, guys?! Post by: InwardContour on August 08, 2014, 05:16:16 AM I don't think that the final capitulation is going to happen, every chart is different from the others because there's no pattern which can predict what will happen in the future.
Title: Re: Geez! You know this chart, guys?! Post by: mrmousebtc on August 08, 2014, 05:37:56 AM So are we going up or down?
I can't understand if I should enter now or wait for the final capitulation. Title: Re: Geez! You know this chart, guys?! Post by: w0lverine on August 08, 2014, 05:40:04 AM /thread and end of the speculation subforum. Title: Re: Geez! You know this chart, guys?! Post by: Buo on August 08, 2014, 06:04:09 AM /thread and end of the speculation subforum. Yeah in this forum we are all writing worthless speculations, but sometimes it's an entertaining reading :) Title: Re: Geez! You know this chart, guys?! Post by: Mental Fight on August 08, 2014, 07:45:30 AM i dont understandi really want to understand . its mean price will raise or fall ?
Title: Re: Geez! You know this chart, guys?! Post by: fonzie on August 08, 2014, 07:55:04 AM i dont understandi really want to understand . its mean price will raise or fall ? 9000$ in 8 weeks! Max. 72 hours left to buy below 600$. Sell your kids, sell your car and house, leverage to the max.GO ALL FUCKING IN! Title: Re: Geez! You know this chart, guys?! Post by: BitCoinNutJob on August 08, 2014, 09:31:27 AM It looks a lot like "The Chart" :D 8) http://cdn.uncommonwisdomdaily.com/media/uwd/issues/2013/040313-pm-img-01.jpg To be honest, though: Bitcoin hasn't seen that sharp corrections. I know those charts are exaggerated and are only supposed to illustrate a certain movement, or behavior, but a correction to levels at the start of before the bubble even began, is unseen when it comes to Bitcoin. Wait, I may be wrong... 2012? What about the drop from $266 to $50, that also matches the bubble chart pretty good Title: Re: Geez! You know this chart, guys?! Post by: xavier on August 08, 2014, 01:42:22 PM hm, it seems right now we're in the "investment memory is long" phase, and have yet to reach final capitulation.
Title: Re: Geez! You know this chart, guys?! Post by: ensurance982 on August 08, 2014, 01:46:22 PM So are we going up or down? I can't understand if I should enter now or wait for the final capitulation. Waiting for final capitulation isn't working. "YOU" have to basically capitulate and lose faith in Bitcoin. When that happens, the capitulation is there. Everyone knows about bubbles, about capitulation about non-emotional trading, and yet no one actually manages to adhere to those things except for traders who know their business! It's interesting from a psychological point of view! Title: Re: Geez! You know this chart, guys?! Post by: Schickeria on August 08, 2014, 02:00:48 PM hm, it seems right now we're in the "investment memory is long" phase, and have yet to reach final capitulation. That's my impression, too. But one should be careful, to build up trading strategies on such assumptions. My personal conclusion is to hold on breathe, not to sell but also not buy, waiting if capitulation happens or not. Overall market sentiment is looking confused and puzzled. Title: Re: Geez! You know this chart, guys?! Post by: ensurance982 on August 08, 2014, 02:06:42 PM Interesting! So you are basically implying that we may still be in for the 'really big' bubble that will make the previous ones look like small spikes. But the outcome of that mega-bubble will then decide about the future of bitcoin? I don't know! ;-) Bitcoin is very different from the NASDAQ, but humans and their emotions like greed and fear are the same. Yeah that's basically it! All the trading is fueled by greed, after all. It doesn't matter if it's stocks, currencies or whatever. The patterns and behaviorisms remain the same for the most part! Title: Re: Geez! You know this chart, guys?! Post by: ensurance982 on August 08, 2014, 02:08:09 PM hm, it seems right now we're in the "investment memory is long" phase, and have yet to reach final capitulation. That's my impression, too. But one should be careful, to build up trading strategies on such assumptions. My personal conclusion is to hold on breathe, not to sell but also not buy, waiting if capitulation happens or not. Overall market sentiment is looking confused and puzzled. There could be some kind of shock upwards, that'll burn enough shorts, and when the volume goes back up and the rallye manages to gain speed, we may as well be in another full-blown bull market again. Only trade on your assumptions, if you're ready to lose, as well! Title: Re: Geez! You know this chart, guys?! Post by: pikabit on August 08, 2014, 02:21:13 PM okay so predict a price for january 2015
Title: Re: Geez! You know this chart, guys?! Post by: Schickeria on August 08, 2014, 02:33:05 PM So are we going up or down? I can't understand if I should enter now or wait for the final capitulation. If you are not invested at all in bitcoin, you could buy now, but have to be strong in the case of a possible capitulation that could go to low 300's or less probable even lower. Nobody can assure you will happen. All speculation is only build up on probabilities, and even these probabilities each one will define different. My estimate: 40% capitulation to (400's - 300's), 30% longer sidewards movement (500 - 800), then bull run 25% bull run in the near term 5% cataclysm to very low levels Title: Re: Geez! You know this chart, guys?! Post by: BowieMan on August 08, 2014, 02:59:22 PM No way we're going to see a drop that sharp and below the prices of before the bubble. Bitcoin Bubbles burst at times, yeah, they're bubbles after all. But they do get us to prices we haven't been before! That's what makes them special and immune to this chart. Title: Re: Geez! You know this chart, guys?! Post by: Febo on August 08, 2014, 08:29:38 PM My interpretation of that chart tells me that final capitulation hasn't happened yet... Compress the Bitcoin chart and it looks like final capitulation won't be for another few months. Agree final capitulation is at least half year away so enjoy guy till it will last. Title: Re: Geez! You know this chart, guys?! Post by: Dump3er on August 14, 2014, 02:41:41 PM Ha! What did the dump3er dude tell you all?
Ha! Now you all agree that it looks like witchcraft! Funny times ahead! Ha! Title: Re: Geez! You know this chart, guys?! Post by: whap on August 14, 2014, 02:48:28 PM Ha! What did the dump3er dude tell you all? Ha! Now you all agree that it looks like witchcraft! Funny times ahead! Ha! Jizzed in your pants? Title: Re: Geez! You know this chart, guys?! Post by: Dump3er on August 14, 2014, 02:54:45 PM Ha! What did the dump3er dude tell you all? Ha! Now you all agree that it looks like witchcraft! Funny times ahead! Ha! Jizzed in your pants? While charting I'm always nude, so no pants... Title: Re: Geez! You know this chart, guys?! Post by: zimmah on August 14, 2014, 03:43:31 PM http://i222.photobucket.com/albums/dd21/shadyparadox/FUDscribbles_zps07e9384c.png http://i222.photobucket.com/albums/dd21/shadyparadox/FUD_zpsc898d4d6.png the time between the 300 and the 1300 is shorter than the time between 1300 and now. in other words, the long period after the 'death' should already be past us. Title: Re: Geez! You know this chart, guys?! Post by: wasamata on August 14, 2014, 04:00:02 PM Im going to buy me some tulips,
atleast they smell nice. Title: Re: Geez! You know this chart, guys?! Post by: Beliathon on August 14, 2014, 04:11:13 PM the time between the 300 and the 1300 is shorter than the time between 1300 and now. Bingo.in other words, the long period after the 'death' should already be past us. I'll add this for some perspective: https://i.imgur.com/FnJShDU.png All of this has happened before. All of it will happen again. And again. And again until nation-state fiat scrip no longer exists. Title: Re: Geez! You know this chart, guys?! Post by: porcupine87 on August 14, 2014, 04:21:49 PM So, throw away all your knowledge about economics and price theory. Supply and demand? With a stable supply and more people think it is useful, the price will raise? Arrgh. It is only about the past! If people like Bitcoin more and more they have bad luck. Because of TA, patterns in the past and theoretival life cylcles. Sorry, guys!
In my opinion the price is falling recently, because many people thought that in July the price will 5fold. They just believed in a new rally. Other people just get nervous because Bitcoin is adopting much slowier than expected or hoped. No one is using BTC and this is bad... Title: Re: Geez! You know this chart, guys?! Post by: Schickeria on August 14, 2014, 04:29:44 PM the time between the 300 and the 1300 is shorter than the time between 1300 and now. Bingo.in other words, the long period after the 'death' should already be past us. I'll add this for some perspective: https://i.imgur.com/FnJShDU.png All of this has happened before. All of it will happen again. And again. And again until nation-state fiat scrip no longer exists. Are you going to make competition to "The Anatomy of a Bubble" Chart by posting your chart in a inflationary manner? No matter in which thread I'm reading I find your chart. We all have seen it! It's ok. There were a lot of other people, which had recognized the pattern similarities before. Please stop posting it! Title: Re: Geez! You know this chart, guys?! Post by: whap on August 14, 2014, 04:30:18 PM Other people just get nervous because Bitcoin is adopting much slowier than expected or hoped. No one is using BTC and this is bad... I suggest you read this: http://www.coindesk.com/overstock-reveals-bitcoin-sales-averaging-15000-per-day/ Maybe your assumption is not quite correct. Title: Re: Geez! You know this chart, guys?! Post by: dontbugme on August 14, 2014, 04:37:44 PM Extrapolations have and will continue to fail to accurately predict what will happen next. Sure you can get something that is "close," but it will never be the same. Irrational markets tend not to follow the exact same thing every time. I'm talkin about it having more gradual run ups one bubble, or hard crashes the next.
They all have the same general characteristics such as peaks, bottoms, bull/bear traps, and stagnant periods. Always look to the past for information, but never use it as guidance. The conditions that happened in 2012 are much more different than they are in present trading. Sentiment, news, and technicals can all be so much more different. Title: Re: Geez! You know this chart, guys?! Post by: porcupine87 on August 14, 2014, 09:41:20 PM Other people just get nervous because Bitcoin is adopting much slowier than expected or hoped. No one is using BTC and this is bad... I suggest you read this: http://www.coindesk.com/overstock-reveals-bitcoin-sales-averaging-15000-per-day/ Maybe your assumption is not quite correct. hm ok. I don't know one retailer/bar/shop which I use and accepts Bitcoin. I don't know one person personally who bought something with Bitcoin. Me, too. Ah oh wait, I bought a book via some middle service from Amazon. I think it cost 2 or 3x more than with Euro. Title: Re: Geez! You know this chart, guys?! Post by: CoinDiver on August 14, 2014, 09:53:31 PM A more important chart:
http://www.google.com/trends/explore#q=bitcoin&date=1%2F2013%2020m&cmpt=date Title: Re: Geez! You know this chart, guys?! Post by: B1tc01n5 on August 14, 2014, 10:57:05 PM These graphs can be interpreted in so many ways tho
Title: Re: Geez! You know this chart, guys?! Post by: blumangroup on August 15, 2014, 12:56:40 AM Wow, this is actually pretty fascinating. It's really interesting how human mass psychology can be displayed, explained, and manipulated with numbers.
Title: Re: Geez! You know this chart, guys?! Post by: Hfleer on August 15, 2014, 01:20:55 AM I find it funny that people always try to force a "system" or a "scheme" on things. Fact is that things do no repeat itself.
Title: Re: Geez! You know this chart, guys?! Post by: Dump3er on September 26, 2014, 11:50:26 AM DUMPER! Such TA! So accurate! Very Guru! http://graphics8.nytimes.com/images/2008/02/19/arts/Tokiospan.jpg ;) |