|
Title: Chart of the day, HFT edition Post by: herzmeister on August 09, 2012, 12:21:32 PM http://blogs.reuters.com/felix-salmon/2012/08/06/chart-of-the-day-hft-edition/
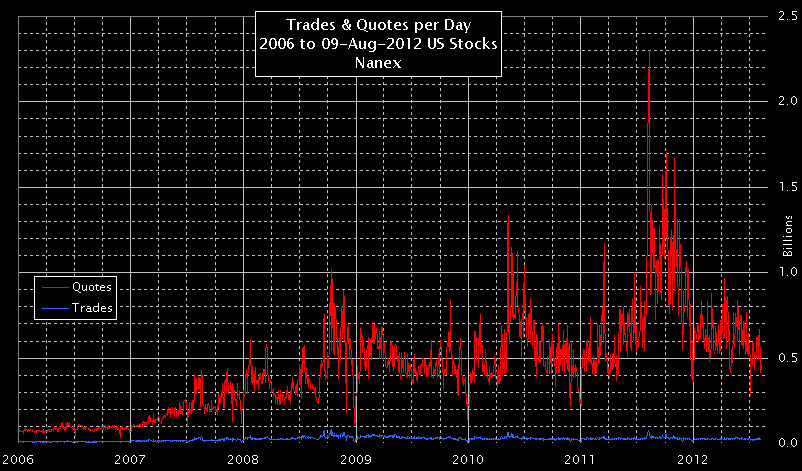
Quote https://i.imgur.com/DxWer.gif This astonishing GIF comes from Nanex, and shows the amount of high-frequency trading in the stock market from January 2007 to January 2012. (Which means that the Knightmare craziness of last week is not included.) The various colors, as identified in the legend on the right, are all the different US stock exchanges. You might think there are only two stock exchanges in the US, but youd be wrong: there are only two exchanges where stocks are listed. There are many, many more exchanges where stocks are traded. What we see here is relatively low levels of high-frequency trading through all of 2007. Then, in 2008, a pattern starts to emerge: a big spike right at the close, at 4pm, which is soon mirrored by another spike at the open. This is the era of traders going off to play golf in the middle of the day, because nothing interesting happens except at the beginning and the end of the trading day. But it doesnt last long. By the end of 2008, odd spikes in trading activity show up in the middle of the day, and of course theres a huge flurry of activity around the time of the financial crisis. And then, after that, things just become completely unpredictable. Theres still a morning spike for most of 2009, but even that goes away eventually, to be replaced with sheer noise. Sometimes, like at the end of 2010, high-frequency trading activity is very low. At other times, like at the end of 2011, its incredibly high. Intraday spikes can happen at any time of day, and volumes can surge and fall back in pretty much random fashion. Its certainly fair to say that if you take a long, five-year view, then you can see a clear rise in trading activity. But its also fair to say that theres something quite literally out of control going on here. Just as the quants at Knight found themselves unable to turn off their machines for 30 long minutes last week, the HFT world in aggregate seemingly has a mind of its own when it comes to trading patterns. Or, to put it another way, if theres a pattern here, its one incomprehensible to human minds. Back in 2007, I wasnt a fan of a financial-transactions tax; today, I am. And this chart shows better than anything why my opinion has changed. The stock market is clearly more dangerous than it was in 2007, with much greater tail risk; meanwhile, in return for facing that danger, society as a whole has received precious little utility. Are spreads a tiny bit tighter than they might be otherwise? Perhaps. But that has no effect on stock-market returns for long-term or even medium-term investors. The stock market today is a war zone, where algobots fight each other over pennies, millions of times a second. Sometimes, the casualties are merely companies like Knight, and few people have much sympathy for them. But inevitably, at some point in the future, significant losses will end up being borne by investors with no direct connection to the HFT world, which is so complex that its potential systemic repercussions are literally unknowable. The potential cost is huge; the short-term benefits are minuscule. Lets give HFT the funeral it deserves. Even Bitcoin has a tobin tax (transaction fee) :D Title: Re: Chart of the day, HFT edition Post by: notme on August 09, 2012, 02:33:43 PM I get that x is time of day, but what is y?
Title: Re: Chart of the day, HFT edition Post by: Raralith on August 11, 2012, 06:20:29 AM Title: Re: Chart of the day, HFT edition Post by: FreeMoney on August 11, 2012, 06:37:47 AM in decibels? but seriously, units would be interesting to know. Title: Re: Chart of the day, HFT edition Post by: byronbb on August 12, 2012, 06:50:42 PM I believe the Y axis is quotes...ie ask/bid offers in millions. I don't think the HFT bots actually do massive volumes of actually executed trades, they "quote stuff" and try to bluff other people into making offers that are a mistake and then buying and sell those offers really quickly.
http://www.nanex.net/aqck/2006.20120809.TrdQteCnt.3.png http://www.nanex.net/aqck/2804.HTML Title: Re: Chart of the day, HFT edition Post by: notme on August 12, 2012, 09:02:09 PM I believe the Y axis is quotes...ie ask/bid offers in millions. I don't think the HFT bots actually do massive volumes of actually executed trades, they "quote stuff" and try to bluff other people into making offers that are a mistake and then buying and sell those offers really quickly. http://www.nanex.net/aqck/2006.20120809.TrdQteCnt.3.png http://www.nanex.net/aqck/2804.HTML In other words, placing orders without the intention to trade. Something that has been illegal for humans to do since 1932, but somehow robots get away with it. Title: Re: Chart of the day, HFT edition Post by: Strider Hiryu on August 14, 2012, 11:11:22 AM "Lets give the mechanized loom the funeral it deserves."
Title: Re: Chart of the day, HFT edition Post by: Strongman on August 15, 2012, 11:50:52 AM I think the lesson here is not to short-term trade against a machine. Go medium to long-term. I've yet to see my portfolio hurt by computers with that strategy. ;D
Title: Re: Chart of the day, HFT edition Post by: Le Happy Merchant on August 17, 2012, 04:23:38 PM I would be very interested to see a graph like this for trades at Mtgox.
Title: Re: Chart of the day, HFT edition Post by: Oinsane1 on August 22, 2012, 05:58:53 AM what is the solution to this?... slower executions?...
its something i wonder about all the time Title: Re: Chart of the day, HFT edition Post by: notme on August 22, 2012, 07:44:08 PM what is the solution to this?... slower executions?... its something i wonder about all the time 2 simple steps. 1. Require orders to be on the book for a minimum of 2 seconds before they can be removed. 2. Require proof of capital for the organization placing the order to show they can fill all outstanding orders (just like how every bitcoin trading site reserves the funds when you place an order). Title: Re: Chart of the day, HFT edition Post by: Yuhfhrh on August 23, 2012, 09:52:57 AM I would be very interested to see a graph like this for trades at Mtgox. Yes please! lol Title: Re: Chart of the day, HFT edition Post by: n8rwJeTt8TrrLKPa55eU on August 24, 2012, 03:58:13 PM I think the lesson here is not to short-term trade against a machine. Go medium to long-term. I've yet to see my portfolio hurt by computers with that strategy. ;D This is very true, and at both extremes. Investing on too short a timescale, or too far out, you will get screwed. There's a sweet spot somewhere in between, where intelligent humans can still have an edge. Based on my own trading successes and failures, I'd say it's a sliding window of between 1 and 3 years. Title: Re: Chart of the day, HFT edition Post by: iCEBREAKER on August 24, 2012, 09:47:45 PM This chart represents the global economy burning down in a fire of financialization.
That's why it looks like flames. |