|
Title: Simple Analysis Post by: 1Pakis on September 03, 2012, 10:25:09 AM I 'm starting this thread in order to keep a log of very simple analysis usually without comments from me.
You can comment you as much as you want. Lets start: http://s15.postimage.org/diynfd5ln/upload.png Title: Re: Simple Analysis Post by: 1Pakis on September 03, 2012, 10:31:48 AM Title: Re: Simple Analysis Post by: 1Pakis on September 03, 2012, 10:39:19 AM Title: Re: Simple Analysis Post by: 1Pakis on September 03, 2012, 10:58:28 AM ur SC configuration is not correct Where is the mistake?What should I do to correct it? http://s8.postimage.org/8b1v2a4h1/upload.png Title: Re: Simple Analysis Post by: Seal on September 03, 2012, 11:46:15 AM I 'm starting this thread in order to keep a log of very simple analysis usually without comments from me. Why no comments? Given this is a forum community, a description would be helpful to a lot of people even if it is only one sentence. Title: Re: Simple Analysis Post by: 1Pakis on September 03, 2012, 12:08:45 PM I thing because they are simple they are somehow self explained :)
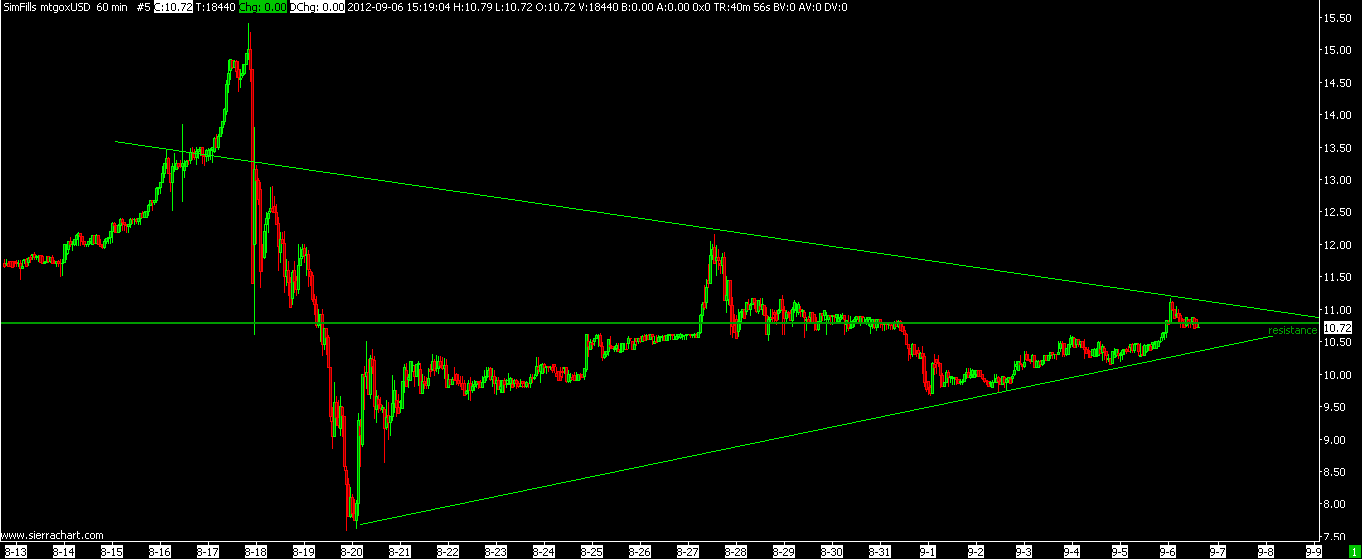
Title: Re: Simple Analysis Post by: the_thing on September 03, 2012, 12:31:08 PM I thing because they are simple they are somehow self explained :) From what I see, I understand that you use minimum and maximum day prices in certain days (typically in long-time lows and peaks). However, I don't understand how maximum and minimum prices in these days are relevant. You know, sometimes people sell/buy small amounts of bitcoins for much less/more than what market price is.Care to explain your methods? Title: Re: Simple Analysis Post by: 1Pakis on September 03, 2012, 04:48:01 PM Quote Care to explain your methods? I don't have any specific method. When you draw lines, channels, fibs, e.t.c. you use the extremes. I don't recomment any entry or exit points. I just try to keep it simple and not overanalyse. Title: Re: Simple Analysis Post by: the_thing on September 03, 2012, 05:05:44 PM Quote Care to explain your methods? I don't have any specific method. When you draw lines, channels, fibs, e.t.c. you use the extremes. I don't recomment any entry or exit points. I just try to keep it simple and not overanalyse. Truth be told, I'm skeptical about technical analysis in general. Title: Re: Simple Analysis Post by: RyNinDaCleM on September 03, 2012, 10:46:13 PM Well, if you don't have a specific method and just draw straight lines and connect them somewhere then it seems like a random analysis that shows nothing. Truth be told, I'm skeptical about technical analysis in general. Well, you can see that the trend-lines show obvious support/resistance, and that the descending channel was broken out of today. I would recommend however, the use of parallel lines to mark the top/bottom extremes of the channels, and everyone would be able to see how these channels hold up over time. Title: Re: Simple Analysis Post by: FreeMoney on September 04, 2012, 12:34:01 AM These charts are all of the past. When do we get the future ones?
Title: Re: Simple Analysis Post by: RyNinDaCleM on September 04, 2012, 12:42:47 AM These charts are all of the past. When do we get the future ones? I'd pay some decent coin for SierraChart:Future! :P Title: Re: Simple Analysis Post by: cloon on September 04, 2012, 07:12:06 AM @1pakis
have you thought of using logarithmic scale? you'd have a different view Title: Re: Simple Analysis Post by: 1Pakis on September 06, 2012, 05:05:00 AM I will try it.
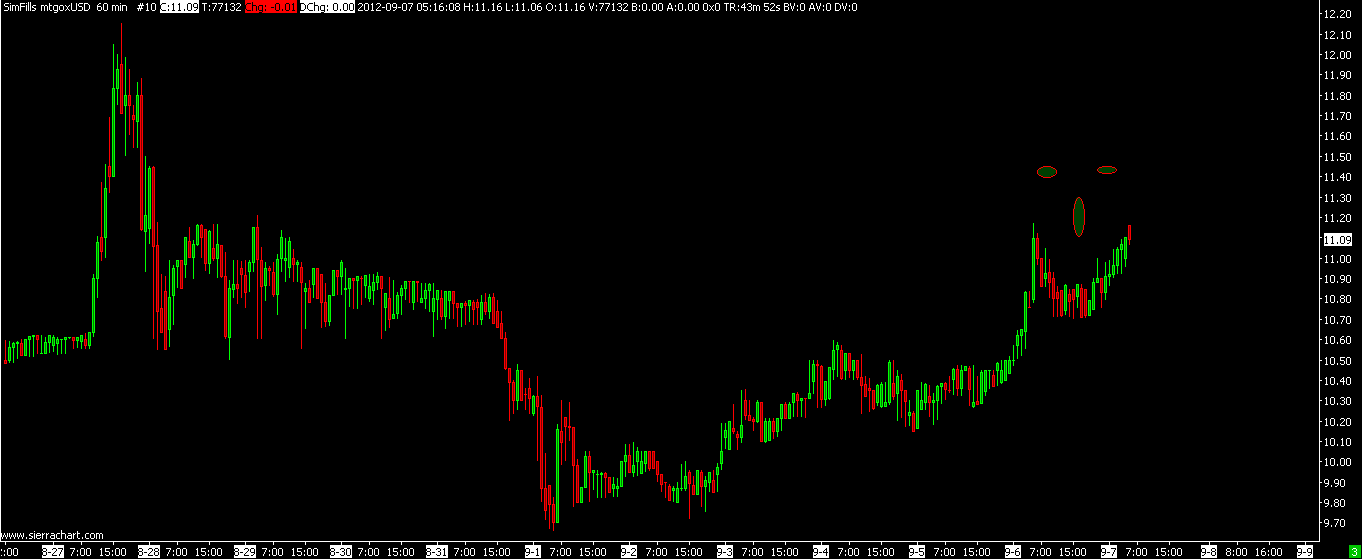
I think log scale is for long term and very big price movements. Title: Re: Simple Analysis Post by: 1Pakis on September 06, 2012, 05:05:43 AM Title: Re: Simple Analysis Post by: 1Pakis on September 06, 2012, 05:19:31 AM Title: Re: Simple Analysis Post by: 1Pakis on September 06, 2012, 05:24:39 AM Here is the log scale of the above image.
Not much difference. http://s15.postimage.org/rwi53auff/upload.png Title: Re: Simple Analysis Post by: lucif on September 06, 2012, 12:23:33 PM Title: Re: Simple Analysis Post by: lucif on September 06, 2012, 10:19:07 PM |