|
Title: Bigger Blocks = Higher Prices: Visualizing the 92% historical correlation Post by: Peter R on October 07, 2015, 02:47:05 PM https://i.imgur.com/ixcTFTR.gif
This animation is a unique visualization of the historical relationship between the average block size and the price of a bitcoin. Not only do the two quantities tend to grow larger together, the higher-frequency oscillations are often in phase too. The animation was created in Mathematica from empirical (real) data downloaded from blockchain.info. I wrote a simple program to create a true-to-scale static image for an arbitrary month, looped through all the months of Bitcoins history, and then exported the resulting array of images as an animated GIF. The cited 92% correlation is the Pearsons correlation coefficient between the logarithm of the two time series. It is important to take the logarithm so that the correlation coefficient describes how the percent change in one quantity is related to the perfect change in the other. P.S. The green rectangles are supposed to represent dollar bills :) CROSS-POST NOTICE: This content was also submitted to https://www.reddit.com/r/Bitcoin/ but I am not permitted to share the link to the discussion over there. Please take notice of the following comment by /u/eragmus: "Next time, I'd suggest explicitly letting people here know that you do not want that brigading to occur. Make it clear that you want discussion, instead of a mob. Honestly, make a good faith attempt and genuinely try to figure out the truth without any bias, and no in the world will have justification to ban or censor anything... Or if they do, I won't remain a supporter, at least." I encourage you to freely participate in discussion at Reddit, up vote and down vote as you normally would, but I remind you that vote brigading is against Reddit rules. Title: Re: Bigger Blocks = Higher Prices: Visualizing the 92% historical correlation Post by: LiteCoinGuy on October 07, 2015, 03:12:55 PM thanks for that peter, very interesting.
Title: Re: Bigger Blocks = Higher Prices: Visualizing the 92% historical correlation Post by: knight22 on October 07, 2015, 03:52:23 PM I think it is obvious that higher prices generates bigger blocks because people suddenly have more money to spend. Higher prices also correlates with higher transaction volumes which also makes sense.
Title: Re: Bigger Blocks = Higher Prices: Visualizing the 92% historical correlation Post by: QuestionAuthority on October 07, 2015, 04:46:02 PM If you play that back in slow motion you can see after a more wide spread adoption of Bitcoin the correlation drops off as the MB of block size remains high but the price in USD declines. I think any preschooler would expect the correlation between block size and increasing price to track during Bitcoin's infancy. It seems as if you're attempting to use block size to explain supply, demand and market equilibrium as it relates to price. I don't think block size is a very good metric for that.
Think of it this way. You can have a block with two one btc transactions of $1,000 per Bitcoin or a block with 2000 one btc transactions at $1 per Bitcoin. Each of those blocks is transmitting $2,000 of value. The price per coin is less is the second example but the block size will be much larger. The number of transactions per block isn't related directly to price but to adoption. Title: Re: Bigger Blocks = Higher Prices: Visualizing the 92% historical correlation Post by: Amph on October 07, 2015, 04:52:14 PM it also shows that 1200 ath was heavy manipulated(probably fake walls and buy orders only to increase the value) and was not reflecting at all the curent situation, where the price is more about right
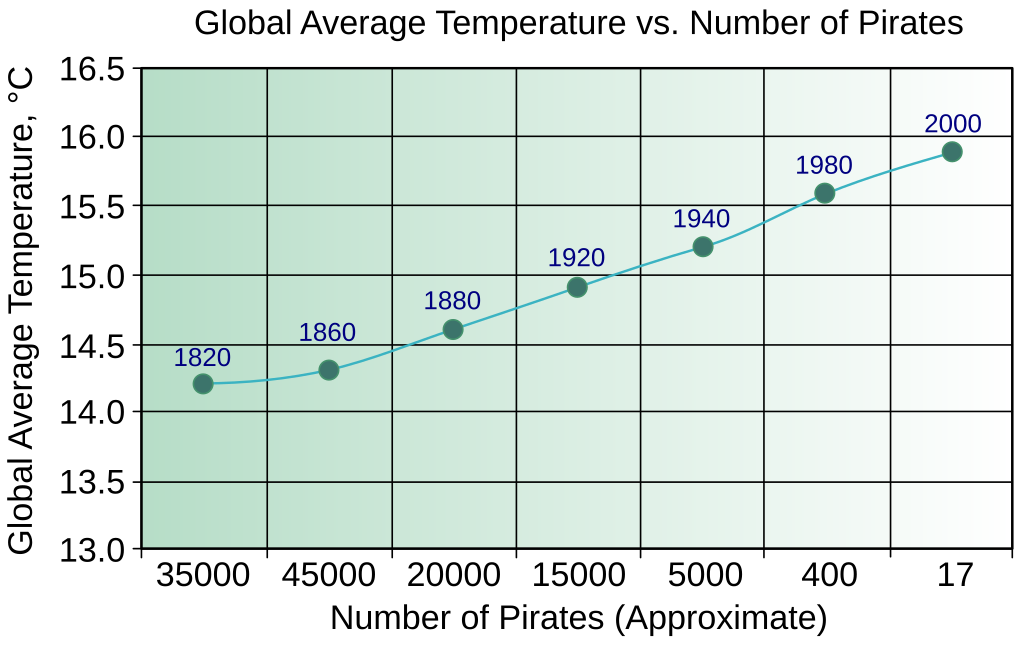
and by looking at the maximum showed in that graph, it appear that the price can still increase a lot with the current limit Title: Re: Bigger Blocks = Higher Prices: Visualizing the 92% historical correlation Post by: amaclin on October 07, 2015, 04:55:01 PM https://en.wikipedia.org/wiki/Flying_Spaghetti_Monster
https://upload.wikimedia.org/wikipedia/commons/thumb/d/de/PiratesVsTemp%28en%29.svg/1024px-PiratesVsTemp%28en%29.svg.png Title: Re: Bigger Blocks = Higher Prices: Visualizing the 92% historical correlation Post by: yayayo on October 07, 2015, 05:17:16 PM https://en.wikipedia.org/wiki/Flying_Spaghetti_Monster https://upload.wikimedia.org/wikipedia/commons/thumb/d/de/PiratesVsTemp%28en%29.svg/1024px-PiratesVsTemp%28en%29.svg.png Perfect response! Op is trying to induce a causal perception when in fact his evidence is purely correlational. This violation of scientific diligence is symptomatic for Hearndresencoiners. The explanation for the observed correlation is most simple: Higher prices = more spending of hoarded coins = more transactions = bigger blocks. This image (from https://bitinfocharts.com) shows good evidence for this: https://bitinfocharts.com/visualization/Bitcoin-1280x512.png ya.ya.yo! Title: Re: Bigger Blocks = Higher Prices: Visualizing the 92% historical correlation Post by: Gimpeline on October 07, 2015, 05:34:19 PM https://en.wikipedia.org/wiki/Flying_Spaghetti_Monster https://upload.wikimedia.org/wikipedia/commons/thumb/d/de/PiratesVsTemp%28en%29.svg/1024px-PiratesVsTemp%28en%29.svg.png Ramen Title: Re: Bigger Blocks = Higher Prices: Visualizing the 92% historical correlation Post by: worhiper_-_ on October 07, 2015, 05:39:45 PM correlation does not imply causation
https://imgs.xkcd.com/comics/correlation.png This post could serve as a textbook example of this. Title: Re: Bigger Blocks = Higher Prices: Visualizing the 92% historical correlation Post by: PolarPoint on October 07, 2015, 05:47:06 PM Bigger blocks do not cause higher prices. It's the other way round. Rise in prices generate more transactions, people sending bitcoin to exchanges or people sending bitcoin to wallets after buying them from exchanges, and the blocks become bigger.
Title: Re: Bigger Blocks = Higher Prices: Visualizing the 92% historical correlation Post by: bitbollo on October 07, 2015, 05:53:46 PM yes it's correct.
a correlation doesn't imply a causation! correlation does not imply causation https://imgs.xkcd.com/comics/correlation.png This post could serve as a textbook example of this. check this site... you can see by yourself (and get even the R!) http://www.tylervigen.com/spurious-correlations Title: Re: Bigger Blocks = Higher Prices: Visualizing the 92% historical correlation Post by: brg444 on October 07, 2015, 06:18:21 PM Over the last year and a half the supposed correlation probably turns to 0 if not negative.
https://en.wikipedia.org/wiki/Charlatan Title: Re: Bigger Blocks = Higher Prices: Visualizing the 92% historical correlation Post by: yayayo on October 08, 2015, 01:44:55 PM Over the last year and a half the supposed correlation probably turns to 0 if not negative. Yes, you can see the probable reason in the image I've posted as well: Intense spending by people that bought higher and can't stand it any longer. (So the current situation is different from the previous ones, where most spending occurred in a rising trend (and hence a fiat profit if cashed out).) After these people are out, the exchange rate will rise again. ya.ya.yo! |