|
Title: Chart analysis: 4 month chance for rally ahead !! Post by: Spekulatius on September 11, 2011, 10:10:41 PM http://img9.imageshack.us/img9/4648/unbenanntida.png (http://imageshack.us/photo/my-images/9/unbenanntida.png/)
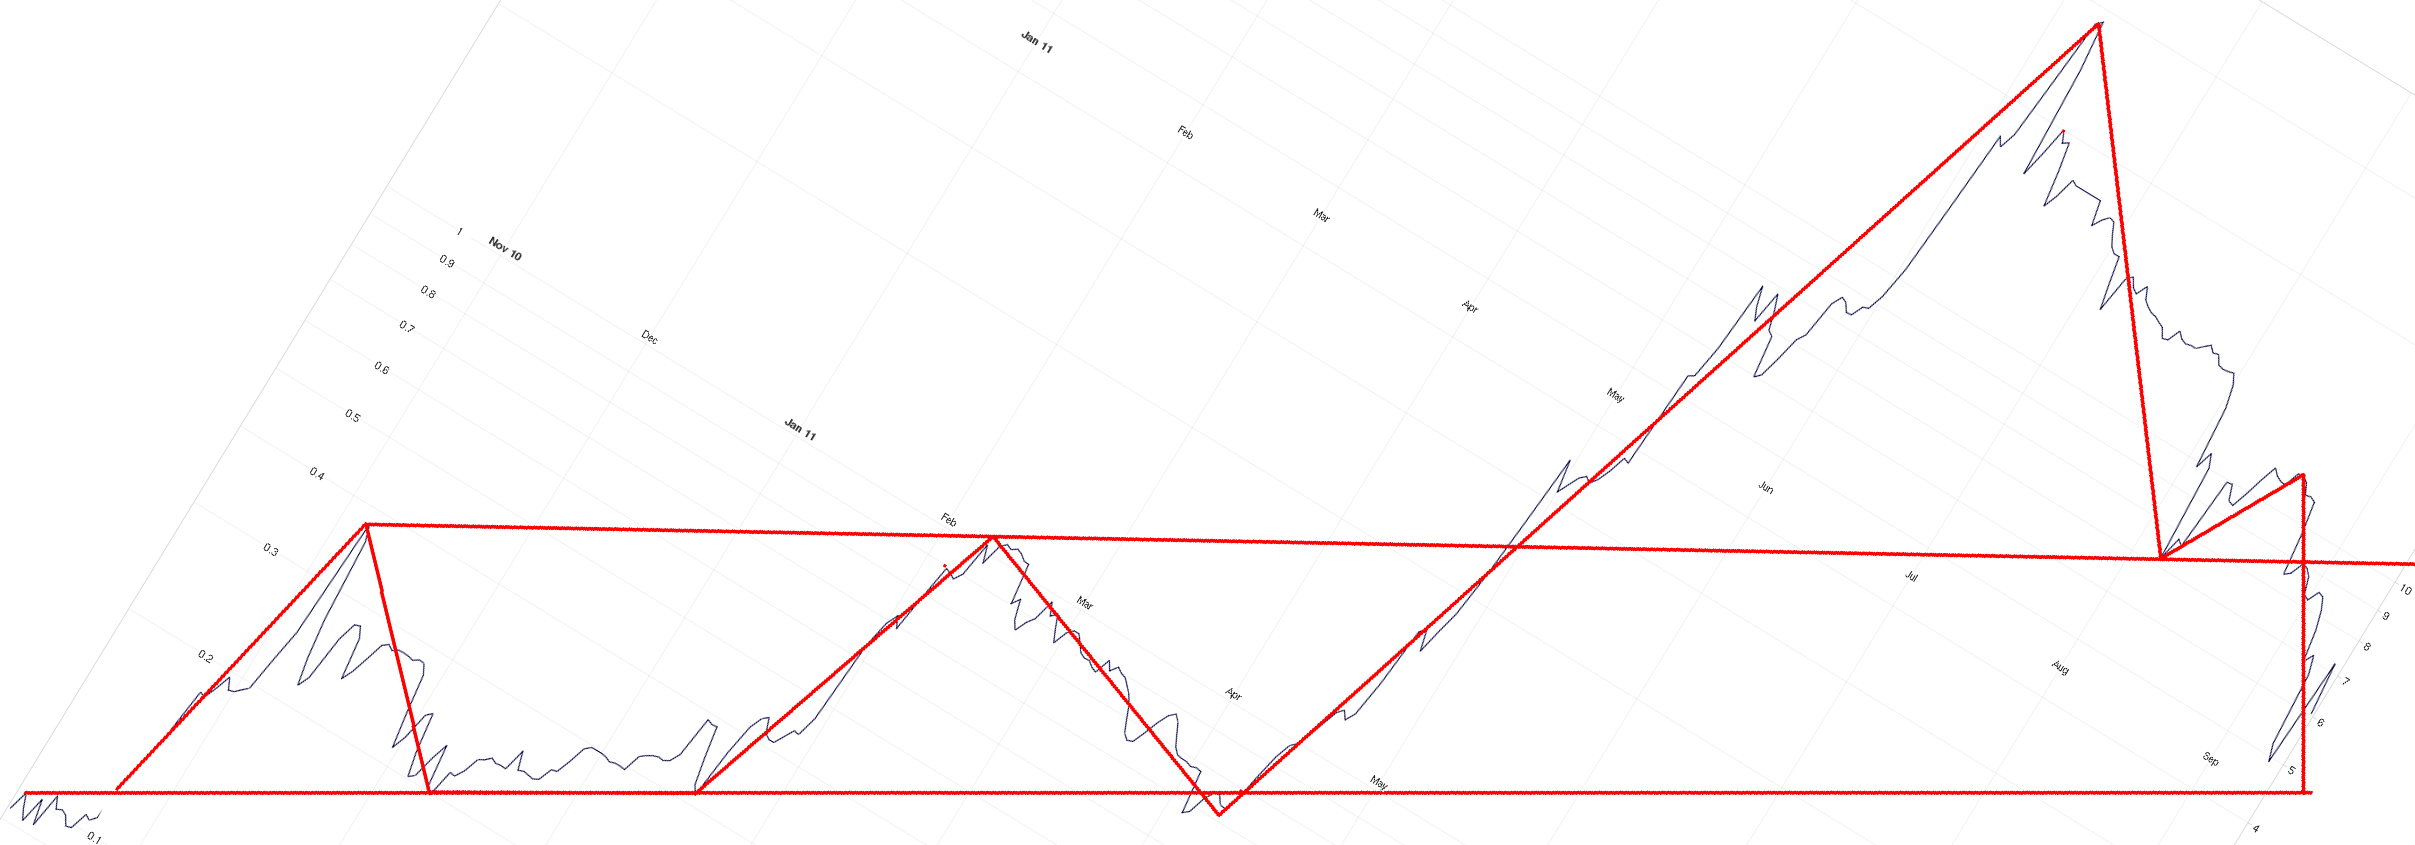
On average the determining resistance that quelled all daily closing prices of the last 4 month lowered 0.24$ each day, putting the break point for today, the 16th of Sept. 2011 at 5.60$. For the following days (closing prices) it will be around the following: 17.09.11: ~5.36$ 18.09.11: ~5.12$ 19.09.11: ~4.88$ 20.09.11: ~4.64$ 21.09.11: ~4.40$ 22.09.11: ~4.16$ ... I cannot predict where or when it will break through, but am certain, that this line will be the hurdle to take before a new really can start. Better watch closely! As for me: As soon as the rate breaks and holds for at least 2 days at least 10% above the line, Im all in! What about you? - knusper knusper knäuschen.. Title: Re: Chart analysis: 4 month chance for rally ahead !! Post by: NamelessOne on September 11, 2011, 10:14:16 PM Excellent, I've also been paying very close attention to 7 over the last 30 minutes or so.
Title: Re: Chart analysis: 4 month chance for rally ahead !! Post by: Synaptic on September 11, 2011, 10:17:54 PM You people leave me speechless...
...you really fucking do. Title: Re: Chart analysis: 4 month chance for rally ahead !! Post by: fcmatt on September 11, 2011, 10:20:14 PM You people leave me speechless... ...you really fucking do. i was trying to find some picture that basically said drawing lines on graphs is bad. Title: Re: Chart analysis: 4 month chance for rally ahead !! Post by: NamelessOne on September 11, 2011, 10:32:23 PM The technical analysis I've followed has worked pretty well for me. Not claiming it is the perfect.
Title: Re: Chart analysis: 4 month chance for rally ahead !! Post by: Swishercutter on September 11, 2011, 10:34:48 PM You people leave me speechless... ...you really fucking do. We only wish that was true. You never shut up. Title: Re: Chart analysis: 4 month chance for rally ahead !! Post by: fcmatt on September 11, 2011, 10:50:11 PM I think the fact that bitcoins started out as worthless throws off every graph's usefulness when you include those
early days. Try drawing the bottom graph when the price was .50 cents and many more people started getting involved. It shows a whole different outcome. Title: Re: Chart analysis: 4 month chance for rally ahead !! Post by: Synaptic on September 11, 2011, 10:59:36 PM I think the fact that bitcoins started out as worthless throws off every graph's usefulness when you include those early days. Try drawing the bottom graph when the price was .50 cents and many more people started getting involved. It shows a whole different outcome. Don't talk sense here! Title: Re: Chart analysis: 4 month chance for rally ahead !! Post by: Vandroiy on September 12, 2011, 12:29:23 AM i was trying to find some picture that basically said drawing lines on graphs is bad. On logscale charts, mind you! I think the image up there does the job nicely. How long can that line hold without things getting reeeeeally awkward? The USD could do some hyperinflation, that might help for a while, but counts as awkward IMO. Title: Re: Chart analysis: 4 month chance for rally ahead !! Post by: Spekulatius on September 12, 2011, 12:30:02 AM http://img69.imageshack.us/img69/1764/unbenannt2sp.png (http://imageshack.us/photo/my-images/69/unbenannt2sp.png/)
UPDATE: The new magic number is 6.00 ! :D :D :D :D Title: Re: Chart analysis: 4 month chance for rally ahead !! Post by: Dargo on September 12, 2011, 03:47:32 AM Interesting chart, though as has been pointed out, trendlines on a log scale are pretty non-traditional. But I'm not knocking it. You want to see good volume on the break above that trendline as a confirmation. Failed breakout/breakdown patterns often result in vicious moves the other way.
Edit: Just realized that upper trendline is on linear scale, only lower trendline is on log scale. Title: Re: Chart analysis: 4 month chance for rally ahead !! Post by: Spekulatius on September 13, 2011, 06:18:16 PM Update: Till 6.00$ to maintain today
Title: Re: Chart analysis: 4 month chance for rally ahead !! Post by: istar on September 13, 2011, 07:39:20 PM There are 7200 New coins each day.
The chart methods you use are probably not adapted to such high inflation. They are probably not made for inflation at all. Title: Re: Chart analysis: 4 month chance for rally ahead !! Post by: mobodick on September 13, 2011, 07:58:08 PM What about you? Me? I think that in any 4-month period bitcoin will at least rally once and crash once (and propably multiple times), no matter how you whish to explain it to yourself. Title: Re: Chart analysis: 4 month chance for rally ahead !! Post by: critmass on September 13, 2011, 08:02:04 PM If you can't explain why you decided to draw a line on a chart (ie the economic theory that supports it) you probably shouldn't post it, just saying.
Title: Re: Chart analysis: 4 month chance for rally ahead !! Post by: Bigpiggy01 on September 14, 2011, 03:08:59 AM OP I'd be really grateful if you'd stick your charts on imgur as well atm imageshack just gives the frog in icecube error. ;D
Title: Re: Chart analysis: 4 month chance for rally ahead !! Post by: Dargo on September 14, 2011, 03:16:12 AM If you can't explain why you decided to draw a line on a chart (ie the economic theory that supports it) you probably shouldn't post it, just saying. Technical analysis is a way of analyzing trading action, which can and often does take on a life of its own that is largely independent of fundamentals (i.e. economic theory). To demand that a line on a chart be justified by economic theory or any other kind of fundamental analysis is to misunderstand the nature of the analysis being used. I know it seems like complete voodoo hocus pocus BS, but technical analysis really is a great tool for making trading decisions. But like any tool, you have to understand how to use it. I don't have good charts to look at, but so far it doesn't look to me like this trend line break is materializing, so I don't think there is yet any technical reason to think we are in for a sustained rally. But genuine trend line breaks are very solid technical patterns, and can, in the right hands, be used to great effect for trading - I've seen this particular pattern unfold for stocks hundreds of times. Title: Re: Chart analysis: 4 month chance for rally ahead !! Post by: Minsc on September 14, 2011, 05:06:12 AM It won't even move more than 1% in value a day anymore.
Title: Re: Chart analysis: 4 month chance for rally ahead !! Post by: S3052 on September 14, 2011, 02:14:47 PM If you can't explain why you decided to draw a line on a chart (ie the economic theory that supports it) you probably shouldn't post it, just saying. Technical analysis is a way of analyzing trading action, which can and often does take on a life of its own that is largely independent of fundamentals (i.e. economic theory). To demand that a line on a chart be justified by economic theory or any other kind of fundamental analysis is to misunderstand the nature of the analysis being used. I know it seems like complete voodoo hocus pocus BS, but technical analysis really is a great tool for making trading decisions. But like any tool, you have to understand how to use it. I don't have good charts to look at, but so far it doesn't look to me like this trend line break is materializing, so I don't think there is yet any technical reason to think we are in for a sustained rally. But genuine trend line breaks are very solid technical patterns, and can, in the right hands, be used to great effect for trading - I've seen this particular pattern unfold for stocks hundreds of times. +1 Well said and so true. Title: Re: Chart analysis: 4 month chance for rally ahead !! Post by: grod on September 14, 2011, 02:49:28 PM Actually, there are very sound economic reasons for chart patterns being valid. I read a book a long time ago that went into just that. Fascinating stuff.
For example, let's say someone has a long position. A stock hits a high, then drops down. "Man, I should have sold. If it ever gets that high, I'll definitely sell!" Multiply by millions and you have a resistance level. Now, let's say a popular stock has a dip. "Man, I should have bought. If it ever gets that low again, I'll definitely buy!" Multiply by millions and there's your support. Charting is just a way to identify lifecycles of trends and trader (but more importantly, investor) mindset. Used properly it can let you be in a position when it is likely the position will continue yielding profits and out when it is less likely. It's a timing tool. That said, TA is mostly trailing indicators. There are very few predictive tools in the box, and the don't signal every time. When they do, it's highly likely you've got a good read on the market. Title: Re: Chart analysis: 4 month chance for rally ahead !! Post by: Minsc on September 14, 2011, 05:30:51 PM Wednesday is the day to rally. It will keep going up up up and up!
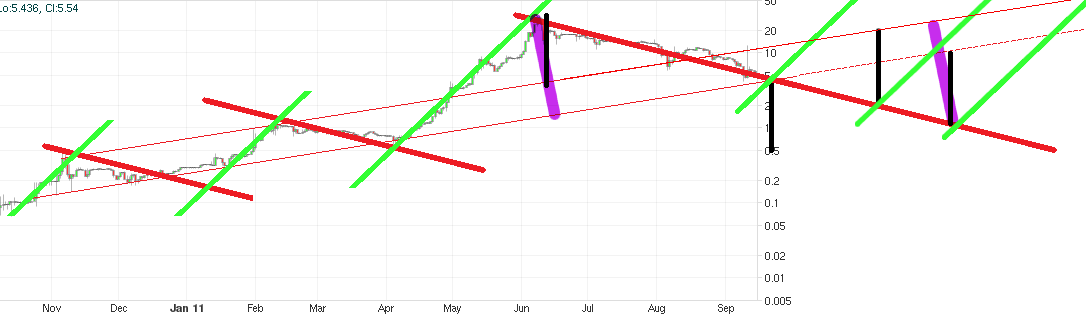
Title: Re: Chart analysis: 4 month chance for rally ahead !! Post by: Dargo on September 14, 2011, 06:48:11 PM Actually, there are very sound economic reasons for chart patterns being valid. I read a book a long time ago that went into just that. Fascinating stuff. For example, let's say someone has a long position. A stock hits a high, then drops down. "Man, I should have sold. If it ever gets that high, I'll definitely sell!" Multiply by millions and you have a resistance level. Now, let's say a popular stock has a dip. "Man, I should have bought. If it ever gets that low again, I'll definitely buy!" Multiply by millions and there's your support. Charting is just a way to identify lifecycles of trends and trader (but more importantly, investor) mindset. Used properly it can let you be in a position when it is likely the position will continue yielding profits and out when it is less likely. It's a timing tool. That said, TA is mostly trailing indicators. There are very few predictive tools in the box, and the don't signal every time. When they do, it's highly likely you've got a good read on the market. I agree with everything you're saying, but insofar as you're calling these "economic" reasons, I guess you must mean the economic position of individuals and their investment/trading positions (multiplied many times over)? I prefer to call this trading psychology rather than economics, but it's just a matter of semantics I guess. And either way, this needs to be distinguished from fundamentals (i.e. the "intrinsic" worth (whatever that means) or future popularity of bitcoin as a currency). Title: Re: Chart analysis: 4 month chance for rally ahead !! Post by: grod on September 14, 2011, 08:52:36 PM And either way, this needs to be distinguished from fundamentals (i.e. the "intrinsic" worth (whatever that means) or future popularity of bitcoin as a currency). Oh absolutely! "Fundamentals trump technicals" and "there are no billionaire chartists" are as true as "never catch a falling knife", "the trend is your friend" and my favorite, "bulls make money, bears make money, but hogs never make money." Trading driven exclusively by chart reading is precisely like driving by looking only in the rear view mirror. You can do it just fine so long as nothing jumps out in front of you. Look to the side every so often and you just might notice the moose headed your way. Title: Re: Chart analysis: 4 month chance for rally ahead !! Post by: Dargo on September 15, 2011, 12:59:26 AM And either way, this needs to be distinguished from fundamentals (i.e. the "intrinsic" worth (whatever that means) or future popularity of bitcoin as a currency). Oh absolutely! "Fundamentals trump technicals" and "there are no billionaire chartists" are as true as "never catch a falling knife", "the trend is your friend" and my favorite, "bulls make money, bears make money, but hogs never make money." Trading driven exclusively by chart reading is precisely like driving by looking only in the rear view mirror. You can do it just fine so long as nothing jumps out in front of you. Look to the side every so often and you just might notice the moose headed your way. A few of these slogans I don't entirely agree with: "Fundamentals trump technicals" - Depends on what you mean by "trump" I guess. Long term, price will have to catch up to fundamentals, but in the meantime price action can go astray, and you need technicals to analyze this. I think there is a slogan that goes something like, "fundamentals can tell you that a move is going to happen, but not when it is going to happen (and you need technicals to gauge the when). IMO, a "complete" investor/trader needs to understand both fundamentals and technical chart analysis. "there are no billionaire chartists" - maybe not, but there are lots of millionaire chartists, which is good enough for me. :) "never catch a falling knife" - Actually, I do this a lot with good success, but it takes a lot of experience to do it right, and you have to be very disciplined with stops in case you catch the knife too early. And often it is just for a short-term trade. Much harder to gauge long term bottoms. But basically, when panic capitulation type selling sets in, its time to start stalking an entry point. Title: Re: Chart analysis: 4 month chance for rally ahead !! Post by: netrin on September 15, 2011, 01:25:10 AM http://img823.imageshack.us/img823/9376/unbenannt1dm.png (http://imageshack.us/photo/my-images/823/unbenannt1dm.png/) http://img171.imageshack.us/img171/2246/unbenanntzv.png (http://imageshack.us/photo/my-images/171/unbenanntzv.png/) 矛盾 : spear shield : paradox : when an unstoppable force meets an immovable object You've got a one year rising support colliding with a 3 month falling support and resistance meeting in the neighborhood of $5 as you would have shown on a log chart. One has to break. Why do you choose one over the other? Title: Re: Chart analysis: 4 month chance for rally ahead !! Post by: ineededausername on September 15, 2011, 01:28:21 AM http://img823.imageshack.us/img823/9376/unbenannt1dm.png (http://imageshack.us/photo/my-images/823/unbenannt1dm.png/) http://img171.imageshack.us/img171/2246/unbenanntzv.png (http://imageshack.us/photo/my-images/171/unbenanntzv.png/) 矛盾 : spear shield : paradox : when an unstoppable force meets an immovable object You've got a one year rising support colliding with a 3 month falling support and resistance meeting in the neighborhood of $5 as you would have shown on a log chart. One has to break. Why do you choose one over the other? Maybe because the latter is a long-term trend, so it is stronger? Title: Re: Chart analysis: 4 month chance for rally ahead !! Post by: netrin on September 15, 2011, 01:47:32 AM $/BTC broke out of the long term trend April/May, hasn't returned to the long term trend until August and we are already one month later at the bottom of that channel. My bet is similar to the OP, but I wouldn't be surprised if we drop below the long term trend in proportion to the breakout that lead us to $32. For every crest there's a trough.
http://genaud.net/bitcoin/2011/20110912-2201.png Title: Re: Chart analysis: 4 month chance for rally ahead !! Post by: N12 on September 15, 2011, 02:39:41 AM My bet is similar to the OP, but I wouldn't be surprised if we drop below the long term trend in proportion to the breakout that lead us to $32. For every crest there's a trough. I have thought about the same thing ever since it became apparent to me that this correction is not a normal one.Heres a try. The result is pretty terrifying, as it shows a potential to ~0.5. https://i.imgur.com/nj1oi.png Thoughts? Title: Re: Chart analysis: 4 month chance for rally ahead !! Post by: coined on September 15, 2011, 03:04:20 AM My bet is similar to the OP, but I wouldn't be surprised if we drop below the long term trend in proportion to the breakout that lead us to $32. For every crest there's a trough. I have thought about the same thing ever since it became apparent to me that this correction is not a normal one.Heres a try. The result is pretty terrifying, as it shows a potential to ~0.5. https://i.imgur.com/nj1oi.png Thoughts? I think we are going to find out soon, since were right there ;D I would like to think bitcoin has attracted alot of attention during the run up to $30 and also during the decline, I think people have been waiting and watching the decline looking for the perfect time to get in. some people think because it stopped rallying it means there are no new speculative investors, but a smart investor wont buy in a bear market, he will wait. it was probably one of them that drove it to 7 just now. more importantly it's not like the blockchain got borked or anything, bitcoin itself is fine and the protocol is still 100% working as intended. and new things are always on the horizon, so I think there is enough interest in bitcoin that will stop it completely crashing long before 0.5 ;D you never know though, you really don't want a complete crash, even speaking as somebody who has sold and waiting to buy back, if it falls to low it may never recover. and trading is over. Title: Re: Chart analysis: 4 month chance for rally ahead !! Post by: caston on September 15, 2011, 03:06:42 AM My thoughts are that the downslide has taken much longer than the take off. This is a good sign because rising stocks always rise faster than they fall.
Title: Re: Chart analysis: 4 month chance for rally ahead !! Post by: coined on September 15, 2011, 03:25:28 AM My thoughts are that the downslide has taken much longer than the take off. This is a good sign because rising stocks always rise faster than they fall. there may be something in that also, I remember during the rise to 30 people were saying that a parabolic rise is followed by a similar decline, but it didn't happen that fast, it's a drawn out decline, that was one of the theory's of it not being a bubble and that another huge wave upwards is coming. I guess we'll see either way :P Title: Re: Chart analysis: 4 month chance for rally ahead !! Post by: netrin on September 15, 2011, 03:53:24 AM It's not going to drop to $0.5 tomorrow. In fact, I think it's just as likely that we've corrected sufficiently from the $32 high.
http://genaud.net/bitcoin/2011/20110915Blitzboom_nj1oi.png there may be something in that also, I remember during the rise to 30 people were saying that a parabolic rise is followed by a similar decline, but it didn't happen that fast, it's a drawn out decline, that was one of the theory's of it not being a bubble and that another huge wave upwards is coming. If you look at the bubble in relation to the trend (violet line perpendicular to thin red line) it is perfectly symmetrical. The take off from $8 is popularly credited to the Silky Gawker article. We've returned to the trend and $8 in August. Now, I believe, we're just continuing down with momentum. I don't know if you can feel it, but the grumpy mood has lifted from this forum. Or maybe Cosby coins were a good laugh. :) Title: Re: Chart analysis: 4 month chance for rally ahead !! Post by: Technomage on September 15, 2011, 11:03:35 AM To me the bubble has entirely deflated, a further downtrend from $4.xx would have nothing to do with a bubble anymore. That would be a decline to an economy size below the latest bubble. I can't see that happening right now though because the economy is still around 6-7 times larger than at the start of 2011, for example.
What I see right now is a possibly fairly long struggle between $4 and $6. The lower range is the buyers zone and the higher range is for sellers. Where it will go from here depends on if the economy keeps shrinking or not. To me the most likely scenario is that the degrowth levels off relatively soon, and the charts support this, and then a new bubble will start forming. This is the big challenge for Bitcoin. No longer can we count on miners coming in and getting interested in Bitcoin, because mining is pretty much as unprofitable as it has ever been. Mining was one of the things that got me originally interested in Bitcoin, but I wouldn't be a bull if I only got interested in that. Bitcoin is a revolutionary medium of exchange and that is where it must flourish next. I see a good number of services and tools being developed that could do just that, but time will tell. Title: Re: Chart analysis: 4 month chance for rally ahead !! Post by: netrin on September 15, 2011, 11:48:23 AM Teenage miners who can't keep their pants on for three months, but start ejaculating coins as soon as they see lowered prices, are not a healthy base for this economy. We might all go blind.
Title: Re: Chart analysis: 4 month chance for rally ahead !! Post by: zby on September 15, 2011, 12:28:50 PM To me the bubble has entirely deflated, a further downtrend from $4.xx would have nothing to do with a bubble anymore. That would be a decline to an economy size below the latest bubble. I can't see that happening right now though because the economy is still around 6-7 times larger than at the start of 2011, for example. What I see right now is a possibly fairly long struggle between $4 and $6. The lower range is the buyers zone and the higher range is for sellers. Where it will go from here depends on if the economy keeps shrinking or not. To me the most likely scenario is that the degrowth levels off relatively soon, and the charts support this, and then a new bubble will start forming. This is the big challenge for Bitcoin. No longer can we count on miners coming in and getting interested in Bitcoin, because mining is pretty much as unprofitable as it has ever been. Mining was one of the things that got me originally interested in Bitcoin, but I wouldn't be a bull if I only got interested in that. Bitcoin is a revolutionary medium of exchange and that is where it must flourish next. I see a good number of services and tools being developed that could do just that, but time will tell. How this is different from your previous predictions that did not hold? We all know that it cannot drop below 0, the trend has to stop somewhere - but why at 5 and not at 2 for example? Title: Re: Chart analysis: 4 month chance for rally ahead !! Post by: Technomage on September 15, 2011, 02:50:07 PM Teenage miners who can't keep their pants on for three months, but start ejaculating coins as soon as they see lowered prices, are not a healthy base for this economy. We might all go blind. This is so true. And the nature of the whole economy and the type of people owning BTC will be a little different from now on. Of course it is possible that a new bubble could make mining very profitable again for a while which can change the game again, but overall we're moving towards a healthier base as time goes on.Title: Re: Chart analysis: 4 month chance for rally ahead !! Post by: Technomage on September 15, 2011, 02:59:26 PM How this is different from your previous predictions that did not hold? We all know that it cannot drop below 0, the trend has to stop somewhere - but why at 5 and not at 2 for example? This is different because before I was mostly spewing numbers out that were not based on anything except my feelings. Those had nothing to do with real analysis. I don't have the tools to call any low's or something like that so I've stopped doing that, but the overall fundamentals are something I've looked into and I believe there is merit to them.The main basis for seeing the $4-$6 range as the critical point is the economy size, based on the number of daily transactions. As can be seen from this graph (http://pi.uk.com/bitcoin/charts/n-transactions), there is a fairly decent correlation between the price and number of transactions. I know correlation is not the same as causation, and I'm not claiming anything like that, but this is not only about the charts. The real Bitcoin economy has grown massively this year with much more actual trade happening for goods and services. Now there has been a decline which corresponds with the price decline of BTC/USD very well but the decline seems to be leveling off. Of course it's possible that it's only leveling off to drop more, after which my $4-$6 range would no longer apply. But that's the point where you need to forget the charts and look at what's happening in the Bitcoin world, I see a lot happening and enormous potential for more trade and thus more transactions and thus a higher price, so I feel the situation is still good long term. To summarize, simply compare the transaction count from when the price was at this level the last time, earlier this year. If that correlation continues to hold true we can't go much lower unless the economy suffers significant further degrowth. And it doesn't look like that right now. Title: Re: Chart analysis: 4 month chance for rally ahead !! Post by: Technomage on September 15, 2011, 03:01:42 PM I don't really see a strong trend either way, the market is figuring that out and it might take a while until a trend emerges.
Title: Re: Chart analysis: 4 month chance for rally ahead !! Post by: zby on September 15, 2011, 03:13:15 PM ... To summarize, simply compare the transaction count from when the price was at this level the last time, earlier this year. If that correlation continues to hold true we can't go much lower unless the economy suffers significant further degrowth. And it doesn't look like that right now. Title: Re: Chart analysis: 4 month chance for rally ahead !! Post by: Technomage on September 15, 2011, 03:28:00 PM How do you use that correlation to predict anything? The fact that now the transaction count is at such and such level and that this correlates with the current price does not tell you anything with future prices - or does it? Or do you say that the transaction count leads the price? I don't see that from that chart alone - but if you show me I might change my opinion on this. Currently I think that all those transactions are just people speculating on bitcoins, in July with those high prices there was just lots of speculation going on now it is slowly dieing off. Well, you can sort of predict and sort of can't. The prediction comes simply from looking at how the graph of the declining transaction count curves down and it looks like it's leveling off. That's it. It could also be going down again after that, but that's the point where you simply have to look at what's going on in the real Bitcoin-world and stop looking at charts.My main point was that the current price range seems to correlate with the size of the economy, that's it. Predicting how the economy will grow based on that chart is not possible I think, it simply looks like it's leveling off. And you're right that most of the transactions are people speculating on Bitcoins. I don't disagree. But I think it's stupid to assume that the amount of real trade for good and services hasn't also shot up significantly, and now that has come down as well. This could be verified by merchants if we get their view. Another important indicator is Google trends, which I think will correlate especially well with how much trade the merchants are experiencing. Here is a 12 month chart: (http://www.google.com/trends?q=bitcoin&ctab=0&geo=all&date=ytd&sort=0), there is no sign of a new uptrend or anything like that and I've already said I'm not calling a trend, but the decline of google trends has leveled off almost completely. And now it's at levels high enough to sustain the current price if the correlation continues to be true. So, to summarize again, the price is not going to suddenly drop significantly and stay there. The fundamental economy size and the interest people have in Bitcoin will guarantee a certain bottom price range for now. As for the future goes, I'm not calling anything, simply saying that what's happening in the Bitcoin world looks very promising to me. Title: Re: Chart analysis: 4 month chance for rally ahead !! Post by: netrin on September 15, 2011, 03:37:28 PM We all know that it cannot drop below 0, the trend has to stop somewhere - but why at 5 and not at 2 for example? I hope you don't mean in the next 24 hours. Sure anything can happen within the month, and perhaps the week, but we've never seen more than 50% drops in any single day this year. Since June 8th we've average less than 2% (https://bitcointalk.org/index.php?topic=44193) decline each day. A drop to $2 from $5 within a month would be quite extraordinary. Aside from negative momentum, I think most indicators, fundamental and technical, say up. Title: Re: Chart analysis: 4 month chance for rally ahead !! Post by: Dargo on September 15, 2011, 03:47:47 PM My thoughts are that the downslide has taken much longer than the take off. This is a good sign because rising stocks always rise faster than they fall. Always? No, pullbacks in stocks often happen much more quickly than upward moves. I'd like to think that the slow fall in BTC prices is a good thing, but I'm skeptical. A slow fall is indicative of relatively calm and orderly selling, and this isn't a good thing for longs. We had some panic selling on the recent move to $4.18, and a nice bounce from there, but now it's starting to look like we might test that low in the near future. It's too early to tell, but I'm starting to think we haven't seen a long term bottom yet. Title: Re: Chart analysis: 4 month chance for rally ahead !! Post by: netrin on September 15, 2011, 03:59:38 PM In my own case, I failed to sell long after the $32 high because I loved the asset. It took me a long time to get over infidelity and ride the waves. Most people are not in it for the appreciation, which is good, and reflected in fast highs and slow price declines.
Title: Re: Chart analysis: 4 month chance for rally ahead !! Post by: critmass on September 16, 2011, 06:12:04 AM you simply have to look at what's going on in the real Bitcoin-world and stop looking at charts. Title: Re: Chart analysis: 4 month chance for rally ahead !! Post by: S3052 on September 16, 2011, 06:57:52 AM Some people fare well not using charts, and some fare well using charts. Both options are very valid.
We have been using charts successfully for bitcoin since September 2010, just like any other financial market (for more than a decade). Title: Re: Chart analysis: 4 month chance for rally ahead !! Post by: Cluster2k on September 16, 2011, 08:42:25 AM Some people fare well not using charts, and some fare well using charts. Both options are very valid. We have been using charts successfully for bitcoin since September 2010, just like any other financial market (for more than a decade). Just out of interest, your profile pic depicts the $30 bitcoin bubble earlier this year. Any chance of upgrading it to show the subsequent price activity? ;) Title: Re: Chart analysis: 4 month chance for rally ahead !! Post by: S3052 on September 16, 2011, 11:38:48 AM Some people fare well not using charts, and some fare well using charts. Both options are very valid. We have been using charts successfully for bitcoin since September 2010, just like any other financial market (for more than a decade). Just out of interest, your profile pic depicts the $30 bitcoin bubble earlier this year. Any chance of upgrading it to show the subsequent price activity? ;) Your guess is wrong. The chart is from mid February 2011 when prices traded at the high at 1.1 $ ;) Title: Re: Chart analysis: 4 month chance for rally ahead !! Post by: critmass on September 16, 2011, 03:12:29 PM Some people fare well not using charts, and some fare well using charts. Both options are very valid. We have been using charts successfully for bitcoin since September 2010, just like any other financial market (for more than a decade). Just out of interest, your profile pic depicts the $30 bitcoin bubble earlier this year. Any chance of upgrading it to show the subsequent price activity? ;) Your guess is wrong. The chart is from mid February 2011 when prices traded at the high at 1.1 $ ;) +1 for you! ^_^ Title: Re: Chart analysis: 4 month chance for rally ahead !! Post by: Spekulatius on September 16, 2011, 10:59:05 PM http://img9.imageshack.us/img9/4648/unbenanntida.png (http://imageshack.us/photo/my-images/9/unbenanntida.png/)
Hi B-Boys and B-Girls! The "extra heavy" support around 6.00 $ seems to be broken as we head further down along the upper resistance. Looking back the upper resistance remained stronger, although the support came up a way much longer that didnt mean it was the stronger one, once again the more often confirmed trend line got the upper hand. As we head down buy-pressure will build up, but no real resistance is in sight so far, except maybe by the one netrin spotted around 4.50$, thanks for that! :D http://img710.imageshack.us/img710/8444/201109122201.png (http://imageshack.us/photo/my-images/710/201109122201.png/) On average the determining resistance that quelled all daily closing prices of the last 4 month lowered 0.24$ each day, putting the break point for today, the 16th of Sept. 2011 at 5.60$. For the following days (closing prices) it will be around the following: 17.09.11: ~5.36$ 18.09.11: ~5.12$ 19.09.11: ~4.88$ 20.09.11: ~4.64$ 21.09.11: ~4.40$ 22.09.11: ~4.16$ ... I cannot predict where or when it will break through, but am certain, that this line will be the hurdle to take before a new really can start. Better watch closely! Title: Re: Chart analysis: 4 month chance for rally ahead !! Post by: netrin on September 17, 2011, 01:46:17 AM http://bitcoincharts.com/charts/chart.png?s=2011-1-1&e=2011-10-1&m=mtgoxUSD&i=Daily&c=1&l=1&t=W&noheader=1&height=50&width=720http://bitcoincharts.com/charts/chart.png?s=2011-1-1&e=2011-10-1&m=mtgoxUSD&i=Daily&c=1&l=0&t=W&noheader=1&height=50&width=720
M-Men and W-Women use log charts! You're looking at a drop from $32 to $4 and I suppose you expect $0 by high tea? Title: Re: Chart analysis: 4 month chance for rally ahead !! Post by: Spekulatius on September 17, 2011, 03:18:01 PM Id like to point out that my calculations dont refer to the closing prices of the mentioned days, but to the price levels the upper resistance is going to be on those days while it extends further. Those levels need to be broken in order to rally.
I furthermore dont belive a price drop to 0,- is plausible as buying-pressure builds up the lower she goes. keep it up Money Boy! Title: Re: Chart analysis: 4 month chance for rally ahead !! Post by: netrin on September 17, 2011, 03:36:34 PM I furthermore dont belive a price drop to 0,- is plausible as buying-pressure builds up the lower she goes. While this may be true, a much more obvious explanation is that declines are geometric, not arithmetic as you've too simply implied. A drop from $30 to $10 is just as dramatic as from $3 to $1. Title: Re: Chart analysis: 4 month chance for rally ahead !! Post by: Spekulatius on September 17, 2011, 03:51:38 PM I furthermore dont belive a price drop to 0,- is plausible as buying-pressure builds up the lower she goes. While this may be true, a much more obvious explanation is that declines are geometric, not arithmetic as you've too simply implied. A drop from $30 to $10 is just as dramatic as from $3 to $1. shure thing :D P.S.: Are u actually from Greenland? - If yes: Whats the snow taste like atm (not the yellow one, well.. why not) and - do you guys really have 20+ words for snow (always wondered)? Title: Re: Chart analysis: 4 month chance for rally ahead !! Post by: netrin on September 17, 2011, 04:29:30 PM Ah, a sensible departure from this thread. I am sitting overlooking gentle rainfall over the capital of Greenland while it snows above 700m. There is one word for snow 'aput', but like most Inuit languages, Greenlandic (Kalaallisut) is polysynthetic, which means we append a huge string of suffixes and modifications. I'm told Turkish and to a lesser extent Japanese do this, but nothing like the languages of the north. For example, 95% of all words in the Greenlandic bible are unique. There certainly are not dozens of words for shepherds and sheep in the arctic.
aput - snow apivoq - it snows aputsiaq - big snow aputivut - our many snows aputiga - my snow aputaajaaneq - snow (in general, singular) aqilluppoq - soft snow (as in Spring) aperlaaq - newly fallen snow apuserivoq - to play in snow apusineq - snow drifts apussarippoq - a thick layer of snow, there appuppaa - snow covering (or like he is blocked by snow) apusiutit - snow shoe qanik - snowflake aagussaq - a thing that appears after the snow has melted Nanook - Big spirit of snow bear http://www.youtube.com/watch?v=wi0e-kEWqBQ (0:59 - 1:05 he sings something about appreciating our great snow; lovely scenery and song, made for tourism) Title: Re: Chart analysis: 4 month chance for rally ahead !! Post by: kjj on September 17, 2011, 05:57:17 PM Ah, a sensible departure from this thread. I am sitting overlooking gentle rainfall over the capital of Greenland while it snows above 700m. There is one word for snow 'aput', but like most Inuit languages, Greenlandic (Kalaallisut) is polysynthetic, which means we append a huge string of suffixes and modifications. I'm told Turkish and to a lesser extent Japanese do this, but nothing like the languages of the north. For example, 95% of all words in the Greenlandic bible are unique. There certainly are not dozens of words for shepherds and sheep in the arctic. Real agglutinative languages aren't very common any more. It seems that many thousands of years ago, virtually everyone decided they wanted the vast majority of their adjectives as distinct words. Arctic languages are pretty cool in that we can usually trace the main lines of their divergence from other known languages, but they've usually retained structures from way, way back; structures that were already seriously on the decline when the Sumerians invented writing. The "X words for Y" meme makes frequent appearances on Language Log (http://languagelog.ldc.upenn.edu/nll/). Here (http://itre.cis.upenn.edu/~myl/languagelog/archives/000405.html) is a good one from way back. Title: Re: Chart analysis: 4 month chance for rally ahead !! Post by: netrin on September 17, 2011, 06:57:04 PM Excellent. I think you've provided the best analysis (http://itre.cis.upenn.edu/~myl/languagelog/archives/000405.html) to come out of this thread! :)
Yeah the word building is as cool as it is tedious. For example oqaasilerifik (words, many, kept, a place) is a dictionary or a collection of books, it's also the name of the language ministry, and when they wanted to make a database of words, they called it oqaaserpassualeriffik which is something like the new place that contains lots and lots of words. It can be funny too. The second largest municipality in the world is named Sermersooq, which means something like the great big ice cap (magnificent mass of ice). The new municipal intranet is called Sermeeraq, the smaller mass of ice. Title: Re: Chart analysis: 4 month chance for rally ahead !! Post by: Grinder on September 17, 2011, 08:29:07 PM There is one word for snow 'aput', but like most Inuit languages, Greenlandic (Kalaallisut) is polysynthetic, which means we append a huge string of suffixes and modifications. I guess it depends a lot on the size of the population. In Norway there are hundreds of snow and ice related words, although a lot of them are only used by some dialects. There's a list of most of them here, but unfortunately most of them aren't translated into English: http://folk.ntnu.no/ivarse/snjoord.htmlTitle: Re: Chart analysis: 4 month chance for rally ahead !! Post by: general.crackdown on September 19, 2011, 01:14:38 PM Wow if I gave you a chart of last months wind speed could you predict the weather for next month using this technique?
Title: Re: Chart analysis: 4 month chance for rally ahead !! Post by: NamelessOne on September 19, 2011, 02:26:59 PM Wow if I gave you a chart of last months wind speed could you predict the weather for next month using this technique? Technical analysis has been working for me, and I've only been aware of the concept for 4 months. Title: Re: Chart analysis: 4 month chance for rally ahead !! Post by: Lolcust on September 19, 2011, 02:47:34 PM Wow if I gave you a chart of last months wind speed could you predict the weather for next month using this technique? One has to wonder if inadequate analogies could be sold and bought in a market of some sorts. Title: Re: Chart analysis: 4 month chance for rally ahead !! Post by: netrin on September 19, 2011, 02:58:50 PM INVALID BBCODE: close of unopened tag in table (1)
|