|
Title: Goomboo's EMA10/21 Crossover Versus the rebuilder's Flipist Method Post by: stochastic on January 28, 2012, 05:25:00 AM Using modified code from here (http://blog.fosstrading.com/2009/04/testing-rsi2-with-r.html) and here (http://blog.fosstrading.com/2011/03/how-to-backtest-strategy-in-r.html). I ran some backtesting in R (http://www.r-project.org/) to compare the EMA 5 EMA 21 Crossover (https://bitcointalk.org/index.php?topic=60501.0) and a random buy/sell strategy based on a coin flip (https://bitcointalk.org/index.php?topic=56918.0).
Why did I do this? I was making my own trading strategies but got stuck on making one for bullish/bearish divergence and I thought some practice may help me find out what I am doing wrong. The EMA 10 / 21 Crossover Strategy is: 1. Buy when EMA 10 crosses over EMA 21. So EMA 10 > EMA 21, BUY 2. Sell when EMA 10 crosses below EMA 21. So EMA 10 < EMA 21, SELL The Flipist Strategy is: 1. Buy when there is heads 2. Sell when there is tails. Trading dates will be between July 23, 2011 to Jan 22, 2012. A total of 184 days. Money management will be all in and all out. Trades will be done according to the daily close. Title: Re: Goomboo's EMA10/21 Crossover Versus the rebuilder's Flipist Method Post by: stochastic on January 28, 2012, 05:26:42 AM Methods
Data aquisition Data was acquired from bitcoincharts.com (http://bitcoincharts.com). The entire data file was downloaded from the Bitcoincharts API ( http://bitcoincharts.com/t/trades.csv?symbol=bcmPPUSD&start=0 ~45mb) The data was then converted from tick data to Open/High/Low/Close/Adjusted/Volume format. The code (https://bitcointalk.org/index.php?action=profile;u=46282;sa=showPosts;start=40) for this conversion is: Code: #install.packages("xts") #install the xts package if you don't already have it. Available on CRANTitle: Re: Goomboo's EMA10/21 Crossover Versus the rebuilder's Flipist Method Post by: stochastic on January 28, 2012, 05:29:42 AM Flipist Strategy Methods/code
This code will input the data, create the indicators, and then create the signals. From the daily return and the buy or sell signals, equity curves are calculated. Last charts are produced to show the performance and draw-down. Code: # Load data Title: Re: Goomboo's EMA10/21 Crossover Versus the rebuilder's Flipist Method Post by: stochastic on January 28, 2012, 05:32:18 AM EMA5 / EMA21 Crossover Strategy
This code will also input the data, create the indicators, and then create the signals. From the daily return and the buy or sell signals, equity curves are calculated. Last charts are produced to show the performance and draw-down. Since the EMA21 requires the past 21 days of history before trading can start, the data file used for this contains the last 205 days but trading cannot start until July 23, 2011. Code: # install.packages(c("quantmod","TTR"))Title: Re: Goomboo's EMA10/21 Crossover Versus the rebuilder's Flipist Method Post by: adamstgBit on January 28, 2012, 05:33:40 AM Build and run! :D
Title: Re: Goomboo's EMA10/21 Crossover Versus the rebuilder's Flipist Method Post by: bb113 on January 28, 2012, 05:47:13 AM Awesome.
Title: Re: Goomboo's EMA10/21 Crossover Versus the rebuilder's Flipist Method Post by: organofcorti on January 28, 2012, 05:59:26 AM Using modified code from here (http://blog.fosstrading.com/2009/04/testing-rsi2-with-r.html) and here (http://blog.fosstrading.com/2011/03/how-to-backtest-strategy-in-r.html). I ran some backtesting in R (http://www.r-project.org/) to compare the EMA 5 EMA 21 Crossover (https://bitcointalk.org/index.php?topic=60501.0) and a random buy/sell strategy based on a coin flip (https://bitcointalk.org/index.php?topic=56918.0). Why did I do this? I was making my own trading strategies but got stuck on making one for bullish/bearish divergence and I thought some practice may help me find out what I am doing wrong. Why not generate your own? The R package rgp lets you evolve GAs. I've got some that consistently give me better than 'buy and hold'. Title: Re: Goomboo's EMA10/21 Crossover Versus the rebuilder's Flipist Method Post by: stochastic on January 28, 2012, 06:00:19 AM Flipist Results
**EDIT** Added this results table: Code:
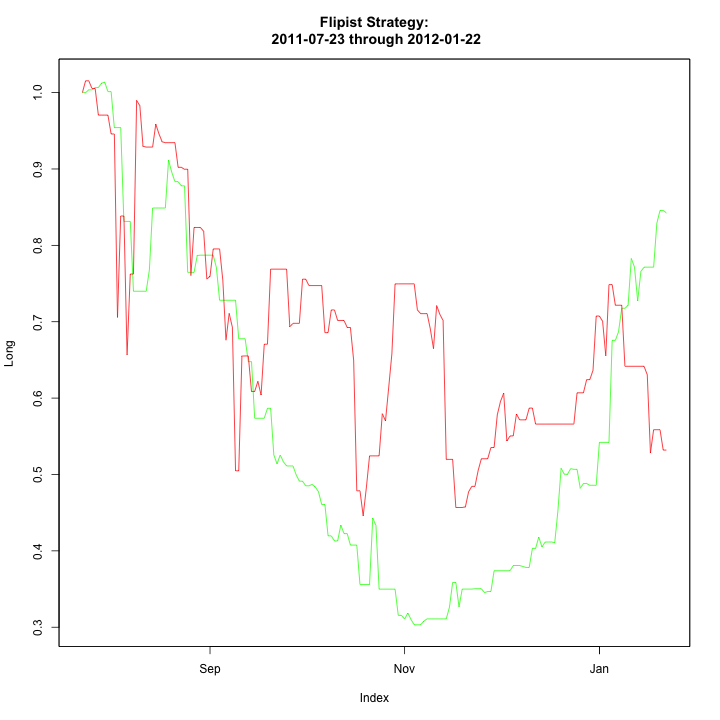
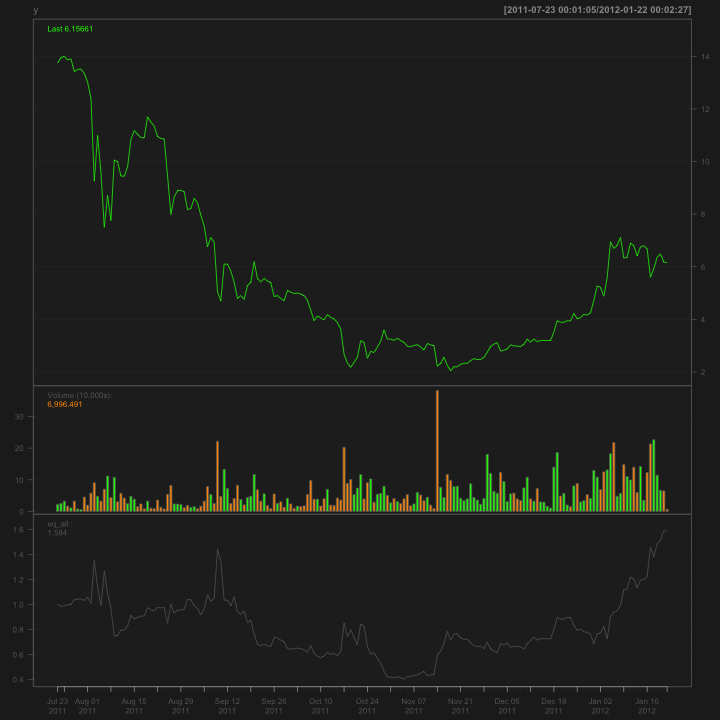
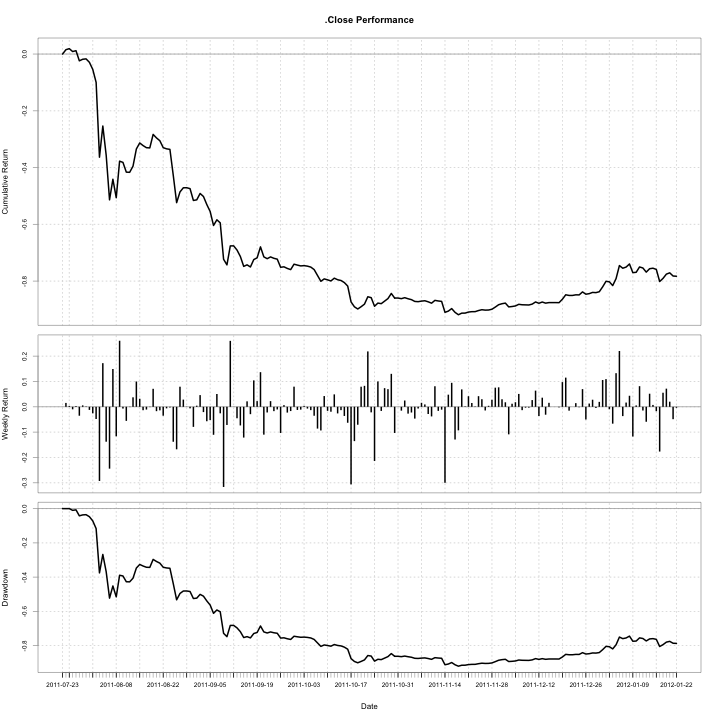
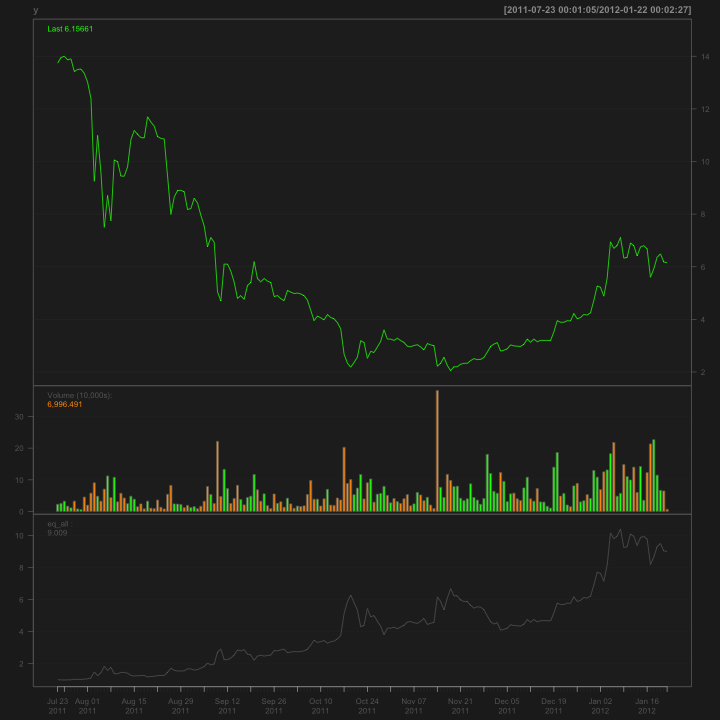
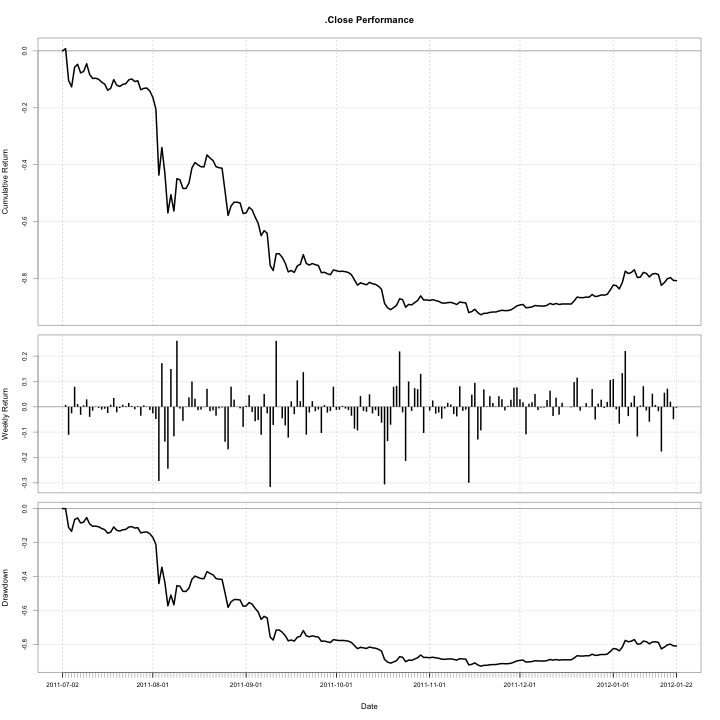
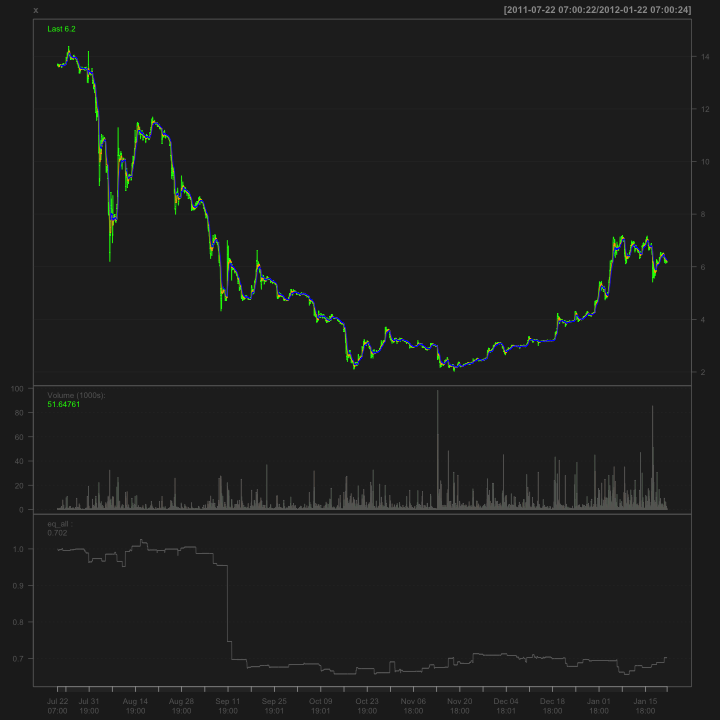
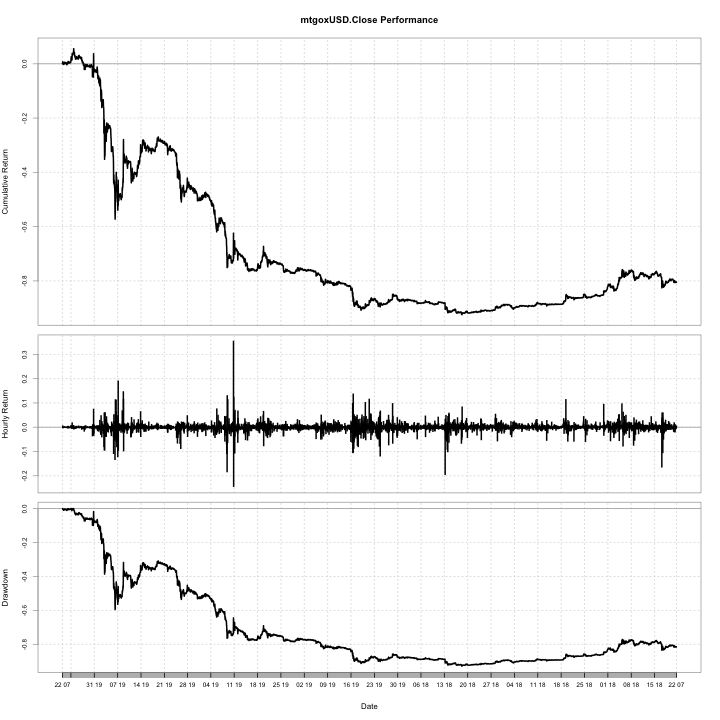
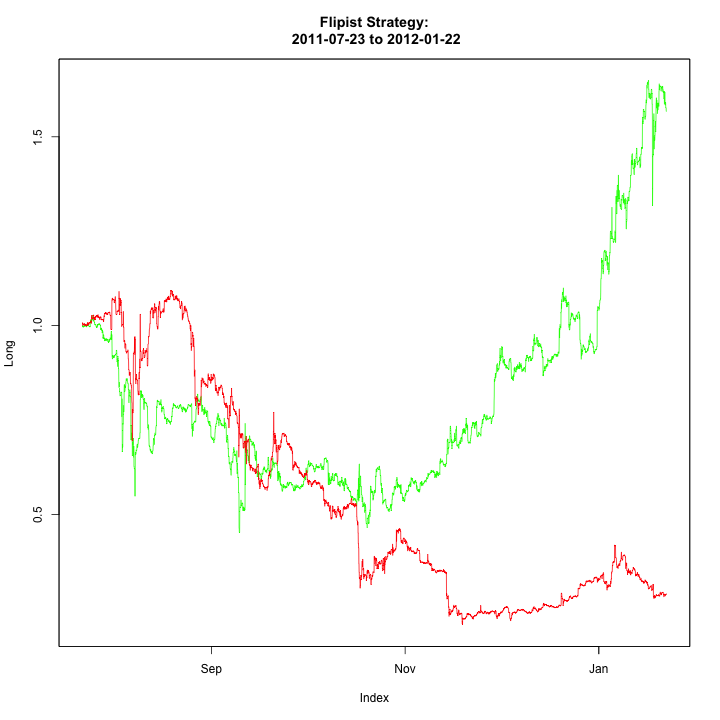
The first graph is the equity change based on the long (green) and short (red) positions. http://i1248.photobucket.com/albums/hh492/dropoutbox/flipist.png Main graph. This graph shows the exchange rate at Mtgox at the close of each day, along with the volume and the short and long positions. http://i1248.photobucket.com/albums/hh492/dropoutbox/flipistchart.png Finally, we see a chart giving the cumulative return. http://i1248.photobucket.com/albums/hh492/dropoutbox/performance-flipist.png Title: Re: Goomboo's EMA10/21 Crossover Versus the rebuilder's Flipist Method Post by: stochastic on January 28, 2012, 06:03:26 AM Using modified code from here (http://blog.fosstrading.com/2009/04/testing-rsi2-with-r.html) and here (http://blog.fosstrading.com/2011/03/how-to-backtest-strategy-in-r.html). I ran some backtesting in R (http://www.r-project.org/) to compare the EMA 5 EMA 21 Crossover (https://bitcointalk.org/index.php?topic=60501.0) and a random buy/sell strategy based on a coin flip (https://bitcointalk.org/index.php?topic=56918.0). Why did I do this? I was making my own trading strategies but got stuck on making one for bullish/bearish divergence and I thought some practice may help me find out what I am doing wrong. Why not generate your own? The R package rgp lets you evolve GAs. I've got some that consistently give me better than 'buy and hold'. I just used a simple strategy as that is what these two strategies were doing. Blotter along with quantstrat allows for better trading strategies. I have not heard of the rgp. I will check it out. This was all done with the TTR and quantmod packages. Title: Re: Goomboo's EMA10/21 Crossover Versus the rebuilder's Flipist Method Post by: stochastic on January 28, 2012, 06:06:31 AM Now for the EMA10-EMA21 crossover.
***EDIT*** Added the results table Code:
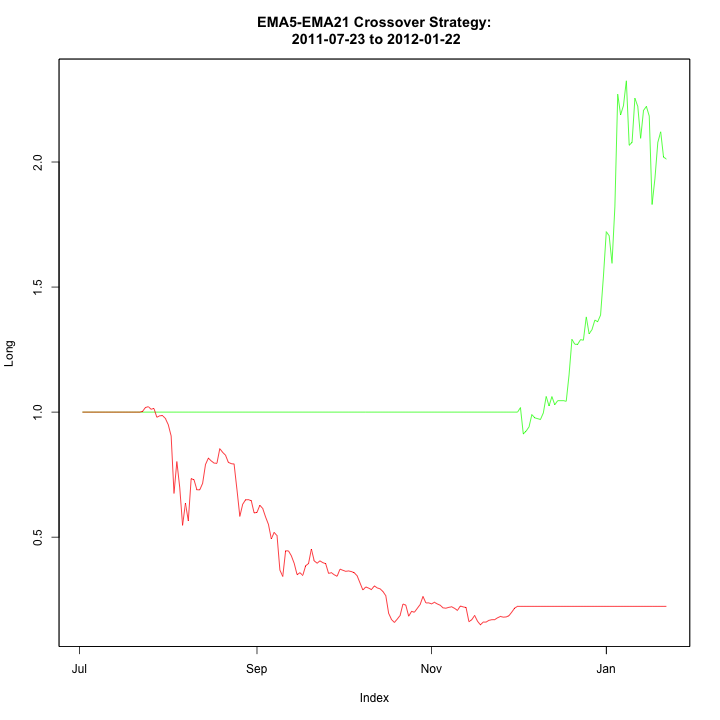
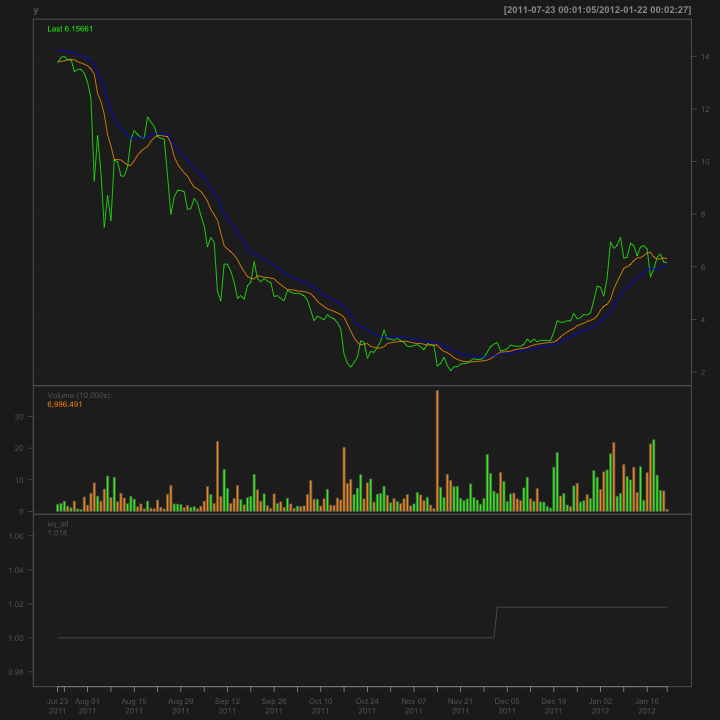
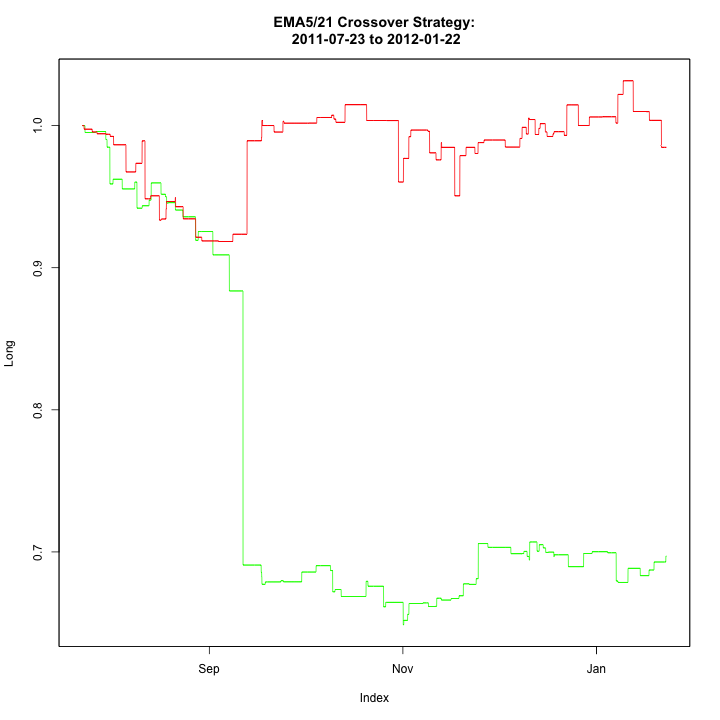
****EDIT**** The following graphs title should say EMA10/21, not EMA5/12 http://i1248.photobucket.com/albums/hh492/dropoutbox/EMAcross.png http://i1248.photobucket.com/albums/hh492/dropoutbox/EMAcrosschart.png http://i1248.photobucket.com/albums/hh492/dropoutbox/performance-EMAcross.png Title: Re: Goomboo's EMA10/21 Crossover Versus the rebuilder's Flipist Method Post by: organofcorti on January 28, 2012, 06:14:42 AM The EMA 10 / 21 Crossover Strategy is: 1. Buy when EMA 10 crosses over EMA 21. So EMA 10 > EMA 21, BUY 2. Sell when EMA 10 crosses below EMA 21. So EMA 10 < EMA 21, SELL I think most systems based on SMA and EMA crossovers (eg GMMA) give 'buy' or 'sell' signal at the actual point of crossover - ie when (in this case) EMA10==EMA21. The rest of the time they indicate a hold. You shouldn't be changing positions that often. Edit: Nice chartage though. What package are you using for the bottom one? Title: Re: Goomboo's EMA10/21 Crossover Versus the rebuilder's Flipist Method Post by: stochastic on January 28, 2012, 06:18:08 AM So what do others think of these graphs?
If I am reading the graphs right. The flipist method quickly starts out badly, losing equity in both the short and long trades. It never recovers its equity back. In the EMA10/21 crossover strategy. It starts with no change in equity, but it starts to lose money because it is bad at predicting when to sell. Its long predictions seem pretty good but even the flipist method recovered pretty well in the December bull market. I would predict anyone that bought during that time did well. If you look at the cumulative return. The flipist method actually did slightly better. Flipist -0.78 versus EMA10/21 -0.80. Of course this is assuming I did this correctly. Comments? Questions? Screams of fury? Title: Re: Goomboo's EMA10/21 Crossover Versus the rebuilder's Flipist Method Post by: stochastic on January 28, 2012, 06:25:30 AM The EMA 10 / 21 Crossover Strategy is: 1. Buy when EMA 10 crosses over EMA 21. So EMA 10 > EMA 21, BUY 2. Sell when EMA 10 crosses below EMA 21. So EMA 10 < EMA 21, SELL I think most systems based on SMA and EMA crossovers (eg GMMA) give 'buy' or 'sell' signal at the actual point of crossover - ie when (in this case) EMA10==EMA21. The rest of the time they indicate a hold. You shouldn't be changing positions that often. That is true. I will update the code. There is a way to see how many trades was done but I can't remember right now. I will search for that. Title: Re: Goomboo's EMA10/21 Crossover Versus the rebuilder's Flipist Method Post by: bb113 on January 28, 2012, 06:26:57 AM You need emotional investor and EMA10/21 contrarian controls. I'm not sure how to implement the emotional investor one...
Title: Re: Goomboo's EMA10/21 Crossover Versus the rebuilder's Flipist Method Post by: stochastic on January 28, 2012, 06:34:59 AM The EMA 10 / 21 Crossover Strategy is: 1. Buy when EMA 10 crosses over EMA 21. So EMA 10 > EMA 21, BUY 2. Sell when EMA 10 crosses below EMA 21. So EMA 10 < EMA 21, SELL I think most systems based on SMA and EMA crossovers (eg GMMA) give 'buy' or 'sell' signal at the actual point of crossover - ie when (in this case) EMA10==EMA21. The rest of the time they indicate a hold. You shouldn't be changing positions that often. Edit: Nice chartage though. What package are you using for the bottom one? The bottom chart comes from PerformanceAnalytics, the middle is from quantmod, and the first is from from the zoo package. I will try this for the signals. Code: sigbuy = ifelse ((ema10 >= ema 21) & (ema10.old < ema21.old), 1, 0) #buy signal. yesterday's EMA10 was below yesterday's EMA21 and today it crossed over Title: Re: Goomboo's EMA10/21 Crossover Versus the rebuilder's Flipist Method Post by: stochastic on January 28, 2012, 07:02:23 AM I was going to modify the buy sell signals of the EMA10/EMA21 crossover strategy to:
Code: sigbuy = ifelse ((x$ema10 > x$ema21) & (x$ema10.old < x$ema21.old), 1, 0) #buy signal. yesterday's EMA10 was below yesterday's EMA21 and today it crossed over Which means, if yesterday's EMA10 is below yesterday's EMA21 AND EMA10 is greater than or equal to EMA21 today then buy Also, if yesterday's EMA10 is above yesterday's EMA21 AND EMA10 is less than or equal to EMA21 today then sell But when I run the data there is only 1 trade at the beginning of December. So what to do? I can change the data to hourly. http://i1248.photobucket.com/albums/hh492/dropoutbox/EMAcrosschart-new.png Title: Re: Goomboo's EMA10/21 Crossover Versus the rebuilder's Flipist Method Post by: mav on January 28, 2012, 07:32:33 AM ... when I run the data there is only 1 trade at the beginning of December. So what to do? I can change the data to hourly. interesting 'predicament' but I guess there's no arguing with the notion of 'don't buy' during that big fall, and 'do buy' when confidence came back... I guess we're all action junkies at heart huh? I find it very interesting that no matter the strategy, essentially you end up following the general market trend no matter what. Of course there are some differences between strategies, so the end result is 'one strategy is relatively better than the other', although when both loose it really reflects the market more than the strategy I reckon. Also it's interesting that this only works for 'trivial' amounts, as anything more than that would have affected the market and the historical data becomes moot. Great analysis, it's nice to see a bit of coding to pass the time. edit: do you suppose if you ran the flippest method many times and averaged the result at each point in time, you'd end up with a 'returns' chart that was pretty-much the same as the market price? Title: Re: Goomboo's EMA10/21 Crossover Versus the rebuilder's Flipist Method Post by: stochastic on January 28, 2012, 07:44:19 AM To convert the data to hourly is pretty easy. There is some function in one of the quantitative financial packages in R. But I forget which one. But that one function I had before can do the same thing with only a slight modification.
Code:
The original data is taken from bitcoincharts and then put through this function. The output is hourly data. I also modified the code so that only crossovers indicate buy and sell signals. Here is the new code for the EMA10/EMA21 crossover. ***EDIT*** Named the graph wrong. Code: library(quantmod) Title: Re: Goomboo's EMA10/21 Crossover Versus the rebuilder's Flipist Method Post by: stochastic on January 28, 2012, 07:50:07 AM ... when I run the data there is only 1 trade at the beginning of December. So what to do? I can change the data to hourly. do you suppose if you ran the flippest method many times and averaged the result at each point in time, you'd end up with a 'returns' chart that was pretty-much the same as the market price? I would expect in a trending market the ratio would be about breaking even, but I never looked before so I can only guess. Title: Re: Goomboo's EMA10/21 Crossover Versus the rebuilder's Flipist Method Post by: stochastic on January 28, 2012, 08:09:14 AM Here is the EMA10/21 crossover using hourly data instead of daily. This is still all buy or all sell.
I also found how to get the number of trades. Code: # This function gives us some standard summary Code: Signal # Trades % Win Mean Win Mean Loss Median Win Median Loss Mean W/L Median W/L Here are the graphs. The equity curve graph with long (green) and short (red). ***EDIT*** This graph's title should say EMA10/21, not EMA5/21 http://i1248.photobucket.com/albums/hh492/dropoutbox/emacrossnew-update.png I tried to plot the EMA10 and 21 on here but the time span is so large it is hard to see. http://i1248.photobucket.com/albums/hh492/dropoutbox/EMAcrosschart-new-1.png Here is the cumulative return along with hourly return and draw-down. Surprisingly or not it is the same as the other daily data set. http://i1248.photobucket.com/albums/hh492/dropoutbox/performance-EMAcrossnew.png Title: Re: Goomboo's EMA10/21 Crossover Versus the rebuilder's Flipist Method Post by: stochastic on January 28, 2012, 08:24:03 AM Now for the Flipist strategy. This is the same strategy as before but now we can flip every hour if needed.
First the code. I added in everything to this code, from making the signals, making the charts, and outputting the statistics. Code: ############################################ Title: Re: Goomboo's EMA10/21 Crossover Versus the rebuilder's Flipist Method Post by: stochastic on January 28, 2012, 08:35:20 AM As expected with a random method with a greater sample size (number of trades) it is almost even between buy and sell signal.
Code:
http://i1248.photobucket.com/albums/hh492/dropoutbox/flipist-new.png http://i1248.photobucket.com/albums/hh492/dropoutbox/flipistchart-1.png http://i1248.photobucket.com/albums/hh492/dropoutbox/performance.png Title: Re: Goomboo's EMA10/21 Crossover Versus the rebuilder's Flipist Method Post by: stochastic on January 28, 2012, 08:41:33 AM You need emotional investor and EMA10/21 contrarian controls. I'm not sure how to implement the emotional investor one... How would you do the controls then? Title: Re: Goomboo's EMA10/21 Crossover Versus the rebuilder's Flipist Method Post by: stochastic on January 28, 2012, 09:16:23 AM ***EDIT*** Calculated Expectancy
Quote Expectancy = (Probability of Win * Average Win) (Probability of Loss * Average Loss) Flipist Daily Flip Code: (1) buy / (-1) sell Flipist - Hourly Flip Code: (1) buy / (-1) sell Expectancy = -4.0892 EMA10/21 Crossover using Daily data. There are 18 less trades when looking at the Code: EMA10/21, buy (1) when EMA10 > EMA21, sell (-1) when EMA10 < EMA21 EMA10/21 Crossover using Hourly data. Code: EMA10/21 Buy (1) when EMA10 crosses over EMA21, sell (-1) when EMA10 crosses below EMA21 Expectancy = -45.00281 Title: Re: Goomboo's EMA10/21 Crossover Versus the rebuilder's Flipist Method Post by: stochastic on January 28, 2012, 09:41:07 AM Using modified code from here (http://blog.fosstrading.com/2009/04/testing-rsi2-with-r.html) and here (http://blog.fosstrading.com/2011/03/how-to-backtest-strategy-in-r.html). I ran some backtesting in R (http://www.r-project.org/) to compare the EMA 5 EMA 21 Crossover (https://bitcointalk.org/index.php?topic=60501.0) and a random buy/sell strategy based on a coin flip (https://bitcointalk.org/index.php?topic=56918.0). Why did I do this? I was making my own trading strategies but got stuck on making one for bullish/bearish divergence and I thought some practice may help me find out what I am doing wrong. Why not generate your own? The R package rgp lets you evolve GAs. I've got some that consistently give me better than 'buy and hold'. Quote In artificial intelligence, genetic programming (GP) is an evolutionary algorithm-based methodology inspired by biological evolution to find computer programs that perform a user-defined task. It is a specialization of genetic algorithms (GA) where each individual is a computer program. It is a machine learning technique used to optimize a population of computer programs according to a fitness landscape determined by a program's ability to perform a given computational task. Wow, thanks for the recommendation. I am an evolutionary biologist (or trying to be) and this makes a lot of sense. How have you applied GP to trading strategies? Title: Re: Goomboo's EMA10/21 Crossover Versus the rebuilder's Flipist Method Post by: miscreanity on January 28, 2012, 10:08:11 AM Very nice work.
Also try expanding the time frame to daily & weekly scales. Title: Re: Goomboo's EMA10/21 Crossover Versus the rebuilder's Flipist Method Post by: organofcorti on January 28, 2012, 10:22:31 AM Sure - although tbh I've only been using rgp for a couple of weeks, before that I was using eureqa but I didn't find it flexible enough (it's really just for symbolic regression).
rgp is well documented but if you don't have a lot of experience with GAs (i don't) then the tutorials at rsymbolic.org are a bit incomplete. Still, I have plenty of algorithms generated. Some overfit and just buy below a certain level and sell above it. It all comes down to your fitness function and i think mine leaves a bit to be desired. Some of the useful trading algo's I've got are of the longlag-shortlag=0 variety, just like the EMA10 EMA21 variety. I'll be happy to share code I've done so far - I'm sure you can improve on it. Title: Re: Goomboo's EMA10/21 Crossover Versus the rebuilder's Flipist Method Post by: stochastic on January 28, 2012, 10:39:18 AM Sure - although tbh I've only been using rgp for a couple of weeks, before that I was using eureqa but I didn't find it flexible enough (it's really just for symbolic regression). rgp is well documented but if you don't have a lot of experience with GAs (i don't) then the tutorials at rsymbolic.org are a bit incomplete. Still, I have plenty of algorithms generated. Some overfit and just buy below a certain level and sell above it. It all comes down to your fitness function and i think mine leaves a bit to be desired. Some of the useful trading algo's I've got are of the longlag-shortlag=0 variety, just like the EMA10 EMA21 variety. I'll be happy to share code I've done so far - I'm sure you can improve on it. Thanks, if you can put some here or pm to me I will take a look at it. I requested some books on the subject. Title: Re: Goomboo's EMA10/21 Crossover Versus the rebuilder's Flipist Method Post by: stochastic on January 28, 2012, 10:49:06 AM Very nice work. Also try expanding the time frame to daily & weekly scales. I already have the daily scale up. I personally think bitcoin is too volatile to really hold it long term in large quantities, so holding a position for large amounts for weeks or months would be unrealistic if you are using margin. Title: Re: Goomboo's EMA10/21 Crossover Versus the rebuilder's Flipist Method Post by: miscreanity on January 28, 2012, 11:03:51 AM I already have the daily scale up. I personally think bitcoin is too volatile to really hold it long term in large quantities, so holding a position for large amounts for weeks or months would be unrealistic if you are using margin. Right now and for some time to come, yes. You'd have to manage a balanced position by scaling it instead of going all in each time. With Bitcoin, I use weekly data as an overall trending and reversal guide, then daily/hourly to spot scaling opportunities. It'd be more complex using multiple temporal dimensions, but even building on the simple EMA10/21 technique that way would be far more robust - even somewhat predictive. The greater the time-frame, the harder it is to reverse the trend. Title: Re: Goomboo's EMA10/21 Crossover Versus the rebuilder's Flipist Method Post by: rebuilder on January 28, 2012, 11:21:42 AM Just popped in to say "nice work!"
I don't have the time to look through the whole thread right now, but I'll be sure to do it when I can. Title: Re: Goomboo's EMA10/21 Crossover Versus the rebuilder's Flipist Method Post by: gamer4156 on January 28, 2012, 02:47:58 PM http://i1248.photobucket.com/albums/hh492/dropoutbox/EMAcross.png It says EMA5/21 on the title of the chart? Title: Re: Goomboo's EMA10/21 Crossover Versus the rebuilder's Flipist Method Post by: stochastic on January 28, 2012, 07:18:40 PM http://i1248.photobucket.com/albums/hh492/dropoutbox/EMAcross.png It says EMA5/21 on the title of the chart? Thanks for catching that. It should be EMA10 Title: Re: Goomboo's EMA10/21 Crossover Versus the rebuilder's Flipist Method Post by: stochastic on January 28, 2012, 07:31:04 PM I already have the daily scale up. I personally think bitcoin is too volatile to really hold it long term in large quantities, so holding a position for large amounts for weeks or months would be unrealistic if you are using margin. Right now and for some time to come, yes. You'd have to manage a balanced position by scaling it instead of going all in each time. With Bitcoin, I use weekly data as an overall trending and reversal guide, then daily/hourly to spot scaling opportunities. It'd be more complex using multiple temporal dimensions, but even building on the simple EMA10/21 technique that way would be far more robust - even somewhat predictive. The greater the time-frame, the harder it is to reverse the trend. Next time I will add in scaling. Anyone that wants to jump ahead check out here (http://blog.fosstrading.com/2009/05/rsi2-with-position-sizing.html). R has some other tools such as blotter (http://blog.fosstrading.com/2009/11/tactical-asset-allocation-using-blotter.html) that can keep track of positions. |