|
1
|
Economy / Trading Discussion / How to use Cup and Handle Pattern
|
on: August 30, 2023, 02:51:55 PM
|
Chart patterns, when used with technical indicators, help traders understand the market better. These patterns are like important tools for traders. I've summarized another article about a pattern called Cup and Handle Pattern. You can read it here to learn about this pattern and other types too. What is a Cup and Handle Chart Pattern?The Cup and Handle pattern takes shape as the price of an asset forms a gradual U-shaped structure resembling a cup. Following the cup's apex, there's a sideways or slightly downward movement, forming the handle. While exact symmetry in the highs of both sides is rare, closer alignment enhances the pattern's desirability. After the cup's peak, a pullback shapes the handle, creating a consolidation phase before a potential breakout. Successful completion of the pattern involves the price surpassing the handle's trendline, leading to new highs. 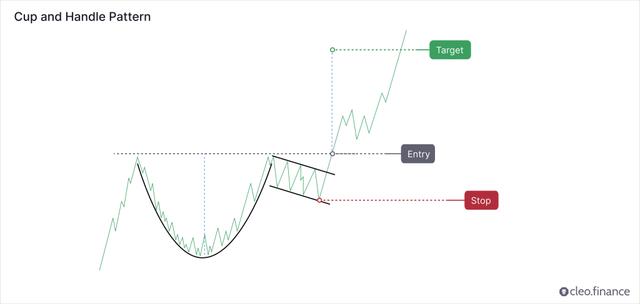 Cup and Handle Pattern: Continuation or Reversal? Cup and Handle Pattern: Continuation or Reversal?Primarily manifesting during uptrends, the Cup and Handle pattern signifies a consolidation phase before price resumption, categorizing it as a continuation pattern. A breakout from the handle's trading range signifies a continuation of the previous trend. However, reversals are rare instances, and they exhibit lower performance compared to continuation scenarios. Thomas Bulkowski's research ranks the Cup and Handle pattern 3rd out of 39 chart patterns based on overall performance.  Identifying a Solid Cup and Handle Chart Pattern Identifying a Solid Cup and Handle Chart PatternEffectively identifying the Cup and Handle pattern necessitates understanding its defining characteristics. It begins with a downward price movement followed by a period of stability. An upward price trend matching the initial decline forms the cup, while the handle emerges as the price moves sideways and slightly downward. If the handle's decline extends beyond half of the U-shaped cup, the pattern loses validity. U-shaped cups are ideal, as opposed to V-shaped formations. A well-rounded cup bottom enhances the pattern's strength. Entry signals occur when the price breaks out on the cup's right side with substantial volume. 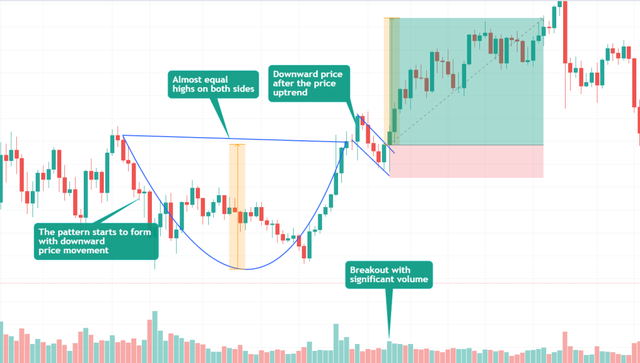 Target and Stop Loss Placement Target and Stop Loss PlacementDetermining target and stop loss levels involves measuring the cup's bottom height and placing the target above the breakout point. The stop loss can be positioned below the handle's low. 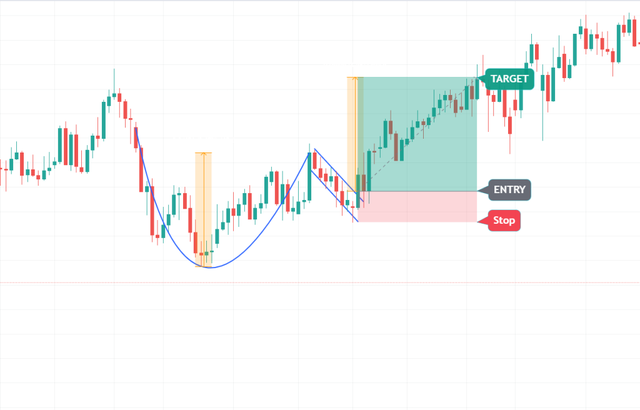 Cup and Handle Pattern's Pullback/Throwback Rate Cup and Handle Pattern's Pullback/Throwback RateThomas Bulkowski's research indicates that the Cup and Handle pattern often experiences a significant pullback or throwback rate. Roughly 6 out of 10 times, the price retraces to either the breakout point or the pattern's apex. In conclusion, the Cup and Handle Chart Pattern offers traders a valuable tool for identifying potential continuation trends within a larger price movement. Recognizing its formation, understanding its characteristics, and applying appropriate strategies can contribute to successful trading outcomes. How to Trade a Cup and Handle Pattern Automatically?To use Cup and Handle Pattern in your automated trading strategy, you can identify the pattern on the cleo.finance chart and use the pattern's lines as your automated entry and exit conditions, along with your stop losses and take profits. Then automate it. You also have the option to backtest the strategy using a manual backtester on the chart equipped with drawing tools. This allows you to simulate the Cup and Handle Pattern on the chart and assess its effectiveness.  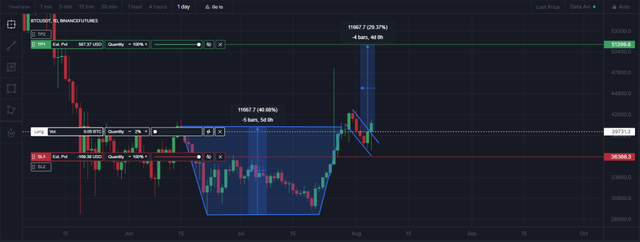 |
|
|
|
|
2
|
Economy / Trading Discussion / Re: BARR Pattern - Best performing chart pattern according to Bulkowski Stats
|
on: July 19, 2023, 07:30:19 AM
|
Using this indicator alone without formulating a general strategy will lead to wrong results, as despite the high trading volumes, Bitcoin fails to reverse its direction, but by following the pattern for a longer period, the closer the price is to the top, the easier it is to break it and with lower trading volumes next time.
I fully agree with your point. As I mentioned, chart patterns can be really useful when crafting your strategy but only when you use them a part of your trading arsenal. Using and relying solely on the chart patterns wont provide optimal results definitely. |
|
|
|
|
3
|
Economy / Trading Discussion / BARR Pattern - Best performing chart pattern according to Bulkowski Stats
|
on: July 12, 2023, 12:22:49 PM
|
Chart patterns, when combined with technical indicators, offer crucial insights to traders, enhancing their market analysis capabilities. These patterns serve as invaluable tools within a trader's toolkit. I made a short summary of another article for you, about the bump and reversal bottom (BARR) pattern. Thet the source is here, where you can also learn about other chart patterns. What is a Bump and Run Reversal Bottom (BARR) Pattern?The Bump and Run Reversal Bottom (BARR) pattern is characterized by three distinct phases: the lead-in phase, the bump phase, and the run phase. The lead-in phase is a period of gradual price decline, followed by a sudden and sharp price increase during the bump phase. The run phase is a gradual price decline that follows the bump phase. Is the Bump and Run Reversal Bottom (BARR) pattern a Continuation or Reversal Pattern?The BARR pattern indicates a possible shift from a falling to a rising trend, as it is a reversal pattern. Although continuations sometimes occur, reversal is more likely and effective than continuations. Bump and Run Reversal Bottom Pattern (BARR) Thomas Bulkowski conducted extensive research on chart patterns. He examined daily data of US stocks and found over 1099 trades based on the breakout Bump and Run Reversal Bottom pattern. The pattern had the best overall performance rank among 39 chart patterns. (EURUSDT D1 Bump and Run Reversal Bottom Pattern (BARR)) How to Identify a Bump and Run Reversal Bottom (BARR) Pattern?The bump and Run Reversal Bottom (BARR) pattern has three phases: the lead-in phase, the bump phase, and the run phase. The lead-in phase involves a gradual price decline, while the bump phase is a sudden and sharp price increase. Finally, the run phase is a gradual price decline that follows the bump phase. The trendline of the BARR pattern connects the lows of the lead-in phase and the bump phase. Once the price breaks through this trendline, it signals a potential trend reversal from a downward to an upward trend. 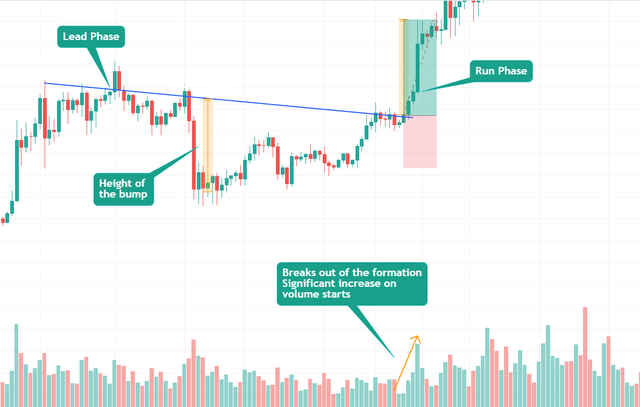 (BTCUSDT D1 Bump and Run Reversal Bottom Pattern (BARR)) The volume trend during formation has no effect on the performance. But as prices break out of the formation and start moving higher, there is a significant increase in trading volume. Rising prices characterize the uphill run phase. 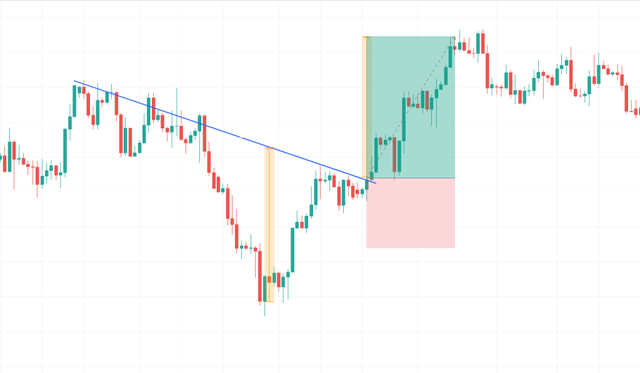 (GBPUSDT H4 Bump and Run Reversal Bottom Pattern (BARR)) Where to Place Target and Stop Loss?Target: Measure the height of the bump and add it to the breakout point. Stop-loss: Typically placed at the midpoint of the bump phase, aiming for a risk-to-reward ratio of at least 2R. 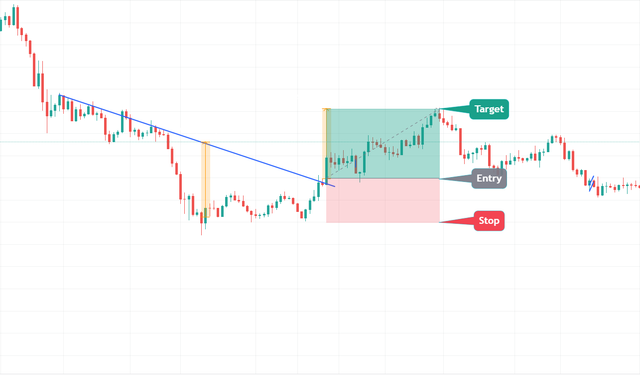 (ETHUSDT D1 Bump and Run Reversal Bottom Pattern (BARR)) How to Trade a Bump and Run Reversal Bottom (BARR) Pattern Automatically?To use the BARR Pattern in your automated trading strategy, you can identify the pattern on the cleo.finance chart and use the pattern's lines as your automated entry and exit conditions, along with your stop losses and take profits. Then automate it. You also have the option to backtest the strategy using a manual backtester on the chart equipped with drawing tools. This allows you to simulate the BARR pattern on the chart and assess its effectiveness.  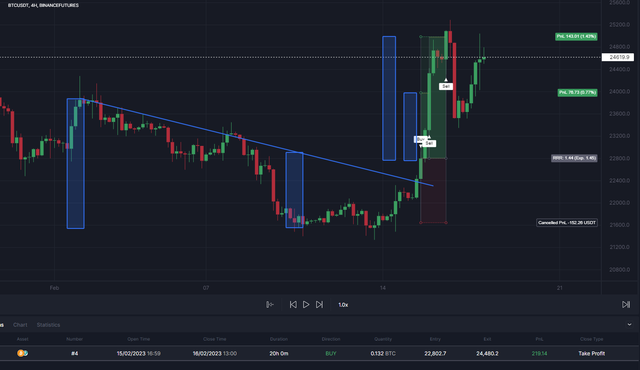 |
|
|
|
|
4
|
Economy / Trading Discussion / Re: How to use the Bear Flag pattern and what to look for?
|
on: June 22, 2023, 02:27:16 PM
|
I am not sure if I will ever understand the seriousness of trading view and technical analysis but for the hardcore trader and new comer this article is just great help. Just lovely how you have extracted detailed info about it. I think I have seen some other thread in similar ways, may be it was you only and the cleo Website.
I dont really believe in TA to the fullest. The pattern you shown, how is it based on and what are the chances that it will bounce back at particular period of time as shown in the trading charts above?
Let us say I learn the TA to fullest of my knowledge. How do you concur about the events repeating themselves so keenly? Consider me curious and naive in TA.
I appreciate the positive comment, thanks. Every trader understands that it's impossible to predict market moves with 100% certainty. However, using technical indicators can help us make better decisions. These indicators and patterns give us clues about how buyers and sellers behave in the market. For instance, with a bear flag, when prices consolidate and volume is low, it means neither buyers nor sellers have control. But when there's a breakout, it suggests that sellers are gaining momentum again, giving us an idea of how to position ourselves. The concept of events repeating themselves in the market is often attributed to the belief that human psychology plays a role in shaping market dynamics. Market participants tend to exhibit similar patterns of behavior when faced with similar market conditions, leading to the repetition of certain patterns over time. You can also check out the Bulkowski statistics here about flag patterns, in terms of breakout, throwback, etc stats. He has one of the most extensive research and tests on chart pattern and where he shared all the stats he got. https://thepatternsite.com/flags.html |
|
|
|
|
5
|
Economy / Trading Discussion / Re: How to use the Bear Flag pattern and what to look for?
|
on: June 22, 2023, 02:14:47 PM
|
Yeah but in my opinion, some patterns need other indicators that support them sometimes it fails to use only pattern, especially in a lower timeframe you also don't want an ending like this image below.  trade is crazy tho  anyway good information  Thanks! Precisely, the thing is using chart patterns alone won't give you the best result for predicting market moves. That is why it is always advisable to use chart patterns in conjunction with other technical indicator for the best results. We can think of chart patterns as some kind of essential piece of a trader's toolkit. For the picture, I would say that, it is a flag pattern because flag patterns are very short consolidations with a flag a pole (the sharp price drop right before the pattern forms) and it works best on 4h, 1H and Daily. Flag patterns are one of the most frequent chart patterns that form and they need to be watched carefully and always should be looked for confirming factors, such as volume and other technical indicators |
|
|
|
|
6
|
Economy / Trading Discussion / How to use the Bear Flag pattern and what to look for?
|
on: June 21, 2023, 02:34:23 PM
|
Chart patterns can be valuable tools for traders to understand market behavior and predict future price movements accurately. They can enhance your strategies, profitability and allow you to make more informed trading decisions. I summarized another article here, this time for the bear flag pattern - one of the most common and used one by traders. Here is the source, where you can find also other chart patterns. What is the Bear Flag Pattern:The bear flag pattern is a technical analysis pattern that occurs during a downtrend. It involves two sharp price drops separated by a brief consolidation phase. The pattern suggests that a further bearish move is likely, and it is confirmed when the lower support trendline is broken. This leads to another downtrend with prices falling towards the low of the formation. 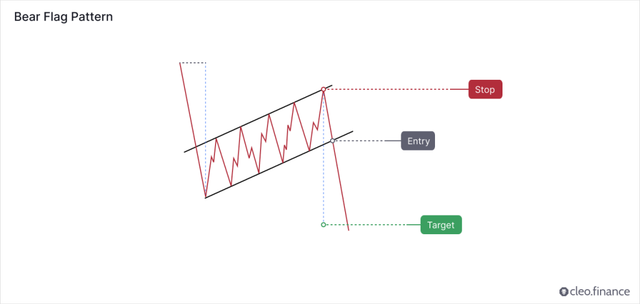 Is the Bear Flag Pattern a Continuation or Reversal Pattern? Is the Bear Flag Pattern a Continuation or Reversal Pattern?Bear flag occurs often in the market and it is generally considered to be a continuation pattern. It signals a pause or consolidation within a downtrend, where the bears take a brief break, and prices move slightly upward in a rectangular shape before continuing the downtrend. The breakout often occurs with a significant trading volume. Traders should look for either a break of important support or a pullback.  How to Identify a Bear Flag Pattern? How to Identify a Bear Flag Pattern?The bear flag pattern is a chart pattern that occurs during a downtrend. Traders should look for a fast and sharp decline in price (called a flagpole). This is followed by a brief period of consolidation (known as a flag), which is surrounded by two parallel upward-trending lines. In bear flag formation, the volume is often in a downward trend. The breakout from the flag pattern typically occurs with a significant volume and confirms the continuation of the downtrend. Although this is not always the case, flag patterns with a diminishing volume or light breakout volume usually perform better.  During the consolidation phase, traders watch out for the price breakdown through the lower trendline and make a new low since it shows the bears are in control again to push another decline. 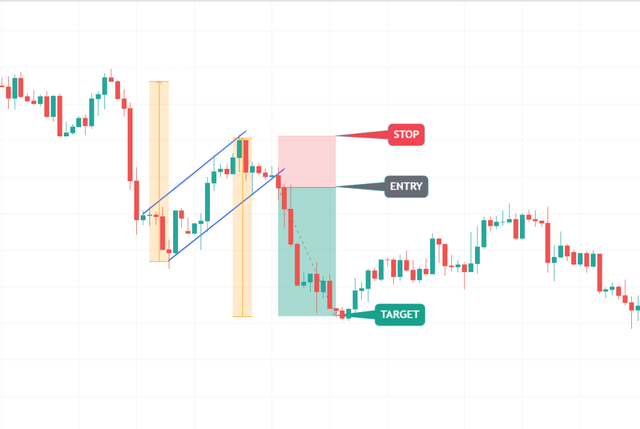 Where to Place Target and Stop Loss? Where to Place Target and Stop Loss? The target can be placed by measuring the distance from the start of the sharp price movement (the pole of the bear flag) to the point where the patterns upper trend line ends. The stop loss can be placed above the upper trend line of the pattern. And you should aim for a risk-to-reward ratio of at least 2R. (for every 1 unit of risk you expect 2 units of reward).  How to incorporate the Bear Flag Pattern into your automated trading strategy? How to incorporate the Bear Flag Pattern into your automated trading strategy? To include the Bear Flag Pattern in your automated trading strategy, you can identify the pattern on the cleo.finance chart and use the pattern's lines as your automated entry and exit conditions, along with your stop losses and take profits. Then automate it.  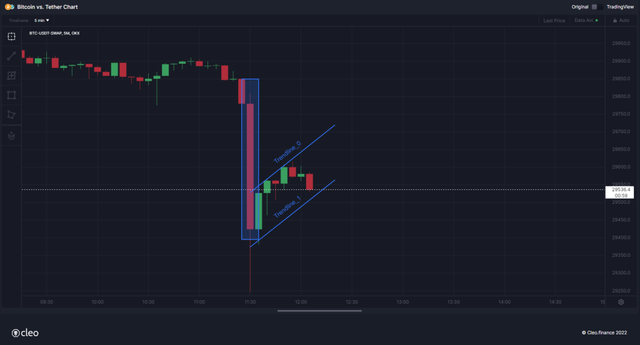 |
|
|
|
|
7
|
Economy / Trading Discussion / Re: Built a new Manual Backtester curious to get the traders' feedback here
|
on: June 19, 2023, 07:17:04 AM
|
I think you've made a good development which i have that strong feelings that some might be interested of making use of to serve as an additional tools for them to be able to track down their trades, market price and other past informations needed to keep on track records concerning their bitcoin trading experience, though we shouldn't rely on a single entity to derive our conclusion on bitcoin market price speculation because the more we explore dip the more results we get differently.
Very good point, the aim is to provide a space for traders that they constantly improve their trading approach. They can leverage these kind of innovative tools to increase their trading success and have a better insight into the markets. |
|
|
|
|
9
|
Economy / Trading Discussion / Built a new Manual Backtester curious to get the traders' feedback here
|
on: June 15, 2023, 01:55:26 PM
|
Hello everyone, it has been quite a while developing the Manual Backtester tool, aiming make backtesting more efficient. I would really appreciate your feedback, especially from fellow traders within the community. Feel free to explore the project on cleo.finance, and let me know your thoughts. EDIT: It is already finished, you can try it now. 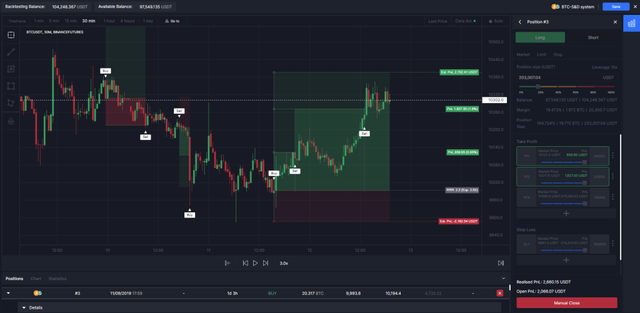 Here are the features: - Replay assets in real-time, enabling you to analyze historical data as if you were trading live.
- Automatically calculate statistics for more informed decision-making.
- Pause and save you backtests, enabling you to come back and continue at any time.
- Place positions, simulate candle movements and set multiple stop-loss and take-profit levels.
- Create custom drawings such as trendlines or rectangles.
- View past positions' take-profit and stop-loss levels.
- Adjust playback speed, navigate through timeframes, and jump to specific times.
- Set targets and stops by dragging them on the chart using the Drag & Drop feature.
 Access an expandable detailed position table with information on position details, order list, take profit, and stop loss. You can also track the transaction costs associated with your positions when backtesting, allowing for more realistic results.  Funding fees, commissions, and slippage are visualized on the chart, as well as in the full breakdown of statistics. The spread, commissions, and slippage that you set will appear as a yellow line and will impact all profit and loss (PnL) calculations. You can set these fees at the beginning of the backtest in the second step of the backtest settings. The tool is built to make backtesting a fast and painless process. For further improvement, it would be great to have your suggestions and feedback so that it can get better for traders. |
|
|
|
|
10
|
Economy / Trading Discussion / Re: How to use Rising Wedge Pattern??
|
on: June 12, 2023, 12:20:27 PM
|
Nice job! This rising wedge forms higher lows and lower highs and this is one strong indication for a reversal because since the highs is not going above the highs of the previous high it Shows the bears are gradually entering the market in which if this moves and forms a wedge in an uptrend there is a big chance of a sell. Some times there is a fake break out towards the bull and if one doesn't understand this wedge pattern the fall towards the wrong price direction following the fake break out.
Thanks! That is correct, the higher highs are getting shorter and shorter which indicates the bears are getting in control. Fake break out it is always important to wait for the confirmation and watch out guidelines strictly. |
|
|
|
|
11
|
Economy / Trading Discussion / Re: How to use Rising Wedge Pattern??
|
on: June 08, 2023, 02:07:00 PM
|
Good topic. According to Barry D. Moore CFTe rising wedge has a success rate of 81% which is super decent in TA. Also in crypto trading wedges are very popular andvery accurate (this 81% sounds very likely). One of my best patter.
Speaking of rising wedges, it begs to mention falling wedges. After all, it is exactly the same pattern with the same specifics and principles, but only in the opposite direction. 1 more photo and 2 more sentences and the topic is supplemented with a second pattern.
You brought up a good point about falling wedges being the flip side of rising wedges. They share the same principles but go in the opposite direction. I was planning to mention falling wedges separately in another post but may be it is good to add here in this post. I will update post, thanks for the comment. |
|
|
|
|
12
|
Economy / Trading Discussion / How to use Rising Wedge Pattern??
|
on: June 06, 2023, 03:09:47 PM
|
Chart patterns are one of the key tools for traders to understand market behavior and predict future price movements accurately. Whether you're a newbie or an experienced trader, they can enhance your strategies and boost profits. So, I thought it will be useful to summarize the article for the people here. Here is the source, where you can find also other chart patterns. The rising wedge pattern is a triangle pattern characterized by both trendlines heading in an upward direction. It often occurs during consolidation phases in an uptrend and can indicate a potential reversal in the previous upward trend. This forum post will provide a summary of the key points discussed in the article and shed light on how to identify and trade this pattern effectively. What is Rising Wedge Pattern:A wedge pattern is a triangle pattern with both trendlines heading in the same direction. A rising wedge has both lines heading upward, with the lower bound rising more quickly than the upper bound. Rising Wedge patterns are more common during consolidation periods, but they can provide more significant signal after a peak has already been established. The price usually stays within the trendlines (with no intraday or fake breakouts) until the final breakout occurs. Rising Wedge patterns can play different roles, serving as consolidation patterns against or with the prevailing trend or as topping patterns, particularly when accompanying a liquidity run peak. 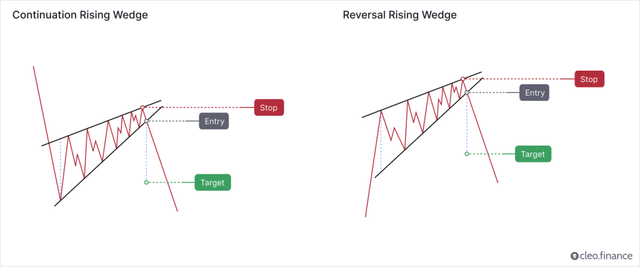
Continuation or Reversal Pattern?The rising wedge pattern is commonly considered a bearish reversal pattern. However, its important to note that each subsequent peak and trough is getting shorter than the last, indicating that bearish momentum is building. On the other hand, there are cases where the rising wedge pattern can act as a continuation pattern. If the pattern forms in an uptrend and the price breaks above the upper trendline, it may indicate that the bulls are still in control and the price is likely to continue higher. However, this is less common than the bearish reversal scenario. According to Thomas Bulkowski's findings, the rising wedge tends to perform better in upward breakouts, compared to downward breakouts. The pattern ranked 32nd out of 39 chart patterns for upward breakouts and ranked last out of 36 chart patterns for downward breakouts.  Identifying a Good Rising Wedge Pattern: Identifying a Good Rising Wedge Pattern:The rising wedge pattern can be challenging to identify accurately, but there are guidelines to simplify the process. Look for price movements that form higher highs and higher lows within the two trendlines, which contain the price most of the time. Diminishing volume during the pattern formation is typical. According to Bulkowski, to be classified as a wedge, the pattern needs to touch at least five reversal points in total three on one trendline and a minimum of two on the other trendline. Rising wedges can form during a long downward price trend or after an upward peak, resembling small rallies against the overall trend. When a rising wedge pattern reaches a peak, the chances are high that the break out will be downward. This is because the emotions and commitments have been exhausted during the peak and that leaves little room for a comeback during the test phase. 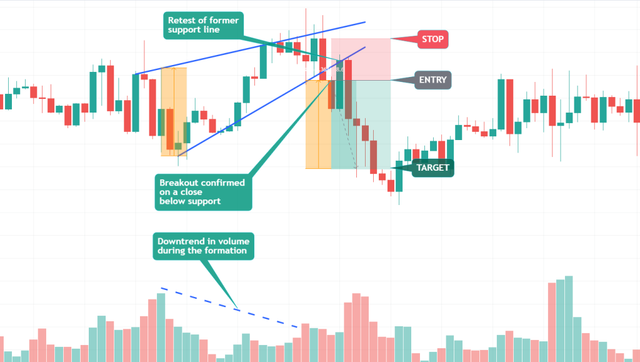 Target and Stop Loss Placement: Target and Stop Loss Placement:For target placement, measure the height of the wedge at its widest point and extend that distance up from the trendline breakout.  Stops are commonly placed above the top side of the rising wedge. Aim for a risk-to-reward ratio of at least 2R (two units of potential reward for every unit of risk). How to incorporate Rising Wedge Pattern into your automated trading strategy? To include the Rising Wedge Pattern in your automated trading strategy, you can identify the pattern on the cleo.finance chart and use the pattern's lines as your automated entry and exit conditions, along with your stop losses and take profits. Then automate it. 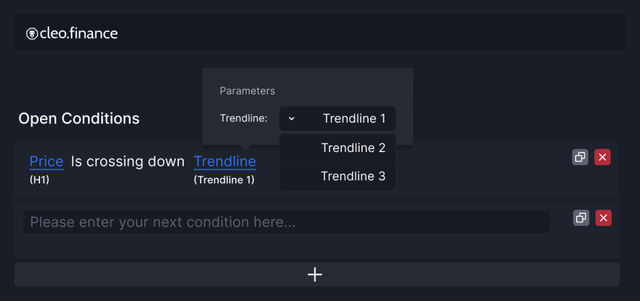 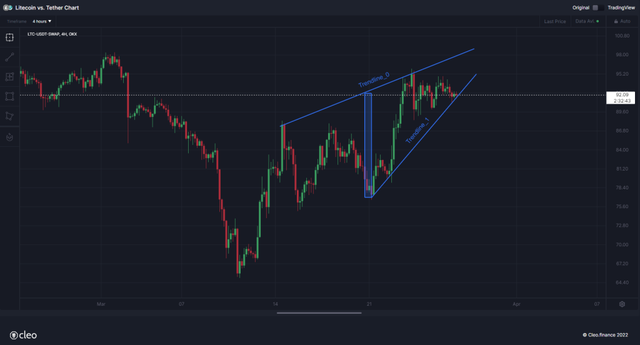 |
|
|
|
|
13
|
Economy / Trading Discussion / How to use Bull Flag Chart Pattern?
|
on: May 03, 2023, 01:59:49 PM
|
Technical chart patterns are a popular analytical tool used by traders to identify potential trading opportunities. Analyzing chart patterns can provide valuable insights into market dynamics and the behavior of buyers and sellers. I wanted to share one of the articles about the bull flag pattern and how to use them effectively. Here is the source where also you can find other chart patterns. What is the Bull Flag Pattern?The bull flag is a bullish pattern that forms when the two upward price movements are separated by a short period of consolidation. The initial spike in the price is vertical, catching bears off-guard as buyers take over. This rise is represented by the flagpole. After the flagpole, usually, theres a retracement that forms a rectangular shape, with two parallel trendlines connecting the highs and lows which called as Flag Pattern. 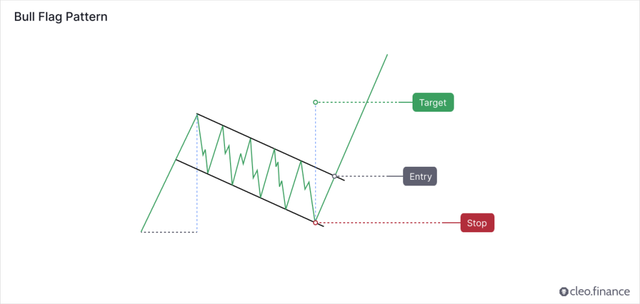 The breakout occurs when the upper resistance trendline is broken. This often leads to another uptrend move with prices surging toward the high of the formation. Is the Bull Flag Pattern a Continuation or Reversal Pattern?Bull flag is generally considered to be a continuation pattern. It signals a pause or consolidation in a bullish trend before the price continues to move higher. When the price breaks out of the bull flag, it often continues its upward trend, usually with high trading volumes. It is generally not recommended to enter a trade at a random price in hopes of an extension to the upside. Instead, traders should look for either a break of an important resistance or a pullback. 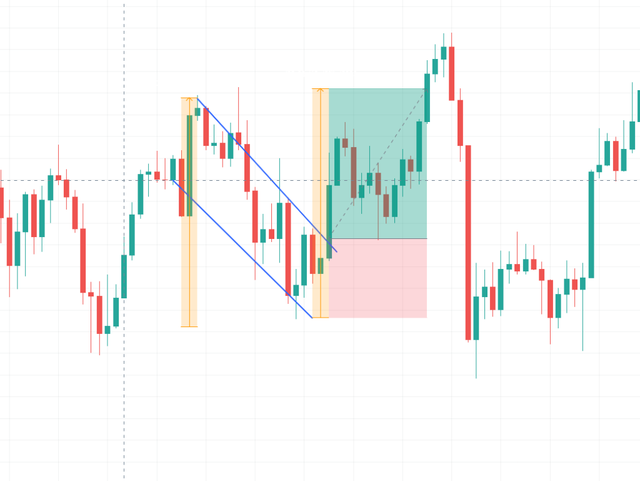 ETHUSDT H4 - Bull Flag Pattern How to Identify a Good Bull Flag Pattern?In order the identify a good bull flag pattern there are some guidelines traders can follow. The bull flag pattern is a chart pattern that occurs during an uptrend. Traders should look for a sharp and quick price rise (flagpole) followed by a period of consolidation (flag) that is bounded by two parallel down-trending trend lines. 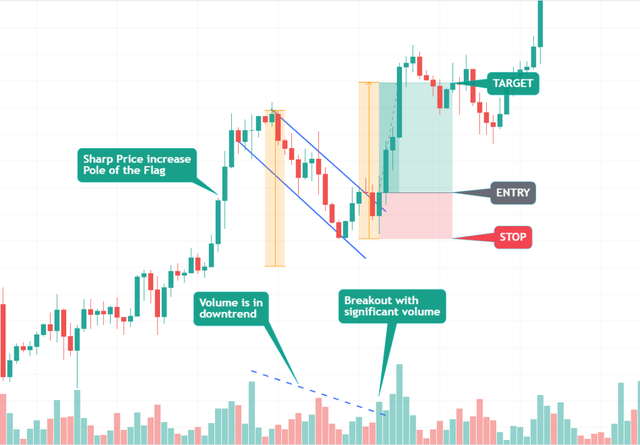 EURUSD H2 Bull Flag Pattern Another characteristic to watch out for is the downward volume trend during the formation, however, diminishing volume is not an absolute rule. The breakout from the flag pattern should occur on high volume and confirm the continuation of the uptrend. The strength of the bull flag depends on how sharp the initial price spike was in the flagpole. During the consolidation phase, traders watch out for the price break up through the upper trendline and make a new high since it shows the bulls are in control again to push another rally. Where to Place Target and Stop Loss?The target can be placed by measuring the distance from the start of the sharp price movement (the pole of the bull flag) to the point where the patterns lower trend line ends. The stop loss can be placed below the lower trend line of the pattern. And you should aim for a risk-to-reward ratio of at least 2R. (for every 1 unit of risk you expect 2 units of reward). 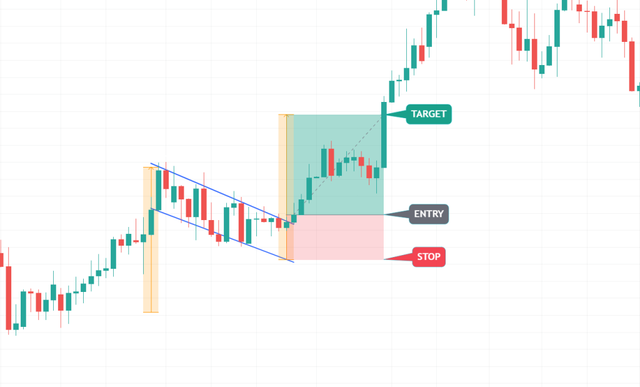 GBPUSD M30 Bull Flag Pattern ConclusionThe bull flag typically occurs in an uptrend, characterized by a sharp and rapid increase in price (known as the flagpole), followed by a period of consolidation forming a flag shape. The volume is often in a downtrend during the consolidation phase, although this is not always the case. Traders should keep an eye on the price action during this period, looking for signs of a breakout above the upper trendline and a new high, which would signal that the bulls are regaining control and could push the price higher. Traders can achieve better results by using the pattern in conjunction with other technical indicators. |
|
|
|
|
14
|
Economy / Trading Discussion / 5 red flags: When to change your trading strategy?
|
on: February 16, 2023, 02:31:22 PM
|
Hey guys, I have summarized an article that talks about 5 red flags that signal its time to change your trading strategy which can be a crucial indicator to stay ahead of the game. Hope it helps in your trading journey. Source: blog.cleo.financeTrading is a constant balancing act between risk and reward. Developing a successful trading strategy is a significant accomplishment in its own right, but it is equally important to know when it is time to adjust your approach or when to abandon it altogether. To help you stay ahead of the curve, I've identified the 5 telltale red flags that signal it could be time to change your strategy. Whether it's a shift in market conditions or a decline in performance, these red flags are crucial indicators that something needs to change. Why can live trading results deviate from backtest?It is not uncommon for live trading results to differ from the results obtained during backtesting. The main reasons for it are:
1. Improper Backtesting Methodology
This is kind of an "umbrella term" for everything that can go wrong while backtesting, but the facts remain: Backtesting requires a robust methodology to provide reliable results. If the methodology is flawed, the results of the backtest may not accurately reflect the strategy's performance. Common issues include overfitting to past data, using insufficient data (or cherry-picking your data - talk about introducing a bias into your results!), or not accounting for transaction costs.
2. Overfitting to Past DataThe most common culprit for live trading performance not achieving backtesting expectations is overfitting to past data. Overfitting occurs when a strategy is designed to fit the past performance of a market too closely, leading to a false representation of its potential future performance. Overfitted strategies have beautiful backtesting results but live trading performance fails to deliver even a resemblance of such results. A typical example would be using an overly specific period of any indicator - such as EMA (103).
3. Strategy Not as Robust as ThoughtBacktesting can provide a false sense of security, and traders may not fully appreciate the limitations of their strategy until they begin live trading. For example, a strategy that performs well in a trending market environment may not perform well in ranging conditions, or a strategy may be vulnerable to certain market events that were not accounted for during backtesting. 4. Execution IssuesLive trading often involves executing trades in real-time, which can be subject to various challenges that were not present during backtesting. For example, slippage, latency, or data inaccuracies can all affect the performance of a strategy. 5. Market Conditions Have ChangedI almost don't want to add this one to the list, because I worry most people will use this as a scapegoat, and not examine in detail all the previously mentioned reasons, that they actually can influence. But the fact is, the market is dynamic, and conditions can change rapidly. Changes in central bank policy, the introduction of new market participants, shifts in investor sentiment, or changes in economic conditions can all impact a strategy's performance. You must be aware of these potential issues and take steps to address them. This includes ensuring a robust backtesting methodology, regularly monitoring and adjusting the strategies, and being prepared to adapt to changing market conditions. What to do if your strategy shows any of these red flagsWhen you encounter red flags in your trading strategy, it's crucial to take prompt and decisive action. Personally, if my strategy deviates beyond the backtested results in any of the five metrics mentioned below, I immediately stop live trading and switch to paper trading to monitor its performance. A robust backtesting methodology should provide a reliable indicator of the strategy's performance, and any deviation from the backtested results should be taken as a sign that further examination is needed. I cannot recommend any leniency in this matter (translation: Every time I did, it was a painful lesson). If you're getting to this position often, it suggests that your backtesting methodology is not robust enough. My guess is: you are either overfitting to past data, or introducing any of the dozens of biases that come with backtesting.
The red flagsI picked these red flags because of their importance or ability to provide a signal early on. It's important to note that the following list is possibly subjective. Not everyone will agree with me on this list. Everyone will agree, however, that it is a good reason to stop a strategy from live trading if it has significantly deviated from its backtested results. Many traders mistakenly believe that an automated strategy is a "set-and-forget" system. It's not. It is crucial to monitor its performance and be prepared to make adjustments or even stop the strategy if necessary. You might monitor different parameters than me, but you need to monitor something. Make sure your hard work of testing and developing a strategy with a positive expectancy doesn't go to waste. 1. Max drawdownThe first and most critical red flag to watch out for is the difference in maximum drawdown between the live trading strategy and its backtested version. Maximum drawdown is a measure of the largest decrease from a peak to a trough in the value of your portfolio balance, expressed as a percentage of the drop from the peak value. Say you started with 100, traded the account up to 150 with a handful of wins, and now you are at 135 after two losses. Your current drawdown is 10%, and as long as your drop from the current peak was not higher until now, this is also your max drawdown. The drawdown curve as a whole is a crucial indicator to monitor. Its other secondary parameters can provide further insight into the performance of your trading strategy. These include: The steepness of the drawdown curve - a steep curve indicates a rapid decrease in value caused by a handful of big losses, while a more gradual curve indicates a slower decline - a longer streak of smaller losses. The number of trades it took to reach the maximum drawdown - a high number of trades indicates a long period of poor performance, while a low number indicates a short period of sizeable losses. Total recovery time - the length of time it takes to recover from the maximum drawdown can provide insight into the resilience of your strategy. Generally, you want a more resilient strategy with quick recovery. By monitoring these parameters in addition to the maximum drawdown, you can gain a more comprehensive understanding of the performance of your trading strategy and make informed decisions about any necessary changes. Side note: To help you gauge the downside risk, calculate your strategy's Ulcer Index 2. The losing streak length and frequencyA losing streak is a consecutive sequence of trades that result in losses. If the maximum length of the losing streak in live trading exceeds the results obtained during backtesting, it could indicate that the strategy may not be as consistent or reliable as originally believed. Try to examine how you would feel in these streaks. If, for example, your strategy regularly alternates between wins and losses, you'll probably feel fine. But if you have periods of long winning streaks and then periods of long losing streaks, it could be emotionally hard to handle. You could get an "itchy hand" and try to fiddle with your strategy even if the losing streak should have been expected since it occurred in the backtest. 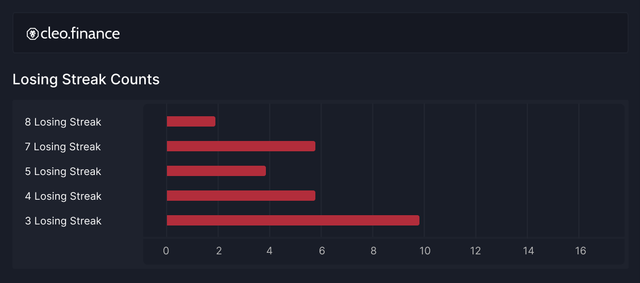 3. The Recovery time 3. The Recovery timeThe total drawdown time can be oversimplified as follows: Total Drawdown Time = Drawdown Time + Recovery Time We looked at the Drawdown time already - in the first red flag, so let's examine the recovery time. The recovery time is the time it takes for the strategy to return to a profitable state from the point of max drawdown. 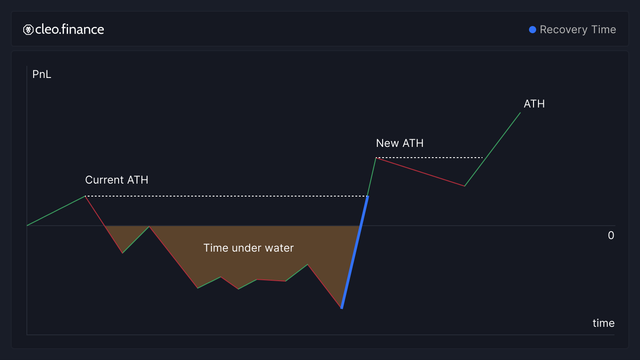 For the recovery time, I have basically only one rule: It has to be more aggressive, than the drawdown time. I want to see a faster recovery than the drawdown time. This happens when your average win is larger than your average loss. Such behavior I consider healthy, and it only motivates me to look at the drawdown period more closely (Is there a pattern in the drawdown occurrences? Can I identify them and filter them out somehow?)
4. Win rateThis red flag is self-explanatory. The win rate of your live traded strategy should not be significantly different from the backtested version. However, you need to make sure you have enough data before you make any decisions. And therefore it is not the first actionable indicator that something might have gone awry. 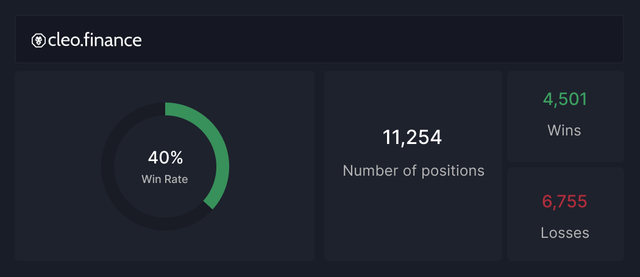 5. The trade duration 5. The trade durationThe trade duration difference between your strategy's backtested and live traded versions is another vital red flag to look out for. Trade duration refers to the time a trade is kept open, from entry to exit. If, for example, the trade duration in your backtest was anywhere between 30 min and 4 hours, but in live trading conditions, you observe a handful of trades with a duration of 20 hours. Is that a cause for concern? Does it warrant stopping the strategy? Consider the reasons behind such deviations, as it could be an early example of changing market conditions, mismatches in trade execution, or other factors. In the above example, if you opened a trade at the end of the New York session and closed in the London session, maybe the Asian countries had a national holiday and therefore left markets completely illiquid, but the strategy did what was expected. It is also a good idea to look at the distribution of trades in time. For example, if your backtesting was calibrated to trade during the London and New York sessions, but the live trading strategy generates the majority of trades during the Asian session, this could be a sign of discrepancies that might need to be addressed.
ConclusionKnowing when to stop a strategy from live trading is integral to the day trading process. By closely monitoring key metrics and values, and comparing them to the results of your backtesting, you can make an informed decision about whether to continue using a strategy, invest time in improving it, or stop it altogether and look for a better one. And whether you monitor the same indicators or develop your own, as long as you regularly check in on your strategy's results, you are on your way to improving your chances of achieving long-term profitability. I wish you all the best in your trading journey! |
|
|
|
|
15
|
Economy / Trading Discussion / The 4 trading fears and how to overcome them
|
on: February 02, 2023, 12:55:26 PM
|
Hey guys, I have summarized an article about the 4 main fears and how to overcome those fears. Source to full article: blog.cleo.finance - Source to Tradingview: We all face those fears as traders and it can cloud our judgment and hinder our success in the market. Hope you find it useful. Trading in the financial markets, whether it be forex or cryptocurrency, can be a thrilling yet challenging experience. As traders, we are often faced with fears that can cloud our judgment and hinder our success in the market. The 4 fears of every traders:
1.Fear of being wrong:The fear of being wrong is a common obstacle for traders who aim to be right all the time. However, this fear can prevent traders from making bold decisions necessary for success and lead to avoidance of risks, missed opportunities, or impulsive decisions based on emotions. Traders should embrace the possibility of being wrong, use it as an opportunity to learn, and turn it into a strength. Every misstep is a chance to analyze what went wrong and improve our strategy for the next trade. Embrace the possibility of being wrong and use it as fuel to become a better trader. Remember, even the most successful traders make mistakes and face losses all the time. The key is to learn from those mistakes and come back stronger. 2. Fear of losing money:The fear of losing money is natural for traders, but it can control their decisions, leading to hesitancy in taking risks, missing opportunities, or premature exit of positions. So instead of letting the fear of losing money paralyze you, turn it into a strength. Use it as motivation to develop a comprehensive trading plan that incorporates effective risk management strategies. Accepting that losses are a natural part of trading, and using them to improve strategies and approach. 3. Fear of leaving money on the table:The fear of leaving money on the table is a tricky one, as it often arises when were in a winning trade. Its tempting to hold on, hoping to squeeze out even more profits. But this can be a dangerous mindset that can lead to ignoring stop-losses and exposing to unnecessary risk. After all, you dont have a crystal ball (and arent an FOMC member), so you should not expect to buy the exact bottom and sell the exact top. By having a predetermined exit plan, we can lock in profits, manage risk, and avoid emotional decision-making. Embrace discipline by having a clear exit strategy that balances the desire for profits with the need for risk management. Trust your strategy and stick to your plan to be in a better position to capitalize on future opportunities. 4. Fear of missing out (FOMO):The fear of missing out (FOMO) is a feeling that all traders have faced at some point especially prevalent in a volatile market. It can be tempting to jump in without fully analyzing the situation. But succumbing to FOMO can lead to hasty decisions based on emotions, rather than logic, which can result in costly mistakes (emotions causing mistakes
do you see a pattern?). Traders should resist the temptation of FOMO by sticking to their trading plan, making informed decisions based on logic and analysis, and taking time to thoroughly analyze each opportunity. Trust in your strategy and stick to your plan, even when it feels like the market is passing you by.  How to overcome our fears?1. Develop a solid trading plan How to overcome our fears?1. Develop a solid trading planHaving a well-defined trading plan can help manage risks and make informed decisions. The plan should include goals, risk management rules, and entry/exit strategies. Following the plan can ensure discipline and avoid emotional decisions. 2. Practice risk managementBy setting clear stop-loss levels and position sizes, we can minimize our losses and protect our capital. This can give us the confidence to take on appropriate levels of risk and pursue potential trading opportunities. 3. Realize that your ego is the enemyHow many times have you held a losing position past your stop loss and literally prayed for the break-even? Did anything fundamentally change about your position? No, you just didnt want to take the loss, am I right? See, even though we know that losses are part of the process it is still very hard for us to accept that any trade can go against us. And sometimes you do everything right, and still lose. Every trading system works with probabilities. Losses are normal. Let your ego go and stop trying to force a win out of every single position you take. (Add this to your daily affirmation ritual if you must) 4. Stay focused on the long termTrading is a long-term game, so focus on long-term goals to stay disciplined. Every losing day can be a step closer to the long-term goal if analysed and learned from. 5. Take regular breaksTrading can be mentally and emotionally draining, so it's important to take breaks to recharge and refocus. This helps avoid rash decisions.
6. Learn from mistakesThis is the big one. Nobody is perfect, and everyone makes mistakes in their trading careers. Analyze past mistakes and use them as growth opportunities. 7. Automate your trading process:Leveraging technology in your favor can yield a tremendous difference in your trading results and keeping your emotions out of trading. Cleo.finance lets you do this with minimal effort. You can set multiple take profits and stop losses, understand your risk-to-reward ratio, the trades impact on your portfolio and much more before you even place the trade. You can backtest your strategies, trade them live automatically, and more. ConclusionThe four main fears that traders face can have a significant impact on our success in the markets. However, with the right approach and mindset, these fears can be overcome and transformed into positive drivers for our trading. By managing risks, having a clear exit strategy, and avoiding the temptation of FOMO, traders can overcome their fears and become successful. By embracing these fears, traders can make informed decisions, capitalize on opportunities and achieve their trading goals. |
|
|
|
|
16
|
Economy / Trading Discussion / Algorithmic Trading in the Crypto Market: How to Approach it with Confidence
|
on: January 20, 2023, 01:11:25 PM
|
Automated crypto trading, also known as algorithmic trading, has become increasingly popular in recent years as a way to maximize profits and minimize losses in the volatile crypto market. By using computer programs to execute trades based on a set of predetermined rules, traders can take emotion out of the equation and make more informed decisions. One of the main advantages of automated trading is that it allows traders to quickly and efficiently execute trades based on real-time market conditions. This can be especially useful in the crypto market, which is known for its volatility and rapid price fluctuations. Automated trading can also help traders to identify patterns and trends in the market that may be difficult for a human trader to spot. When approaching automated crypto trading, it is important to take into account a number of factors. One of the most important is risk management. Automated trading can be a powerful tool, but it is not without risk. It is important to have a solid risk management strategy in place to minimize the potential for loss. This may include setting stop-loss orders, which automatically sell a position at a certain price in order to minimize losses. Another important factor to consider is the trading platform being used. A good automated trading platform should be user-friendly, reliable, and offer a wide range of features. Some features to look for include the ability to backtest strategies, real-time market data, and the ability to integrate with other tools, such as charting software. One of the key features of a good automated trading platform is the ability to backtest strategies. This allows traders to test their strategies against historical market data and see how they would have performed in the past. This can be a valuable tool for identifying patterns and trends in the market and fine-tuning strategies. It's also important to look for a platform that offers real-time market data. This can be critical in fast-moving markets like crypto where prices can change rapidly. A platform that offers real-time market data can help traders make informed decisions by providing them with up-to-date information on price movements. A good automated trading platform should be able to integrate with other tools, such as charting software. This can help traders to analyze market data and make more informed decisions. In conclusion, automated crypto trading can be a powerful tool for maximizing profits and minimizing losses in the volatile crypto market. By approaching automated trading with a solid risk management strategy, considering the features offered by the trading platform, and utilizing tools such as backtesting and real-time market data, traders can make more informed decisions and achieve greater success in the market. On cleo.finance, You can create your automated trading, customize them in any way you want, set multiple stop loss and take profits with charting experience, and backtest them by adding transaction costs, fees, slippage costs for more realistic results. Short Summary
Automated crypto trading: - Allows traders to quickly and efficiently execute trades based on real-time market conditions
- Helps to identify patterns and trends in the market that may be difficult for a human trader to spot
- Takes emotion out of the equation and make more informed decisions
When approaching automated crypto trading: - Risk management is important to minimize the potential for loss
- Setting stop-loss orders can be helpful
- A good trading platform should be user-friendly, reliable, and offer a wide range of features
Features to look for in a trading platform: - Ability to backtest strategies
- Real-time market data
- Ability to integrate with other tools, such as charting software
- Backtesting allows traders to test their strategies against historical market data
- Real-time market data provides traders with up-to-date information on price movements
- Integrating with other tools can help traders analyze market data and make more informed decisions
|
|
|
|
|
17
|
Economy / Trading Discussion / Re: What you really think about trading bots?
|
on: January 06, 2023, 04:42:12 PM
|
Most people posting here probably know that there are a lot of trading bots out there, but does it work? How could you tell if one is working? Most of them probably have promises that you could gain profit, but that's different. People should understand that bots are told what to do and would react to what they have set in the parameters. It still depends on how the market would go and how the strategy you would have set would respond. What do you think about trading bots in general? [Shameless plug] Everybody who has checked out my profile knows I'm affiliated with Gunbot but check it out.
Are you interested in trying it a bot out for free? Check it out on my site https://gunbot.ph and check the Gunbot Trial. You could try it for three days for free. Bots are not some kind of magic wands that can magically let the money roll into your account. Bots are great tools with good traders. Without trader's knowledge and experience bots cant do anything. It has quite significant advantages some of them are: Time: I don't need to sit down in front of the screen and look for opportunities. I mean since bots are on the market all the time, it catches the opportunities that I might miss. Execution speed: Since it does the execution according to its algorithm, it executes way faster than doing manually. Emotional Discipline: As most newbies when I first started trading, I ended up losing many times then I realized It was mostly because I was lack of emotional discipline. Traders tend to act greedy, panic, or with ego. That was one of the main reasons why I started automated trading. So I think bots are worth it. It works for me at least. Tools on their own cant do anything but help. The platform you will be using for creating your bots is also crucial. |
|
|
|
|
18
|
Economy / Trading Discussion / Re: Risk management: How to set a Stop Loss
|
on: January 06, 2023, 04:33:59 PM
|
Trading without a Stop Loss is the testimony of a lacking trading system. And I think using Stop Loss prevents you from adding to your losses and being emotionally attached to a trade.
Most traders prefer to close their orders manually, and the main reason for this is that very often the price drops quickly and immediately returns to its previous value. In this case, your order will be closed and you will incur a loss. It would be more correct to wait until the price is fixed below the support level and in this case close the order manually. Even if you do this manually, I believe it is still advisable to follow your stop loss price to avoid further losses. Many tends to wait for another confirmation before executing their stop loss action and the result becomes worst for them. Usually, traders always do this in futures because you can't afford not to set-up this one or else you'll be liquidated. We should always have the target price and the cut loss price, by this we can be more responsible trader and succeed in the future. Absolutely agree! Setting a stop loss price is crucial for risk management, whether you are trading manually or using automation. It can be tempting to hold on to a position and wait for a potential recovery, but this can often lead to greater losses. By having a clear cut loss price in place, you can minimize the potential for catastrophic losses and make more informed and responsible trading decisions. This is especially important in futures trading, where not having a stop loss in place can result in liquidation. It's always a good idea to have both a target price and a cut loss price, as this allows you to properly balance risk and reward in your trades. |
|
|
|
|
19
|
Economy / Trading Discussion / Re: Traders goal: A strategy with positive expectancy
|
on: January 05, 2023, 02:40:51 PM
|
(....)
Most traders dont fail at trading because it is hard. They fail because they are not willing to put in the work to create a detailed plan, test the plan, and then follow the plan.
These traders for sure are just people who are thinking that trading is easy money or like a get-rich-quick scheme. Strategy comes with work and time. You need to build your own strategy, practice it, and master it. Capital preservation is the best also here because as long as you have the capital, you still can trade, and you can still apply your strategy. That's why risk management strategy is important, like what OP explained with risk: reward ratio, that is working. Precisely, I agree with your comment. It requires a lot of effort work, time, patience, and experience. If I would like to cover it all here it would take pages and pages. So I wanted to put just one of the perspectives on being successful in trading. And just having positive expectancy is not the magic formula but a crucial one. |
|
|
|
|
20
|
Economy / Trading Discussion / Cleo.finance:Traders goal: A strategy with positive expectancy
|
on: December 20, 2022, 02:25:46 PM
|
Hey everyone, today I wanted to check what is the most important goal of a trading strategy. The source: blog.cleo.financeWhy do I need a trading strategy?Creating a trading strategy is like plotting a course on a map before setting sail. A trader needs a well-defined trading strategy because it provides a roadmap for decision-making and helps to navigate the complexities of the market. Without a clear plan or direction, traders may make impulsive or emotional decisions that put their capital at risk. A well-defined trading strategy allows traders to approach the market with a structured and disciplined approach. This makes it easier to make informed and consistent decisions based on the strategy's rules and guidelines. This helps traders to: - Navigate the market effectively
- Increasing their chances of success
- Maximizing their potential profits
Most traders dont fail at trading because it is hard. They fail because they are not willing to put in the work to create a detailed plan, test the plan, and then follow the plan. The most important goal is to develop a strategy with positive expectancy. In other words, a trading strategy should have a higher probability of making a profit than a loss. Without a well-researched and tested strategy, trading can feel like gambling, with unpredictable and potentially costly results (looking at you WSB!). In other words: You should not enter the competitive world of financial markets unless you have a trading strategy that produces positive expectancy! You need to know 3 things to determine if your strategy has a chance to be profitable: - Win rate the percentage of trades that are profitable
- Risk-reward ratio (RRR) the ratio of the average potential profit to the average potential loss on a trade
- Transaction costs commissions, fees, and other expenses associated with executing a trade
EXAMPLE:Trades: 100 Win rate: 50% RRR: 1:2 Transaction costs in total: 5% of balance for the 100 trades Expectancy = (Win rate x Win Size) (Loss rate x Loss size) TC = Expectancy per trade
Expectancy = (0,5 x 2) (0,5 x 1) 0,05 = 0,45 R per trade
Over the course of hundred trades, you would win half of them (50). But because you can win twice as much as youre risking (1:2 RRR), throughout the 100 trades you would on average win half of what youre risking (avg. profit of 0,5R). If you deduct the transaction costs, this comes down to 0,45R of profit for every open position*.* If you risked 100 USD per trade (R = 100 USD), on average you could expect to win 45 USD for every trade you open. The more data you have in hand the better the prediction can be, but these three data points should be enough to tell if the trading strategy is likely to be profitable over the long term or not. The confidence gained from knowing your trading strategy has a positive expectancy is why youre spending hours building and testing it. You dont have to decide on the spot, you just mechanically execute what your system tells you. |
|
|
|
|

