|
101
|
Other / Off-topic / Re: Daily Market Analysis By FXOpen
|
on: February 29, 2024, 11:15:32 AM
|
The American Currency Resumes Its Growth The American currency, despite a rather multidirectional fundamental data, resumes growth at the end of February. In the main currency pairs, one can observe both rebounds from key levels and continuation of the main trends. Thus, the USD/CAD pair managed to strengthen above 1.3500, the GBP/USD pair lost about 100 pp after rebounding from 1.2700, and EUR/USD buyers failed to strengthen above 1.0900. USD/CAD Fluctuations in the oil market contributed to the strengthening of the USD/CAD pair. At the beginning of the week, sellers of the pair tried to break the support at 1.3400, but, as we see, were unsuccessful. Yesterday, the price on the USD/CAD chart not only strengthened above 1.3500, but also updated the current years maximum at 1.3580. If the pair's buyers do not lose their upward momentum, the price may strengthen to 1.3770-1.3700. The upward scenario may be cancelled by consolidation below the level of 1.3400. Today, we can expect increased volatility in the pair. At 16:30 GMT+3, we are waiting for data on Canadian GDP for the fourth quarter of last year. At the same time, the basic price index of personal consumption expenditures in the US for January and indicators on applications for unemployment benefits for the current week will be published. 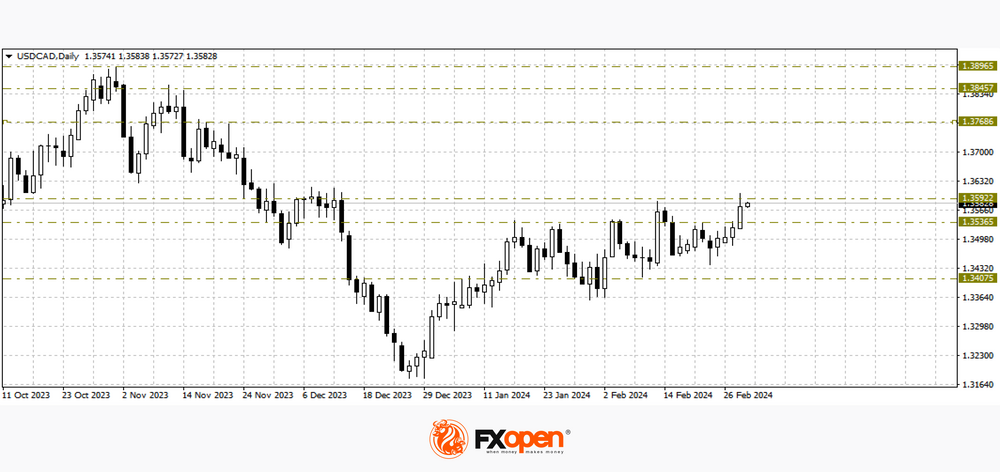 VIEW FULL ANALYSIS VISIT - FXOpen Blog...Disclaimer: This article represents the opinion of the Companies operating under the FXOpen brand only (excluding FXOpen EU). It is not to be construed as an offer, solicitation, or recommendation with respect to products and services provided by the Companies operating under the FXOpen brand, nor is it to be considered financial advice. VIEW FULL ANALYSIS VISIT - FXOpen Blog...Disclaimer: This article represents the opinion of the Companies operating under the FXOpen brand only (excluding FXOpen EU). It is not to be construed as an offer, solicitation, or recommendation with respect to products and services provided by the Companies operating under the FXOpen brand, nor is it to be considered financial advice.
|
|
|
|
|
102
|
Other / Off-topic / Re: Daily Market Analysis By FXOpen
|
on: February 29, 2024, 11:14:15 AM
|
BTC/USD Price Exceeds $60,000 Per Coin Several factors contributed to this: → Effect associated with the approval of Bitcoin ETF. The media writes that investments in these financial instruments amount to about 9k bitcoins per day, and miners produce only 900 bitcoins per day. The total investment in the Bitcoin ETF after approval on January 11 is approaching USD 50 billion. By comparison, just over USD 90 billion is invested in the 19 largest gold ETFs. → Expectations that Ethereum ETFs will be approved in the future, simplifying access to investments in the second largest cryptocurrency by capitalization. → Expectations for the Fed to cut interest rates. Cheaper credit means greater appetite for investment in higher-risk assets. → Expectations for the halving (scheduled for April), after which a bull market usually begins. In mid-February, we wrote that the price of Bitcoin did not show bullish progress after exceeding the psychological level of USD 50k per Bitcoin. Technical analysis of the Bitcoin chart shows that this was due to resistance (shown by the arrow) from the median line of the green ascending channel, within which the market has been developing since the fall of 2023. Yesterday's rise, which followed the breakdown of the psychological level of 60k US dollars per bitcoin, marked the upper limit of this channel just above 64k US dollars per bitcoin and made it possible to update its contours. 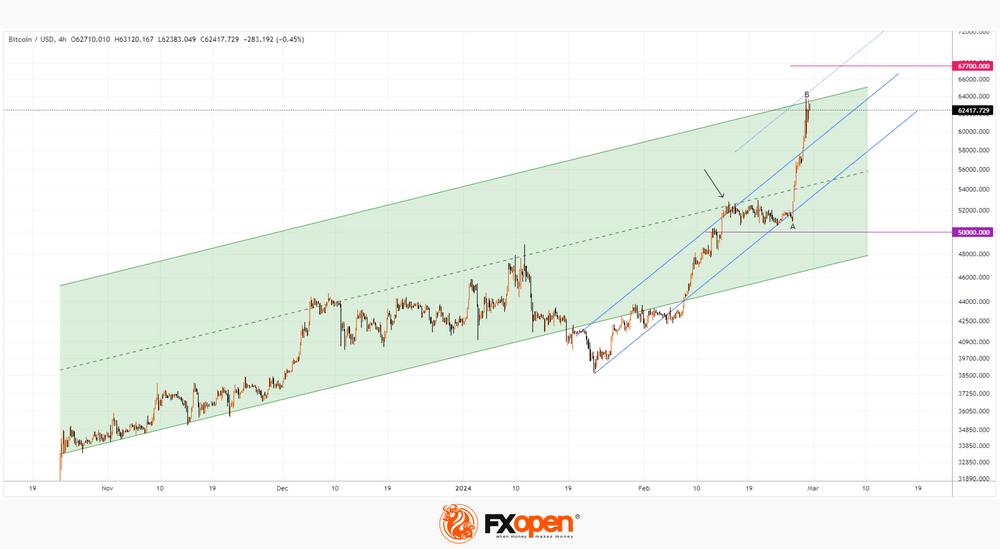 VIEW FULL ANALYSIS VISIT - FXOpen Blog...Disclaimer: This article represents the opinion of the Companies operating under the FXOpen brand only (excluding FXOpen EU). It is not to be construed as an offer, solicitation, or recommendation with respect to products and services provided by the Companies operating under the FXOpen brand, nor is it to be considered financial advice. VIEW FULL ANALYSIS VISIT - FXOpen Blog...Disclaimer: This article represents the opinion of the Companies operating under the FXOpen brand only (excluding FXOpen EU). It is not to be construed as an offer, solicitation, or recommendation with respect to products and services provided by the Companies operating under the FXOpen brand, nor is it to be considered financial advice.
|
|
|
|
|
103
|
Other / Off-topic / Re: Daily Market Analysis By FXOpen
|
on: February 28, 2024, 12:29:07 PM
|
Brent Crude Oil Makes Sudden Rally As OPEC Countries Mull Low Output Crude oil is a particularly unusual substance in that it is one of the only consumable commodities that institutions and private individuals widely trade across the spectrum of global markets, and it is a staple component as an energy resource in most aspects of everyday life, yet its value is maintained by a cartel made up of the central governments of the nations that extract it from the earth. This combination of completely unique circumstances and operational conditions means that the requirement for crude oil to perform its task as a basis for fuels combined with the method by which the OPEC+ countries are able to control its price via aligning to reduce or increase production and distribution makes for an interesting marketplace. This week, news surfaced across mainstream media around the possibility that the OPEC+ countries may consider an extension of the reduction in crude oil production and supply that is currently in place. The current level of production and supply that has been set by the OPEC+ countries is subject to a reduction, which was agreed on in November 2022 during a meeting of the OPEC+ nations led by the Russian Federation. At that time, a reduction of approximately 2.2 million barrels of crude oil per day was agreed. However, this week, there has been some thought that the OPEC+ nations may consider extending this reduced amount of production into the second quarter of this year. Fuel prices have steadily been rising on the consumer side, meaning that the cost of refined fuel oils has had to factor these reductions in, and perhaps motorists may have noticed that unleaded fuel and diesel oil for road vehicles have crept up in price very slightly over the past month or so, however, should the extension of a reduced output take place, the wider effect could make its way onto the financial markets, where oil is traded as a commodity. Over the course of the past day, US Brent Crude Oil has risen in price dramatically. According to FXOpen charts, Brent Crude Oil concluded the trading day on February 26 at $80.51 per barrel, whereas it begins the trading day today at $82.24 per barrel. VIEW FULL ANALYSIS VISIT - FXOpen Blog...Disclaimer: This article represents the opinion of the Companies operating under the FXOpen brand only (excluding FXOpen EU). It is not to be construed as an offer, solicitation, or recommendation with respect to products and services provided by the Companies operating under the FXOpen brand, nor is it to be considered financial advice.
|
|
|
|
|
104
|
Other / Off-topic / Re: Daily Market Analysis By FXOpen
|
on: February 28, 2024, 10:57:05 AM
|
Australian Dollar Weakens amid Inflation News According to data published today by the Australian Bureau of Statistics, the Consumer Price Index (CPI) value was: actual 3.4%, expected = 3.6%, a month ago = 3.4%, 2 months ago = 4.3%. Data shows Australia's consumer price growth rate is slowing, approaching targets of around 2%. This means less pressure on the Reserve Bank of Australia, which is pursuing tight monetary policy to combat inflation. Thus, the prospect of lower interest rates makes the Australian dollar weaker relative to other currencies. For example, the reaction to news about inflation in Australia, which was below expectations, was the fall in the price of AUD/USD. Technical analysis of the AUD/USD chart shows that: → the price of AUD/USD continues to develop in a downward channel (shown in red); → the price has broken through the important level 0.6535, which served as support since last week, but now, perhaps, will again begin to provide resistance, as it did in the first half of February; → in February, a bearish SHS pattern formed. 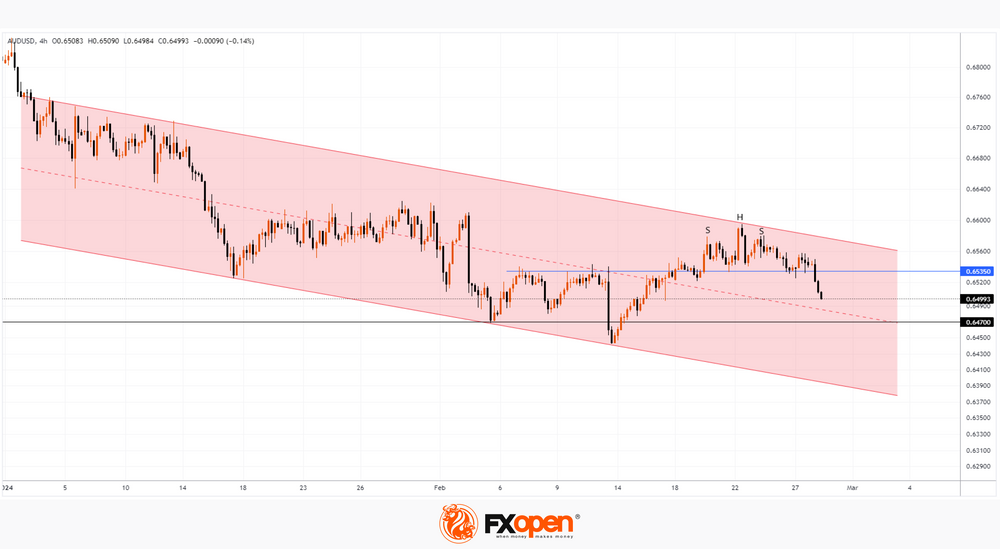 VIEW FULL ANALYSIS VISIT - FXOpen Blog...Disclaimer: This article represents the opinion of the Companies operating under the FXOpen brand only (excluding FXOpen EU). It is not to be construed as an offer, solicitation, or recommendation with respect to products and services provided by the Companies operating under the FXOpen brand, nor is it to be considered financial advice. VIEW FULL ANALYSIS VISIT - FXOpen Blog...Disclaimer: This article represents the opinion of the Companies operating under the FXOpen brand only (excluding FXOpen EU). It is not to be construed as an offer, solicitation, or recommendation with respect to products and services provided by the Companies operating under the FXOpen brand, nor is it to be considered financial advice.
|
|
|
|
|
105
|
Other / Off-topic / Re: Daily Market Analysis By FXOpen
|
on: February 28, 2024, 10:55:42 AM
|
AAPL Share Price Rises Nearly 1% after Scrapping Electric Vehicle Plans In 2021, the release of an electric car from Apple was expected in 2025, in 2022, the deadline was shifted to 2026. As it became known yesterday from Bloomberg and WSJ, Apple decided to completely abandon the project. Causes for this decision: → the electric vehicle market turned out to be not so turbulent; → production and technological difficulties; → the strong development of electric vehicle construction in China may also have played a role. Some employees will be fired, others will be transferred to a more promising department related to developments in the field of AI. Despite the fact that the ambitious project, which lasted about 10 years, failed, the price of AAPL shares rose by almost 1% yesterday as a result of trading perhaps investors positively assessed the reorientation from electric vehicles to a more promising direction related to AI.  VIEW FULL ANALYSIS VISIT - FXOpen Blog...Disclaimer: This article represents the opinion of the Companies operating under the FXOpen brand only (excluding FXOpen EU). It is not to be construed as an offer, solicitation, or recommendation with respect to products and services provided by the Companies operating under the FXOpen brand, nor is it to be considered financial advice. VIEW FULL ANALYSIS VISIT - FXOpen Blog...Disclaimer: This article represents the opinion of the Companies operating under the FXOpen brand only (excluding FXOpen EU). It is not to be construed as an offer, solicitation, or recommendation with respect to products and services provided by the Companies operating under the FXOpen brand, nor is it to be considered financial advice.
|
|
|
|
|
106
|
Other / Off-topic / Re: Daily Market Analysis By FXOpen
|
on: February 28, 2024, 10:54:08 AM
|
Market Analysis: Gold Price and Crude Oil Price Eye More Upsides Gold price started a decent increase above the $2,028 resistance level. Crude oil prices are gaining bullish momentum and might rise toward $80.00.Important Takeaways for Gold and Oil Prices Analysis Today Gold price started a decent increase above the $2,028 resistance level. Crude oil prices are gaining bullish momentum and might rise toward $80.00.Important Takeaways for Gold and Oil Prices Analysis Today- Gold price started a decent increase from the $2,015 zone against the US Dollar.
- A key contracting triangle is forming with support near $2,028 on the hourly chart of gold at FXOpen.
- Crude oil prices rallied above the $76.55 and $77.00 resistance levels.
- There is a key bullish trend line forming with support at $77.80 on the hourly chart of XTI/USD at FXOpen.
Gold Price Technical Analysis On the hourly chart of Gold at FXOpen, the price found support near the $2,015 zone. The price formed a base and started a fresh increase above the $2,020 level. There was a decent move above the 50-hour simple moving average and $2,028. The bulls pushed the price above the $2,035 resistance zone. Finally, the bears appeared near $2,040, A high was formed near $2,039.44 and the price is now consolidating gains. The recent low was formed at $2,028 and the price is now consolidating near the 23.6% Fib retracement level of the downward move from the $2,039 swing high to the $2,028 low. The RSI is still stable near 40 and the price could aim for more gains. Immediate resistance is near the $2,035 level. It is close to the 61.8% Fib retracement level of the downward move from the $2,039 swing high to the $2,028 low. The next major resistance is near the $2,040 level. An upside break above the $2,040 resistance could send Gold price toward $2,050. Any more gains may perhaps set the pace for an increase toward the $2,065 level. Initial support on the downside is near the $2,028 zone. There is also a key contracting triangle forming with support near $2,028. If there is a downside break below the $2,028 support, the price might decline further. In the stated case, the price might drop toward the $2,015 support. VIEW FULL ANALYSIS VISIT - FXOpen Blog...Disclaimer: This article represents the opinion of the Companies operating under the FXOpen brand only (excluding FXOpen EU). It is not to be construed as an offer, solicitation, or recommendation with respect to products and services provided by the Companies operating under the FXOpen brand, nor is it to be considered financial advice.
|
|
|
|
|
107
|
Other / Off-topic / Re: Daily Market Analysis By FXOpen
|
on: February 27, 2024, 03:53:21 PM
|
European Stock Markets on All-Time Roll Despite Economic Bleakness There has been so much clamour over the past few months relating to the flagging European economy and stagnating British economy compared to the surprisingly healthy economic situation in the United States that it would be very easy to get buried in the deluge of news articles displaying woe which have been accompanied by a rising US Dollar against a declining Euro and Pound. However, to write off the European economy as second fiddle to that of the United States purely on the grounds of a rising Dollar, some return to form for tech stocks and a relatively mediocre set of meeting notes from the Federal Open Market Committee, which reiterated the lack of a reduction in interest rates for the near future, would be churlish, to say the least. On the European side of the Atlantic, a more thorough inspection of the overall market conditions would soon put the flagging Euro and mainstream media speculation of recession into perspective. Over the past few weeks, European stocks have been increasing in value to the extent that some indices have registered an all-time high. The CAC 40 index in France concluded the European session yesterday at 7,960.8 according to FXOpen charts, which is an all-time record high for the index, which comprises the 40 most highly capitalised stocks listed on French stock exchanges. VIEW FULL ANALYSIS VISIT - FXOpen Blog...Disclaimer: This article represents the opinion of the Companies operating under the FXOpen brand only (excluding FXOpen EU). It is not to be construed as an offer, solicitation, or recommendation with respect to products and services provided by the Companies operating under the FXOpen brand, nor is it to be considered financial advice.
|
|
|
|
|
108
|
Other / Off-topic / Re: Daily Market Analysis By FXOpen
|
on: February 27, 2024, 03:07:37 PM
|
AMZN Share Price Hits 25-Month High After Inclusion in DJIA Index As of February 26, Walgreens Boots Alliance (WBA) is no longer used in the calculation of the Dow Jones Industrial Average, replaced by Amazon (AMZN). The planned index rebalancing was carried out because: → Walgreens shares currently have the lowest price among all companies included in the Dow index; → S&P Dow Jones Indices adds Amazon as it seeks to increase the Dow's retail exposure to reflect the emerging nature of the US economy. This was also influenced by the fact that shares of the retail chain Walmart (WMT) underwent a 3:1 split. The AMZN stock chart today shows that: → the AMZN stock price is moving in an upward trend, its contours are indicated by a blue channel; → after a strong report (we wrote about this on February 5), a bullish gap formed on the chart it is now more clearly visible between the levels of 161.5 and 166.5; → in the last days of winter, the price approached the upper border of the channel; → the price is in the upper half of the channel, and the median line (reinforced by the gap area), according to technical analysis, has the potential to provide support to it;  VIEW FULL ANALYSIS VISIT - FXOpen Blog...Disclaimer: This article represents the opinion of the Companies operating under the FXOpen brand only (excluding FXOpen EU). It is not to be construed as an offer, solicitation, or recommendation with respect to products and services provided by the Companies operating under the FXOpen brand, nor is it to be considered financial advice. VIEW FULL ANALYSIS VISIT - FXOpen Blog...Disclaimer: This article represents the opinion of the Companies operating under the FXOpen brand only (excluding FXOpen EU). It is not to be construed as an offer, solicitation, or recommendation with respect to products and services provided by the Companies operating under the FXOpen brand, nor is it to be considered financial advice.
|
|
|
|
|
109
|
Other / Off-topic / Re: Daily Market Analytics - Forex
|
on: February 26, 2024, 07:30:35 PM
|
GBPUSD Technical Analysis 26th FEB, 2024GBPUSD Aroon Indicator Bullish Trend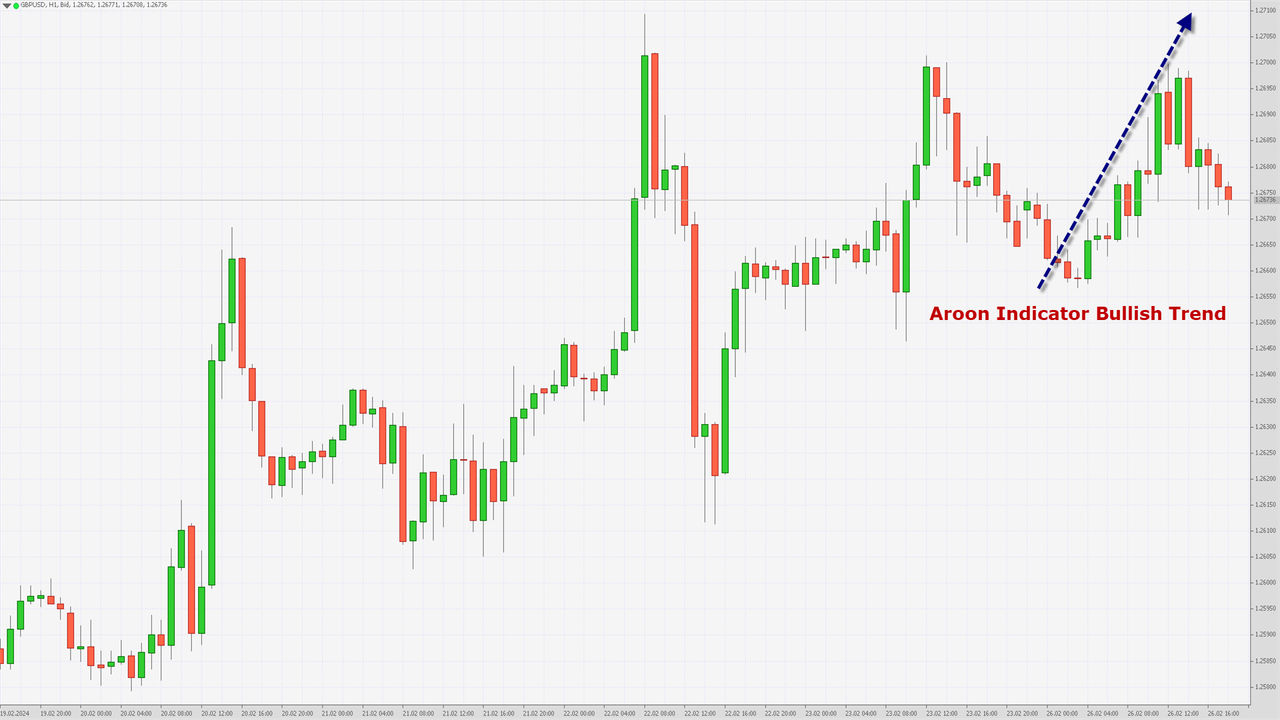 GBPUSD started his week into a consolidation channel after which we can see some upside moves touching a high of 1.2698 in the US Trading session. Now again the prices of Pound have entered into a consolidation wave which is expected to last for around 12 hrs. We can see the formation of Aroon indicator Bullish Trend in the 2-hourly timeframe. The prices of GBPUSD are ranging near the support of channel in the 15-minutes timeframe. We can see the formation of Bullish price crossover pattern with the Moving Average MA50 in the daily timeframe. GBPUSD is now trading above its 100-hour SMA and below its 200-hour SMA simple moving average. - Pound bullish reversal seen above the 1.2657 mark.
- Short-term range appears to be Mild Bullish.
- GBPUSD continues to remain above the 1.2650 levels.
- Average true range ATR is indicating high market volatility.
GBPUSD is now trading below its Pivot levels of 1.2674 and is moving into a Bullish channel. The price of GBPUSD is aiming to cross its Classic resistance levels of 1.2677 and the next target is located at 1.2702 which is a 38.2% Retracement From 13 Week High. Note: This Analytics is created by me and is based on my own personal Forex trading experience of 10 years. I am using my trading experience to help Experienced and Newbie traders and they should know about the risks of Forex trading.For in-depth analysis, please check FXOpen Blog
|
|
|
|
|
110
|
Other / Off-topic / Re: Daily Market Analytics - Forex
|
on: February 26, 2024, 07:29:32 PM
|
EURUSD Technical Analysis 26th FEB, 2024EURUSD Bullish Trend Reversal EURUSD started this week moving into a consolidation channel after which we can see a breakout in the form of a bullish momentum touching a high of 1.0859 today in the US Trading session. We are now looking for some market consolidation as the prices have corrected lower, after which a fresh upside wave is expected towards the 1.0917 which is a 50% Retracement From 13 Week High/Low. We have seen a Bullish opening of the markets this week. The Momentum indicator is back over zero in the weekly timeframe indicating the bullish tone present in the markets with immediate targets of 1.0917. The prices of EURUSD are ranging near the support of the triangle and channel in the weekly timeframe. In the short term we are now looking at some market consolidation after which the prices will start moving upwards with immediate targets of 1.0897 which is a 1 Months high. EURUSD is now trading above its 100-hour SMA and 200-hour SMA simple moving averages. - Euro bullish reversal seen above the 1.0814 mark.
- Short-term range appears to be Neutral.
- EURUSD continues to remain above the 1.0830 levels.
- Average true range ATR is indicating high market volatility.
The next resistance is located at 1.0917 which is a 50% Retracement From 13 Week High/Low. EURUSD is now trading below its Pivot levels of 1.0848 and is moving into a Mild Bullish Channel. The price of EURUSD remains above its Classic support levels of 1.0840 and is moving towards its next target of 1.0897. Note: This Analytics is created by me and is based on my own personal Forex trading experience of 10 years. I am using my trading experience to help Experienced and Newbie traders and they should know about the risks of Forex trading.For in-depth analysis, please check FXOpen Blog
|
|
|
|
|
111
|
Other / Off-topic / Re: Daily Market Analysis By FXOpen
|
on: February 26, 2024, 02:40:36 PM
|
Exchange Rates Consolidate at the Beginning of the Week Trading participants continue to evaluate the prospects for a change in the US Federal Reserve's monetary course against the backdrop of the publication of the minutes of the January meeting. Officials reiterated their cautious stance on lowering borrowing costs and, moreover, expressed concern about the possibility of shifting too early to dovish rhetoric. The document strengthened investor confidence that the adjustment of parameters could be postponed until the second half of the year, which strengthens the US dollars position against its main competitors: at the moment, more and more investors are counting on the first adjustment to borrowing costs in June, but these expectations are also regularly revised. In the US, the publication of January statistics on the dynamics of sales of new homes is expected during the day: in the previous period, the figure increased by 8.0% month-on-month to 0.644 million units. On Tuesday, February 27, the US will release February statistics on durable goods orders and consumer confidence. Forecasts suggest a slowdown in the dynamics of orders for durable goods excluding transport from 0.5% to 0.2%. EUR/USDThe EUR/USD pair shows a slight decline, holding at 1.0820. Immediate resistance can be seen at 1.0888, a break higher could trigger a rise towards 1.0960. On the downside, immediate support is seen at 1.0812, a break below could take the pair towards 1.0760. Today investors will pay attention to the speech of ECB head Christine Lagarde. In the EU, February data on inflation dynamics will be presented at the end of the week: the consumer price index is expected to slow down from 2.8% to 2.5% in annual terms, and the core indicator - from 3.3% to 2.9%. Traders continue to evaluate German data on GDP and business optimism released on Friday. Thus, the German economy in the fourth quarter of 2023 lost another 0.3% on a quarterly basis and 0.4% on an annual basis. The IFO business optimism index in February adjusted from 85.2 points to 85.5 points, which coincided with analysts forecasts, the indicator for assessing the current situation remained at 86.9 points with expectations at 86.7 points, and the economic expectations index increased from 83.5 points to 84.1 points, while experts expected 84.0 points. Technical analysis of EUR/USD shows that a new upward channel has formed based on last weeks highs. Now the price is near the lower border and may continue to rise.  VIEW FULL ANALYSIS VISIT - FXOpen Blog...Disclaimer: This article represents the opinion of the Companies operating under the FXOpen brand only (excluding FXOpen EU). It is not to be construed as an offer, solicitation, or recommendation with respect to products and services provided by the Companies operating under the FXOpen brand, nor is it to be considered financial advice. VIEW FULL ANALYSIS VISIT - FXOpen Blog...Disclaimer: This article represents the opinion of the Companies operating under the FXOpen brand only (excluding FXOpen EU). It is not to be construed as an offer, solicitation, or recommendation with respect to products and services provided by the Companies operating under the FXOpen brand, nor is it to be considered financial advice.
|
|
|
|
|
112
|
Other / Off-topic / Re: Daily Market Analysis By FXOpen
|
on: February 26, 2024, 01:24:03 PM
|
The US Continues to Trump the Euro Economy on Key Metrics, But What Is Next? A clear measure of public confidence in a national economy, as well as the ability to access a key component of it, is how many new homes are being sold compared to previous months. There are a number of important factors that point to the overall health of a nation and its population's finances, which are demonstrated by this, for example, the ability for people to access mortgages and pay reasonable interest on the repayments, creditworthiness and the ability to repay those mortgages, and enough confidence that there will be a market for the homes that a construction company would see fit to invest in buying the land and endure the upfront costs of building homes. Today, in the United States, new home sales figures for January 2024 will be announced, and the expected figure, according to many economic calendars, is around 680,000 new homes sold in January this year compared to 664,000 in the same period last year. Interest rate increases have burdened mortgage holders as well as those making repayments on unsecured borrowing over recent years, and the same interest rate increases have caused corporations - including homebuilders - to have to pay more toward their monthly borrowing over this period of high-interest rates. By their very nature, interest rate rises are designed to curb spending in order to reduce inflation, and in the context of property construction and purchase by domestic customers, it is clear that a rising interest rate would likely have an effect on buyers as well as construction companies. However, the strength of the US economy has once again shown its mettle over the past few days, as the US Dollar has been strong against other majors. Looking at the EURUSD pair, considerable volatility has been evident. At 9.10 am UK time this morning, the EURUSD was trading at 1.08347, which shows a slight upturn in fortune for the Euro, which on February 20 had stood at 1.07750. VIEW FULL ANALYSIS VISIT - FXOpen Blog...Disclaimer: This article represents the opinion of the Companies operating under the FXOpen brand only (excluding FXOpen EU). It is not to be construed as an offer, solicitation, or recommendation with respect to products and services provided by the Companies operating under the FXOpen brand, nor is it to be considered financial advice.
|
|
|
|
|
113
|
Other / Off-topic / Re: Daily Market Analysis By FXOpen
|
on: February 26, 2024, 10:27:15 AM
|
NZD/USD Technical Analysis: Bearish Start To News-heavy Week After 8 consecutive days of growth, the price of NZD/USD is forming a bearish candle this morning, thereby indicating possible concerns among market participants at the beginning of a week full of important economic news: → On Wednesday, at 4:00 GMT+3, the RBNZ decision on interest rates will be published. There will also be a press conference by the leadership of the Central Bank. → On the same day, at 16:30 GMT+3, news about US GDP is expected. → On Thursday, at 16:30 GMT+3, inflation data in the United States will be published, namely Core PCE Price Index GMT+3. Note that in 2023, the NZD/USD price behaved bearishly, forming a downward channel (shown in red).  VIEW FULL ANALYSIS VISIT - FXOpen Blog...Disclaimer: This article represents the opinion of the Companies operating under the FXOpen brand only (excluding FXOpen EU). It is not to be construed as an offer, solicitation, or recommendation with respect to products and services provided by the Companies operating under the FXOpen brand, nor is it to be considered financial advice. VIEW FULL ANALYSIS VISIT - FXOpen Blog...Disclaimer: This article represents the opinion of the Companies operating under the FXOpen brand only (excluding FXOpen EU). It is not to be construed as an offer, solicitation, or recommendation with respect to products and services provided by the Companies operating under the FXOpen brand, nor is it to be considered financial advice.
|
|
|
|
|
114
|
Other / Off-topic / Re: Daily Market Analysis By FXOpen
|
on: February 26, 2024, 08:32:50 AM
|
Bitcoin Price Risks Not Staying above $50kOn February 14, a strong bullish impulse was recorded in the BTC/USD market, which pushed the price of bitcoin to the area above USD 50k. The main driver of growth was the effect of the launch of a bitcoin ETF. More than a month has passed since this event, and according to media reports, the ETF has seen an influx of more than USD 7 billion. For example, BlackRock has about 125k bitcoins on its balance sheet to support its ETF fund. Also adding to the positive mood among market participants is news about the benefits received by companies that invested in bitcoin: MicroStrategy, Block and others. Among the latest news is Reddit's decision to invest in bitcoin. VIEW FULL ANALYSIS VISIT - FXOpen Blog...Disclaimer: This article represents the opinion of the Companies operating under the FXOpen brand only (excluding FXOpen EU). It is not to be construed as an offer, solicitation, or recommendation with respect to products and services provided by the Companies operating under the FXOpen brand, nor is it to be considered financial advice.
|
|
|
|
|
115
|
Other / Off-topic / Re: Daily Market Analysis By FXOpen
|
on: February 23, 2024, 04:44:45 PM
|
Nvidia's Successes Helps S&P 500 Price Reach Its All-time High Yesterday, the price of the S&P 500 stock index rose to record closing highs on Thursday. Moreover, such a growth rate (+2.11% per day) has not been observed for 13 months. Reasons for Extremely Bullish Sentiment: → Nvidia's report, which showed impressive earnings and prospects (the company forecasts roughly threefold revenue growth in the first quarter of 2024 amid strong demand for its AI chips). Nvidia's capitalization grew by USD 277 billion in one day a historical record for the US stock market. → Positive news background for yesterday: the US Flash Manufacturing PMI index was actually = 51.5, expected = 50.5, a month ago = 50.7. Signals from the labor market were also positive - the weekly number of applications for unemployment benefits turned out to be = 201k (expected = 217k). Technical analysis of the S&P 500 chart shows that the price continues to move within the ascending channel, which has been in effect since the beginning of 2024 (shown in blue).  VIEW FULL ANALYSIS VISIT - FXOpen Blog...Disclaimer: This article represents the opinion of the Companies operating under the FXOpen brand only (excluding FXOpen EU). It is not to be construed as an offer, solicitation, or recommendation with respect to products and services provided by the Companies operating under the FXOpen brand, nor is it to be considered financial advice. VIEW FULL ANALYSIS VISIT - FXOpen Blog...Disclaimer: This article represents the opinion of the Companies operating under the FXOpen brand only (excluding FXOpen EU). It is not to be construed as an offer, solicitation, or recommendation with respect to products and services provided by the Companies operating under the FXOpen brand, nor is it to be considered financial advice.
|
|
|
|
|
116
|
Other / Off-topic / Re: Daily Market Analysis By FXOpen
|
on: February 23, 2024, 08:47:59 AM
|
Market Analysis: AUD/USD and NZD/USD Grind Higher Steadily AUD/USD is moving higher and might rally if it clears 0.6600. NZD/USD is also rising and could extend its increase above the 0.6220 resistance zone.Important Takeaways for AUD/USD and NZD/USD Analysis Today AUD/USD is moving higher and might rally if it clears 0.6600. NZD/USD is also rising and could extend its increase above the 0.6220 resistance zone.Important Takeaways for AUD/USD and NZD/USD Analysis Today- The Aussie Dollar is moving higher from the 0.6540 zone against the US Dollar.
- There is a key bullish trend line forming with support at 0.6555 on the hourly chart of AUD/USD at FXOpen.
- NZD/USD is showing positive signs above the 0.6180 support.
- There is a major bullish trend line forming with support at 0.6190 on the hourly chart of NZD/USD at FXOpen.
AUD/USD Technical Analysis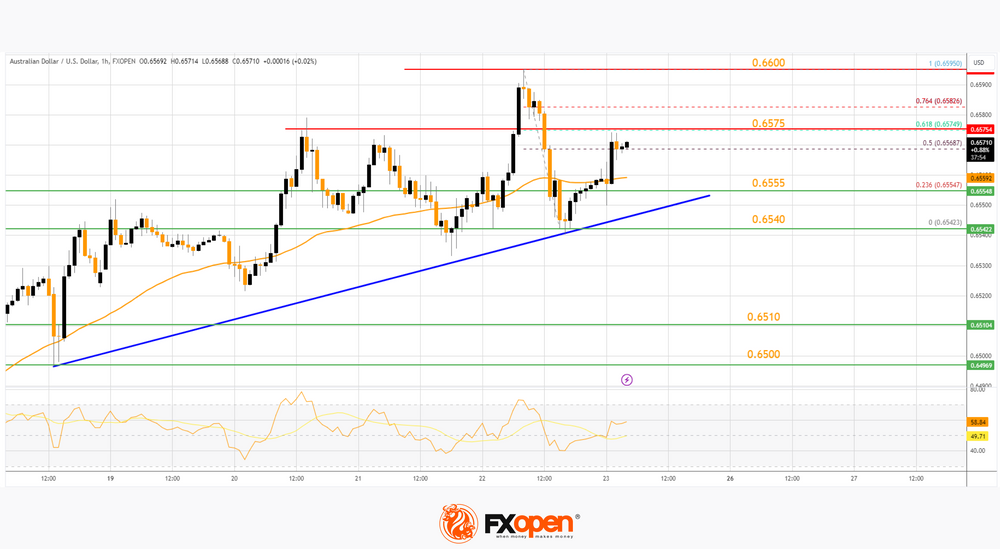 On the hourly chart of AUD/USD at FXOpen, the pair remained stable near the 0.6500 zone, as discussed in the previous analysis. The Aussie Dollar formed a base and started a decent increase above the 0.6540 resistance against the US Dollar The bulls pushed the pair above the 0.6550 resistance zone. There was a close above the 0.6565 resistance and the 50-hour simple moving average. The pair is now consolidating near the 50% Fib retracement level of the downward move from the 0.6595 swing high to the 0.6542 low. On the upside, the AUD/USD chart indicates that the pair is now facing resistance near 0.6575. The 61.8% Fib retracement level of the downward move from the 0.6595 swing high to the 0.6542 low is also near 0.6575. The first major resistance might be 0.6600. An upside break above the 0.6600 resistance might send the pair further higher. The next major resistance is near the 0.6650 level. Any more gains could clear the path for a move toward the 0.6720 resistance zone. If not, the pair might correct lower below the 50-hour simple moving average at 0.6555. There is also a key bullish trend line forming with support at 0.6555. The next support could be 0.6540. If there is a downside break below the 0.6540 support, the pair could extend its decline toward the 0.6510 zone. Any more losses might signal a move toward 0.6450. VIEW FULL ANALYSIS VISIT - FXOpen Blog...Disclaimer: This article represents the opinion of the Companies operating under the FXOpen brand only (excluding FXOpen EU). It is not to be construed as an offer, solicitation, or recommendation with respect to products and services provided by the Companies operating under the FXOpen brand, nor is it to be considered financial advice.
|
|
|
|
|
117
|
Other / Off-topic / Re: Daily Market Analytics - Forex
|
on: February 22, 2024, 09:21:02 PM
|
GBPUSD Technical Analysis 22nd FEB, 2024GBPUSD Bullish Trend Reversal GBPUSD had a strong bullish momentum today when the prices touched a high of 1.2708 after which we saw a downwards retracement in its levels touching a low of 1.2611. We can see that the prices remained in a consolidation channel after which we can see the resumption of the bullish trend. We can see the formation of Bullish Trend Reversal pattern with the Adaptive Moving Average AMA20 and AMA50 in the daily timeframe. The prices of GBPUSD are ranging near the support of triangle in the weekly timeframe. The price is back over the Pivot point in the weekly timeframe indicating the bullish tone present in the markets with immediate targets of 1.2696. GBPUSD is now trading above its 100-hour SMA and below its 200-hour SMA simple moving average. - Pound bullish reversal seen above the 1.2611 mark.
- Short-term range appears to be Mild Bullish.
- GBPUSD continues to remain above the 1.2600 levels.
- Average true range ATR is indicating high market volatility.
GBPUSD is now trading below its Pivot levels of 1.2660 and is moving into a Bullish channel. The price of GBPUSD is aiming to cross its Classic resistance levels of 1.2664 and the next target is located at 1.2696 which is a 14-3 Day Raw Stochastic at 70%. Note: This Analytics is created by me and is based on my own personal Forex trading experience of 10 years. I am using my trading experience to help Experienced and Newbie traders and they should know about the risks of Forex trading.For in-depth analysis, please check FXOpen Blog
|
|
|
|
|
118
|
Other / Off-topic / Re: Daily Market Analytics - Forex
|
on: February 22, 2024, 09:19:09 PM
|
EURUSD Technical Analysis 22nd FEB, 2024EURUSD Resistance of Channel is Broken EURUSD had strong bullish momentum today and managed to touch a high of 1.0885 after which we saw downwards retracement towards a low of 1.0802 levels. We can see that the prices of Euro have now entered into a consolidation channel after which we will be able to see some fresh upside moves. The resistance of the channel is broken in the daily timeframe. The Momentum indicator is back over zero in the 4-hourly timeframe indicating the bullish tone present in the markets with immediate targets of 1.0857. The prices of EURUSD are ranging near the support of the triangle and channel in the weekly timeframe. In the short term we are now looking at some market consolidation after which the prices will start moving upwards with immediate targets of 1.0857 which is a 14-3 Day Raw Stochastic at 80%. EURUSD is now trading above its 100-hour SMA and 200-hour SMA simple moving averages. - Euro bullish reversal seen above the 1.0802 mark.
- Short-term range appears to be Mild Bullish.
- EURUSD continues to remain above the 1.0800 levels.
- Average true range ATR is indicating high market volatility.
The next resistance is located at 1.0841 which is a 38.2% Retracement From 4 Week High. EURUSD is now trading below its Pivot levels of 1.0822 and is moving into a Mild Bullish Channel. The price of EURUSD remains above its Classic support levels of 1.0819 and is moving towards its next target of 1.0857. Note: This Analytics is created by me and is based on my own personal Forex trading experience of 10 years. I am using my trading experience to help Experienced and Newbie traders and they should know about the risks of Forex trading.For in-depth analysis, please check FXOpen Blog
|
|
|
|
|
119
|
Other / Off-topic / Re: Daily Market Analysis By FXOpen
|
on: February 22, 2024, 03:19:43 PM
|
Commodity Currencies Strengthen after the FOMC Minutes Publication The fundamental data of recent trading sessions contributed to a slight strengthening of commodity and European currencies. Thus, the AUD/USD pair, after forming a bullish engulfing combination, managed to confidently gain a foothold above 0.6500. The pound/US dollar currency pair retested the support at 1.2540 and went above 1.2600, and greenback sellers in the US dollar/loonie pair are trying to break the support at 1.3500. GBP/USD The price of the pound on the GBP/USD chart has been trading for the third week in a rather narrow range of 1.2680-1.2540. Apparently, to enter new positions, investors need a more important foundation than the publication of the FOMC protocols. The head of the Bank of England, Andrew Bailey, whose speech took place on Tuesday at 13:15 GMT+3, also failed to inspire market participants to make new entries. Today at 12:30 GMT+3, we are waiting for the publication of data on the business activity index in the UK services sector for February. At 17:45 GMT+3, the business activity index (PMI) in the US services sector for the same period will be released. Also at 18:00 GMT+3, data on sales on the secondary housing market for January will be published, and at the very beginning of the American session, weekly figures on the number of applications for unemployment benefits will be released. VIEW FULL ANALYSIS VISIT - FXOpen Blog...Disclaimer: This article represents the opinion of the Companies operating under the FXOpen brand only (excluding FXOpen EU). It is not to be construed as an offer, solicitation, or recommendation with respect to products and services provided by the Companies operating under the FXOpen brand, nor is it to be considered financial advice.
|
|
|
|
|
120
|
Other / Off-topic / Re: Daily Market Analysis By FXOpen
|
on: February 22, 2024, 10:59:34 AM
|
EUR/USD Analysis: Euro Showing Signs of Strength Today news was published about the values of PMI indices for European economies. Data from France was encouraging: → French Flash Manufacturing PMI: actual = 46.8, expected = 43.5, a month ago = 43.1; → French Flash Services PMI: actual = 48.0, expected = 45.7, a month ago = 45.4. Data from Germany were less optimistic, so the euro's rise was interrupted, but in the end the euro still rose in price on this news relative to other currencies. For example, the price of EUR/JPY broke through the resistance level of 163 yen per euro the euro rose to this level for the first time since November last year. 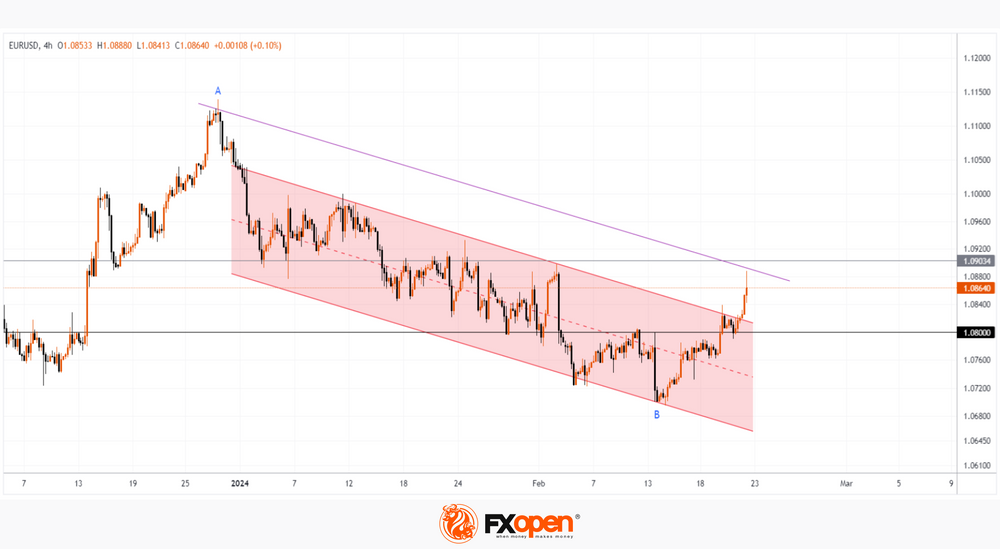 VIEW FULL ANALYSIS VISIT - FXOpen Blog...Disclaimer: This article represents the opinion of the Companies operating under the FXOpen brand only (excluding FXOpen EU). It is not to be construed as an offer, solicitation, or recommendation with respect to products and services provided by the Companies operating under the FXOpen brand, nor is it to be considered financial advice. VIEW FULL ANALYSIS VISIT - FXOpen Blog...Disclaimer: This article represents the opinion of the Companies operating under the FXOpen brand only (excluding FXOpen EU). It is not to be construed as an offer, solicitation, or recommendation with respect to products and services provided by the Companies operating under the FXOpen brand, nor is it to be considered financial advice.
|
|
|
|
|

