Preliminary report - version 2015-05-04. Edits from previous versions:
* 2015-04-22 Fixed caption of Figure 4, added Figure 5.
* 2015-04-23 Added the section "Justification of the model"
* 2015-05-04 Better tuning of parameters (no more rising tails). Extended price series to 2015-04-20 and added one more "standard" bubble covering the last month. Added unsmoothed plots (Figures 2 and 8 ). Added section "Modeling the 2014--2015 price variations" with a 20-bubble model (in blue).
* 2020-10-21 Fixed image links.
A descriptive sum-of-bubbles model for the price of bitcoinFigure 1 below shows that the price history of bitcoin can be described fairly accurately by a model consisting of the sum of several idealized
bubbles, each consisting of an exponential
rise, an optional flat
plateau, and an exponential
tail.
 [ Figure 1. A bubble model for the price of bitcoin, showing the smoothed actual price (grey), the modeled price (green), and the individual bubbles. The brown line near the bottom is the ratio of the actual price to the model price. Click on the image for a full-size version. ]
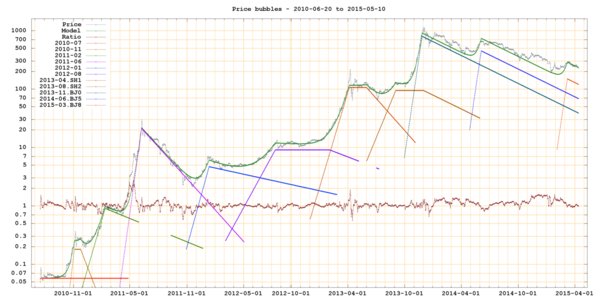 [ Figure 2. The same data and model in Figure 1, without smoothing. Click on the image for a full-size version. ]
Figures 3--6 below show three of those bubbles in linear scale. Note that, on a log scale plot, such as Figure 1, the rise and tail of a single bubble are plotted as straight lines, but they are distorted into curves when added to other bubbles.
 [ Figure 3. The bubble "2011-06" that peaked around June 08, 2011. Click on the image for a full-size version. ]
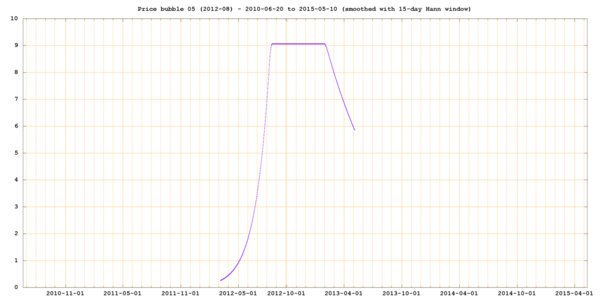 [ Figure 4. The bubble "2012-08" that peaked around 2012-09-09. Click on the image for a full-size version. ]
 [ Figure 5. The bubble "2013-04", with a plateau from about April 5th to May 31st, 2013. Click on the image for a full-size version. ]
 [ Figure 6. The bubble "2013-11" that peaked on November 28, 2013, 2013 (the all-time high). Click on the image for a full-size version. ]
The above model has 11 such bubbles. The first one (red) accounts for the price between 2010-07-15 to 2010-09-30, and is essentially flat at about 0.06 $/BTC in that period. All other bubbles have a relatively fast ascending rise, with the price increasing between 2% and 10% per day, and a tail that decays more gradually. Four of them have a flat plateau.
In the mathematical model each bubble extends over the entire range of dates considered, but is plotted only while it makes a significant contribution to the model price, specifically at least 5% of it. Under this criterion, each bubble effectively starts to be relevant and noticeable a few months before the peak, and stop being relevant a few months after the peak.
The brown line in Figures 1 shows that the difference between the model price (green) and the actual smoothed price (grey) is rarely 50% down or 100% up, which is actually quite good considering that the price varied by a factor of about 20'000 = ~2'000'000% (from ~0.06 to ~1200 $/BTC) in the span of that plot. The largest diferences occur just after the peaks of some bubbles (due to the strong oscillations in the price which are not represented in the model), during the rise of the "2011-06" bubble (which may be two nearly coincident bubbles), and in 2014--2015 (when there were large swings due to the MtGOX collapse, and to rumors and anti-rumors about tightening of the Chinese government decrees). The 2014--2015 swings can be accurately modeled by adding a few more elements to the model; see below.
Justification of the modelThere are infinitely many ways to approximate a function by a linear combination of "basis" functions. One may ask what is special about this
bubble basis in particular.
For starters, the bubble basis elements are everywhere positive, and the least-squares fit uses them with positive coefficients. Other general purpose bases -- such as Gaussian humps, wavelets, B-splines -- would probably require both positive and negative coefficients .
Moreover, the bubble basis above yields a fairly god unweighted least-squares fit, with small
relative error, even though the target function varies by a factor of 20'000 over the domain considered. Usually, least-squares approximations would spread the
absolute error evenly over the domain, which would result in errors of tens of dollars even in the early years where the price was below 1 dollar. (The plot above uses weighted least squares to improve the fit in the early years; however, the unweighted least-squares approximation, not shown, is nearly indistiguishable from that plot, except in the first 3 months Jul--Sep 2010.)
The basis is also very economical (only 11 elements with 45 total parameters) and is directly determined by salient features of the price series. There are ten salient "bubble-like events", characterized by a period of rapidly increasing price, lasting for a month or more and raising the price by 50% or more, that ends abruptly, creating an evident "kink" in the log-scale plot. (The last two, peaking in early June 2014 and April 2015, are somewhat anomalous and less definite, as discussed below; but they still can be included in this description.) Just before each kink, the log-scale plot is approximately straight and ascending, which means nearly-exponential growth. In all those ten cases, the kink is followed by a descending line, initially straight; either immediately, or (in four cases) after a period when the price is nearly constant (once one discounts the influence of nearby bubbles).
After rising from January to late April 2013, and oscillating for about one month, the price spent another month at about 120 $/BTC, then gradually dipped between early June and July, gradually recovered by late August, and remained stable at about 120 $/BTC again, until October 2013, when the next bubble started. This sequence may have been a single bubble-like event spanning those 10 months, with a temporary remission in the middle of its plateau. However, it can be modeled fairly well by two flat-top bubble functions, with about the same amplitude. The start of the sencond bubble's tail is not discernible in the data; it was arbitrarily set to begin around the date of PBoC's first decree (early December 2013) and decay with the same rate as the other Chinese bubbles.
There was also a sharp rise starting in 2014-05-20, that lifted the price fron ~450 $/BTC to ~660 $/BTC in about 10 days. While the peak of this "mini-bubble" was not as sharp as that of other bubbles, the rise and subsequent slow decay can be modeled fairly well by a bubble function "2014-06" with the same rise and decay rates as the main Chinese bubble "2013-11". Another similar mini-bubble "2015-03", also with approximately the same rise and decay rates, may have started in February 2015 and peaked on 2015-03-08 (althoug this identification is still quite uncertain.)
The basis merely includes one element for each of those bubble-like events, plus a constant term for the part before the first bubble (Jul--Sep 2010). Note that each pronounced discontinuity in the data calls for at least one basis element with a similar discontinuity. The typical basis element has four adjustable parameters: its magnitude (the coefficient of the linear combination), the date of the peak, and the rates of the two exponentials. The four bubble elements with a constant section have one additional parameter each, the duration of that section. Thus, the model has 1 + 4 x 10 + 4 = 45 adjustable parameters in all.
Actually, the rise rates of the last three bubble functions were constrained to be equal while fitting the model, and so were the decay rates of the last four. These constraints were motivated by the conjecture that those bubbles were connected to the Chinese market (see below), and that their decays were equally affected by the Central Bank restrictions starting in December 2013, right after the all-time high. Therefore, the number of adjustable parameters was only 40, not 45.
Moreover, the date and rate parameters of each basis element were chosen to match the date of the visible kink(s) of the corresponding event, and the slopes of the log-scale plot just before and just after those kink(s). It is remarkable that the resulting model also approximates remarkably well the concave curved sections of the price plot between successive bubble events --- even though it has no extra parameters to control the shapes of those curves.
Finally, the basis elements can be interpreted in terms of real-world events and processes (see below); and the composition of the elements by addition (rather than, say, multiplication) is compatible with that interpretation. Note, in particular, that the curved sections of the log-scale plot arise naturally from the additon of simple exponentials, each of them being straight on that plot.
As noted above, the "bubble event" that peaked in early June 2014 was somewhat anomalous, because the rise phase started quite abruptly on 2014-05-20, lasted only 10-15 days, and ended more gradually than previous events. The last bubble, that peaked on early April 2015, has not lasted long enough to enable its shape to be discerned with confidence. Even so, those two events can be adequately modeled by standard bubble functions without plateau, with relatively small error.
Descriptive, not predictiveThe model is meant to be purely
descriptive, not
predictive. That is, it aims only to provide a succint description of the historical prices, without attempting to predict future prices. If anything, it is "anti-predictive", because it implies that the past bubbles have exponentially decreasing relevance for the future prices, and any future bubbles cannot be detected until they are well underway.
Until mid-2014, it was widely claimed that the price would continue to grow, as it has done in the past, by a sequence of bubbles spaced roughly 9 months apart, with exponentially increasing peak amplitudes. However, this model suggests that such "exponential bubble train model" may be just an illusion. The good fit of our model to the price, particularly between successive bubbles, suggests that bubbles are added rather than multiplied. It follows that each new bubble is only noticeable when its amplitude is substantially greater than the sum of all tails of the previous bubbles. If a bubble like the "2011-06" one occurred today, for example, lifting the price by only 10 dollars, it would not be discernible at all. Therefore, if bubbles actually occurred at random intervals and with random amplitudes, this masking effect would give the impression that bubble amplitudes are increasing.
Interpretation of bubbles as market openingsAlthough the model is not predictive, I believe that it is
explanatory as well as descriptive. Namely, each bubble can be conjectured to represent a surge in demand due to the opening of some new
market. Each market may be another community of users, isolated from the others by national, language, or legal barriers; or a new use of bitcoins.
The exponential rise part of a bubble would then be due to the spread of demand in that market by "contagion", possibly amplified by media coverage and speculative demand. The end of the rise would be due to saturation of that market. (In some bubbles one can see oscillations extending for a month or two after the end of the rise, presumably caused by panic and recovery among the speculators. These oscllations have not been included in the model yet.) The plateau part of each bubble would be due to a period of relatively constant demand after the peak, while a decreasing tail could be due to gradual decrease of the demand, e.g. for disappointment, government repression, etc.
In particular, the bubble labeled "2013-11" ("Beijing 1", Figure 6) was almost certainly due to the opening of the Mainland Chinese market after the major exchanges Huobi and OKCoin started operating in Beijing, and a report about bitcoin was featured in mainstream Chinese media. Local reports attribute the huge demand to a large contingent of amateur speculators that used to day-trade in commodities like tea or garlic, and found bitcoin more attractive for that purpose because of its higher volatility. That is one of the fastest-rising bubbles in the model (about 10%/day). It peaked at 2013-11-29, when the Central Bank of China (PBoC) intervened and banned the use of bitcoin in e-commerce and forbade financial institutions from dealing with it. That bubble then started decaying at about 0.55%/day.
The earlier bubble "2013-04" ("Sanghai 1", Figure 5), that has a plateau from about April 5th to May 31, 2013, may have been created by demand in China, too; but by BTC-China in Shanghai, possibly catering to a different community. BTC-China started operating well before that bubble, but in early 2013 it recruited Bobby Lee as CEO, a Stanford alumnus who formerly worked for Walmart. BTC-China's trading volume started growing exponentially in the first 3 months of 2013, and it was leading the price increase during that period. In the model, it is assumed that the contribution of that demand to the price remained constant for 2 months and then started to decay.
It would be useful to identiy the markets and/or events that caused the other bubbles. It has been claimed that one of them was caused by an article in the Wired magazine, for example.
Note that the relation between price increase and demand depends on the liquidity of the market, which is not known, and must be non-linear. Therefore, the magnitude of each bubble should not be interpreted as a measure of the demand, but only of its effect on the price.
This in interpretation would confirm the claim that the model is not predictive, because the opening of markets in the past would hardly influence the opening of new markets in the future. In particular, to have another bubble with magnitude above 1000 $/BTC, bitcoin woudl have to conquer some market with demand comparable to the Chinese one. While there are conjectural candidates for such a market, the past history of the price cannot have much influence on that future event.
Modeling the 2014--2015 price variations
After the all-time high of 2013-11-29, the character of the price graph changed noticeably: instead of typical bubbles, there was a succession of sudden rises and dips, superimposed on the slowly decaying tails of the Chinese bubbles. Most of these changes were clearly connected to news and rumors that affected either the Chinese or the non-Chinese day traders.
For example, there was a partial recovery of the price in late December 2013, when some Chinese exchanges regained bank access that had ben closed earlier that month; then a sharp drop on 2014-02-10, then Mark Karpelès of MtGOX cleimed that there was a bug in the protocol; then a recovery on 2014-03-15. There was also a sharp drop on 2014-03-26, when a Chinese newspaper leaked new of further PBoC restrictions; a recovery on 2014-04-15, when the announced deadline passed with no restrictions; then another sudden drop on 2014-04-25, when the restrictions began to be enforced and one major Chinese exchange had to close. A sharp but smaller drop occurred on 2014-06-12, when the first USMS auction of the SilkRoad bitcoins was announced, which was reversed on 2014-06-30, when it became known that the auction had been won by entrepreneur Tim Draper. Other short-lived spikes occurred when it became known that Microsoft was "accepting bitcoins" (which turned out to be only for a few digital products), when it was rumored that McDonalds would start accepting bitcoins on Valentine's day (it was "love" instead), when a statement by an OKCoin staffer was misinterpreted as saying that a large hedge fund would start trading bitcoins, and at several other times.
These events were quite unlike the previous bubbles in that they had very fast rise and decay (often lasting less than a day), with gradually decaying price in between. The decay could be attributed to the continuing decay of the main Chinese bubbles "2013-11" and "2014-06"; if these two elements are subtracted from the price, the variations in 2014 and 2015 cn be modeled fairly well by some rectangular pulses with nearly flat tops, and some sharp spikes, all with nearly vertical sides. These pulses and spikes, in turn can be modeled by degenerate bubble functions with very fast rises and decays. (Due to their short durations, it is not possible to tell whether the sides are indeed exponentials; but their shape has little effect on the goodness of fit.)
Figures 7 and 8 below show a an extension of the model of Figures 1 and 2 that uses eight such degenerate bubble functions to model the main events in 2014 and 2015, plus one spike-like element "2011-05" to model the "stutter" during the rise of the "2011-06" bubble.

[ Figure 7. A 20-bubble model for the price of bitcoin, showing the smoothed actual price (grey), the modeled price (green), and the individual bubbles. The brown line near the bottom is the ratio of the actual price to the model price. Click on the image for a full-size version. ]

[ Figure 8. The same data and model in Figure 7, without smoothing. Click on the image for a full-size version. ]How the model was constructedA typical bubble has 4 parameters: the rate of change per day during the rise part (always greater than 1), the date of the peak, the rate of change per day during the tail (less than 1, except for the "2010-07" and "2012-08" bubbles), and the magnitude at the peak. Some bubbles had one additional parameter, the duration of the plateau phase.
The number of bubbles in the model (11) and all bubble parameters except the peak magnitude were determined initially by hand, inspecting the price chart. They were then tweaked by variosu means to improve the fitting.
Once the other parameters were chosen, the bubble magnitudes were then determined by weighted least squares fitting of their linear combination to the observed prices P(i). Each price datum P(i) was assigned a weight W(i) = 1/P(i), in order to simulate the effect of fitting the model in log scale, while actually using linear scale.
The input prices and the component bubbles were smoothed with a Hann window spanning 2 weeks.


