|
xxxx123abcxxxx (OP)
|
 |
April 05, 2019, 06:55:07 AM |
|
The intention of this thread is to speculatively forecast the price of Bitcoin via subjectively using the Elliott Wave principle. Analysis is purely guesswork with an endeavour to provide sporadic fortnightly updates. Previous thread: 2018 Cryptocurrency Crash (Elliott Wave)
|
|
|
|
|
|
|
|
|
|
|
|
In order to achieve higher forum ranks, you need both activity points and merit points.
|
|
|
Advertised sites are not endorsed by the Bitcoin Forum. They may be unsafe, untrustworthy, or illegal in your jurisdiction.
|
|
|
|
|
|
|
|
xxxx123abcxxxx (OP)
|
2019 Cryptocurrency (Elliott Wave): Bull Market
?https://www.reddit.com/r/BitcoinMarkets/comments/b9nlzh/2019_cryptocurrency_elliott_wave_bull_market/The 2018 cryptocurrency crash saw Bitcoin decline 85% in value, elapsing the course of 363 days just two days shy of a complete year. The all-time high occurred on 17-DEC-2017, and a notable low occurred on 15-DEC-2018. The bear market of 2018 unfolded in three stages: - i. A three wave A-B-C decline, from 17-DEC-2017 high to 06-FEB-2018 low, declining 70%
- ii. A five wave A-B-C-D-E sideways rangebound triangle, from 06-FEB-2018 to 24-JUL-2018
- iii. A five wave impulsive 1-2-3-4-5 decline, from 24-JUL-2018 high to 15-DEC-2018 (06-FEB-2019 orthodox) low, declining 63%
Overall, these three stages form a complex A-B-C composite structure, as the following chart illustrates:  As each stage of the 2018 bear market unfolded, bounces became diminishing in size. The following lists notable price advances that occurred whilst price action was rangebound in a sideways triangle during the second stage: 06-FEB to 20-FEB, a 99% advance. 01-APR to 05-MAY, a 55% advance. 29-JUN to 24-JUL, a 47% advance. Subsequent bounces during the third stage of the bear market, from 24-JUL-2018 to 15-DEC-2018, have been less than 27% in size. From the 15-DEC-2018 low, Bitcoin has thus far rebounded 70% the second largest advance since the 2017 all-time high. In addition, although not conclusive yet, price action appears to be advancing in impulsive waves. Hence, there is a preliminary cautious opportunity to suggest a new cryptocurrency bull market may be underway. From an Elliott Wave perspective, a new bull may likely suggest the following two abstract scenarios, 'simple' and 'complex': Scenario A (Simple) Scenario B (Complex) Scenario B (Complex) New all-time highs would suggest a simple scenario, where five Primary degree waves complete beyond the 17-DEC-2017 high; i.e. Primary-1 completed at the 2013 high, Primary-2 completed at the 2015 low, Primary-3 completed at the 2017 high, Primary-4 completed at the 2018 low, Primary-5 currently underway. A failure of the bull market to create new all-time highs would suggest a complex scenario. Such a scenario would propose a cyclical (i.e. short-term) bull market, in an overall ongoing deflationary secular (i.e. long-term) bear market. The 2018 low would be labelled as Primary-W, the current potential 2019 bull market as Primary-X, followed by the resumption of the secular bear market labelled as Primary-Y to break below the 2018 low. Complex composite wave structures are often behaviours of commodity and currency markets. At present, the simple scenario has been adopted until further development of wave structure.  BITSTAMP Support Zones: 4306, 3322, 2713, 2221 BITSTAMP Resistance Zones: 5198, 5898, 6390, 6882/7026, 7491
|
|
|
|
|
Pab
Legendary

 Offline Offline
Activity: 1862
Merit: 1012

|
 |
April 05, 2019, 08:02:50 AM |
|
Thank you.Very much appreciate for charts
I have just sign to eliotwaves to learn a little
If it will works like mirror than 5200 is key level if break than we can get at 7k first stop
|
|
|
|
|
estenity
|
|
April 05, 2019, 08:36:36 AM |
|
elliott waves deserve to be studied in cryptos.
|
|
|
|
|
figmentofmyass
Legendary
Offline
Activity: 1652
Merit: 1483
|
|
April 05, 2019, 09:09:27 AM |
|
in the simple impulsive scenario, i recognize that primary wave 3 can't be the shortest wave. but does wave 5 need to be so weak? we could go well into the 6-figure range without invalidating that count.
bitcoin tends towards strong wave 5s and it's really tough to see us correcting so long only to double top. the proportions just don't seem right for that either.
|
|
|
|
DeathAngel
Legendary
Offline
Activity: 3080
Merit: 1593
#1 VIP Crypto Casino
|
|
April 05, 2019, 09:17:50 AM |
|
Scebario B looks very, very unlikely to me.
Primary (Y) just surely cant happen at this stage.
|
|
|
|
g-uid
Member
 Offline
Activity: 259
Merit: 18
|
|
April 05, 2019, 06:04:07 PM |
|
Awesome.
Great to see that your interest in Bitcoin has been rekindled.
|
|
|
|
|
|
cryptjh
|
|
April 05, 2019, 10:40:34 PM |
|
This is some really interesting charts you made, Elliott Waves are good indicators to see where the bitcoins price might go in the future. But bitcoins price are also dictated of what happens outside the crypto world, new adoptions or central banks that prints even more money than before can also push the price up.
|
|
|
|
|
|
xxxx123abcxxxx (OP)
|
|
April 08, 2019, 11:22:54 PM
Last edit: April 08, 2019, 11:59:15 PM by xxxx123abcxxxx |
|
in the simple impulsive scenario, i recognize that primary wave 3 can't be the shortest wave. but does wave 5 need to be so weak? we could go well into the 6-figure range without invalidating that count.
bitcoin tends towards strong wave 5s and it's really tough to see us correcting so long only to double top. the proportions just don't seem right for that either.
Technically speaking, a normal wave-5 is only required to exceed the high of wave-3, albeit marginally. Given that PRIMARY[3] wave was extended, there is a common relationship in this situation; where, PRIMARY[5] is equal to either 1 or 1.618 times the length from the low of PRIMARY[1] through to the high of PRIMARY[3] wave, projected from the low of PRIMARY[4] wave... @22912: PRIMARY[5] = (PRIMARY[1] + PRIMARY[3]) * 1 @35127: PRIMARY[5] = (PRIMARY[1] + PRIMARY[3]) * 1.618 In theory, PRIMARY[5] could subdivide and extend like PRIMARY[3] wave; however, looking at over 100 years of Dow Jones Industrial Average Index data, this hasn't happened to waves of such degree.   |
|
|
|
|
MarquiseMuseum
Member
Offline
Activity: 739
Merit: 29
www.MarquiseMuseum.com

|
|
April 09, 2019, 06:02:33 PM
Last edit: April 09, 2019, 06:21:22 PM by MarquiseMuseum |
|
Complex scenario can take longer to unfold, still too many small bag holders who refuse to capitulate in this stubborn market that's already the longest bear market on record, 1000-1800 btc slide can take an entire year more and then a few months sideways before slowly building momentum h2 2020. If this scenario happens, it is possible that altcoins will undergo a parabolic paradigm flip with decentralized exchanges or atomic swaps and phasing out of centralized entities, so there is alot of money to be made in that scenario either way.
Global bottom is probably already in at 100bn back in December which is May 2017 pre tether valuation (50bn global) ~60% annualized organic growth premium over 19 months.
Simple scenario can be extended to january 2021 at 90 000 & mid 2021 up to 300 000...
Short term there may be a +20-30% btc push/+50% altcoin rally with Easter reversal around the 20th and then bearish continuation until double bottom somewhere H2.
|
|
|
|
YuginKadoya
Legendary
Offline
Activity: 3038
Merit: 1169
|
|
April 09, 2019, 07:25:02 PM |
|
Well we can sure identify the movement of bitcoin and other cryptocurrencies through this and by looking at the graph bitcoin really is starting to take turns now and coming back and recovering, This must be a hasty speculation for others that are thinking that Bull Run is now, But I might say we should look at some Waves to surely verify and determine the real movement of bitcoin but some say this is a principle of identifying extremes in investor psychology and all is just an analytical speculation that the chart will form a pattern but I think this is a shot we can sure take a look on as a trader.
|
|
|
|
|
|
SirLancelot
|
|
April 09, 2019, 07:29:37 PM |
|
Yes, you are very correct, this group is for speculation and speculations might not be exact but it is close to what we are looking for, I have speculated on the price couple number of times this year and I am seeing my exact prediction already coming to past and am so happy about it, not just because my prediction is coming to past but because we are starting to see a bull run in the price of crypto again.
|
|
|
|
|
|
xxxx123abcxxxx (OP)
|
|
April 20, 2019, 02:02:50 AM
Last edit: April 20, 2019, 03:45:38 AM by xxxx123abcxxxx |
|
2019 Cryptocurrency (Elliott Wave): Easter Updatehttps://www.reddit.com/r/BitcoinMarkets/comments/bf7dkc/2019_cryptocurrency_elliott_wave_easter_update/Since the 15-DEC-2018 low, the Bitcoin markets have rebounded with a 75% gain into Easter 2019 quite a resurrection from the 2018 bear market which saw an 85% decline in value. With price action unfolding in impulsive waves thus far, it is becoming increasingly apparent to suggest a bull market is underway. A simple Eggiott Wave model would propose a five wave structure, consisting of three advancing bull market waves, interwoven with two declining bear market waves. Overlaying this model onto Bitcoin suggests: Wave 1: the first bull market wave 2010-2013 (1219 days), followed by;
Wave 2: the first bear market wave 2013-2015 (426 days), followed by;
Wave 3: the second bull market wave 2015-2018 (1065 days), followed by;
Wave 4: the second bear market wave 2018-2019 (363 days), followed by;
Wave 5: the third and final bull market wave 2019-?
The five aforementioned have been considered as PRIMARY degree waves such waves elapse the course of a few months to a couple of years. Timewise, the first two bull markets (Waves 1 and 3) elapsed 1142 days on average; and, the first two bear markets (Waves 2 and 4) elapsed 395 days on average. Bull markets have lasted almost three times longer than bear markets. Thus, an intuitive linear projection would propose the current third and final bull market (Wave 5) to complete by the year 2022 or earlier. However, since the current fifth and final Eggiott Wave is by typical definition only required to revisit or just exceed the high of the third wave, it may suggest the current bull market may be comparatively contracted in price and time. The first Bitcoin halving occurred on 28-NOV-2012, approx midway through the first bull market. The second Bitcoin halving occurred on 09-JUL-2016, approx midway through the second bull market. The third Bitcoin halving is tentatively scheduled for 21-MAY-2020, perhaps midway through the third and final bull market or at the end? A common wave relationship guides the price of the fifth and final wave to be equal to, or extend a Fibonacci 1.618 times the length from the low of the first wave through to the high of third wave, projected from the low of the fourth wave. This provides a conservative target of the current bull market to conclude between $22912 and $35127 calculated using the BraveNewCoin (BNC:BLX) index
@22912: PRIMARY[5] = (PRIMARY[1] + PRIMARY[3]) * 1
@35127: PRIMARY[5] = (PRIMARY[1] + PRIMARY[3]) * 1.618
 Projected from the 15-DEC-2018 low, the aforementioned conservative price targets are a 630% to 1020% gain, or 825% on average. The average gain alone would be sufficient enough to qualify the current fifth and final PRIMARY[5] wave which would exceed the 2017 high of the third PRIMARY[3] wave, albeit marginally. However, for the popular altcoins like LTC and ETH, an 825% gain projected from their 2018 lows would only retrace half of their respective bear markets. Even a 1000% gain in LTC and ETH would fail to match their 2017 all-time highs. Furthermore, there are altcoins such as LTC where the 2018 bear market low overlapped the high of their respective 2013 bull markets highs. Such a price overlap negates an impulsive wave structure, and thus would suggest a corrective wave structure as follows (indicative of price/structure, not time):   The short to medium term wave structure of Bitcoin thus far appears to be impulsively advancing from the orthodox 06-FEB-2019 bear market low, with maximum pullbacks at 11% on average. Four waves seem to have completed which have been classified as MINUTE degree waves of such degree elapse from a few days to a week: 24-FEB: MINUTE[i]
27-FEB: MINUTE[ii]
10-APR: MINUTE[iii]
15-APR: MINUTE[iv]
 The third MINUTE degree wave which completed on 10-APR, itself subdivided into five smaller impulsive waves classified as MINUETTE degree waves. A decline below the low of 15-APR would suggest MINUTE[iv] pullback is still in progress which ought to find support at the low of 04-APR. Otherwise however, it appears the final MINUTE[v] degree wave appears to be currently underway. Once MINUTE[v] completes, the first MINOR degree wave of the bull market will have completed, and the first largest pullback of the bull market will commence perhaps an approx 30% decline. At this point in time, price will be required to decline to the 24-FEB high to terminate the proposed wave structure, and quite possibly the bull market. The degree of wave labeling is currently tentative and subject to revision (i.e. may be either upgraded or downgraded in degree); however, the waves remain fixed. BITSTAMP Support Zones:
5198, 4306, 3322, 2713, 2221
BITSTAMP Resistance Zones:
5898, 6390, 6882/7026, 7491
Charts are indicative of price/structure, not time.
|
|
|
|
|
|
hisslyness
|
|
April 20, 2019, 01:07:21 PM |
|
I hope members here dont discount your speculations. You were correct about the 2018 crash and some of your charts even shows the low...
Definitely have to emphasise it is all about price movement and not time!..
Also you dont believe Primary 5 can generate more than 1.6x or anything more will not validate Elliot wave model?
|
|
|
|
|
|
xxxx123abcxxxx (OP)
|
|
April 20, 2019, 08:28:23 PM
Last edit: April 21, 2019, 12:52:35 AM by xxxx123abcxxxx |
|
I hope members here dont discount your speculations. You were correct about the 2018 crash and some of your charts even shows the low...
Definitely have to emphasise it is all about price movement and not time!..
Also you dont believe Primary 5 can generate more than 1.6x or anything more will not validate Elliot wave model?
Technically speaking, since PRIMARY[3] wasn't the shortest, the length of PRIMARY[5] is theoretically unlimited. Usually when PRIMARY[3] overextends, and given the sizeable magnitude of PRIMARY[1] wave; it is often the case PRIMARY[5] is somewhere between 1 and 1.618 times the length of PRIMARY[1] through to PRIMARY[3] wave, projected from the PRIMARY[4] low. In the event of a PRIMARY[5] extension, other Fibonacci-based multiples are: 1.786, 2, 2.236, 2.382, 2.5, 2.618, 2.786, 3, etc. |
|
|
|
|
|
pixie85
|
|
April 20, 2019, 11:22:37 PM |
|
I like that all of your scenarios are short term bullish. They are a bit different from what most people are drawing.
The most popular scenarios that you can see online predict that we will fail to break resistance at 6000 and go down from there, with bears seeing it as final capitulation below 3000 dollars and bulls as a drop to 4000, failure to break previous support and another try at 6000 later this year. You see much higher prices in the near future and I hope you are right.
What is your opinion about hyperwave theory supporters who say we need another leg down before we pass 6000?
|
|
|
|
|
|
xxxx123abcxxxx (OP)
|
|
April 21, 2019, 01:29:43 AM
Last edit: April 21, 2019, 02:53:35 AM by xxxx123abcxxxx |
|
I like that all of your scenarios are short term bullish. They are a bit different from what most people are drawing.
The most popular scenarios that you can see online predict that we will fail to break resistance at 6000 and go down from there, with bears seeing it as final capitulation below 3000 dollars and bulls as a drop to 4000, failure to break previous support and another try at 6000 later this year. You see much higher prices in the near future and I hope you are right.
What is your opinion about hyperwave theory supporters who say we need another leg down before we pass 6000?
BITSTAMP quoted prices... Have noted $5898 and $6390 as resistance levels, seeing that $6000 zone as temporary psychological resistance. Currently thinking $6882 to $7026 may serve as technical resistance where the first notable pullback occurs. Not studied Hyperwave in-depth, so can't comment on the theory. However, markets are fractal and so would consider 2013 as a Hyperwave top too. At this point, another leg down below the 06-FEB-2019 low, would suggest an ongoing bear market towards sub $1000. |
|
|
|
|
Afrikoin
Legendary
Offline
Activity: 1540
Merit: 1003
alan watts is all you need
|
|
April 21, 2019, 09:02:26 PM |
|
I like that all of your scenarios are short term bullish. They are a bit different from what most people are drawing.
The most popular scenarios that you can see online predict that we will fail to break resistance at 6000 and go down from there, with bears seeing it as final capitulation below 3000 dollars and bulls as a drop to 4000, failure to break previous support and another try at 6000 later this year. You see much higher prices in the near future and I hope you are right.
What is your opinion about hyperwave theory supporters who say we need another leg down before we pass 6000?
BITSTAMP quoted prices... Have noted $5898 and $6390 as resistance levels, seeing that $6000 zone as temporary psychological resistance. Currently thinking $6882 to $7026 may serve as technical resistance where the first notable pullback occurs. Not studied Hyperwave in-depth, so can't comment on the theory. However, markets are fractal and so would consider 2013 as a Hyperwave top too. At this point, another leg down below the 06-FEB-2019 low, would suggest an ongoing bear market towards sub $1000. "At this point, another leg down below the 06-FEB-2019 low, would suggest an ongoing bear market towards sub $1000." That would get ugly. There is a split between people on whether this is the impulse to a new wave or it is some sort of correction, so could break back down and either form a higher low and back up or capitulate again. I wonder what you make of this chart EOS chart which perhaps might give us a clue where the market is the triangle for me was some 4 or IV wave and perhaps the rise from $1.55 was an ABC I only ask because they two assets have had a correlation for a while with only a lag in time  |
▄▄▄██████▄▄▄
▄██████████████████▄
▄████████████████████████▄
▄▄ ▄████████████████████████████▄
███████████████████████████████████▄
▀▀█████████████████████████████████▄
██████████████████████████████████
██████████████████████████████████
██████████████████████████████████
██████████████████████████████████
▀████████████████████████████████▀
▀██████████████████████████████▀
▀▀██████████████████████████▀
▀██████████████████████▀
▀▀▀████████████▀▀▀ | .
| .....█
.....█
.....█
.....█
.....█
.....█ | | █
█
█
█
█
█ |
|
|
|
|
xxxx123abcxxxx (OP)
|
|
April 22, 2019, 04:45:37 AM
Last edit: April 22, 2019, 04:56:43 AM by xxxx123abcxxxx |
|
"At this point, another leg down below the 06-FEB-2019 low, would suggest an ongoing bear market towards sub $1000."
That would get ugly.
There is a split between people on whether this is the impulse to a new wave or it is some sort of correction, so could break back down and either form a higher low and back up or capitulate again.
I wonder what you make of this chart EOS chart which perhaps might give us a clue where the market is the triangle for me was some 4 or IV wave and perhaps the rise from $1.55 was an ABC
I only ask because they two assets have had a correlation for a while with only a lag in time
Currently guessing the following with EOS, thinking perhaps a $10-$14 target range, beyond that may require an adjustment of the count...  Indicative of price/structure, not time. |
|
|
|
|
|
xxxx123abcxxxx (OP)
|
|
April 26, 2019, 12:09:08 AM
Last edit: April 26, 2019, 02:00:51 AM by xxxx123abcxxxx |
|
BITSTAMP Support Zones: Zone 1: 4375 / 4320 / 4200 / 4080
Zone 2: 3820 / 3660 A decline to the 06-FEB-2019 low would terminate the proposed wave structure, and quite possibly the bull market.  |
|
|
|
|
|
xxxx123abcxxxx (OP)
|
BITSTAMP Support Zones: 5215, 4320 BITSTAMP Resistance Zones: 5920, 6410, 6900, 7030  |
|
|
|
|
|
kronos123
|
|
May 11, 2019, 01:35:42 AM |
|
Happy to have found your new thread 2019 At the moment your analysis seems to be well aligned to the Bitcoin movement and, given the strong overbought and the climb of over 100% so far, so a last extension to the last strength you indicated about $ 7000, probably even for cut legs and short positions; from there I believe that a month of pause and correction will be necessary and healthy ...... we'll see! Updates continue  |
|
|
|
|
|
xxxx123abcxxxx (OP)
|
|
May 12, 2019, 05:21:25 PM
Last edit: May 12, 2019, 07:18:38 PM by xxxx123abcxxxx Merited by muf18 (2), tyz (1) |
|
2019 Cryptocurrency (Elliott Wave): Sell In May And Go Away?https://www.reddit.com/r/BitcoinMarkets/comments/bnrctv/2019_cryptocurrency_elliott_wave_sell_in_may_and/Since the orthodox bear market low on 06-FEB-2019, the Bitcoin markets have surged to an average 125% gain in approx 100 days approaching mid-MAY. The 3-month rally has now retraced a Fibonacci 23.6% of the entire 2018 bear market. True to form, the bull market has exerted itself in a parabolic rise. From an Elliott Wave perspective, five waves appear to have completed as follows: + Wave-1: 24-FEB
- Wave-2: 27-FEB
+ Wave-3: 23-APR
- Wave-4: 25-APR
+ Wave-5: 12-MAY (?)
Given the comparative magnitude and timeframe of the aforementioned waves, the waves are now being considered as MINOR degree. Barring any wave extensions, it appears five MINOR waves have completed, and thus completing the first INTERMEDIATE degree wave of the bull market. A wave of INTERMEDIATE degree usually elapses from weeks to months towards completion. The expectation now suggests the first notable pullback of the bull market to imminently commence, unfolding in a three wave A-B-C structure. The following are averaged target zones for the pullback, using BITSTAMP prices: @5400: approx 50% Fibonacci retracement of 06-FEB to 11-MAY rally (minimum expected decline zone).
@4888: approx 61.8% Fibonacci retracement of 06-FEB to 11-MAY rally (average expected decline zone).
@4155: approx 78.6% Fibonacci retracement of 06-FEB to 11-MAY rally (maximum expected decline zone).
The first notable pullback of the 2015-2017 bull market retraced approx 78.6% in size, elapsing approx 6 months until late AUG-2015. A decline to the 06-FEB low would terminate the proposed wave structure, and quite possibly the bull market.   Once the pullback completes, the third and most powerful wave of the 2019+ bull market ought to commence towards the psychological $10,000 level and beyond. BITSTAMP Resistance Zones:
7510, 8500, 9440, 11395, 13350
BITSTAMP Support Zones:
7030, 6900, 6410, 5920, 5215, 4320
Since 2016, both the stockmarket and Bitcoin markets have been in synchronisation: both started bull markets in 2016, both had bear markets in 2018, both resumed bull markets in 2019. Seasonally, the Sell In May And Go Away adage is currently being expressed in the stockmarket. Since the beginning of May, the Dow Jones has declined 4.50% the largest decline since the 2019 bull market commenced. Should the Bitcoin markets decline in MAY, a continued synchronisation may suggest further declines in the stockmarket. A break below the 25-MAR low of 25,370 in the Dow Jones may suggest further declines, a break below the 11-MAR low of 25,200 would confirm a stockmarket pullback to be underway. If so, an approx 10% decline in the stockmarket towards Dow Jones 24,000 may be expected, followed by resumption of the bull market to new all-time highs. A rise above Dow Jones 26,500 ought to obviate the Sell In May And Go Away adage.  Analysis is speculative, and charts are indicative of price/structure not time. The projections may occur sooner or later than anticipated, perhaps not at all
!
|
|
|
|
|
Bitcoinwaist
Copper Member
Member
Offline
Activity: 228
Merit: 23
|
|
May 12, 2019, 05:31:48 PM |
|
good stuff bro thank you |
|
|
|
|
tyz
Legendary
Offline
Activity: 3360
Merit: 1530
|
|
May 13, 2019, 08:52:03 AM |
|
Thanks a lot for your in-depth analysis. I have been following your thread (including the previous one) since Spring 2018 as one of the very few in speculation section. After this year, I must say that you were close to reality with many predictions. Keep up your great work!
|
|
|
|
|
|
kronos123
|
|
May 14, 2019, 09:49:01 AM |
|
There is little to do, in the end Bitcoin always amazes everyone and does what it wants! Hardly anyone, I believe, expected such a steep and continuous climb, and without any pause; I'm almost afraid that at this point the scenario B proposed by OP in the opening post may occur: an almost continuous climb for almost all summer and then a new and violent vertical dip! Scenario B (Complex) |
|
|
|
|
buwaytress
Legendary
Offline
Activity: 2772
Merit: 3429
Join the world-leading crypto sportsbook NOW!
|
|
May 14, 2019, 12:41:00 PM |
|
Definitely one of those slow burn threads, under the radar and well worth reading, whether or not you buy into it. Like that OP admits in first post already this is purely speculative guesswork (Cause that's all TA really is, not matter what the experts want you to believe!).
Sell in May and then go away, huh? First time I've heard that, but you know, Bitcoin's been making powerful strides this entire half of the month so far, so yeah, I agree it's pretty scary that if we don't see the pullback soon, which should have happened even at 6.3, then 7k, then we're chipping away yet again at the long term lifeline. Of course, this could all just be meaningless once 10k is hit and then we don't ever look back.
|
|
|
|
|
pixie85
|
|
May 14, 2019, 09:03:20 PM |
|
I was expecting a drop at 6500 or even before that and mirrored it in my trades. I made some money but not nearly what I could have made if I knew this scenario is going to happen.
We can clearly see that the bullish momentum is not stopping with still big volume and a very similar pattern to the one two days ago. Will it mean another small pump? The chart really starts to look like one of those bubble charts in 2013 and 2017 where the price corrects only a little and gains twice more and repeats it again and again.
|
|
|
|
|
|
kronos123
|
|
May 15, 2019, 05:02:15 PM |
|
@buwaytress
Obviously AT is all speculation and everything is true / false until it is confirmed by the graphs, but OP seemed at the beginning to exclude scenario B, the unrealistic one, because it is too extreme, while now the graphs show a greater correlation with it.
Finally, I don't understand why you say that if Bitcoin hits the 10k then it loses meaning; from the graph of OP it seems instead that Bitcoin can be pushed up to $ 11000, or little more, that should be really 50% of retracement of the whole movement from 19k to 3k.
All that remains is to wait and see in another month.
|
|
|
|
|
|
xxxx123abcxxxx (OP)
|
|
May 16, 2019, 04:38:17 AM
Last edit: May 16, 2019, 04:54:43 AM by xxxx123abcxxxx |
|
Parabolic price curves are driven by mania and euphoria, and since 25-APR-2019, the Bitcoin markets have manifested its first one for the 2019+ bull market. Such price action is often challenging to navigate using technical analysis in an attempt to quantify the qualitative. From an Elliott Wave perspective, the parabolic rise from 25-APR to 14-MAY is currently being considered as a final fifth wave of an overall 1-2-3-4-5 sequence which began on 06-FEB-2019. The overall wave structure still currently suggests a looming pullback to commence imminently. At this juncture, any price advance beyond the 14-MAY high is being considered as an irregular wave-B. Using BITSTAMP prices, the following are price target zones for such a scenario: @8505: wave-B = wave-A * 1.236%
@8610: wave-B = wave-A * 1.382%
@8695: wave-B = wave-A * 1.500%
@8780: wave-B = wave-A * 1.618%
There is no minimum required criteria to qualify an irregular wave-B, a marginal high above the orthodox top is sufficient. Hence, neither of the aforementioned target zones are required to be reached. However, the maximum tolerable extent of an irregular wave-B is 1.618 times the length of wave-A, and so beyond would require a revised wave structure. Assuming the 14-MAY orthodox high has completed a wave cycle, the following provides averaged zones to target the first notable pullback of the 2019+ bull market, using BITSTAMP prices: @5780: approx 50.0% Fibonacci retracement of 06-FEB to 14-MAY rally (min expected decline zone).
@5175: approx 61.8% Fibonacci retracement of 06-FEB to 14-MAY rally (avg expected decline zone).
@4315: approx 78.6% Fibonacci retracement of 06-FEB to 14-MAY rally (max expected decline zone).
The first notable pullback of the 2015-2017 bull market retraced approx 78.6% in size, representing a 40% price decline, elapsing approx 6 months until late AUG-2015. The stockmarket has confirmed the Sell In May And Go Away adage; after a forthcoming bounce, the stockmarket is excepted to sell-off over the early summer, declining approx 10% from the MAY high towards approx Dow Jones 24,000. Bitcoin markets are yet to confirm the Sell In May And Go Away adage, a drop below the 14-MAY low, i.e. BITSTAMP 7620, ought to provide the signal.  Indicative of price/structure, not time. |
|
|
|
|
|
BMG86
|
|
May 29, 2019, 01:56:43 AM
Last edit: May 29, 2019, 11:35:52 AM by BMG86 |
|
OP, what are your current thoughts on Bitcoins movements now? It seems like your complex scenario is coming into play with the parabolic moves bitcoin has been making with only minor pullbacks.
Also, now everyone seems to be screaming bitcoin to one million dollars again. It reminds me of December 2017 when bitcoin was in its euphoria stage.
|
|
|
|
|
|
xxxx123abcxxxx (OP)
|
|
May 30, 2019, 06:59:14 PM
Last edit: May 30, 2019, 08:01:44 PM by xxxx123abcxxxx |
|
Since the 06-FEB-2019 low, the Bitcoin markets have gained an approx 160% thus far into MAY-2019. The largest pullback of this 3-month uptrend occurred from 14-MAY to 17-MAY, where a mini flash crash saw a rapid sell-off of up to 25% declines on multiple exchanges, notably pronounced on BITSTAMP and BITMEX. The wave structure still suggests five impulsive waves completed from the 06-FEB low to the 14-MAY high. Since the mini flash crash low on 17-MAY, the markets have risen between 30%-45% thus far, varying between the exchanges; however, price action has currently unfolded in three waves. This is currently suggesting the mini flash crash low was a wave-A decline, and the current advance an irregular wave-B, as part of an ongoing correction. Using BITFINEX prices, an exchange which didnt exhibit a pronounced mini flash crash during mid-MAY, the following common Fibonacci-based irregular wave-B target zones can be calculated: @8670: wave-B = wave-A * 1.236
@8870: wave-B = wave-A * 1.382
@9030: wave-B = wave-A * 1.500
@9190: wave-B = wave-A * 1.618
 There is no minimum required criteria to qualify an irregular wave-B, a marginal high above the orthodox top is sufficient. However, the maximum tolerable extent of an irregular wave-B is 1.618 times the length of wave-A, and so beyond may require a revised outlook. 9200/BITFINEX and 9760/BITSTAMP is the maximum tolerable extent of an irregular wave-B. Given the wide price range across multiple exchanges, it is challenging to pinpoint which exchange measures the true tolerable price extent of the irregular wave-B. Continuing to assume the 14-MAY orthodox high has completed a wave cycle, the following provides averaged zones to target the first notable pullback of the 2019+ bull market, using BITSTAMP prices: @6080: approx 50.0% Fibonacci retracement of 06-FEB to 14-MAY rally (min expected decline zone).
@5385: approx 61.8% Fibonacci retracement of 06-FEB to 14-MAY rally (avg expected decline zone).
@4430: approx 78.6% Fibonacci retracement of 06-FEB to 14-MAY rally (max expected decline zone).
The first notable pullback of the 2015-2017 bull market retraced approx 78.6% in size, elapsing approx 6 months until late AUG-2015. A decline to the 06-FEB-2019 low would terminate the proposed wave structure, and quite possibly the bull market.  Indicative of price/structure, not time. |
|
|
|
|
exstasie
Legendary
Offline
Activity: 1806
Merit: 1521
|
|
May 30, 2019, 08:52:03 PM |
|
Thanks for the update, xxxx123abcxxxx. It's always nice to see some potential wave counts. This looks plausible.
It looks like your predicted A of (2) is an expanded flat. What probability would you give to a running flat instead?
|
|
|
|
|
xxxx123abcxxxx (OP)
|
|
May 30, 2019, 09:21:20 PM |
|
Thanks for the update, xxxx123abcxxxx. It's always nice to see some potential wave counts. This looks plausible.
It looks like your predicted A of (2) is an expanded flat. What probability would you give to a running flat instead?
Its a possibility, but rare. It would be an unnecessary complication denoting a strong bounce to follow. Simple structures are given priority and anticipated first, and then adjusted if required. Personally would expect the mini flash crash low to be revisited, completing an overall Expanded Flat structure. A Running Flat is more likely to occur at the end of a pullback, not half-way through it. |
|
|
|
|
LUCKMCFLY
Legendary
Offline
Activity: 2380
Merit: 1848
Leading Crypto Sports Betting & Casino Platform
|
|
May 30, 2019, 09:40:22 PM |
|
It is a very good analysis because Elliot can apply with his theory, however, it is just a mathematical tool. Have you not applied ELLIOT when the bitcoin is entangling? I mean for me it is always true in Bullih Tendency or Bearish Tendency, in fact you can check it in the graph, but in the current stage of the market it is difficult to forecast it, since it is invalidated many times in the accumulation and distribution stages of the market.
|
| ..Stake.com.. | | | ▄████████████████████████████████████▄
██ ▄▄▄▄▄▄▄▄▄▄ ▄▄▄▄▄▄▄▄▄▄ ██ ▄████▄
██ ▀▀▀▀▀▀▀▀▀▀ ██████████ ▀▀▀▀▀▀▀▀▀▀ ██ ██████
██ ██████████ ██ ██ ██████████ ██ ▀██▀
██ ██ ██ ██████ ██ ██ ██ ██ ██
██ ██████ ██ █████ ███ ██████ ██ ████▄ ██
██ █████ ███ ████ ████ █████ ███ ████████
██ ████ ████ ██████████ ████ ████ ████▀
██ ██████████ ▄▄▄▄▄▄▄▄▄▄ ██████████ ██
██ ▀▀▀▀▀▀▀▀▀▀ ██
▀█████████▀ ▄████████████▄ ▀█████████▀
▄▄▄▄▄▄▄▄▄▄▄▄███ ██ ██ ███▄▄▄▄▄▄▄▄▄▄▄▄
██████████████████████████████████████████ | | | | | | ▄▀▀▀▀▀▀▀▀▀▀▀▀▀▀▀▀▀▀▄
█ ▄▀▄ █▀▀█▀▄▄
█ █▀█ █ ▐ ▐▌
█ ▄██▄ █ ▌ █
█ ▄██████▄ █ ▌ ▐▌
█ ██████████ █ ▐ █
█ ▐██████████▌ █ ▐ ▐▌
█ ▀▀██████▀▀ █ ▌ █
█ ▄▄▄██▄▄▄ █ ▌▐▌
█ █▐ █
█ █▐▐▌
█ █▐█
▀▄▄▄▄▄▄▄▄▄▄▄▄▄▄▄▄▄▄▀█ | | | | | | ▄▄█████████▄▄
▄██▀▀▀▀█████▀▀▀▀██▄
▄█▀ ▐█▌ ▀█▄
██ ▐█▌ ██
████▄ ▄█████▄ ▄████
████████▄███████████▄████████
███▀ █████████████ ▀███
██ ███████████ ██
▀█▄ █████████ ▄█▀
▀█▄ ▄██▀▀▀▀▀▀▀██▄ ▄▄▄█▀
▀███████ ███████▀
▀█████▄ ▄█████▀
▀▀▀███▄▄▄███▀▀▀ | | | ..PLAY NOW.. |
|
|
|
|
MrPresident
|
|
June 04, 2019, 06:10:34 AM |
|
since what is invalidated?
|
Develop Custom Decentralized Blockchain Applications in JavaScript with LISK!
Website | Blog | BTT Thread | Chat - Be part of the decentralized application movement!
|
|
|
|
xxxx123abcxxxx (OP)
|
|
June 04, 2019, 07:43:21 PM |
|
since what is invalidated?
Nothing is invalidated. If the 30-MAY high is exceeded, then the proposed Elliott Wave count is invalidated. If the 06-FEB low is exceeded, then the proposed Elliott Wave count is invalidated. For now, the proposed Elliott Wave model remains on course for an average decline towards 5300, perhaps by mid-JUL. |
|
|
|
|
|
fabiorem
|
|
June 04, 2019, 07:56:10 PM |
|
since what is invalidated?
Nothing is invalidated. If the 30-MAY high is exceeded, then the proposed Elliott Wave count is invalidated. If the 06-FEB low is exceeded, then the proposed Elliott Wave count is invalidated. For now, the proposed Elliott Wave model remains on course for an average decline towards 5300, perhaps by mid-JUL. Seems likely to happen earlier, as it fell $1500 by now. $5300 by the end of this month. |
|
|
|
|
figmentofmyass
Legendary
Offline
Activity: 1652
Merit: 1483
|
|
June 05, 2019, 04:29:05 AM |
|
Nothing is invalidated.
If the 30-MAY high is exceeded, then the proposed Elliott Wave count is invalidated.
If the 06-FEB low is exceeded, then the proposed Elliott Wave count is invalidated.
For now, the proposed Elliott Wave model remains on course for an average decline towards 5300, perhaps by mid-JUL.
Seems likely to happen earlier, as it fell $1500 by now. $5300 by the end of this month. if his count is correct, then this is only the first of two legs down. the bounce in between would probably take some weeks to complete. sometimes B waves drag out a long time. |
|
|
|
|
kronos123
|
|
June 05, 2019, 08:32:44 PM |
|
It is a very good analysis because Elliot can apply with his theory, however, it is just a mathematical tool. Have you not applied ELLIOT when the bitcoin is entangling? I mean for me it is always true in Bullih Tendency or Bearish Tendency, in fact you can check it in the graph, but in the current stage of the market it is difficult to forecast it, since it is invalidated many times in the accumulation and distribution stages of the market.
In fact OP tries to give its subjective evaluation of the market; AT is always valid AFTER, when there is a clear and definitive graph .... you can never be 100% certain of a trend until it is confirmed, or denied, by prices and the graph. Here is why OP has indicated two possible scenarios from now until 2020. |
|
|
|
|
adaseb
Legendary
Offline
Activity: 3724
Merit: 1708
|
|
June 05, 2019, 10:28:57 PM |
|
About 10 years ago when I started to trade stocks I learnt of the Elliott Wave method and was intriged by it. I basically got all the courses, ebooks and other trading material on Elliott Wave type of trading.
I even had a type of software that would search all the stocks on NYSE and Nasdaq and would find ones that gave a signal. However the issues with Elliot Wave was this...
It works great in hindsight... however its very difficult to use in real time.
I would lose money constantely and decided to drop it all together. I think if you want to use EW then you need to use some other form of TA such as trends, moving averages, support/resistance, etc.
|
|
|
|
Febo
Legendary
Offline
Activity: 2730
Merit: 1288
|
|
June 06, 2019, 04:23:22 PM |
|
since what is invalidated?
Nothing is invalidated. If the 30-MAY high is exceeded, then the proposed Elliott Wave count is invalidated. If the 06-FEB low is exceeded, then the proposed Elliott Wave count is invalidated. For now, the proposed Elliott Wave model remains on course for an average decline towards 5300, perhaps by mid-JUL. Seems likely to happen earlier, as it fell $1500 by now. $5300 by the end of this month. Amazing. That is only $200 higher then my prediction from 20th march https://bitcointalk.org/index.php?topic=5122750.msg50259426#msg50259426 I speculated the bear trap will be in full motion at that time. |
|
|
|
|
|
|
|
fabiorem
|
|
June 06, 2019, 05:19:22 PM |
|
since what is invalidated?
Nothing is invalidated. If the 30-MAY high is exceeded, then the proposed Elliott Wave count is invalidated. If the 06-FEB low is exceeded, then the proposed Elliott Wave count is invalidated. For now, the proposed Elliott Wave model remains on course for an average decline towards 5300, perhaps by mid-JUL. Seems likely to happen earlier, as it fell $1500 by now. $5300 by the end of this month. Amazing. That is only $200 higher then my prediction from 20th march https://bitcointalk.org/index.php?topic=5122750.msg50259426#msg50259426 I speculated the bear trap will be in full motion at that time. In that standard bubble chart, it would be the "first sell off" and "bear trap" phase. I believe we are already on it, because it fell $1500 in just some days. Some bearwhales are in a hurry to be trapped. The "despair" phase from the previous bubble is already over, and we are back to the mean. |
|
|
|
|
wwzsocki
Legendary
Offline
Activity: 2716
Merit: 1706
First 100% Liquid Stablecoin Backed by Gold
|
|
June 06, 2019, 06:59:40 PM |
|
I see nothing wrong in this pullbacks. I would be rather afraid if the price will go up even higher to 10K or more without any drawbacks.
This is normal price action and we have seen it already a few times during the last few years.
30, 50 or 70% drop after such a spike is common and was expected. All indicators signaled such a course of action.
Maybe these shorter time intervals are not so clear but if someone is watching the weekly chart for the BTC price, then everything is clear as for a preschooler.
It is surprising that someone could be surprised by the recent drops and even lose money.
Returning to the main topic, I think that the OP analysis is very interesting and will probably work.
|
|
|
|
|
kronos123
|
|
June 06, 2019, 07:05:32 PM |
|
About 10 years ago when I started to trade stocks I learnt of the Elliott Wave method and was intriged by it. I basically got all the courses, ebooks and other trading material on Elliott Wave type of trading.
I even had a type of software that would search all the stocks on NYSE and Nasdaq and would find ones that gave a signal. However the issues with Elliot Wave was this...
It works great in hindsight... however its very difficult to use in real time.
I would lose money constantely and decided to drop it all together. I think if you want to use EW then you need to use some other form of TA such as trends, moving averages, support/resistance, etc.
Exactly, that's exactly what I tried to make clear in my previous post; all the AT and more with the Elliot waves one has the certainty AFTER that the prices are shown in the graph. AT in general, Elliot, Gann, Fibonacci, etc. they can help the trader or the investor but they will never be perfect sciences, otherwise we would all be rich and we would follow the same rules and indicators. |
|
|
|
|
|
Oilacris
|
|
June 06, 2019, 07:09:27 PM |
|
I see nothing wrong in this pullbacks. I would be rather afraid if the price will go up even higher to 10K or more without any drawbacks.
This is normal price action and we have seen it already a few times during the last few years.
30, 50 or 70% drop after such a spike is common and was expected. All indicators signaled such a course of action.
Maybe these shorter time intervals are not so clear but if someone is watching the weekly chart for the BTC price, then everything is clear as for a preschooler.
It is surprising that someone could be surprised by the recent drops and even lose money.
Returning to the main topic, I think that the OP analysis is very interesting and will probably work.
I'm even surprised that most people do react or being shocked when theres a sudden plunged on btc price after a price rally without even realizing that the thing they do like to see is like having an unlimited boost up without even realizing that a healthy market do always have that price pullback or correction. About Elliot Wave thing,im aware of this stuff when I'm still on Forex but I don't think it would be more precise or applicable on crypto market. |
| ..Stake.com.. | | | ▄████████████████████████████████████▄
██ ▄▄▄▄▄▄▄▄▄▄ ▄▄▄▄▄▄▄▄▄▄ ██ ▄████▄
██ ▀▀▀▀▀▀▀▀▀▀ ██████████ ▀▀▀▀▀▀▀▀▀▀ ██ ██████
██ ██████████ ██ ██ ██████████ ██ ▀██▀
██ ██ ██ ██████ ██ ██ ██ ██ ██
██ ██████ ██ █████ ███ ██████ ██ ████▄ ██
██ █████ ███ ████ ████ █████ ███ ████████
██ ████ ████ ██████████ ████ ████ ████▀
██ ██████████ ▄▄▄▄▄▄▄▄▄▄ ██████████ ██
██ ▀▀▀▀▀▀▀▀▀▀ ██
▀█████████▀ ▄████████████▄ ▀█████████▀
▄▄▄▄▄▄▄▄▄▄▄▄███ ██ ██ ███▄▄▄▄▄▄▄▄▄▄▄▄
██████████████████████████████████████████ | | | | | | ▄▀▀▀▀▀▀▀▀▀▀▀▀▀▀▀▀▀▀▄
█ ▄▀▄ █▀▀█▀▄▄
█ █▀█ █ ▐ ▐▌
█ ▄██▄ █ ▌ █
█ ▄██████▄ █ ▌ ▐▌
█ ██████████ █ ▐ █
█ ▐██████████▌ █ ▐ ▐▌
█ ▀▀██████▀▀ █ ▌ █
█ ▄▄▄██▄▄▄ █ ▌▐▌
█ █▐ █
█ █▐▐▌
█ █▐█
▀▄▄▄▄▄▄▄▄▄▄▄▄▄▄▄▄▄▄▀█ | | | | | | ▄▄█████████▄▄
▄██▀▀▀▀█████▀▀▀▀██▄
▄█▀ ▐█▌ ▀█▄
██ ▐█▌ ██
████▄ ▄█████▄ ▄████
████████▄███████████▄████████
███▀ █████████████ ▀███
██ ███████████ ██
▀█▄ █████████ ▄█▀
▀█▄ ▄██▀▀▀▀▀▀▀██▄ ▄▄▄█▀
▀███████ ███████▀
▀█████▄ ▄█████▀
▀▀▀███▄▄▄███▀▀▀ | | | ..PLAY NOW.. |
|
|
|
|
xxxx123abcxxxx (OP)
|
|
June 13, 2019, 09:15:21 PM |
|
Idealized guesswork Elliott Wave model, indicative of price/structure, not time... 19-JUN-2019: Bitcoin CBOE Futures Expiry
28-JUN-2019: Bitcoin CME Futures Expiry
 |
|
|
|
|
|
BMG86
|
|
June 18, 2019, 12:04:32 AM |
|
To me it looks more like your Complex scenario is playing out. We are going up very fast with only minor pullbacks. We may see 11k+ in the next week or 2 at this rate.
|
|
|
|
|
|
xxxx123abcxxxx (OP)
|
|
June 18, 2019, 12:33:31 AM |
|
2019 Cryptocurrency (Elliott Wave): Solstice Updatehttps://www.reddit.com/r/BitcoinMarkets/comments/c1vg8o/2019_cryptocurrency_elliott_wave_solstice_update/The 2019 Bitcoin bull market which began from the lows of 06-FEB-2019, has now retraced a Fibonacci 38.2% of the entire 2018 bear market, thus far into JUN-2019. The largest pullback of this bull market occurred from 14-MAY to 17-MAY, where a mini flash crash saw a rapid sell-off of up to 25% declines on multiple exchanges, notably pronounced on BITSTAMP and BITMEX. Afterwards, from mid-MAY to mid-JUN, price action produced a choppy sideways affair elapsing a month with no clear direction. Consequently, it was expected the first wave of the bull market had completed, and the first notable pullback of the bull market was imminently underway, correlating with the Sell In May And Go Away adage which gripped the stockmarket. This has proved to be incorrect. The month of choppy sideways price action has resolved with a breakout to the upside, necessitating a revision to the Elliott Wave model
 The characteristics of the 2019 bull market thus far, can be summarised by the following revised Elliott Wave model: + Wave-1 (06-FEB 23-APR): subdivided into smaller degree impulsive waves.
- Wave-2 (23-APR 25-APR): a simple Zig Zag correction.
+ Wave-3 (25-APR 14-MAY): a parabolic rise.
- Wave-4 (14-MAY 09-JUN): a complex Running Flat correction.
+ Wave-5 (09-JUN ?): a parabolic rise?
The final and fifth wave of the waveset appears to be underway since 09-JUN. The following price zones speculate where this may terminate; using BITSTAMP prices: @9440: Fibonacci 38.2% retracement of the entire 2018 bear market.
@11390: Fibonacci 50.0% retracement of the entire 2018 bear market.
@13340: Fibonacci 61.8% retracement of the entire 2018 bear market.
The first aforementioned Fibonacci zone has already been reached; hence, there is a possibility to suggest the uptrend has either completed, or is nearing completion. The Grayscale Bitcoin Trust (GBTC) passively tracks the price of Bitcoin, but trades on the OTC markets from Mon to Fri during the hours of US equity markets. The reduced price action of a non-continuous contract may offer clarity with parabolic waves; at this point in time a drop to 10.8 is required to suggest the uptrend is complete
 Once the uptrend concludes, it completes the first notable advance of the 2019 Bitcoin bull market. At which point, a Fibonacci 61.8% retracement may be expected for the first notable pullback of the 2019 Bitcoin bull market; perhaps commencing in the week of the Solstice and elapsing a couple of months over the summer lull. Afterwards, the bull market is expected to parabolically reignite by the early autumn and head towards new all-time highs in 2020. The long-term overall Elliott Wave model suggests four PRIMARY degree waves completed from mid-2010 to early-2019, and the fifth advancing wave is currently underway. Waves of PRIMARY degree elapse from a few months to a couple of years. A common wave relationship guides the price of the fifth wave to be equal to, or extend a Fibonacci 1.618 times, the length from the low of the first wave through to the high of third wave, projected from the low of the fourth wave. This provides a conservative target of the current bull market to conclude between $22912 and $35127, calculated using the BraveNewCoin (BNC:BLX) index
@22912: PRIMARY[5] = (PRIMARY[1] + PRIMARY[3]) * 1
@35127: PRIMARY[5] = (PRIMARY[1] + PRIMARY[3]) * 1.618
Adjusted and renewed targets can be expected in the event of subdividing and extending waves.  Notable dates and seasonal esoteric trivia
17-JUN-2019: Full Moon
19-JUN-2019: Bitcoin CBOE Futures Expiry
19-JUN-2019: FOMC Fed Interest Rate Decision
21-JUN-2019: Solstice
28-JUN-2019: Bitcoin CME Futures Expiry
Guesswork is indicative of price/structure, not time.
|
|
|
|
|
figmentofmyass
Legendary
Offline
Activity: 1652
Merit: 1483
|
|
June 18, 2019, 06:20:25 AM |
|
thanks for the update, xxxx123abcxxxx. i was looking forward to a revision of the count.  i'm partial to the scenario where (1) completes ~$12k. looking at the proportions of the internal waves 1 and 3, i expect a more pronounced fifth wave than this quick push above $9k. |
|
|
|
|
BMG86
|
|
June 18, 2019, 02:33:09 PM |
|
2019 Cryptocurrency (Elliott Wave): Solstice Updatehttps://www.reddit.com/r/BitcoinMarkets/comments/c1vg8o/2019_cryptocurrency_elliott_wave_solstice_update/The 2019 Bitcoin bull market which began from the lows of 06-FEB-2019, has now retraced a Fibonacci 38.2% of the entire 2018 bear market, thus far into JUN-2019. The largest pullback of this bull market occurred from 14-MAY to 17-MAY, where a mini flash crash saw a rapid sell-off of up to 25% declines on multiple exchanges, notably pronounced on BITSTAMP and BITMEX. Afterwards, from mid-MAY to mid-JUN, price action produced a choppy sideways affair elapsing a month with no clear direction. Consequently, it was expected the first wave of the bull market had completed, and the first notable pullback of the bull market was imminently underway, correlating with the Sell In May And Go Away adage which gripped the stockmarket. This has proved to be incorrect. The month of choppy sideways price action has resolved with a breakout to the upside, necessitating a revision to the Elliott Wave model
The characteristics of the 2019 bull market thus far, can be summarised by the following revised Elliott Wave model: + Wave-1 (06-FEB 23-APR): subdivided into smaller degree impulsive waves.
- Wave-2 (23-APR 25-APR): a simple Zig Zag correction.
+ Wave-3 (25-APR 14-MAY): a parabolic rise.
- Wave-4 (14-MAY 09-JUN): a complex Running Flat correction.
+ Wave-5 (09-JUN ?): a parabolic rise?
The final and fifth wave of the waveset appears to be underway since 09-JUN. The following price zones speculate where this may terminate; using BITSTAMP prices: @9440: Fibonacci 38.2% retracement of the entire 2018 bear market.
@11390: Fibonacci 50.0% retracement of the entire 2018 bear market.
@13340: Fibonacci 61.8% retracement of the entire 2018 bear market.
The first aforementioned Fibonacci zone has already been reached; hence, there is a possibility to suggest the uptrend has either completed, or is nearing completion. The Grayscale Bitcoin Trust (GBTC) passively tracks the price of Bitcoin, but trades on the OTC markets from Mon to Fri during the hours of US equity markets. The reduced price action of a non-continuous contract may offer clarity with parabolic waves; at this point in time a drop to 10.8 is required to suggest the uptrend is complete
Once the uptrend concludes, it completes the first notable advance of the 2019 Bitcoin bull market. At which point, a Fibonacci 61.8% retracement may be expected for the first notable pullback of the 2019 Bitcoin bull market; perhaps commencing in the week of the Solstice and elapsing a couple of months over the summer lull. Afterwards, the bull market is expected to parabolically reignite by the early autumn and head towards new all-time highs in 2020. The long-term overall Elliott Wave model suggests four PRIMARY degree waves completed from mid-2010 to early-2019, and the fifth advancing wave is currently underway. Waves of PRIMARY degree elapse from a few months to a couple of years. A common wave relationship guides the price of the fifth wave to be equal to, or extend a Fibonacci 1.618 times, the length from the low of the first wave through to the high of third wave, projected from the low of the fourth wave. This provides a conservative target of the current bull market to conclude between $22912 and $35127, calculated using the BraveNewCoin (BNC:BLX) index
@22912: PRIMARY[5] = (PRIMARY[1] + PRIMARY[3]) * 1
@35127: PRIMARY[5] = (PRIMARY[1] + PRIMARY[3]) * 1.618
Adjusted and renewed targets can be expected in the event of subdividing and extending waves. Notable dates and seasonal esoteric trivia
17-JUN-2019: Full Moon
19-JUN-2019: Bitcoin CBOE Futures Expiry
19-JUN-2019: FOMC Fed Interest Rate Decision
21-JUN-2019: Solstice
28-JUN-2019: Bitcoin CME Futures Expiry
Guesswork is indicative of price/structure, not time. Do you still see the possibility of your Complex Scenario B playing out? |
|
|
|
|
|
guoyu78
|
|
June 18, 2019, 03:47:07 PM |
|
The revision basically shows that "it could always be wrong" and now we are seeing another chart, look if the first one didn't happen and market reacted differently than you expected then there is a big chance the second may not happen neither, or maybe it will but that will not because you "got it right" since you already assumed it would go down and it didn't.
Price is NEVER going down to under 6 thousand dollars from now on, it would require a lot of pull backs all in a row without a proper increase in between and that is unlikely to happen, how could it go down constantly without going up on a bull market time, its not like we went above 20 thousand dollars neither so there are still a lot of support and very little resistance left.
I don't use charts that much but even looking at the price and how it moved in the past 2 months we can clearly say its going up for now until an undecided date.
|
|
|
|
|
|
fabiorem
|
|
June 18, 2019, 04:32:46 PM |
|
The revision basically shows that "it could always be wrong" and now we are seeing another chart, look if the first one didn't happen and market reacted differently than you expected then there is a big chance the second may not happen neither, or maybe it will but that will not because you "got it right" since you already assumed it would go down and it didn't.
Thats because Eliott wave analysis works better after the movement happened, not before. Like the OP said, the chart indicates price and structure, but not the time of it. Personally, I dont believe anymore that we are going to see 5k at the end of this month. If it was to be like that the price would have fall back to 6k during the recent $1500 "correction". Also I believe we have more hodlers now than we had two months ago, and all this FUD about CSW, Satoshi, etc, are making the hodlers more resilient, just to make opposition to the bad actors. You can notice the OP moved the 5k to September, to maintain the wave analysis, but after August the price will probably go to full recovery mode. It would made more sense if the low is put at 7k, giving a 5k range between it and 12k. |
|
|
|
|
|
xxxx123abcxxxx (OP)
|
|
June 18, 2019, 05:20:52 PM
Last edit: June 19, 2019, 08:50:34 AM by xxxx123abcxxxx |
|
thanks for the update, xxxx123abcxxxx. i was looking forward to a revision of the count. i'm partial to the scenario where (1) completes ~$12k. looking at the proportions of the internal waves 1 and 3, i expect a more pronounced fifth wave than this quick push above $9k. Quite possibly at a juncture here with two options; either... - 1. the final wave-5 from the 09-JUN low has completed at the 17-JUN high (Full Moon!), and the top is already complete at the 9440 BITSTAMP zone; or
- 2. the final wave-5 is going to subdivide and extend further towards the 11390 BITSTAMP zone, or beyond.
A loss of 10.8/GBTC and 8200/BTC ought to give credence to the first scenario.  |
|
|
|
|
|
xxxx123abcxxxx (OP)
|
|
June 18, 2019, 05:51:10 PM |
|
Do you still see the possibility of your Complex Scenario B playing out?
Yes, it is still possible that this is a cyclical (i.e. short-term) bull market, termed as a wave-x, in an ongoing secular (i.e. long-term) bear market, which fails to meet the all-time 2017 high. For now however, the waves appear to be developing impulsively and suggesting a wave-5 is unfolding, eventually towards meeting or exceeding the all-time 2017 high. At this point in time, a wave-x may develop in the following two scenarios: - 1. A drop below the 09-JUN low, followed by an advance towards either 11390 or 13340 which develops in corrective waves instead of impulsive; or,
- 2. A drop below the 06-FEB low.
|
|
|
|
|
|
BMG86
|
|
June 18, 2019, 05:55:31 PM |
|
Do you still see the possibility of your Complex Scenario B playing out?
Yes, it is still possible that this is a cyclical (i.e. short-term) bull market, termed as a wave-x, in an ongoing secular (i.e. long-term) bear market, which fails to meet the all-time 2017 high. For now however, the waves appear to be developing impulsively and suggesting a wave-5 is unfolding, eventually towards meeting or exceeding the all-time 2017 high. At this point in time, a wave-x may develop in the following two scenarios: - 1. A drop below the 09-JUN low, followed by an advance towards either 11390 or 13340 which develops in corrective waves instead of impulsive; or,
- 2. A drop below the 06-FEB low.
Thank you for your input. |
|
|
|
|
|
xxxx123abcxxxx (OP)
|
|
June 18, 2019, 06:43:05 PM |
|
The revision basically shows that "it could always be wrong" and now we are seeing another chart, look if the first one didn't happen and market reacted differently than you expected then there is a big chance the second may not happen neither, or maybe it will but that will not because you "got it right" since you already assumed it would go down and it didn't.
Yes, the revised Elliott Wave model may still be incorrect. Technical Analysis is not objective. This is a subjective discipline in attempt to quantify qualitative speculation. If any system provided absolute 100% predictability, would there be free will...? The marketplace is based on probabilities, perhaps even based on random walk hypothesis; the endeavor of Elliott Wave and other Technical Analysis is an attempt to forecast market trends. Like the weather, the market is a natural phenomena. Climatologists will look for causality in global warming using climate change; likewise, economists will look for causality in price stability using monetary policy. Both are natural cycles which we mostly react towards, and seldom influence. Truth is, no seismologist can predict the magnitude of an earthquake, no climatologist can predict the El Nino, and no economist can predict the market. All models are subjective and adapt to new incoming information, your role is to determine the most probabilistic outcome, perhaps even intuitively. Thats because Eliott wave analysis works better after the movement happened, not before. Like the OP said, the chart indicates price and structure, but not the time of it.
Personally, I dont believe anymore that we are going to see 5k at the end of this month. If it was to be like that the price would have fall back to 6k during the recent $1500 "correction". Also I believe we have more hodlers now than we had two months ago, and all this FUD about CSW, Satoshi, etc, are making the hodlers more resilient, just to make opposition to the bad actors.
You can notice the OP moved the 5k to September, to maintain the wave analysis, but after August the price will probably go to full recovery mode. It would made more sense if the low is put at 7k, giving a 5k range between it and 12k.
Once a top can be confirmed, more accurate pullback targets can be defined. For example, if the market tops at say $12,000; then a typical 50% or 61.8% retrace would be around $7500 or $6500 respectively. |
|
|
|
|
oarmas
Newbie
Offline
Activity: 12
Merit: 9
|
|
June 19, 2019, 03:29:52 AM |
|
Hey xxxx123abcxxxx: love your updates. Have you considered the possibility that primary 3 may be primary 5 (or maybe primary 1) and we're in a longer correction. The FIB time allowance for this is that the down trend should cover the aggregated of time for the lesser degree waves 2 and 4 which is about 987 FIB days, suggesting an end to the cycle by Sep 2020. This would match the last major halving, now that the banking system has to adjust their fiat money printing to bitcoin expansion, this would imply a major slowdown in M2 expansion, or if the trend stays at 4% growth a doubling of the bitcoin price every six months until M2 slows down. Bitcoin slows to 2% growth on May 23 2020, it currently matches the M2 expansion of around 4%.
|
|
|
|
|
|
xxxx123abcxxxx (OP)
|
|
June 19, 2019, 08:29:51 AM
Last edit: June 19, 2019, 08:53:01 AM by xxxx123abcxxxx |
|
Hey xxxx123abcxxxx: love your updates. Have you considered the possibility that primary 3 may be primary 5 (or maybe primary 1) and we're in a longer correction. The FIB time allowance for this is that the down trend should cover the aggregated of time for the lesser degree waves 2 and 4 which is about 987 FIB days, suggesting an end to the cycle by Sep 2020. This would match the last major halving, now that the banking system has to adjust their fiat money printing to bitcoin expansion, this would imply a major slowdown in M2 expansion, or if the trend stays at 4% growth a doubling of the bitcoin price every six months until M2 slows down. Bitcoin slows to 2% growth on May 23 2020, it currently matches the M2 expansion of around 4%.
Personally only see three waves from 2010 to 2017 so far. Therefore, currently thinking either: 1. its an A-B-C (with complex bear market underway): https://i.imgur.com/zlRbhhX.png2. or, its a 1-2-3 (with 4 complete, and 5 underway): https://i.imgur.com/TnylE6A.pngEither of your suggested possibilities will conclude with the first A-B-C scenario. Only used Fibonacci with price, not time so no experience there to comment. Nevertheless the following are time-based thoughts: Wave 1: the first bull market wave 2010-2013 (1219 days), followed by;
Wave 2: the first bear market wave 2013-2015 (426 days), followed by;
Wave 3: the second bull market wave 2015-2018 (1065 days), followed by;
Wave 4: the second bear market wave 2018-2019 (363 days), followed by;
Wave 5: the third and final bull market wave 2019-?
The five aforementioned have been considered as PRIMARY degree waves such waves elapse the course of a few months to a couple of years. Timewise, the first two bull markets (Waves 1 and 3) elapsed 1142 days on average; and, the first two bear markets (Waves 2 and 4) elapsed 395 days on average. Bull markets have lasted almost three times longer than bear markets. Thus, an intuitive linear projection would propose the current third and final bull market (Wave 5) to complete by the year 2022 or earlier. However, since the current fifth and final Elliott Wave is by typical definition only required to revisit or just exceed the high of the third wave, it may suggest the current bull market may be comparatively contracted in price and time if the waves do not subdivide and extend. |
|
|
|
|
|
xxxx123abcxxxx (OP)
|
|
June 19, 2019, 10:19:28 AM |
|
Using price against the Relative Strength Indicator (RSI) a momentum oscillator used in traditional classical Technical Analysis to determine overbought and oversold market conditions; it can be observed... 1. Daily oversold price/RSI positive divergence occurred during DEC-2018, which marked a key market bottom. 2. Daily overbought price/RSI negative divergence occurred during MAY-2019, which may mark a key market top.  If the current wave-5 does not subdivide and extend further, it would suggest the first leg of the 2019 Bitcoin bull market is complete; and, the first notable pullback may be commencing. Markets usually take the stairs up, and the escalator down. The uptrend from the 06-FEB low to 17-JUN high (thus far) is 131 days. If downtrend elapses in half the time, say 65 days, it may be over by the end of AUG. Should this be correct, the approx expected pullback zones can be defined via Fibonacci retracement levels, using BITSTAMP prices: @6300: 50.0% Fibonacci retracement (min expected zone)
@5500: 61.8% Fibonacci retracement (avg expected zone)
@4480: 78.6% Fibonacci retracement (max expected zone)
19-JUN-2019: Bitcoin CBOE Futures Expiry
19-JUN-2019: FOMC Fed Interest Rate Decision
28-JUN-2019: Bitcoin CME Futures Expiry
28-JUN-2019: G20 Summit
Indicative of price/structure, not time. |
|
|
|
|
oarmas
Newbie
Offline
Activity: 12
Merit: 9
|
|
June 19, 2019, 12:25:58 PM |
|
Thanks for your thoughts, one of the reasons for my thinking is the current primary three on the S and P (SPY) is looking like a 10-16 year wave and bitcoin has been aligning to the stock market cycles surprisingly closely (Wave 3 high in Dec 2017 with the stocks high two months later, lows almost perfect alignment Dec 18), which suggests this next bull market may be much longer than anyone anticipates.
The problem, as you noted in your post, is my timing and wave count for btc don't match the overall appearance of the wave. Even if I was correct, the projected bull market should start at least six months before the halving, so the btc count would not meet the FIB time projection.
The stock market gurus, as you are well aware, called the end of the Feb - Oct 18 wave major 1, not a primary. How would btc look, if that approach were taken?
Fundamentals (btc vs fiat) indicate this next bull cycle will be epic, as the banks will have a very hard time bringing M2 growth down to 2%, the projected growth of btc after next May.
|
|
|
|
|
|
xxxx123abcxxxx (OP)
|
|
June 19, 2019, 09:06:28 PM |
|
Thanks for your thoughts, one of the reasons for my thinking is the current primary three on the S and P (SPY) is looking like a 10-16 year wave and bitcoin has been aligning to the stock market cycles surprisingly closely (Wave 3 high in Dec 2017 with the stocks high two months later, lows almost perfect alignment Dec 18), which suggests this next bull market may be much longer than anyone anticipates.
The problem, as you noted in your post, is my timing and wave count for btc don't match the overall appearance of the wave. Even if I was correct, the projected bull market should start at least six months before the halving, so the btc count would not meet the FIB time projection.
The stock market gurus, as you are well aware, called the end of the Feb - Oct 18 wave major 1, not a primary. How would btc look, if that approach were taken?
Fundamentals (btc vs fiat) indicate this next bull cycle will be epic, as the banks will have a very hard time bringing M2 growth down to 2%, the projected growth of btc after next May.
At the moment, currently seeing the main indices of the US stockmarket (i.e. S&P500 and Dow Jones) in PRIMARY wave-5. If PRIMARY wave-5 equals the length of PRIMARY wave-1 (from 2009-2011), then the Dow Jones may travel towards approx 38,000 barring any wave subdivisions and extensions. Dow Jones 1915-2019 Dow Jones 2008-2019 Dow Jones 2008-2019 |
|
|
|
|
|
kronos123
|
|
June 20, 2019, 02:48:37 AM |
|
Thanks for the latest updates, personally I agree on this latest wave chart that you posted, and that is a 50% Fibonacci retracement test up to $ 11,500, and then go back to testing the long-term support in the area again $ 5000. What I disagree with, however, is the new Bitcoin ATH which indicates in 2020-21 to about $ 35,000; I believe that the FOMO that will be born and will be unleashed in the next few years will bring Bitcoin and the whole market at VERY higher prices than the previous ones. All the "old" banking / financial world is about to enter, and when it does, even with only a fraction of 1-2% of the immense available liquidity, the values and prices of today's crypts will explode like never before. |
|
|
|
|
WinslowIII
Member
Offline
Activity: 308
Merit: 35
|
|
June 21, 2019, 02:44:39 PM |
|
Using price against the Relative Strength Indicator (RSI) a momentum oscillator used in traditional classical Technical Analysis to determine overbought and oversold market conditions; it can be observed... 1. Daily oversold price/RSI positive divergence occurred during DEC-2018, which marked a key market bottom. 2. Daily overbought price/RSI negative divergence occurred during MAY-2019, which may mark a key market top. If the current wave-5 does not subdivide and extend further, it would suggest the first leg of the 2019 Bitcoin bull market is complete; and, the first notable pullback may be commencing. Markets usually take the stairs up, and the escalator down. The uptrend from the 06-FEB low to 17-JUN high (thus far) is 131 days. If downtrend elapses in half the time, say 65 days, it may be over by the end of AUG. Should this be correct, the approx expected pullback zones can be defined via Fibonacci retracement levels, using BITSTAMP prices: @6300: 50.0% Fibonacci retracement (min expected zone)
@5500: 61.8% Fibonacci retracement (avg expected zone)
@4480: 78.6% Fibonacci retracement (max expected zone)
19-JUN-2019: Bitcoin CBOE Futures Expiry
19-JUN-2019: FOMC Fed Interest Rate Decision
28-JUN-2019: Bitcoin CME Futures Expiry
28-JUN-2019: G20 Summit
Indicative of price/structure, not time. I'm expecting something like this as well, but not because of Elliot wave charts, but because of what happened before, during and after the last litecoin halving. I expect a big crash in August, which is litecoin's halving. Will pick back up in November to start the next bull run, the market will also be long due for a shakeout. This will basically be the last chance for a healthy market shakeout before the next halving is right around the corner and only a fool would sell. |
|
|
|
|
exstasie
Legendary
Offline
Activity: 1806
Merit: 1521
|
|
June 21, 2019, 06:18:53 PM |
|
If the current wave-5 does not subdivide and extend further, it would suggest the first leg of the 2019 Bitcoin bull market is complete; and, the first notable pullback may be commencing. I'm expecting something like this as well, but not because of Elliot wave charts, but because of what happened before, during and after the last litecoin halving. I expect a big crash in August, which is litecoin's halving. Will pick back up in November to start the next bull run, the market will also be long due for a shakeout. This will basically be the last chance for a healthy market shakeout before the next halving is right around the corner and only a fool would sell. Timing is so difficult to predict but I'm operating off similar estimates.....a bearish August and September is in the cards. I think the above chart has already been invalidated. The current Wave 5 is now extending so the alternative to ~$12K posted here is more likely. The Litecoin halving hype is still in effect; LTCUSD looks like it's consolidating below the highs, waiting for Bitcoin to pullback, after which LTCBTC will rally again and another round of FOMO will follow. After this next leg up though, it becomes increasingly likely a major correction will occur as we approach the halving date. A strong enough dump in Litecoin after the magnitude of the recent rally will probably have tangible effects on supply and demand in BTCUSD and help finally trigger the long awaited correction in BTC. Bears thought the correction would come at $6K, then $10K. Maybe it'll finally happen at $12K or $13K. |
|
|
|
|
xxxx123abcxxxx (OP)
|
|
June 21, 2019, 10:10:53 PM |
|
Great work as always. I wonder what your opinion is if we consider the case is complex wxy...
Another Primary ABC? or start of an impulse wave?
I find the complex scenario more likely considering volume and other psychological reasons, and also if we consider this rise as a huge B or X wave - If the analyst can easily say to himself - there is something wrong with this market - which is a little connected to this weird and rapid rise...
however considering the bull scenario - 4th waves tend to register their maximum retracement within the span of travel of the previous fourth wave of one lesser degree - When we consider this issue the 4th primary wave which ended at 3148 is exactly the same as the previous fourth wave of one lesser degree in August 2017. So that also makes sense and seems like we do not have to retrace anymore.
So confusing times..
If the W-X-Y scenario is underway (i.e. a secular bear market), then the next secular bull market cycle will be expected to unfold in an A-B-C structure once again but not necessarily in the same pattern or timespan again. The risk with the W-X-Y scenario, is that it has the potential to completely collapse the market with no return i.e. a collapse of a true bubble. |
|
|
|
|
WinslowIII
Member
Offline
Activity: 308
Merit: 35
|
|
June 22, 2019, 04:03:51 AM |
|
Great work as always. I wonder what your opinion is if we consider the case is complex wxy...
Another Primary ABC? or start of an impulse wave?
I find the complex scenario more likely considering volume and other psychological reasons, and also if we consider this rise as a huge B or X wave - If the analyst can easily say to himself - there is something wrong with this market - which is a little connected to this weird and rapid rise...
however considering the bull scenario - 4th waves tend to register their maximum retracement within the span of travel of the previous fourth wave of one lesser degree - When we consider this issue the 4th primary wave which ended at 3148 is exactly the same as the previous fourth wave of one lesser degree in August 2017. So that also makes sense and seems like we do not have to retrace anymore.
So confusing times..
If the W-X-Y scenario is underway (i.e. a secular bear market), then the next secular bull market cycle will be expected to unfold in an A-B-C structure once again but not necessarily in the same pattern or timespan again. The risk with the W-X-Y scenario, is that it has the potential to completely collapse the market with no return i.e. a collapse of a true bubble. "with no return" You're a funny guy. |
|
|
|
|
|
BMG86
|
|
June 22, 2019, 07:44:26 PM |
|
Great work as always. I wonder what your opinion is if we consider the case is complex wxy...
Another Primary ABC? or start of an impulse wave?
I find the complex scenario more likely considering volume and other psychological reasons, and also if we consider this rise as a huge B or X wave - If the analyst can easily say to himself - there is something wrong with this market - which is a little connected to this weird and rapid rise...
however considering the bull scenario - 4th waves tend to register their maximum retracement within the span of travel of the previous fourth wave of one lesser degree - When we consider this issue the 4th primary wave which ended at 3148 is exactly the same as the previous fourth wave of one lesser degree in August 2017. So that also makes sense and seems like we do not have to retrace anymore.
So confusing times..
If the W-X-Y scenario is underway (i.e. a secular bear market), then the next secular bull market cycle will be expected to unfold in an A-B-C structure once again but not necessarily in the same pattern or timespan again. The risk with the W-X-Y scenario, is that it has the potential to completely collapse the market with no return i.e. a collapse of a true bubble. While I don't know much about Elliot wave, but is it possible we are currently in the B wave of an ABC correction? I.e. wave A is from 20k -3k?. This 'bull market' seems very fishy as we've already retraced more than 50 percent from the bear market. |
|
|
|
|
|
xxxx123abcxxxx (OP)
|
|
June 24, 2019, 04:49:05 AM |
|
While I don't know much about Elliot wave, but is it possible we are currently in the B wave of an ABC correction? I.e. wave A is from 20k -3k?. This 'bull market' seems very fishy as we've already retraced more than 50 percent from the bear market.
Yes, this is possible. However, it will be labelled as currently in the X wave of an WXY correction see Scenario B (Complex) here: https://bitcointalk.org/index.php?topic=5128394.msg50467456#msg50467456 |
|
|
|
|
sedactoo+04
Full Member
Offline
Activity: 161
Merit: 175
Hello World!
|
|
June 25, 2019, 05:00:19 PM |
|
While I don't know much about Elliot wave, but is it possible we are currently in the B wave of an ABC correction? I.e. wave A is from 20k -3k?. This 'bull market' seems very fishy as we've already retraced more than 50 percent from the bear market.
Yes, this is possible. However, it will be labelled as currently in the X wave of an WXY correction see Scenario B (Complex) here: https://bitcointalk.org/index.php?topic=5128394.msg50467456#msg50467456 Your complex scenario seems to be perfectly playing both price and time. I am not convinced for the bull yet. I would love to see your thoughts and updates about it. Thanks for your great work. |
|
|
|
|
exstasie
Legendary
Offline
Activity: 1806
Merit: 1521
|
|
June 25, 2019, 07:44:49 PM |
|
Your complex scenario seems to be perfectly playing both price and time. I am not convinced for the bull yet.
I would love to see your thoughts and updates about it.
Thanks for your great work.
It's okay not to be convinced, but make sure to stay open to alternative theories. The biggest pitfall of EW analysis is getting married to a specific count, then continually reworking the count as it gets repeatedly invalidated. I struggled with this a lot years ago. Sometimes being "not convinced for the bull" really means "I can't see past my bear bias." This is why it's good to always have at least two different counts you are tracking. Which count is ultimately correct may only be obvious in hindsight, hence the danger of becoming too attached to the wrong one. My thoughts are definitely more in line with xxxx123abcxxxx's bull count. Of course, we won't be able to discard the complex bear correction scenario for quite some time yet. |
|
|
|
sedactoo+04
Full Member
Offline
Activity: 161
Merit: 175
Hello World!
|
|
June 25, 2019, 09:34:54 PM |
|
Your complex scenario seems to be perfectly playing both price and time. I am not convinced for the bull yet.
I would love to see your thoughts and updates about it.
Thanks for your great work.
It's okay not to be convinced, but make sure to stay open to alternative theories. The biggest pitfall of EW analysis is getting married to a specific count, then continually reworking the count as it gets repeatedly invalidated. I struggled with this a lot years ago. Sometimes being "not convinced for the bull" really means "I can't see past my bear bias." This is why it's good to always have at least two different counts you are tracking. Which count is ultimately correct may only be obvious in hindsight, hence the danger of becoming too attached to the wrong one. My thoughts are definitely more in line with xxxx123abcxxxx's bull count. Of course, we won't be able to discard the complex bear correction scenario for quite some time yet. you are totally right my friend... thanks for warning me. Unfortunately, EW has that downside. However the main reason why I am not convinced is the volume and altcoin movements. Of course I am aware of one of the biggest reasons for the 2017 bull start was the tether printing which we have again... But still the volume is not convincing for me... But again I agree with marrying a specific count issue, that is one of my weaknesses too... I was so convinced that the bear has not ended so maybe still I am trapped in that phase. |
|
|
|
|
|
xxxx123abcxxxx (OP)
|
|
June 26, 2019, 12:49:16 AM
Last edit: June 26, 2019, 01:05:55 AM by xxxx123abcxxxx |
|
Your complex scenario seems to be perfectly playing both price and time. I am not convinced for the bull yet.
I would love to see your thoughts and updates about it.
Thanks for your great work.
It's okay not to be convinced, but make sure to stay open to alternative theories. The biggest pitfall of EW analysis is getting married to a specific count, then continually reworking the count as it gets repeatedly invalidated. I struggled with this a lot years ago. Sometimes being "not convinced for the bull" really means "I can't see past my bear bias." This is why it's good to always have at least two different counts you are tracking. Which count is ultimately correct may only be obvious in hindsight, hence the danger of becoming too attached to the wrong one. My thoughts are definitely more in line with xxxx123abcxxxx's bull count. Of course, we won't be able to discard the complex bear correction scenario for quite some time yet. you are totally right my friend... thanks for warning me. Unfortunately, EW has that downside. However the main reason why I am not convinced is the volume and altcoin movements. Of course I am aware of one of the biggest reasons for the 2017 bull start was the tether printing which we have again... But still the volume is not convincing for me... But again I agree with marrying a specific count issue, that is one of my weaknesses too... I was so convinced that the bear has not ended so maybe still I am trapped in that phase. Whilst is does appear and feel like the wave-x complex scenario is playing out; the details show the waves are so far unfolding impulsively, and thus implying the wave-5 simple scenario is currently in progress. Either of the following situations are required to qualify the wave-x scenario: 1. A drop below the 06-JUN low, followed by another advance which develops in corrective waves instead of impulsive; or, 2. A drop below the 06-FEB low.  The market has now surpassed the 50% Fibonacci retracement of the entire 2018 bear market. The next major Fibonacci retracements are: 1. the 61.8% (13350/BITSTAMP) 2. the 78.6% (16125/BITSTAMP) Given such Fibonacci levels are widely observed, it is unlikely the market terminates precisely at these levels. A monthly view of the wave structure illustrates the sizes of the impulsive waves, since the 2019 bull market began from the FEB lows; using BITFINEX:  - wave-1: 67%
- wave-3: 63%
- wave-5: 59% (so far, 25-JUN)
At this point in time, another 10% for wave-5, and it meets the average of wave-1 and wave-3. The following 4hr chart provides a speculative view of how wave-5 may be currently unfolding, since the 06-JUN lows; using COINBASE:  Speculation is indicative of price/structure, not time. 28-JUN-2019: Bitcoin CME Futures Expiry
28-JUN-2019: G20 Summit
|
|
|
|
|
drays
Legendary
Offline
Activity: 2520
Merit: 1073
|
|
June 26, 2019, 10:29:10 AM
Last edit: June 26, 2019, 10:16:09 PM by drays |
|
Guys, sorry for spoiling this pure technical discussion (which I don't fully understand, but appreciate a lot regardless), just wanted to talk about fundamentals a little bit. Does anyone think this rally could have been fueled by Libra announcement, with general masses getting aware (or getting reminded) of cryptocurrency. Facebook with its sheep userbase could be a major factor in adoption (or better to say, in awareness) of Bitcoin; where I live people are pretty skeptical in general (and in regards to Bitcoin specifically), Bitcoin awareness is maybe 1000x less than participation in FB. Few people already referred to FB cryptocurrency in our conversations - those were the ones who know about Bitcoin, but never considered it seriously. From the other hand, I am not sure a pure announcement could have such an impact. Any opinions? P.S. Greetings to xxxx123abcxxxx . I was not posting here, but I surely read this thread. Didn't post, just because the main point of our disagreement on the old thread seems to be resolved (hopefully), and here we see pure technical, quite interesting analysis, without questionable long-term predictions you were making in the old thread. |
... this space is not for rent ... |
|
|
|
xxxx123abcxxxx (OP)
|
|
June 27, 2019, 12:05:40 AM |
|
Guys, sorry for spoiling this pure technical discussion (which I don't fully understand, but appreciate a lot regardless), just wanted to talk about fundamentals a little bit. Does anyone think this rally could have been fueled by Libra announcement, with general masses getting aware (or getting reminded) of cryptocurrency. Facebook with its sheep userbase could be a major factor in adoption (or better to say, in awareness) of Bitcoin; where I live people are pretty skeptical in general (and in regards to Bitcoin specifically), Bitcoin awareness is maybe 1000x less than participation in FB. Few people already referred to FB cryptocurrency in our conversations - those were the ones who know about Bitcoin, but never considered it seriously. From the other hand, I am not sure a pure announcement could have such an impact. Any opinions? P.S. Greetings to xxxx123abcxxxx . I was not posting here, but I surely read this thread. Didn't post, just because the main point of our disagreement on the old thread seems to be resolved (hopefully), and here we see pure technical, quite interesting analysis, without questionable long-term predictions you were making in the old thread.The mainstream media certainly has implied causation of Bitcoin's surge to Facebook's Libra cryptocurrency. But if the marketplace truly is a discounting mechanism of future events, then the markets discount all possible scenarios, and move in the most probable direction; the Elliott Wave theory attempts to visually map the totality of all events. |
|
|
|
|
|
xxxx123abcxxxx (OP)
|
|
June 27, 2019, 06:27:26 AM |
|
Since the 06-FEB-2019 low, Bitcoin has surged to retrace a Fibonacci 61.8% of the entire 2018 bear market, thus far into the final week of JUN-2019. True to form, the 2019 bull market has unfolded in subdividing and extending parabolic curves. From an Elliott Wave standpoint, the 2019 bull market may be modelled as follows:  + Wave-1 (06-FEB 23-APR) : subdivided into smaller degree impulsive waves.
- Wave-2 (23-APR 25-APR) : a simple Zig Zag correction.
+ Wave-3 (25-APR 14-MAY) : a parabolic rise.
- Wave-4 (14-MAY 09-JUN) : a complex Running Flat correction.
+ Wave-5 (06-JUN 26-JUN?) : a parabolic rise.
The advancing Wave-3 and Wave-5 have subdivided and extended as parabolic curves, the nature of which have been challenging to study and predict. Mania-driven markets are just about impossible to forecast as the waves extend and subdivide fractally. A speculative look into the structure of Wave-5 which started from the 06-JUN low to 26-JUN(?) high is detailed as follows, using COINBASE:  Any additional advance may be resisted by the following Fibonacci retracement zones, using BITSTAMP: @13340: Fibonacci 61.8% retracement of the entire 2018 bear market.
@16125: Fibonacci 78.6% retracement of the entire 2018 bear market.
@17780: Fibonacci 88.6% retracement of the entire 2018 bear market.
The reduced price action of a non-continuous contract may offer clarity with parabolic waves. Using the Grayscale Bitcoin Trust (GBTC) fund as a proxy, it appears a couple of additional waves may still be outstanding to complete the waveset:  The 2019+ bull market is expected to unfold in five INTERMEDIATE degree legs: three advancing, interwoven with two declining. This waveset of five INTERMEDIATE degree legs is expected to complete an overall PRIMARY degree wave. Should the aforementioned Fibonacci resistance zones fail to conclude the first leg of the bull market, and if price action marches to new all-time highs; then the advance may be considered as the entirety of the bull market inclusive of all legs:  Given the unanticipated surge in regards to both price and time; an advance to new all-time highs, without a notable pullback first, may suggest the advance is the fifth and final PRIMARY wave in its entirety. A common wave relationship guides the price of the fifth wave to be equal to, or extend a Fibonacci 1.618 times, the length from the low of the first wave through to the high of third wave, projected from the low of the fourth wave. This provides a conservative target of the current bull market to conclude between $22912 and $35127, calculated using the BraveNewCoin (BLX) index
@22912: PRIMARY[5] = (PRIMARY[1] + PRIMARY[3]) * 1
@35127: PRIMARY[5] = (PRIMARY[1] + PRIMARY[3]) * 1.618
A more orderly paced scenario would consider the 2019 advance as the first leg of the bull market nearing completion. Which when complete, leads to the first notable pullback, followed by a resumption of the uptrend:  Adjusted and renewed targets can be expected in the event of subdividing and extending waves. Should the first leg of the bull market be nearing completion, the following expected pullback zones can be defined via Fibonacci retracement levels, using BITSTAMP prices: @8500: 50.0% Fibonacci retracement (min expected zone)
@7200: 61.8% Fibonacci retracement (avg expected zone)
@5435: 78.6% Fibonacci retracement (max expected zone)
@4360: 88.6% Fibonacci retracement
 The uptrend from the 06-FEB low to 26-JUN high thus far is 140 days. If downtrend elapses in half the time, say 70 days, it may be over by early SEP. A decline to the 88.6% Fibonacci zone may provide the first signal to suggest a faltering bull market. A decline to the 06-FEB-2019 low would terminate the bull market. Such a scenario would propose a cyclical (i.e. short-term) bull market, in an overall ongoing secular (i.e. long-term) bear market. The 2018 low would be labelled as wave-W, the current 2019 bull market as wave-X, followed by the resumption of the secular bear market labelled as wave-Y to break below the 2018 low. Complex composite wave structures are often behaviours of commodity and currency markets:  28-JUN-2019: Bitcoin CME Futures Expiry
28-JUN-2019: G20 Summit
Speculation is indicative of price/structure, not time. |
|
|
|
|
sedactoo+04
Full Member
Offline
Activity: 161
Merit: 175
Hello World!
|
|
June 28, 2019, 06:12:29 PM |
|
Your complex scenario seems to be perfectly playing both price and time. I am not convinced for the bull yet.
I would love to see your thoughts and updates about it.
Thanks for your great work.
It's okay not to be convinced, but make sure to stay open to alternative theories. The biggest pitfall of EW analysis is getting married to a specific count, then continually reworking the count as it gets repeatedly invalidated. I struggled with this a lot years ago. Sometimes being "not convinced for the bull" really means "I can't see past my bear bias." This is why it's good to always have at least two different counts you are tracking. Which count is ultimately correct may only be obvious in hindsight, hence the danger of becoming too attached to the wrong one. My thoughts are definitely more in line with xxxx123abcxxxx's bull count. Of course, we won't be able to discard the complex bear correction scenario for quite some time yet. thank you so much for the merit, I really do appreciate it! |
|
|
|
|
Blockchain0106
Newbie
Offline
Activity: 5
Merit: 0
|
|
July 02, 2019, 11:37:30 AM |
|
Since the 06-FEB-2019 low, Bitcoin has surged to retrace a Fibonacci 61.8% of the entire 2018 bear market, thus far into the final week of JUN-2019. True to form, the 2019 bull market has unfolded in subdividing and extending parabolic curves. From an Elliott Wave standpoint, the 2019 bull market may be modelled as follows: https://i.imgur.com/Tf6Y348.jpg+ Wave-1 (06-FEB — 23-APR) : subdivided into smaller degree impulsive waves.
- Wave-2 (23-APR — 25-APR) : a simple Zig Zag correction.
+ Wave-3 (25-APR — 14-MAY) : a parabolic rise.
- Wave-4 (14-MAY — 09-JUN) : a complex Running Flat correction.
+ Wave-5 (06-JUN — 26-JUN?) : a parabolic rise.
The advancing Wave-3 and Wave-5 have subdivided and extended as parabolic curves, the nature of which have been challenging to study and predict. Mania-driven markets are just about impossible to forecast as the waves extend and subdivide fractally. A speculative look into the structure of Wave-5 which started from the 06-JUN low to 26-JUN(?) high is detailed as follows, using COINBASE: https://i.imgur.com/zKGFgGR.pngAny additional advance may be resisted by the following Fibonacci retracement zones, using BITSTAMP: @13340: Fibonacci 61.8% retracement of the entire 2018 bear market.
@16125: Fibonacci 78.6% retracement of the entire 2018 bear market.
@17780: Fibonacci 88.6% retracement of the entire 2018 bear market.
The reduced price action of a non-continuous contract may offer clarity with parabolic waves. Using the Grayscale Bitcoin Trust (GBTC) fund as a proxy, it appears a couple of additional waves may still be outstanding to complete the waveset: https://i.imgur.com/I4CZRgI.jpgThe 2019+ bull market is expected to unfold in five INTERMEDIATE degree legs: three advancing, interwoven with two declining. This waveset of five INTERMEDIATE degree legs is expected to complete an overall PRIMARY degree wave. Should the aforementioned Fibonacci resistance zones fail to conclude the first leg of the bull market, and if price action marches to new all-time highs; then the advance may be considered as the entirety of the bull market inclusive of all legs: https://i.imgur.com/0s0uRRd.jpgGiven the unanticipated surge in regards to both price and time; an advance to new all-time highs, without a notable pullback first, may suggest the advance is the fifth and final PRIMARY wave in its entirety. A common wave relationship guides the price of the fifth wave to be equal to, or extend a Fibonacci 1.618 times, the length from the low of the first wave through to the high of third wave, projected from the low of the fourth wave. This provides a conservative target of the current bull market to conclude between $22912 and $35127, calculated using the BraveNewCoin (BLX) index… @22912: PRIMARY[5] = (PRIMARY[1] + PRIMARY[3]) * 1
@35127: PRIMARY[5] = (PRIMARY[1] + PRIMARY[3]) * 1.618
A more orderly paced scenario would consider the 2019 advance as the first leg of the bull market nearing completion. Which when complete, leads to the first notable pullback, followed by a resumption of the uptrend: https://i.imgur.com/XRjl4M2.jpgAdjusted and renewed targets can be expected in the event of subdividing and extending waves. Should the first leg of the bull market be nearing completion, the following expected pullback zones can be defined via Fibonacci retracement levels, using BITSTAMP prices: @8500: 50.0% Fibonacci retracement (min expected zone)
@7200: 61.8% Fibonacci retracement (avg expected zone)
@5435: 78.6% Fibonacci retracement (max expected zone)
@4360: 88.6% Fibonacci retracement
https://i.imgur.com/mkfgF8O.jpgThe uptrend from the 06-FEB low to 26-JUN high thus far is 140 days. If downtrend elapses in half the time, say 70 days, it may be over by early SEP. A decline to the 88.6% Fibonacci zone may provide the first signal to suggest a faltering bull market. A decline to the 06-FEB-2019 low would terminate the bull market. Such a scenario would propose a cyclical (i.e. short-term) bull market, in an overall ongoing secular (i.e. long-term) bear market. The 2018 low would be labelled as wave-W, the current 2019 bull market as wave-X, followed by the resumption of the secular bear market labelled as wave-Y to break below the 2018 low. Complex composite wave structures are often behaviours of commodity and currency markets: https://i.imgur.com/0AIPD3g.jpg28-JUN-2019: Bitcoin CME Futures Expiry
28-JUN-2019: G20 Summit
Speculation is indicative of price/structure, not time. Please Help Me to under stand Elite Wave in BITCOIN..?  initial expectation for the second leg bear market is towards $4,257 (BITFINEX) which marks a Fibonacci 78.6% retracement of the entire Bitcoin market which begins the ‘despair’ state of affairs; where reality of the bubble bursting only just is grasped as the 'blow-off' phase gains momentum. Based on historical manias, when a speculative asset bubble bursts, an approx 90%-95% collapse unravels in a period of 2 years: —thebubblebubble.com/historic-crashes —en.wikipedia.org/wiki/List_of_stock_market_crashes_and_bear_markets Chronicles of historical manias suggest the cryptocurrency bear market is likely to conclude by late 2019 or early 2020, with Bitcoin priced between $500 to $1,000. It is musing to project whether or not Bitcoin survives the crash. Commodities and currencies, and assets deemed as a store of value, unfold in A-B-C Elliott Waves in both bull and bear markets. Whereas assets such as stocks based on earnings unfold in 1-2-3-4-5 impulsive Elliott Waves in bull markets, and corrective A-B-C Elliott Waves in bear markets. The wave characteristics of Bitcoin and the popular cryptocurrencies have unfolded in 1-2-3-4-5 impulsive Elliott Waves in bull markets, and corrective A-B-C Elliott Waves in bear markets. Given the nature of wave characteristics, this suggests the behaviour cryptocurrencies cannot be considered as a currency nor a commodity; and so therefore in their current state, shall never be adopted as robust mediums of exchange for goods and services or as a storage medium of value. Quite possibly, a second generation of viable cryptocurrencies may emerge in post 2020. Either way, the days of speculative parabolic price curves in the cryptocurrency markets is over, and any hopes of a return to the all-time highs is foolish hodlr's fodder. Elliott Wave speculative models indicative of price and structure, not time; as follows: " as per your previous Elite Wave theory you show me how bear market will continuance for 2 year cycle and you also mention " Any of the aforementioned approx price levels based on Fibonacci projections are potential targets of where the 2018 bear market may conclude. Should price retrace below the Fibonacci 78.6% of the entire Bitcoin market, i.e. below the psychological $4,000 level; it may suggest the bear market extends into 2019 with an expectation of a 90%-95% decline of the entire Bitcoin market to approx $1,000 by 2020. Such a scenario would be consistent with the collapse of other historical asset mania bubble bursts, which typically elapse 2 years on average: thebubblebubble.com/historic-crashes "and also you give a point where this wave can go further" Bear Market Inflection Points —A break below the 11-OCT-2018 low of $6,055 would be the first indication to suggest the bear market is still underway. —A break below the 14-AUG-2018 low of $5,880 would confirm the ongoing bear market. —A break below $4,000 may suggest an extended bear market leading to a 90%-95% collapse of the entire Bitcoin market by 2020. Bull Market Inflection Points —A break above the 15-OCT-2018 high of $6,756 would be the first indication to suggest a bull market may be commencing. —A break above the 04-SEP-2018 high of $7,412 would likely confirm a bull market is underway. as off no i really look like struggle for how to understand market behavior..? and i can't able to understand elite wave theory currently. i am not able to apply formula on bitcoin chart, are we in ABC corrections Or WXY Wave ..? Please Help Me to under stand Elite Wave in BITCOIN |
|
|
|
|
|
xxxx123abcxxxx (OP)
|
|
July 02, 2019, 11:45:11 PM
Last edit: July 03, 2019, 12:47:05 AM by xxxx123abcxxxx Merited by prophetx (40), LeGaulois (1) |
|
The last post of the 2018 Cryptocurrency Crash (Elliott Wave) thread mentioned the following: At this stage, the market would have to exceed $5890 BITFINEX to confirm a new bull market.
Exceeding $5178 BITFINEX would provide an early signal to consider a potential change of trend.
Since 05-APR-2019, the following two Elliott Wave scenarios are currently under consideration; either: 1. The current 2019 bull market is a wave-5 of Primary degree heading towards new all-time highs; or, 2. The current 2019 bull market is a wave-X of Primary degree as part of an all overall bearish W-X-Y structure. The aforementioned scenarios have thus far been tracked in the following posts: 05-APR-2019 Cryptocurrency (Elliott Wave): Bull Market
? https://bitcointalk.org/index.php?topic=5128394.msg50467456#msg50467456 20-APR-2019 Cryptocurrency (Elliott Wave): Easter Update https://bitcointalk.org/index.php?topic=5128394.msg50681435#msg50681435 12-MAY-2019 Cryptocurrency (Elliott Wave): Sell In May And Go Away? https://bitcointalk.org/index.php?topic=5128394.msg51017295#msg51017295 17-JUN-2019 Cryptocurrency (Elliott Wave): Solstice Update https://bitcointalk.org/index.php?topic=5128394.msg51505513#msg51505513The following book is a recommendation to understand Elliott Wave theory: Elliott Wave Principle: Key To Market Behavior by A.J. Frost, Robert R. Prechter (ISBN: 9780471988496) https://ufile.io/a2zr6ofv (78MB) [expires 01-AUG-2019] The following guesswork summarizes the preferred Elliott Wave model of this thread thus far (indicative of price/structure, not time):  Hope the above answers your questions. |
|
|
|
|
|
fabiorem
|
|
July 27, 2019, 03:03:00 PM
Last edit: July 27, 2019, 03:14:02 PM by fabiorem |
|
The month is ending, and we didnt see 5k nor 7k. Will we have a new Elliott Wave analysis?
|
|
|
|
|
drays
Legendary
Offline
Activity: 2520
Merit: 1073
|
|
July 27, 2019, 06:11:33 PM |
|
The month is ending, and we didnt see 5k nor 7k. Will we have a new Elliott Wave analysis?
Not sure where you got those numbers. As far as I can see, the last analysis (on this very page) tells nothing about 5k or 7k this month. I assume it is still actual, though it might benefit from a little update. |
... this space is not for rent ... |
|
|
exstasie
Legendary
Offline
Activity: 1806
Merit: 1521
|
|
July 27, 2019, 06:15:16 PM |
|
The month is ending, and we didnt see 5k nor 7k. Will we have a new Elliott Wave analysis?
Was he was ever aiming as low as $5K? I didn't think so. Anyway, his projection indicates price/structure, not time. I don't think he has any reason to change the count yet, as nothing has been invalidated. From EW perspective, we could still be on track for $7K (although I think that's too far to expect myself). |
|
|
|
|
xxxx123abcxxxx (OP)
|
|
July 28, 2019, 01:41:44 AM |
|
2019 Cryptocurrency (Elliott Wave): Inflection Pointhttps://www.reddit.com/r/BitcoinMarkets/comments/cipwdi/2019_cryptocurrency_elliott_wave_inflection_point/From the 2018 bear market low set on 15-DEC-2018, the Bitcoin bull market has gained 340% into the high of 26-JUN-2019. Since then, the largest pullback of the 2019 bull market has been underway, thus far a 35% decline heading into AUG-2019. From an Elliott Wave perspective, two scenarios can now be considered at this inflection point: a continuing Bull Scenario (Preferred) or a Bear Scenario (Alternative). In either scenario, the following Elliott Wave model proposes a five wave structure, consisting of: three advancing bull market waves, interwoven with two declining bear market waves. Overlaying this model onto Bitcoin suggests: Wave 1: the first bull market wave 2010-2013 (1219 days), followed by;
Wave 2: the first bear market wave 2013-2015 (426 days), followed by;
Wave 3: the second bull market wave 2015-2018 (1065 days), followed by;
Wave 4: the second bear market wave 2018-2019 (363 days), followed by;
Wave 5: the third and final bull market wave 2019-?
The five aforementioned have been considered as PRIMARY degree waves such waves elapse the course of a few months to a couple of years. Each PRIMARY degree wave is constituted of five INTERMEDIATE degree waves; and in turn, so forth into smaller degree fractals.  The continuing bull market scenario suggests the first INTERMEDIATE leg of PRIMARY[5] has completed, and four more INTERMEDIATE degree waves are yet to unfold; either meeting or exceeding the all-time highs of PRIMARY[3] wave. The alternative bear market scenario suggests PRIMARY[5] has completed in entirety, and failed to meet or exceed the all-time highs of PRIMARY[3] wave. In Elliott Wave parlance, this is known as a failed-fifth or a truncated wave.
Bull Scenario (Preferred) The preferred scenario suggests a continuing bull market is underway. PRIMARY[5] wave started from the 06-FEB-2019 low, and has completed its first leg labelled as INTERMEDIATE(1) wave at the 26-JUN-2019 high. INTERMEDIATE(2) wave pullback is currently underway and expected to complete at the following Fibonacci retracement levels, using BITSTAMP prices: @8500: 50.0% Fibonacci retracement from 15-DEC-2018 to 26-JUN-2019 (min expected zone)
@7230: 61.8% Fibonacci retracement from 15-DEC-2018 to 26-JUN-2019 (avg expected zone)
@5425: 78.6% Fibonacci retracement from 15-DEC-2018 to 26-JUN-2019 (max expected zone)
@4350: 88.6% Fibonacci retracement from 15-DEC-2018 to 26-JUN-2019 (WARNING)
Once INTERMEDIATE(2) pullback completes, INTERMEDIATE(3) wave is expected to resume the PRIMARY[5] bull market to meet and exceed the all-time highs of PRIMARY[3] wave. Where the PRIMARY[5] bull market ends is open to interpretation and speculation. There are calls of $50,000 to $500,000 to $1,000,000 and even beyond
! From an Elliott Wave perspective: A common wave relationship guides the price of the fifth wave to be equal to; or extend a Fibonacci 1.618 times; the length from the low of the first wave through to the high of third wave; projected from the low of the fourth wave. This provides a conservative target of the current bull market to conclude between $22,912 and $35,127, calculated using the BraveNewCoin (BLX) index: @22912: PRIMARY[5] = (PRIMARY[1] + PRIMARY[3]) * 1
@35127: PRIMARY[5] = (PRIMARY[1] + PRIMARY[3]) * 1.618
 As and when the waves develop and progress, or in the event of subdividing and extending waves, revised price targets shall be calculated with renewed projections. If the current INTERMEDIATE(2) pullback retraces a Fibonacci 78.6% of the entire 15-DEC-2018 to 26-JUN-2019 uptrend, then the bull market has a 50/50 odds of resuming. A retracement to the Fibonacci 88.6% level is the first warning signal to suggest the bull market may be over. A decline to the 06-FEB-2019 low confirms the bull market is over.
Bear Scenario (Alternative) The alternative bear market scenario suggests the 2019 bull market was a short-lived affair, and PRIMARY[5] terminated as a failed-fifth truncated wave. In this scenario, a CYCLE[II] wave pullback is now underway and headed to break below the 2018 low. The following technical analysis motivations, in order of significance, support the bear market scenario: 1. The cryptocurrency market breadth represented by the Altcoins have failed to materially participate in the 2019 bull market. The majority of Altcoins are currently approaching their respective 2018 lows. 2. The last two monthly candles of Bitcoin, i.e. JUN-2019 and JUL-2019, are equivalent in formation to DEC-2017 and JAN-2018. Both sets of candlesticks formed a bearish Shooting-Star and Tweezer-Top pattern. A Shooting-Star candlestick in an uptrend exhibits a long upper wick signalling a reversal. Two consecutive Shooting-Star candlesticks form a Tweezer-Top pattern: where the close price of the first candlestick is equal to the opening price of the second. A monthly close above $10,760 is required to obviate the bearish scenario:  3. Perhaps superficial but worth consideration, is the current daily price action fractal which bears similarity to the 2017 top: 
Inflection Point SummaryA decline to $5425 (BITSTAMP) puts the bull market at 50/50 odds of survival. A decline to $4350 (BITSTAMP) provides a warning signal to suggest the bull market may be over. A decline to the 06-FEB-2019 low confirms the bull is over. A monthly close above $10760 (BITSTAMP) provides a signal to suggest the bull market is resuming. 29-JUL-2019: Bitcoin CME Futures Settlement
30-JUL-2019: BoJ Monetary Policy Statement
31-JUL-2019: FOMC Interest Rate Decision
01-AUG-2019: BoE Interest Rate Decision
02-AUG-2019: Nonfarm Payrolls
Speculation is indicative of price/structure, not time.
|
|
|
|
|
exstasie
Legendary
Offline
Activity: 1806
Merit: 1521
|
Bull Scenario (Preferred) Thank you for the update, xxxx123abcxxxx! Your bull scenario is very much in line with my analysis. I think we have one more leg down to go in the short term before bulls get a reprieve and we get a sizeable bounce. The $12K area looks right if we stab below $9K first. I'm keeping my eyes peeled for a complex/sideways WXY to develop rather than a typical flat; Bitcoin often likes to shoot it's wad on the initial crash from the top then meander sideways before continuing up. Bear Scenario (Alternative) I'd be amazed if that was a primary fifth wave already, but I can't say it's impossible! Thanks again for sharing. |
|
|
|
oarmas
Newbie
Offline
Activity: 12
Merit: 9
|
|
July 28, 2019, 04:37:17 PM |
|
123abc....: Tremendous article, thanks for your insight, it really is appreciated. I have two questions one simple, the other a thought.
1) Is there a website you use to view the bitcoin scenario that offers monthly candles. I'm using bitocoinwisdom.io and it only goes to weekly. Your article comment on the shooting star I can't verify right now.
2) When looking at your candle scenarios do they fall ABOVE the Bollinger 21 tick band (21 being a fibonacci number). That is they open and close above the BB maximum. Such a formation is extremely bearish (I only have failed on this once in over hundred tries in stock trades, never in GBTC), I'm referring to your relevant quote on the bearish scenario: " Shooting-Star and Tweezer-Top pattern. A Shooting-Star candlestick in an uptrend exhibits a long upper wick signalling a reversal. Two consecutive Shooting-Star candlesticks form a Tweezer-Top pattern"
Bottom line, a bollinger band represents a statistical certainty with some defects. Although minor, the defects of the BB are that it's borders represent about an 88% confidence certainty instead of the 95% + represented by a 2 standard deviation variance. It is however, very certain that an open and close candle above (OR BELOW) the BB represent, at least, an 88% chance of a reversal. Which is why I follow this pattern looking for an investment chance (on a daily, not weekly or monthly basis).
Right now, the shooting star represented by the weekly (bitcoin wisdom chart) of 6/23 is all I have to go by and it opened and closed inside the BB, so it's probably ONLY a partial reversal indicator, that is, it will reverse when it closes, on a weekly at around the midpoint of the BB, a statistically stable reversal point, of about 7.5K. The DAILY suggests we will see a reversal around 8.7K, so I'm looking to invest somewhere in between these two.
regards
oarmas
|
|
|
|
|
Gustavo_Brucestavo
Newbie
Offline
Activity: 2
Merit: 0
|
|
July 28, 2019, 05:49:17 PM |
|
Amazing work as always 123abc. Thank you for the time and effort, and thanks for sharing.
|
|
|
|
|
|
xxxx123abcxxxx (OP)
|
|
July 28, 2019, 08:44:54 PM
Last edit: July 28, 2019, 09:13:44 PM by xxxx123abcxxxx |
|
123abc....: Tremendous article, thanks for your insight, it really is appreciated. I have two questions one simple, the other a thought.
1) Is there a website you use to view the bitcoin scenario that offers monthly candles. I'm using bitocoinwisdom.io and it only goes to weekly. Your article comment on the shooting star I can't verify right now.
2) When looking at your candle scenarios do they fall ABOVE the Bollinger 21 tick band (21 being a fibonacci number). That is they open and close above the BB maximum. Such a formation is extremely bearish (I only have failed on this once in over hundred tries in stock trades, never in GBTC), I'm referring to your relevant quote on the bearish scenario: " Shooting-Star and Tweezer-Top pattern. A Shooting-Star candlestick in an uptrend exhibits a long upper wick signalling a reversal. Two consecutive Shooting-Star candlesticks form a Tweezer-Top pattern"
Bottom line, a bollinger band represents a statistical certainty with some defects. Although minor, the defects of the BB are that it's borders represent about an 88% confidence certainty instead of the 95% + represented by a 2 standard deviation variance. It is however, very certain that an open and close candle above (OR BELOW) the BB represent, at least, an 88% chance of a reversal. Which is why I follow this pattern looking for an investment chance (on a daily, not weekly or monthly basis).
Right now, the shooting star represented by the weekly (bitcoin wisdom chart) of 6/23 is all I have to go by and it opened and closed inside the BB, so it's probably ONLY a partial reversal indicator, that is, it will reverse when it closes, on a weekly at around the midpoint of the BB, a statistically stable reversal point, of about 7.5K. The DAILY suggests we will see a reversal around 8.7K, so I'm looking to invest somewhere in between these two.
regards
oarmas
Thank you for sharing your technical insights. 1. The following book is a recommendation to understand Japanese Candlestick patterns: Japanese Candlestick Charting Techniques by Steve Nison (ISBN: 0735201811) https://ufile.io/e453rziz (6.5MB) [expires 31-AUG-2019] 2. No personal experience with Bollinger Bands, so can't comment or answer your query. Here is a Bollinger Band applied to a monthly chart of Bitcoin with a band of 21 and standard deviation of 2: https://i.imgur.com/zJZhxB3.jpg |
|
|
|
|
sedactoo+04
Full Member
Offline
Activity: 161
Merit: 175
Hello World!
|
|
July 29, 2019, 09:56:22 AM |
|
Great analysis as usual. Really appreciate your hard work... Considering the analysis done on social media and tradingview, i can see that most of the analysists are expecting the 7-8k levels to be the optimal retracement and to go to the moon just afterwards. Considering that bitcoin never does what is expected, I think the most likely and the bullish scenario is A decline to $4350 (BITSTAMP) provides a warning signal to suggest the bull market may be over. which will create huge panic in the market, all the analysists going back to bear views and expecting sub 1k s. If we succeed to turn back from 4350 I think the bull will be really healthy, and the weak hands will be shaken. Thanks a million for your analysis again... |
|
|
|
|
|
|
exstasie
Legendary
Offline
Activity: 1806
Merit: 1521
|
|
August 05, 2019, 09:11:15 PM |
|
You're reading my mind right now. The bounces off the lower $9,000s look like a pretty typical flat B wave. But I'm also getting nervous that my bearish bias is clouding my vision. I've been pretty adamant that from a time/proportion perspective, the correction is unlikely to be over yet, not for another month or more. Is it possible we're wrong about that? Do you think a running correction like Jan-Mar 2017 is a possibility? |
|
|
|
|
xxxx123abcxxxx (OP)
|
|
August 05, 2019, 11:09:01 PM |
|
You're reading my mind right now. The bounces off the lower $9,000s look like a pretty typical flat B wave.
But I'm also getting nervous that my bearish bias is clouding my vision. I've been pretty adamant that from a time/proportion perspective, the correction is unlikely to be over yet, not for another month or more. Is it possible we're wrong about that?
Do you think a running correction like Jan-Mar 2017 is a possibility?
Yes, the bearish bias may be wrong. However, the Fear & Greed index suggests sentiment is complacent, and alludes to a pending correction. The current b-wave bounce has the following resistance zones to overcome the bearish bias... Standard b-wave Resistance Zones (COINBASE)
12036, 12842, 13868
Irregular b-wave Resistance Zones (COINBASE)
15000, 15701, 16267, 16833
  |
|
|
|
|
|
xxxx123abcxxxx (OP)
|
|
August 06, 2019, 11:24:39 PM |
|
20-day price & time symmetry...?
|
|
|
|
|
oarmas
Newbie
Offline
Activity: 12
Merit: 9
|
|
August 09, 2019, 01:26:11 PM |
|
The time factor involved in the simple bullish scenario following wave 5 implies a multi year correction. The bearish complex scenario implies the correction is almost over. Although more painful, the bearish scenario makes sense, technically since BTC will halve next May. I just don't think wave Y will go that low, in other words, the bottom may already be in and we're just passing time until the true bull market takes off sometime between November 2019 and May 2020.
|
|
|
|
|
|
xxxx123abcxxxx (OP)
|
|
August 10, 2019, 08:32:28 PM |
|
The time factor involved in the simple bullish scenario following wave 5 implies a multi year correction. The bearish complex scenario implies the correction is almost over. Although more painful, the bearish scenario makes sense, technically since BTC will halve next May. I just don't think wave Y will go that low, in other words, the bottom may already be in and we're just passing time until the true bull market takes off sometime between November 2019 and May 2020.
The "Bearish Complex WXY" scenario has been simply revised to the "Bear (Alternative)" scenario. In the "Bear (Alternative)" scenario, the 26-JUN-2019 high near $14,000 is considered as the entirety of a truncated failed-fifth PRIMARY wave; and now, price is headed to break below the 2018 low. In the "Bull (Preferred)" scenario, the 26-JUN-2019 high near $14,000 is considered as just the first leg of the fifth and final PRIMARY wave; and, four more waves are yet to unfold, driving price beyond the 2017 high. Full details here: https://www.reddit.com/r/BitcoinMarkets/comments/cipwdi/2019_cryptocurrency_elliott_wave_inflection_point/ |
|
|
|
|
|
fabiorem
|
|
August 11, 2019, 04:50:29 PM |
|
The time factor involved in the simple bullish scenario following wave 5 implies a multi year correction. The bearish complex scenario implies the correction is almost over. Although more painful, the bearish scenario makes sense, technically since BTC will halve next May. I just don't think wave Y will go that low, in other words, the bottom may already be in and we're just passing time until the true bull market takes off sometime between November 2019 and May 2020.
So we do have a short time to accumulate. The price being 12, 10 or 7k will not make much of a difference when it goes beyond 100k after the next halving. |
|
|
|
|
exstasie
Legendary
Offline
Activity: 1806
Merit: 1521
|
|
August 11, 2019, 05:21:57 PM |
|
So we do have a short time to accumulate. The price being 12, 10 or 7k will not make much of a difference when it goes beyond 100k after the next halving.
Except the OP isn't expecting $100K+ at all. In his most bullish projection, the ultimate top will be in the $30,000s.  Also, buying at $7K vs. $12K means a 70% difference in the amount of coins you can accumulate. So it definitely makes a difference to me! Anyone who can reliably beat dollar cost averaging over time should do so. And if you can't, that's what DCA is for. |
|
|
|
|
|
|
xxxx123abcxxxx (OP)
|
|
September 19, 2019, 03:28:19 AM |
|
BITSTAMP support zones... @8500: 50.0% Fibonacci retracement from 15-DEC-2018 to 26-JUN-2019 (min expected zone)
@7230: 61.8% Fibonacci retracement from 15-DEC-2018 to 26-JUN-2019 (avg expected zone)
@5425: 78.6% Fibonacci retracement from 15-DEC-2018 to 26-JUN-2019 (max expected zone)
@4350: 88.6% Fibonacci retracement from 15-DEC-2018 to 26-JUN-2019 (WARNING)
A decline to the Fibonacci 78.6% level suggests the bull market has a 50/50 odds of resuming. A decline to the Fibonacci 88.6% level is the first warning signal to suggest the bull market may be over. A decline to the 06-FEB-2019 low confirms the bull market is over.  Speculative analysis indicative of price/structure, not time.
|
|
|
|
|
exstasie
Legendary
Offline
Activity: 1806
Merit: 1521
|
|
September 26, 2019, 04:38:56 PM |
|
Excellent prediction once again. Do you have a lower degree count you're charting, or are you waiting for the daily time frame to become clear? On the 4-hour, it looks like we've nearly completed iii of (c). Not sure though! |
|
|
|
|
xxxx123abcxxxx (OP)
|
|
September 27, 2019, 10:52:49 PM |
|
Excellent prediction once again. Do you have a lower degree count you're charting, or are you waiting for the daily time frame to become clear? On the 4-hour, it looks like we've nearly completed iii of (c). Not sure though!
The best case scenario for the bulls would be a bounce from here into the weekend, and then a final drop to around $7000. However, the technicals at this stage cannot yet rule out an extended decline to $5400. Optimistic guesswork as follows...  |
|
|
|
|
exstasie
Legendary
Offline
Activity: 1806
Merit: 1521
|
|
September 27, 2019, 11:10:04 PM |
|
Excellent prediction once again. Do you have a lower degree count you're charting, or are you waiting for the daily time frame to become clear? On the 4-hour, it looks like we've nearly completed iii of (c). Not sure though!
The best case scenario for the bulls would be a bounce from here into the weekend, and then a final drop to around $7000. However, the technicals at this stage cannot yet rule out an extended decline to $5400. Optimistic guesswork as follows... Thanks, that's very similar to my count. Still seems very plausible. Did you have an alternative count indicating a drop to $5,400 or is that just based on an extension to the 0.786? On that note, have you ever looked at the 0.705 level? Obviously not used in EW but ICT and some others use it extensively. I've found that it's a level often respected by the market if the 0.618 isn't. |
|
|
|
|
xxxx123abcxxxx (OP)
|
|
September 28, 2019, 01:01:15 AM |
|
Thanks, that's very similar to my count. Still seems very plausible. Did you have an alternative count indicating a drop to $5,400 or is that just based on an extension to the 0.786?
No alternative count in the event of a decline to $5400 likely to be defined as an ongoing subdividing and extended wave to the next support area of 0.786. On that note, have you ever looked at the 0.705 level? Obviously not used in EW but ICT and some others use it extensively. I've found that it's a level often respected by the market if the 0.618 isn't. No, not used the 0.705 level so can't comment but thank you for sharing and shall take a look! |
|
|
|
|
|
xxxx123abcxxxx (OP)
|
|
October 07, 2019, 06:35:08 PM |
|
A move beyond $9000 may obviate the following extended decline scenarios to $5400...   |
|
|
|
|
exstasie
Legendary
Offline
Activity: 1806
Merit: 1521
|
|
October 07, 2019, 06:44:16 PM
Last edit: October 08, 2019, 08:09:13 AM by exstasie |
|
Thanks for the update. The market doesn't look bottomed out yet to me either but I still have doubts about reaching the 0.786. I have a nagging suspicion bulls will heavily buy the $6,000s on another stab down. Still looking at the 0.705 fib level and the apex of last year's triangle as potential stopping points. |
|
|
|
cabe72000
Newbie
Offline
Activity: 8
Merit: 0
|
|
October 16, 2019, 03:17:19 PM |
|
Im so happy to find the 2019 of this post! I become interested in TA thanks to the original 2018 post, and been reading (those books you recommend me back then) and learning on the subject since then. THANKS 123 for getting in this again, and for sharing your knowledge. Now speaking on the subject, yesterday I was thinking in a 8100 support, but today we broke the 8000 barrier (looking at the 3 hours candle at bitfinex) If I see the week candles, there are 4 touches at the support 7600 zone (correct me If I am wrong) 2 in June and 2 in september, which indicates a weak support resistance, which matches on the bear market and new lows (according to your projections down to 5400) ¿Is my analysis on track? https://ibb.co/F0BZnG0Happy to read your opinion. Regards |
|
|
|
|
|
xxxx123abcxxxx (OP)
|
|
October 16, 2019, 08:03:05 PM |
|
Im so happy to find the 2019 of this post! I become interested in TA thanks to the original 2018 post, and been reading (those books you recommend me back then) and learning on the subject since then. THANKS 123 for getting in this again, and for sharing your knowledge. Now speaking on the subject, yesterday I was thinking in a 8100 support, but today we broke the 8000 barrier (looking at the 3 hours candle at bitfinex) If I see the week candles, there are 4 touches at the support 7600 zone (correct me If I am wrong) 2 in June and 2 in september, which indicates a weak support resistance, which matches on the bear market and new lows (according to your projections down to 5400) ¿Is my analysis on track?  Happy to read your opinion. Regards Thank you for sharing your analysis. The average of the lows from JUN-2019 and SEP-2019 is around 7600, as you've correctly suggested. GBTC has already broken the equivalent 7600 zone; and hence, BTC is on track to decline further. Upcoming BITSTAMP support zones... @7230: 61.8% Fibonacci retracement from 15-DEC-2018 to 26-JUN-2019 (avg expected zone)
@5425: 78.6% Fibonacci retracement from 15-DEC-2018 to 26-JUN-2019 (max expected zone)
@4350: 88.6% Fibonacci retracement from 15-DEC-2018 to 26-JUN-2019 (WARNING: Bull Market Terminated?)
|
|
|
|
|
exstasie
Legendary
Offline
Activity: 1806
Merit: 1521
|
|
October 16, 2019, 10:34:01 PM |
|
GBTC has already broken the equivalent 7600 zone; and hence, BTC is on track to decline further. Interesting, I hadn't been tracking GBTC at all. This means the GBTC premium is declining. I wonder if that could suggest institutional fatigue or if it's just because other (cheaper?) institutional products (from Bakkt, VanEck) are hitting the market. Upcoming BITSTAMP support zones... @7230: 61.8% Fibonacci retracement from 15-DEC-2018 to 26-JUN-2019 (avg expected zone)
@5425: 78.6% Fibonacci retracement from 15-DEC-2018 to 26-JUN-2019 (max expected zone)
@4350: 88.6% Fibonacci retracement from 15-DEC-2018 to 26-JUN-2019 (WARNING: Bull Market Terminated?)
Is your preference for $5,400 at this point? The 0.618 seems fairly shallow from here given how drawn out this decline is. |
|
|
|
|
xxxx123abcxxxx (OP)
|
|
October 17, 2019, 03:46:53 AM |
|
GBTC has already broken the equivalent 7600 zone; and hence, BTC is on track to decline further. Interesting, I hadn't been tracking GBTC at all. This means the GBTC premium is declining. I wonder if that could suggest institutional fatigue or if it's just because other (cheaper?) institutional products (from Bakkt, VanEck) are hitting the market. Upcoming BITSTAMP support zones... @7230: 61.8% Fibonacci retracement from 15-DEC-2018 to 26-JUN-2019 (avg expected zone)
@5425: 78.6% Fibonacci retracement from 15-DEC-2018 to 26-JUN-2019 (max expected zone)
@4350: 88.6% Fibonacci retracement from 15-DEC-2018 to 26-JUN-2019 (WARNING: Bull Market Terminated?)
Is your preference for $5,400 at this point? The 0.618 seems fairly shallow from here given how drawn out this decline is. No preference at the moment, either possibility of a decline to 61.8% or 78.6% are equally viable at this point; however, GTBC is already at the 61.8% retracement level. It may be the case GBTC declines to the 61.8% and 78.6% retracement levels first, and awaits there over a weekend, whilst BTC synchronises...? |
|
|
|
|
MarquiseMuseum
Member
Offline
Activity: 739
Merit: 29
www.MarquiseMuseum.com
|
|
October 21, 2019, 12:44:37 AM
Last edit: October 21, 2019, 01:35:52 AM by MarquiseMuseum |
|
Be careful here to all new investors.
Especially if you are engulfed in x100 longs.
This market is rigged, please search elsewhere for profit in this space, it is out there but not in top 5 right now or probably ever.
Top 5 is zombie graveyard but status quo has not ruptured yet, only when there is a flip will it be evident, and by then it is too late to recover permanent losses.
Flip event will transfer hundred of billions to solid projects in top 100, and trillions of migrated merchant business with branded cryptos using index platforms that can handle the txs requirements while remaining decentralized.
Most responsible thing for crypto elite to do at this stage is shelf OG BTC but everyone is neck deep from early gains.
Research the state of this soon to be fractured market, do not invest more than you can comfortably afford to lose.
There is no guarantee of reversal from descent into $5000, it could very well go down to low thousands and stagnate there during and after flip. Understand that market cap of top 5 is $200 billion dollars or 90% of total, everything of this will soon be redistributed to next gen projects that contribute to a better world.
A future BTC and top 5 dominance of single digit is possible. The future will be paid for by top 5 and merchant onramping, no one is stupid to enter top 5 with all this information available at this stage of maturity.
Finally let us bury these false ideas once and for all:
1. BTC is not scarce, there are tens of thousands of alts with better tech that can perform exactly like BTC or better, and most of these already went to -99.99% due to lack of support. Saying BTC is scarce is like saying the first copy of windows 95, kazaa 1.0, napster, DC++ or netscape or 56k modem installation cds are scarce and ultra valuable.
2. BTC does not and will not ever compete with decentralized tech that is scalable
3. Real decentralization is only possible through a myriad of merchant and personal cryptos, not monoliths.
4. Super powers control BTC since late 2017, they control CMC, all top exchanges, all leverage and lending firms. An investment in BTC or top 5 is a solid support of perpetual status quo stagnation which humanity already saw 10 years of, a wasted decade technologically.
5. BTC operates on greed, delusion, degenerate gambling, despotism. You get what you pay for, now go x100 long and sellout the future.
6. BTC was established on criminal syndication like the silk road, the only thing that happened is that even bigger criminals now control this market. 2017 ICOs were 99% scams, it is riddled with criminals and most recently white collars and corrupt international agencies.
7. Mining is 100% centrally controlled and a disaster of resource optimization allocation. This is why I bought eth in early 2016, a crypto that would make good use of energy allocation, unfortunately, did not scale.
8. Stop watching youtube pushers of top 5. Whether bearish or bullish, I am here to explain that the concept in itself is fast becoming irrelevant as new projects begin maturing. This is projects that you have never even heard of and will not discover until they are already x100, it is the reality of life as a mainstream investor, always late to wealth. I have been living, sleeping, eating crypto for 10 hours most days for 3 consecutive years with a period of interruption 6 months in 2017 while you were doing normal things like family, work, holiday, weddings, dinners, parties, etc. I am by no means the smartest guy on this board but simply brute forced a level of knowledge that will take other average joes the same amount of time investment to gain (many years).
9. Finally a contrarian view: yes BTC may go to $300 000 but it is a complete dystopian reality if that happens. Atleast until solid alternatives emerge such as AGI backed chains. For analysis of future scenarios there is alot in my recent history here on bitcointalk. It is building on conceptual models of society based on power dynamics throughout history and world mythology combined with silicon valley futurism. This is then extrapolated on blockchain technology and integrated with economic valuations as catalyst of progress because blockchain is like stocks but much more advanced. The state of top 5 has no room in that analytic space, not even close. We need those $200 bn for other things now and you must pay for it by x100 leverage all the way back to $400.
|
|
|
|
cabe72000
Newbie
Offline
Activity: 8
Merit: 0
|
|
October 21, 2019, 01:46:41 PM |
|
Be careful here to all new investors.
Especially if you are engulfed in x100 longs.
This market is rigged, please search elsewhere for profit in this space, it is out there but not in top 5 right now or probably ever.
Top 5 is zombie graveyard but status quo has not ruptured yet, only when there is a flip will it be evident, and by then it is too late to recover permanent losses.
Flip event will transfer hundred of billions to solid projects in top 100, and trillions of migrated merchant business with branded cryptos using index platforms that can handle the txs requirements while remaining decentralized.
Most responsible thing for crypto elite to do at this stage is shelf OG BTC but everyone is neck deep from early gains.
Research the state of this soon to be fractured market, do not invest more than you can comfortably afford to lose.
There is no guarantee of reversal from descent into $5000, it could very well go down to low thousands and stagnate there during and after flip. Understand that market cap of top 5 is $200 billion dollars or 90% of total, everything of this will soon be redistributed to next gen projects that contribute to a better world.
A future BTC and top 5 dominance of single digit is possible. The future will be paid for by top 5 and merchant onramping, no one is stupid to enter top 5 with all this information available at this stage of maturity.
Finally let us bury these false ideas once and for all:
1. BTC is not scarce, there are tens of thousands of alts with better tech that can perform exactly like BTC or better, and most of these already went to -99.99% due to lack of support. Saying BTC is scarce is like saying the first copy of windows 95, kazaa 1.0, napster, DC++ or netscape or 56k modem installation cds are scarce and ultra valuable.
2. BTC does not and will not ever compete with decentralized tech that is scalable
3. Real decentralization is only possible through a myriad of merchant and personal cryptos, not monoliths.
4. Super powers control BTC since late 2017, they control CMC, all top exchanges, all leverage and lending firms. An investment in BTC or top 5 is a solid support of perpetual status quo stagnation which humanity already saw 10 years of, a wasted decade technologically.
5. BTC operates on greed, delusion, degenerate gambling, despotism. You get what you pay for, now go x100 long and sellout the future.
6. BTC was established on criminal syndication like the silk road, the only thing that happened is that even bigger criminals now control this market. 2017 ICOs were 99% scams, it is riddled with criminals and most recently white collars and corrupt international agencies.
7. Mining is 100% centrally controlled and a disaster of resource optimization allocation. This is why I bought eth in early 2016, a crypto that would make good use of energy allocation, unfortunately, did not scale.
8. Stop watching youtube pushers of top 5. Whether bearish or bullish, I am here to explain that the concept in itself is fast becoming irrelevant as new projects begin maturing. This is projects that you have never even heard of and will not discover until they are already x100, it is the reality of life as a mainstream investor, always late to wealth. I have been living, sleeping, eating crypto for 10 hours most days for 3 consecutive years with a period of interruption 6 months in 2017 while you were doing normal things like family, work, holiday, weddings, dinners, parties, etc. I am by no means the smartest guy on this board but simply brute forced a level of knowledge that will take other average joes the same amount of time investment to gain (many years).
9. Finally a contrarian view: yes BTC may go to $300 000 but it is a complete dystopian reality if that happens. Atleast until solid alternatives emerge such as AGI backed chains. For analysis of future scenarios there is alot in my recent history here on bitcointalk. It is building on conceptual models of society based on power dynamics throughout history and world mythology combined with silicon valley futurism. This is then extrapolated on blockchain technology and integrated with economic valuations as catalyst of progress because blockchain is like stocks but much more advanced. The state of top 5 has no room in that analytic space, not even close. We need those $200 bn for other things now and you must pay for it by x100 leverage all the way back to $400.
No technical analysis, we could call this Fundamental analysis, if you wanna say something. This is offtopic of the original idea of the post. Also, Setting yourself as "the smartest guy in crypto" throws away your whole story, humble (as shown by 123) is the best asset to have. To finish, you "museum" link sends you to a "crypto coin" so. You are, shouting against BTC (With no technical analysis) but promote in your signature a new blockchain coin? ¿Thanks for the opinion? |
|
|
|
|
|
xxxx123abcxxxx (OP)
|
|
October 22, 2019, 05:52:09 AM |
|
A rise beyond the OCT-2019 high of ~$8800 may obviate the following extended decline scenarios... BITSTAMP support zones... @7230: 61.8% Fibonacci retracement from 15-DEC-2018 to 26-JUN-2019 (avg expected zone)
@5425: 78.6% Fibonacci retracement from 15-DEC-2018 to 26-JUN-2019 (max expected zone)
@4350: 88.6% Fibonacci retracement from 15-DEC-2018 to 26-JUN-2019 (WARNING: Bull Market Terminated?)
   |
|
|
|
|
exstasie
Legendary
Offline
Activity: 1806
Merit: 1521
|
|
October 22, 2019, 06:46:12 AM |
|
A rise beyond the OCT-2019 high of ~$8800 may obviate the following extended decline scenarios... BITSTAMP support zones... @7230: 61.8% Fibonacci retracement from 15-DEC-2018 to 26-JUN-2019 (avg expected zone)
@5425: 78.6% Fibonacci retracement from 15-DEC-2018 to 26-JUN-2019 (max expected zone)
@4350: 88.6% Fibonacci retracement from 15-DEC-2018 to 26-JUN-2019 (WARNING: Bull Market Terminated?)
Is it possible the last leg down to $7,800 (ending October 18th) was a truncated/failed wave? I'm beginning to wonder if we've already seen the bottom. Something like this: https://bitcointalk.org/index.php?topic=5140701.msg52813750#msg52813750Normally I would favor the beige scenario but this price action is very trolly. Not sure..... |
|
|
|
|
xxxx123abcxxxx (OP)
|
|
October 22, 2019, 07:51:59 AM |
|
Yes, its possible with the following requirements... 1. An impulsive 5 wave rise from the 18-OCT-2019 low (so far 3 waves). 2. A rise beyond the 11-OCT-2019 high of $8800 approx. |
|
|
|
|
cabe72000
Newbie
Offline
Activity: 8
Merit: 0
|
|
October 23, 2019, 02:10:56 PM |
|
Yes, its possible with the following requirements... 1. An impulsive 5 wave rise from the 18-OCT-2019 low (so far 3 waves). 2. A rise beyond the 11-OCT-2019 high of $8800 approx. Hi again. I can't remember how it was called, but, I remember this analysis, that after a clear breakthrough there will be some fluctuations inside a range, and the another breakthrough that would continue the trend of the one before. I think I see this clearly in the the following bitstamp graph which I marked the previous and the todays break which continues the trend. https://ibb.co/KscqfdXNow we should expect ups and downs inside some range, until the next clear break ¿correct? according to my statement before, should be also in the low direction, ¿which technic would you use to analyse the future breakthrough, in order to predict if it is going to be negative as the trends continues, or in the positive and thus breaking the trend? PS: Which code do I have to add here to get the image to show at the post without the need to clikc in it???!!! |
|
|
|
|
|
|
|
xxxx123abcxxxx (OP)
|
|
October 23, 2019, 07:39:38 PM |
|
Hi again. I can't remember how it was called, but, I remember this analysis, that after a clear breakthrough there will be some fluctuations inside a range, and the another breakthrough that would continue the trend of the one before. I think I see this clearly in the the following bitstamp graph which I marked the previous and the todays break which continues the trend. https://ibb.co/KscqfdXNow we should expect ups and downs inside some range, until the next clear break ¿correct? according to my statement before, should be also in the low direction, ¿which technic would you use to analyse the future breakthrough, in order to predict if it is going to be negative as the trends continues, or in the positive and thus breaking the trend? PS: Which code do I have to add here to get the image to show at the post without the need to clikc in it???!!! Expecting the decline to conclude at either of the following BITSTAMP support zones... @7230: 61.8% Fibonacci retracement from 15-DEC-2018 to 26-JUN-2019 (avg expected zone)
@5425: 78.6% Fibonacci retracement from 15-DEC-2018 to 26-JUN-2019 (max expected zone)
@4350: 88.6% Fibonacci retracement from 15-DEC-2018 to 26-JUN-2019 (WARNING: Bull Market Terminated?)
At which point, the following criteria ought to signal a potential end to the decline: 1. A +15% bounce. 2. Positive divergence on a momentum indicator such as the RSI, on daily and 4-hr timeframes. 3. A rising impulsive wave structure consisting of 5 waves. |
|
|
|
|
cabe72000
Newbie
Offline
Activity: 8
Merit: 0
|
|
October 25, 2019, 04:35:45 PM |
|
Hi again. I can't remember how it was called, but, I remember this analysis, that after a clear breakthrough there will be some fluctuations inside a range, and the another breakthrough that would continue the trend of the one before. I think I see this clearly in the the following bitstamp graph which I marked the previous and the todays break which continues the trend. https://ibb.co/KscqfdXNow we should expect ups and downs inside some range, until the next clear break ¿correct? according to my statement before, should be also in the low direction, ¿which technic would you use to analyse the future breakthrough, in order to predict if it is going to be negative as the trends continues, or in the positive and thus breaking the trend? PS: Which code do I have to add here to get the image to show at the post without the need to clikc in it???!!! Expecting the decline to conclude at either of the following BITSTAMP support zones... @7230: 61.8% Fibonacci retracement from 15-DEC-2018 to 26-JUN-2019 (avg expected zone)
@5425: 78.6% Fibonacci retracement from 15-DEC-2018 to 26-JUN-2019 (max expected zone)
@4350: 88.6% Fibonacci retracement from 15-DEC-2018 to 26-JUN-2019 (WARNING: Bull Market Terminated?)
At which point, the following criteria ought to signal a potential end to the decline: 1. A +15% bounce. 2. Positive divergence on a momentum indicator such as the RSI, on daily and 4-hr timeframes. 3. A rising impulsive wave structure consisting of 5 waves. As soon as I saw the jump i thought about this post. We can say that the decline of the market is really finished as the support zone got up to 8500 (now at 8300) ¿correct? Or is ir jusr anoghe part of the wave? If correct, we should se a movement around a range for some days and then again a possibly up or down according to the last movement, and if the decline is terminated in the up direction. I love this post is pure gold on knowledge! |
|
|
|
|
figmentofmyass
Legendary
Offline
Activity: 1652
Merit: 1483
|
|
October 25, 2019, 04:53:33 PM |
|
At which point, the following criteria ought to signal a potential end to the decline:
1. A +15% bounce.
2. Positive divergence on a momentum indicator such as the RSI, on daily and 4-hr timeframes.
3. A rising impulsive wave structure consisting of 5 waves.
As soon as I saw the jump i thought about this post. We can say that the decline of the market is really finished as the support zone got up to 8500 (now at 8300) ¿correct? Or is ir jusr anoghe part of the wave? looks like we got our 15% bounce. it would have been nice to run below the .618 and form some nice bullish divergences, but that would have been too easy! xxxx123abcxxxx, you think the bottom is in!? i'd love to see an updated count. |
|
|
|
Gustavo_Brucestavo
Newbie
Offline
Activity: 2
Merit: 0
|
|
October 25, 2019, 08:14:40 PM |
|
Hey ABC, thanks for all the great pointers.... the 15% has happened it seems. Would love to hear an update on your thoughts for where we go from here! Cheers.
|
|
|
|
|
|
xxxx123abcxxxx (OP)
|
|
October 26, 2019, 03:35:19 AM
Last edit: October 26, 2019, 04:11:39 AM by xxxx123abcxxxx Merited by exstasie (3), josegines (1) |
|
2019 Cryptocurrency (Elliott Wave): Trick or Treat
?https://www.reddit.com/r/BitcoinMarkets/comments/dn8ie2/2019_cryptocurrency_elliott_wave_trick_or_treat/The 2019 Bitcoin bull market parabolically surged 345% from the low of 15-DEC-2018 to the high of 26-JUN-2019. Since the 26-JUN-2019 high, the market was spooked with a 48% decline into the low of 23-OCT-2019. From an Elliott Wave perspective, two scenarios are under consideration at this inflection point: a continuing Bull Scenario (Preferred) or a Bear Scenario (Alternative). In either scenario, the Elliott Wave model proposes a five wave structure, consisting of: three advancing bull market waves, interwoven with two declining bear market waves. Overlaying this model onto Bitcoin suggests: Wave-1: the first bull market wave 2010-2013 (1219 days), followed by;
Wave-2: the first bear market wave 2013-2015 (426 days), followed by;
Wave-3: the second bull market wave 2015-2018 (1065 days), followed by;
Wave-4: the second bear market wave 2018-2019 (363 days), followed by;
Wave-5: the third and final bull market wave 2019-?
 The five aforementioned have been considered as PRIMARY degree waves such waves elapse the course of a few months to a couple of years. Each PRIMARY degree wave is constituted of five INTERMEDIATE degree waves; and in turn, so forth into smaller degree fractals. The Bullish Scenario (Preferred) suggests Wave-5 is still underway, and the bulls shall be treated to subdividing and extending waves headed for new all-time highs. The Bear Scenario (Alternative) suggests a trick Wave-5 completed at the 26-JUN-2019 high as a truncated fifth wave failure, and a bear market is underway.
Bull Scenario (Preferred)The preferred bullish scenario suggests a continuing bull market is underway. PRIMARY[5] wave started from the 06-FEB-2019 low, and has completed its first parabolic uptrend labelled as INTERMEDIATE(1) wave at the 26-JUN-2019 high. INTERMEDIATE(2) wave pullback started at the 26-JUN-2019 high, and retraced an almost Fibonacci 61.8% thus far into the 23-OCT-2019 low. This 4-month decline unfolded in a three wave A-B-C structure. With technical momentum indicators such as the RSI (Relative Strength Index) positively diverging from price action on multiple timeframes, it appears the pullback may be complete. However, the first set of five rising impulsive waves are yet to be discernible from the 23-OCT-2019 low.   Any further extended declines for INTERMEDIATE(2) wave pullback ought to be concluded at the following Fibonacci support zones, using BITSTAMP: @7230: 61.8% Fibonacci retracement from 15-DEC-2018 to 26-JUN-2019. [AVG]
@5425: 78.6% Fibonacci retracement from 15-DEC-2018 to 26-JUN-2019. [MAX]
@4350: 88.6% Fibonacci retracement from 15-DEC-2018 to 26-JUN-2019. [WARNING: Bull Market Terminated?]
From the 23-OCT-2019 low, the continuing bull market scenario would now suggest the start of a rising INTERMEDIATE(3) wave. Such a wave is expected to unfold parabolically in nature, and at a minimum, meet or exceed the PRIMARY[3] high set on 17-DEC-2017. In both price and time, this wave is expected to be the longest of the PRIMARY[5] bull market. Subdividing and extending parabolic waves on exponential price scales are challenging to track. The maximum declines within INTERMEDIATE(3) wave ought to be around 40% in size, with averages of 20%-25%. Where the PRIMARY[5] bull market ends is open to interpretation and speculation. From an Elliott Wave perspective: A common wave relationship guides the price of the fifth wave to be equal to; or extend a Fibonacci 1.618 times; the length from the low of the first wave through to the high of third wave; projected from the low of the fourth wave. This provides a conservative target of the current bull market to conclude between $22,912 and $35,127, calculated using the BraveNewCoin (BLX) index: @22912: PRIMARY[5] = (PRIMARY[1] + PRIMARY[3]) * 1
@35127: PRIMARY[5] = (PRIMARY[1] + PRIMARY[3]) * 1.618
 As and when the waves develop and progress, and in the event of subdividing and extending waves, revised price targets shall be calculated with renewed projections.
Bear Scenario (Alternative)The alternative bear market scenario suggests the 2019 bull market was a short-lived affair, and PRIMARY[5] terminated as a failed-fifth truncated wave at the 26-JUN-2019 high. In this scenario, five completed PRIMARY degree waves have completed a CYCLE I wave structure. And now a CYCLE II wave bear market pullback is underway and headed to break below the 2018 low.  The decline from the 26-JUN-2019 high to the 23-OCT-2019 low completed the first leg of the bear market. And now, the first bounce of the bear market may be currently underway retracing towards the following Fibonacci zones, using BITSTAMP prices: @9810: 38.2% Fibonacci retracement from 26-JUN-2019 to 23-OCT-2019. [MIN]
@10590: 50.0% Fibonacci retracement from 26-JUN-2019 to 23-OCT-2019. [AVG]
@11365: 61.8% Fibonacci retracement from 26-JUN-2019 to 23-OCT-2019. [AVG]
@12470: 78.6% Fibonacci retracement from 26-JUN-2019 to 23-OCT-2019. [MAX]
Once the bear market bounce completes at any of the aforementioned resistance zones, the next phase of the decline is expected to commence, and break below the 2018 low.  At this point in time, the alternative bear market scenario may be paused for consideration whilst price action remains above the 23-OCT-2019 low. The alternative bear market scenario may be gradually phased-out, step-by-step as follows: 1. A rising five wave impulsive structure from the 23-OCT-2019 low. 2. Price advancing beyond the 61.8% Fibonacci retracement from 26-JUN-2019 to 23-OCT-2019. 3. Price exceeding the 26-JUN-2019 high.
BITSTAMP support zones:
8850, 8500, 7230, 5425, 4350
BITSTAMP resistance zones:
9810, 10590, 11365, 12470, 13130, 16260, 17930
Analysis is purely speculative, and projections are indicative of price & structure, not time. Happy Halloween!
|
|
|
|
|
oarmas
Newbie
Offline
Activity: 12
Merit: 9
|
|
October 29, 2019, 02:08:31 PM |
|
My current count has GBTC bottoming out around 8.10, BTC may have already bottomed out. It should be a wave 2 or Y. With a halving coming on May 23 2020, the dye for a move upwards is in motion. At a rate of growth of less than 2% per annum after May 2020, the fiat banking system will be hard pressed to match BTC going forward, creating an infinite move upwards vis a vis fiat currencies. This is the beginning of primary 3 or cycle 3.
|
|
|
|
|
figmentofmyass
Legendary
Offline
Activity: 1652
Merit: 1483
|
|
October 29, 2019, 05:26:02 PM |
|
My current count has GBTC bottoming out around 8.10, BTC may have already bottomed out. It should be a wave 2 or Y. With a halving coming on May 23 2020, the dye for a move upwards is in motion. At a rate of growth of less than 2% per annum after May 2020, the fiat banking system will be hard pressed to match BTC going forward, creating an infinite move upwards vis a vis fiat currencies. This is the beginning of primary 3 or cycle 3.
i'd love to see your count. would you mind sharing? the OP believes we're in a primary wave 5, which naturally suggests that a bearish supercycle will follow the next bubble. i'm skeptical about that but the count seems plausible for now. |
|
|
|
MarquiseMuseum
Member
Offline
Activity: 739
Merit: 29
www.MarquiseMuseum.com
|
|
October 30, 2019, 06:32:04 AM
Last edit: October 30, 2019, 06:48:02 AM by MarquiseMuseum |
|
Halving awareness is too high in combination with merchant phase with branded tokenization which BTC was not designed for, regardless of how you want to spin that fact. XCP is simply just not good enough compared to dedicated index platforms. Market cannot grow from here without retail onramping, fiat will be rendered irrelevant by global index migration to proprietary blockchain platforms, so this is not value that decentralized space will be able to capture.
BTC is not some miracle solution to every world wide problem for the next millenia, I believe that it has already topped out based on fundamentals and that there will be a very drastic flip event some time soon, not involving any of the top 5 coins. Hyperbitcoinization pattern is a result of economic digitalization but the parabola is driven by other growth factors outside crypto and this pattern is visible in other industries such as integrated circuits (moores law).
I believe that there is a gamblers delusion in BTC market driven by leverage and speculation detached from reality.
Shifting focus away from something that was already rejected by mainstream towards global index tracking is better inorder to deflate expectations moving into 2020's.
It's unfortunate that it may have to top out at 35k and bring everyone with it to the abyss before the real market shift can initiate.
People need to get proper rekt, I guess, it has to burn deep enough for change to happen.
There are many more reasons for this viewpoint but it's already debated in post history, no need for repetition.
No doubt crypto has a future and trillions in market cap awaits, but it is healthier behaviour to shift focus away from individual chains to global index tracking, and then from there, begin cherry picking projects with solid fundamentals, there are a few x10 000 in there.
It paved the way for a new industry, let it go out with grace.
|
|
|
|
exstasie
Legendary
Offline
Activity: 1806
Merit: 1521
|
|
October 30, 2019, 06:50:03 AM |
|
Halving awareness is too high Bears said the same thing in 2016. You know what happened next. Also, I think the Speculation forum gives an overly bullish picture of market sentiment. This place is crawling with permabulls. In fact, this perspective makes it seem like the halving hasn't been priced in at all: If the May 2020 stock-to-flow ratio for Bitcoin is factored into the model, a vertiginous price of around USD 90,000 emerges. This would imply that the forthcoming halving effect has hardly been priced into the current Bitcoin price of approximately USD 8,000. |
|
|
|
MarquiseMuseum
Member
Offline
Activity: 739
Merit: 29
www.MarquiseMuseum.com
|
|
October 30, 2019, 06:59:04 AM |
|
I'd like to see analysis of global index excluding top 10. It's a $20 billion market, lots of potential.
|
|
|
|
|
josegines
|
|
October 30, 2019, 03:12:57 PM
Last edit: October 30, 2019, 03:24:29 PM by josegines |
|
2019 Cryptocurrency (Elliott Wave): Trick or Treat
?
Is it totally ruled out that the market made PRIMARY [5] in Dec / 17 and since then is doing CYCLE II? Thanks for your updates.  |
|
|
|
|
xxxx123abcxxxx (OP)
|
|
October 30, 2019, 07:30:29 PM
Last edit: October 30, 2019, 07:50:10 PM by xxxx123abcxxxx |
|
Is it totally ruled out that the market made PRIMARY [5] in Dec / 17 and since then is doing CYCLE II?
Thanks for your updates.
There are many Elliott Wave counts which suggest Wave-5 completed at the 2017 high. However, when counting the individual constituent waves, the analysis on this thread suggests, either: Wave-5 is still currently in progress (preferred); or, completed at the 2019 high as a truncated fifth wave failure (alternative). |
|
|
|
|
|
josegines
|
|
October 30, 2019, 10:27:17 PM |
|
Is it totally ruled out that the market made PRIMARY [5] in Dec / 17 and since then is doing CYCLE II?
Thanks for your updates.
There are many Elliott Wave counts which suggest Wave-5 completed at the 2017 high. However, when counting the individual constituent waves, the analysis on this thread suggests, either: Wave-5 is still currently in progress (preferred); or, completed at the 2019 high as a truncated fifth wave failure (alternative). but a truncated fifth wave failure would reverse the entire impulsive wave and also, violently, in this case, that would mean that the price would return to 0. Do you think BTC can go to 0? |
|
|
|
|
marky89
|
|
October 30, 2019, 10:30:58 PM |
|
At this point in time, the alternative bear market scenario may be paused for consideration whilst price action remains above the 23-OCT-2019 low. Will the "alternative" bear scenario become the "preferred" scenario once the 23-OCT low is breached? but a truncated fifth wave failure would reverse the entire impulsive wave and also, violently, in this case, that would mean that the price would return to 0.
Do you think BTC can go to 0?
What do you mean by "reverse the entire impulsive wave?" A truncated fifth would imply weakness, but it wouldn't mean the following correction would erase 100% of previous gains. |
|
|
|
|
xxxx123abcxxxx (OP)
|
|
October 30, 2019, 10:55:37 PM |
|
At this point in time, the alternative bear market scenario may be paused for consideration whilst price action remains above the 23-OCT-2019 low. Will the "alternative" bear scenario become the "preferred" scenario once the 23-OCT low is breached? but a truncated fifth wave failure would reverse the entire impulsive wave and also, violently, in this case, that would mean that the price would return to 0.
Do you think BTC can go to 0?
What do you mean by "reverse the entire impulsive wave?" A truncated fifth would imply weakness, but it wouldn't mean the following correction would erase 100% of previous gains. Using the BLX/BNC index: PRIMARY[2] declined 86.08% and PRIMARY[4] declined 83.70% both taking an average of a year to unfold. If a bear market CYCLE II wave is underway, it would most certainly decline 85% to 95% hence breaking below the 2018 low, and quite possibly heads towards the PRIMARY[1] high at $1200. Return to $0...? Who knows. But a sustained decline towards the PRIMARY[2] low of $164 would be a catastrophic collapse beyond a return to survival. For now, as long as price action remains above the 23-OCT-2019 low, projections can remain optimistic in regards to a continuing bull market headed for all-time highs. Should price fall beneath the 23-OCT-2019 low, the following Fibonacci zones provide critical support levels using BITSTAMP prices.... @7230: 61.8% Fibonacci retracement from 15-DEC-2018 to 26-JUN-2019.
@5425: 78.6% Fibonacci retracement from 15-DEC-2018 to 26-JUN-2019. [WARNING: Bull Market/Bear Market at 50/50]
@4350: 88.6% Fibonacci retracement from 15-DEC-2018 to 26-JUN-2019. [WARNING: Bull Market Terminated?]
|
|
|
|
|
|
xxxx123abcxxxx (OP)
|
|
October 30, 2019, 11:14:00 PM |
|
Bullish Scenario (Preferred) using GBTC...   |
|
|
|
|
|
josegines
|
|
October 30, 2019, 11:28:34 PM |
|
Return to $0...? Who knows. But a sustained decline towards the PRIMARY[2] low of $164 would be a catastrophic collapse beyond a return to survival.
It is not a prognosis of mine, I mean the Elliot Wave Theory. As I understand it, when the 5th fault occurs, the full impulse is retracted, in this case, from 20k to 0. Sorry because I haven't found an appointment in English: https://www.labolsadepsico.com/ondas-impulsivas-fallo-de-5/I don't know if there is any modern Elliot theory that gives us a less catastrophic target. |
|
|
|
|
xxxx123abcxxxx (OP)
|
|
October 30, 2019, 11:50:18 PM |
|
Return to $0...? Who knows. But a sustained decline towards the PRIMARY[2] low of $164 would be a catastrophic collapse beyond a return to survival.
It is not a prognosis of mine, I mean the Elliot Wave Theory. As I understand it, when the 5th fault occurs, the full impulse is retracted, in this case, from 20k to 0. Sorry because I haven't found an appointment in English: https://www.labolsadepsico.com/ondas-impulsivas-fallo-de-5/I don't know if there is any modern Elliot theory that gives us a less catastrophic target. Personally, not heard of that Elliott Wave rule before. Seen many truncated failed fifth waves which have not completely erased the entire prior impulse. P.S. Not seeing a fifth wave failure in your example: https://i.imgur.com/OTw0EMV.png |
|
|
|
|
|
josegines
|
|
October 31, 2019, 12:11:55 AM
Last edit: October 31, 2019, 12:22:41 AM by josegines |
|
Personally, not heard of that Elliott Wave rule before. Seen many truncated failed fifth waves which have not completely erased the entire prior impulse.
Good! I get this example on that page:  sorry, I see you have written a new lettering. Although the example may not be correct, the text does refer to the Elliot Wave theory Cuando se produce un fallo de 5 volveremos al origen del impulso y además de forma violenta. Si no fuera así, el recuento será incorrecto.
When a failure of 5 occurs we will return to the origin of the impulse and also violently. If not, the count will be incorrect. Sorry but I am more confused with your labeling, how can the ABC correction be larger than the previous impulse?  |
|
|
|
|
|
|
xxxx123abcxxxx (OP)
|
The 1-2-3-4-5 labeling is of smaller degree. The A-B-C is labeling is part of a lager degree. Therefore, the A-B-C corrects a larger 1-2-3-4-5 not seen on the limited chart. In the aforementioned Spanish website, the following is said in regards to a truncated fifth wave failure...
After the failure has occurred, the price should go back the entire movement of the previous impulse pattern, that is, it should return to the origin of the pattern.
If we are facing a failure pattern, the market should probably go back to the origin of wave 1.
Note the bold typefaced words. Exact science, is not exact science. When a fifth wave failure occurs, it is a sign of weakness forewarning of a deeper than usual retrace in the opposite direction. On smaller degree waves this could more likely retrace the entire prior impulse, but perhaps less likely to do so on larger degree waves. |
|
|
|
|
MarquiseMuseum
Member
Offline
Activity: 739
Merit: 29
www.MarquiseMuseum.com
|
|
November 01, 2019, 12:07:15 PM
Last edit: November 01, 2019, 01:56:30 PM by MarquiseMuseum |
|
$164 is 3 billion market cap, it is inline with top 10 valuations and there is no specific reason that BTC should not align with those valuations.
People who buy into BTC now, a 10 year old technology (when was the last time you invested heavily into 56k modems? must be aware that this can be a decade long falling knife. Just be aware that this can happen, I remember when BTC was $430 in April of 2016, it was not long ago, and nothing has changed fundamentally since then quite the contrary, as competition is catching up.
There are other healthier markets to invest in but crypto will probably be a thing for the elite with index migration of stocks to proprietary platforms such as NASDAQ.
BTC and decentralized space can very much become a currency for the 21st century proletariat, the underclass, as fiat collapses while elite is already on blockchain in stock and bond markets.
There are indications of this already when researching who actually uses BTC, Venezuela - a country in economic ruin. The slogan of crypto in the past was "banking for the unbanked" or something like that - this is not a customer base with immense wealth to spare.
The elite top 1% will copy index tech from waves and stellar (there are no patents to protect this tech) and migrate their clients. Their clients? Every Fortune 500 and top company in the world.
Dedicated index platforms are lucky to capture 1-10% ($200bn-$2tn) of global trade on a 5 year horizon. So that's where the profit will be as far as decentralized growth. 99% of crypto will be centralized in that same time span and the market value will be tens of trillions.
This hypothesis is not visible in the present market yet so I would not advise shorting BTC, it can impulse to $35k easily. This is fundamental analysis spanning the 2020's, very long term.
There is no indication that the original blockchain called BTC, is on track to compete in that environment. It was not designed to do that and the market is forked into several new chains like Bitcoin cash and satoshi vision. It is fragmented and dev talent can see the writing on the wall and adapt to the unfolding situation by selling knowledge to enterprise space and getting back inline with status quo.
The main cause of this evolution is that BTC and ETH hit a scaling wall 2 years ago and lost critical momentum and competitive advantage. Decentralized merchants (underclass) are of marginal importance compared to Fortune 500 (top 1%). Decentralization may revive as a concept if the future is particulary dystopian, but for now, mainstream does not care about decentralization. But they do care about blockchain.
|
|
|
|
drays
Legendary
Offline
Activity: 2520
Merit: 1073
|
|
November 01, 2019, 09:04:00 PM |
|
Marquise, enough trying to kick BTC because of "old tech" etc etc... I have listened it multiple times from the altcoin fans - they think the newer is the tech, the better and more useful it is. That's simply not true. There is a lot of useless new tech. And there is a lot of good new tech, which nobody cares about, and will never do so. The value of tech is its social impact, not just innovation. You tell people care about "blockchain", not BTC? Not my experience. To me "blockchain" is just a new buzzword, just like "5G" or other overhyped tech. Blockchain is a good technology, but is nothing revolutionary,or use-in-everything solution. The decentralized global currency is way more disruptive, than just another technology, be it blockchain or anything else. Besides that, its all not about the tech, but is about loyal community and brand awareness. Still the best programmers are working on BTC, and the BTC will attract the biggest talents, because... it is one level above anything else, I believe any of alt developers will be honored to be invited to work on BTC. Alts are... well.. " alts" - meaning they are an alternative research. Their value is to be a test ground for the BTC - if they develop anything of significance, BTC could absorb it. Some of alts will grow to fill some other niches. Niches, only niches. That's my take on it. I don't express it as often as you express yours, but I just felt someone should intervene in your monologue. Your speculations are interesting, but are unfounded. Do you think you can envision the future, and have to share your revelations with us, the unwashed ones..? |
... this space is not for rent ... |
|
|
figmentofmyass
Legendary
Offline
Activity: 1652
Merit: 1483
|
|
November 01, 2019, 10:58:32 PM |
|
Bullish Scenario (Preferred) using GBTC... any thoughts on the expected magnitude of wave (iii)? looking at bitstamp---and based on the current wave (ii) low which could change---a 1.618 extension would mean an approximate retest of the yearly highs in the upper $13000s. does that sound about right, or do you have a different target in mind? |
|
|
|
|
xxxx123abcxxxx (OP)
|
|
November 02, 2019, 12:01:02 AM |
|
Bullish Scenario (Preferred) using GBTC... any thoughts on the expected magnitude of wave (iii)? looking at bitstamp---and based on the current wave (ii) low which could change---a 1.618 extension would mean an approximate retest of the yearly highs in the upper $13000s. does that sound about right, or do you have a different target in mind? Assuming the current pullback for MINUTE [ ii ] wave ends around $8,460 BITSTAMP (which is a Fibonacci 61.8% retrace of MINUTE [ i ] wave), then a typical 1.618% extension would be expected for MINUTE [ iii ] wave barring any subdivisions and extensions. This would provide an approximate target of $12,470 BITSTAMP which is also around the 78.6% Fibonacci retracement of the entire INTERMEDIATE ( 2 ) decline from 26-JUN to 23-OCT. However, since MINUTE [ i ] was the third highest daily gain in Bitcoin history, subsequent waves MINUTE [ iii ] and MINUTE [ iv ] and MINUTE [ v ] could be consecutively smaller to form an overall Leading Diagonal...  |
|
|
|
|
figmentofmyass
Legendary
Offline
Activity: 1652
Merit: 1483
|
|
November 02, 2019, 06:38:52 AM |
|
Assuming the current pullback for MINUTE [ ii ] wave ends around $8,460 BITSTAMP (which is a Fibonacci 61.8% retrace of MINUTE [ i ] wave), then a typical 1.618% extension would be expected for MINUTE [ iii ] wave barring any subdivisions and extensions. This would provide an approximate target of $12,470 BITSTAMP which is also around the 78.6% Fibonacci retracement of the entire INTERMEDIATE ( 2 ) decline from 26-JUN to 23-OCT. However, since MINUTE [ i ] was the third highest daily gain in Bitcoin history, subsequent waves MINUTE [ iii ] and MINUTE [ iv ] and MINUTE [ v ] could be consecutively smaller to form an overall Leading Diagonal... thank you, very insightful. the magnitude of wave [ i ] was so large that i wasn't sure how to approach sub-wave proportions. i had forgotten all about the possibility of a leading diagonal! my elliott wave is a bit rusty. |
|
|
|
Johnii
Newbie
Offline
Activity: 29
Merit: 2
|
|
November 08, 2019, 09:26:24 PM |
|
Hi, I'm a big fan of Elliott waves and I just wonder if the last crash from 19800$ to 3180$ was wave 2 ABC correction of wave one that started in 23 May 2016 and peaked in 2017 December. Now according to my theory the wave 3 has already started in 17 December 2018 and will peak at around 300k mid 2021. I hope Elliott waves experts here have a look at my opinion.
|
|
|
|
|
exstasie
Legendary
Offline
Activity: 1806
Merit: 1521
|
|
November 08, 2019, 10:00:05 PM |
|
Hi, I'm a big fan of Elliott waves and I just wonder if the last crash from 19800$ to 3180$ was wave 2 ABC correction of wave one that started in 23 May 2016 and peaked in 2017 December. Now according to my theory the wave 3 has already started in 17 December 2018 and will peak at around 300k mid 2021. I hope Elliott waves experts here have a look at my opinion.
It's difficult to comment without seeing your wave count. Could you show us a chart? From the December 2018 low, the OP's preferred count puts us in a Primary Wave 5, not Wave 3. See here: https://bitcointalk.org/index.php?topic=5128394.msg52880531#msg52880531 |
|
|
|
Johnii
Newbie
Offline
Activity: 29
Merit: 2
|
|
November 09, 2019, 08:56:39 AM |
|
Hi, I'm a big fan of Elliott waves and I just wonder if the last crash from 19800$ to 3180$ was wave 2 ABC correction of wave one that started in 23 May 2016 and peaked in 2017 December. Now according to my theory the wave 3 has already started in 17 December 2018 and will peak at around 300k mid 2021. I hope Elliott waves experts here have a look at my opinion.
It's difficult to comment without seeing your wave count. Could you show us a chart? From the December 2018 low, the OP's preferred count puts us in a Primary Wave 5, not Wave 3. See here: https://bitcointalk.org/index.php?topic=5128394.msg52880531#msg52880531Ok this is my chart. I counted since btc was 1$ then 5 waves ended with their ABC correction and consolidation mid 2016 https://i.ibb.co/FmZ9rw6/Screenshot-20191109-094930.png |
|
|
|
|
|
xxxx123abcxxxx (OP)
|
|
November 09, 2019, 08:21:04 PM |
|
Thank you for your chart. Personally, do not agree with your interpretation of Elliott Wave. From 2010 to 2017, there have been 3 primary trends in Bitcoin: 2 rising, 1 declining. From 2010 to 2019, there have been 5 primary trends in Bitcoin: 3 rising, 2 declining. The declines are apparent on any momentum indicator such as the RSI, being oversold on a weekly timeframe, with sub 30 readings...  |
|
|
|
|
Johnii
Newbie
Offline
Activity: 29
Merit: 2
|
|
November 09, 2019, 09:39:11 PM |
|
Thank you for your chart. Personally, do not agree with your interpretation of Elliott Wave. From 2010 to 2017, there have been 3 primary trends in Bitcoin: 2 rising, 1 declining. From 2010 to 2019, there have been 5 primary trends in Bitcoin: 3 rising, 2 declining. The declines are apparent on any momentum indicator such as the RSI, being oversold on a weekly timeframe, with sub 30 readings... https://i.imgur.com/flrFuzT.jpgThank you I appreciate your efforts to explain the cycles Bitcoin went through the whole decade. |
|
|
|
|
|
fabiorem
|
|
November 13, 2019, 02:14:41 PM |
|
People who buy into BTC now, a 10 year old technology (when was the last time you invested heavily into 56k modems? must be aware that this can be a decade long falling knife. Just be aware that this can happen, I remember when BTC was $430 in April of 2016, it was not long ago, and nothing has changed fundamentally since then quite the contrary, as competition is catching up.
Facebook is 10 year old, if not more. Google is even older than facebook. Apple and Microsoft are from the 80s. And still people invest in these companies, they have a huge market. And the improvements in their products can be compared to improvements in bitcoin code. |
|
|
|
|
|
xxxx123abcxxxx (OP)
|
|
November 15, 2019, 12:55:03 PM
Last edit: November 15, 2019, 01:09:41 PM by xxxx123abcxxxx |
|
With price/RSI positive divergence on the 4-hr timeframe, and a potential completed waveset; it appears the decline from the 26-OCT-2019 spike high may have concluded, retracing a Fibonacci 61.8% in size. At this juncture, a move beyond 8800 BITSTAMP may signal the resumption of the bull market; however, a move below 8490 BITSTAMP would suggest the decline is subdividing and extending to lower prices. BITSTAMP support zones:
8460, 7950, 7640, 7230, 5425, 4350
BITSTAMP resistance zones:
8850, 9810, 10590, 11365, 12470, 13130, 16260, 17930
  As a side note, the stockmarket may be gearing for a spectacular bull market breakout, if the Dow Jones Industrial Average can remain above 25,750 for the remainder of the year...  Projections are indicative of price & structure, not time. |
|
|
|
|
Wexlike
Legendary
Offline
Activity: 1473
Merit: 1086
|
|
November 15, 2019, 01:28:35 PM |
|
Thank you for your chart. Personally, do not agree with your interpretation of Elliott Wave. From 2010 to 2017, there have been 3 primary trends in Bitcoin: 2 rising, 1 declining. From 2010 to 2019, there have been 5 primary trends in Bitcoin: 3 rising, 2 declining. The declines are apparent on any momentum indicator such as the RSI, being oversold on a weekly timeframe, with sub 30 readings... Is it correct, that according to your wave count wave5 would bring us to around ~$123k ? |
|
|
|
|
|
xxxx123abcxxxx (OP)
|
|
November 15, 2019, 02:28:25 PM |
|
Is it correct, that according to your wave count wave5 would bring us to around ~$123k ?
Where the PRIMARY[5] bull market ends is open to interpretation and speculation. From an Elliott Wave perspective: A common wave relationship guides the price of the fifth wave to be equal to; or extend a Fibonacci 1.618 or 2.618 times; the length from the low of the first wave through to the high of third wave; projected from the low of the fourth wave. This provides a conservative target of the current bull market to conclude between $22,912 and $35,127 and $54,892, calculated using the BraveNewCoin (BLX) index: @22913: PRIMARY[5] = (PRIMARY[1] + PRIMARY[3]) * 1
@35127: PRIMARY[5] = (PRIMARY[1] + PRIMARY[3]) * 1.618
@54892: PRIMARY[5] = (PRIMARY[1] + PRIMARY[3]) * 2.618
As and when the waves develop and progress, and in the event of subdividing and extending waves, revised price targets shall be calculated with renewed projections. Let's take it one wave at a time! |
|
|
|
|
|
fabiorem
|
|
November 15, 2019, 04:45:12 PM |
|
Why do you use the BLX index?
|
|
|
|
|
|
xxxx123abcxxxx (OP)
|
|
November 15, 2019, 06:59:10 PM |
|
Why do you use the BLX index?
Most complete dataset available on TradingView. |
|
|
|
|
LUCKMCFLY
Legendary
Offline
Activity: 2380
Merit: 1848
Leading Crypto Sports Betting & Casino Platform
|
|
November 17, 2019, 08:59:00 PM |
|
There is a criterion that I have to use Elliot waves, and it is that according to my analysis it works perfectly for the trend, be it bullish or bearish, we are currently starting the bullish trend, this volatility that now occurs is normal, however I want to show how I used Elliot waves in the bullish and bearish trend in my analysis:  The evidence in the purple arrows, however the analysis I do a few days, it is easier to react in the medium term for me than in the short term as there are many who are very good at doing so. However, I have read a lot about Elliot and it is a powerful tool in the technical analysis, here my analysis is according to Wyckoff, and the tendency I do it with Elliot, I have also found it very informative utility of MA (28) and MA (14) , although I have not yet put Elliot in the current trend. |
| ..Stake.com.. | | | ▄████████████████████████████████████▄
██ ▄▄▄▄▄▄▄▄▄▄ ▄▄▄▄▄▄▄▄▄▄ ██ ▄████▄
██ ▀▀▀▀▀▀▀▀▀▀ ██████████ ▀▀▀▀▀▀▀▀▀▀ ██ ██████
██ ██████████ ██ ██ ██████████ ██ ▀██▀
██ ██ ██ ██████ ██ ██ ██ ██ ██
██ ██████ ██ █████ ███ ██████ ██ ████▄ ██
██ █████ ███ ████ ████ █████ ███ ████████
██ ████ ████ ██████████ ████ ████ ████▀
██ ██████████ ▄▄▄▄▄▄▄▄▄▄ ██████████ ██
██ ▀▀▀▀▀▀▀▀▀▀ ██
▀█████████▀ ▄████████████▄ ▀█████████▀
▄▄▄▄▄▄▄▄▄▄▄▄███ ██ ██ ███▄▄▄▄▄▄▄▄▄▄▄▄
██████████████████████████████████████████ | | | | | | ▄▀▀▀▀▀▀▀▀▀▀▀▀▀▀▀▀▀▀▄
█ ▄▀▄ █▀▀█▀▄▄
█ █▀█ █ ▐ ▐▌
█ ▄██▄ █ ▌ █
█ ▄██████▄ █ ▌ ▐▌
█ ██████████ █ ▐ █
█ ▐██████████▌ █ ▐ ▐▌
█ ▀▀██████▀▀ █ ▌ █
█ ▄▄▄██▄▄▄ █ ▌▐▌
█ █▐ █
█ █▐▐▌
█ █▐█
▀▄▄▄▄▄▄▄▄▄▄▄▄▄▄▄▄▄▄▀█ | | | | | | ▄▄█████████▄▄
▄██▀▀▀▀█████▀▀▀▀██▄
▄█▀ ▐█▌ ▀█▄
██ ▐█▌ ██
████▄ ▄█████▄ ▄████
████████▄███████████▄████████
███▀ █████████████ ▀███
██ ███████████ ██
▀█▄ █████████ ▄█▀
▀█▄ ▄██▀▀▀▀▀▀▀██▄ ▄▄▄█▀
▀███████ ███████▀
▀█████▄ ▄█████▀
▀▀▀███▄▄▄███▀▀▀ | | | ..PLAY NOW.. |
|
|
|
MarquiseMuseum
Member
Offline
Activity: 739
Merit: 29
www.MarquiseMuseum.com
|
|
November 19, 2019, 12:32:13 AM
Last edit: November 19, 2019, 02:23:09 AM by MarquiseMuseum |
|
People who buy into BTC now, a 10 year old technology (when was the last time you invested heavily into 56k modems? must be aware that this can be a decade long falling knife. Just be aware that this can happen, I remember when BTC was $430 in April of 2016, it was not long ago, and nothing has changed fundamentally since then quite the contrary, as competition is catching up.
Facebook is 10 year old, if not more. Google is even older than facebook. Apple and Microsoft are from the 80s. And still people invest in these companies, they have a huge market. And the improvements in their products can be compared to improvements in bitcoin code. 1. All of these companies you mention are monopolies 2. Bitcoins userbase is 1/100 or less than these companies, yet its market cap is only 1/5, somewhere there is a valuation anomaly, either in fortune 500, or BTC. I think, the latter 3. Facebook had myspace for competition, Google had netscape, Microsoft Xerox. In your examples there is also the case of the opposite loser to the success story and in fact in each example, the loser is first to market tech 4. The crypto space has dozens of top talent competitor teams developing in spaces that bitcoin was not designed for such as Index and enterprise tokens which is probably the only way global market cap can grow into trillions. 5. There is an establishment space that is completely unemerged with centralized enterprise migration that will never use Bitcoin as a primary solution because there is no utility or added value or incentive to do so when much better custom options exist for branding and scalability. 6. It is probably no regulatory of legal recourse to depart from fiat hegemony either because fortune 500 will be forced to use government solutions such as Nasdaq crypto dollars. 7. There is every indication that top 1% of wealth and institutional money welcomes complete regulation of this space before onramping even to the point of totalitarianism. This wealth is benefitting from a century or even millenia old financial status quo so there is zero incentive to go with BTC, even if the establishment successfully hedged BTC just in case it did succeed in any form that it may assume, which it did not and that was concluded many years ago. There is a privacy crypto ecosystem that can capture a very small share of global wealth and it is possible that governments will pump this inorder to gain economic dominance before present fringe userbase grows into moderately mainstream userbase. It may even be that government itself will be the catalyst for this growth in privacy space, touted as liberal and fully decentralized options. So it will become a sock puppet sandbox like Tor and it may even be already that NSA has zero day access to all windows users in the world, we simply don't know how deep that rabbit hole really goes. If that is the case, then forget anonymity and decentralization as developers would have to rebuild the world to get there. Private crypto - the coins that are on CMC (which in 5 years will be only 1% of blockchain space after it is fully centralized and cloned to supercede stock indexes), they have a small chance to capture 1-10% of $20 trillion global retail market divided on a handful of success stories mainly waves, stellar, vechain. This is because they were developed with this specific format in mind. Other than this, private sector has no real growth potential until AGI backed distributed ledger but all assets associated with AGI development is tightly controlled by government and most likely something so fundamental in nature will only emerge under strict and well funded conditions similar to Manhattan project. Fiat collapse will not accelerate private crypto market because when it is permitted to take place, the world will be since long migrated to proprietary solutions. Global debt is also irrelevant because creditors will accept repayment in equivalent currency. 2020's is not weimar 1920's, and if it is then there is a big problem later on. |
|
|
|
|
xxxx123abcxxxx (OP)
|
|
November 24, 2019, 11:01:35 PM
Last edit: November 24, 2019, 11:48:48 PM by xxxx123abcxxxx |
|
2019 Cryptocurrency (Elliott Wave): Thanksgiving Updatehttps://www.reddit.com/r/BitcoinMarkets/comments/e16ezw/2019_cryptocurrency_elliott_wave_thanksgiving/From an Elliott Wave perspective, two scenarios are under consideration at this inflection point: a continuing Bull Scenario or a Bear Scenario. In either scenario, the Elliott Wave model proposes a five wave structure, consisting of: three advancing bull market waves, interwoven with two declining bear market waves. Overlaying this model onto Bitcoin suggests: Wave-1: the first bull market wave 2010-2013 (1219 days), followed by;
Wave-2: the first bear market wave 2013-2015 (426 days), followed by;
Wave-3: the second bull market wave 2015-2018 (1065 days), followed by;
Wave-4: the second bear market wave 2018-2019 (363 days), followed by;
Wave-5: the third and final bull market wave 2019-?
 The five aforementioned have been considered as PRIMARY degree waves such waves elapse the course of a few months to a couple of years. Each PRIMARY degree wave is constituted of five INTERMEDIATE degree waves; and in turn, so forth into smaller degree fractals. The Bull Scenario suggests Wave-5 is still underway, with subdividing and extending waves headed for new all-time highs. The Bear Scenario suggests Wave-5 completed at the 26-JUN-2019 high as a truncated fifth wave failure, and a bear market is underway.
Bull ScenarioThe bullish scenario suggests a continuing bull market is underway. PRIMARY[5] wave started from the 06-FEB-2019 low, and has completed its first parabolic uptrend labelled as INTERMEDIATE(1) wave at the 26-JUN-2019 high.  INTERMEDIATE(2) wave pullback started at the 26-JUN-2019 high, and retraced an almost Fibonacci 61.8% thus far of the 2019 bull market, into the 23-OCT-2019 low. This 4-month decline had initially appeared to have completed an INTERMEDIATE(2) wave pullback when the market suddenly spiked and surged over 40% within a day attributed to news of Chinese leader Xi Jinping reportedly stating China should seize the opportunity offered by blockchain. The surge was the third largest 24-hour price gain in Bitcoin's history. However, since the spike high on 26-OCT-2019, the market has steadily sold-off and now returned back to the 23-OCT-2019 low; and hence, erasing the entire late OCT surge. The surge is now being considered as a B-wave as part of an ongoing INTERMEDIATE(2) wave pullback. In hindsight, it ought to have been obvious this Thanksgiving Turkey isnt cooked yet: B waves are phonies. They are sucker plays, bull traps, speculators' paradise, orgies of odd-lotter mentality or expressions of dumb institutional complacency (or both). They often involve a focus on a narrow list of stocks, are often unconfirmed by other averages, are rarely technically strong, and are virtually always doomed to complete retracement by wave C. If the analyst can easily say to himself, There is something wrong with this market, chances are it's a B wave. Elliott Wave Principle Key to Market Behavior; A.J. Frost, Robert Prechter. From the B-wave high set on 26-OCT-2019, C-wave of INTERMEDIATE(2) wave pullback has been underway and is expected to conclude at the following Fibonacci support zones, using BITSTAMP: @7230: 61.8% Fibonacci retracement from 15-DEC-2018 to 26-JUN-2019. [AVG]
@5425: 78.6% Fibonacci retracement from 15-DEC-2018 to 26-JUN-2019. [MAX]
@4350: 88.6% Fibonacci retracement from 15-DEC-2018 to 26-JUN-2019. [WARNING: Bull Market Terminated?]
In addition to the aforementioned support zones, the following additional midway Fibonacci zones can be sought as support for this current INTERMEDIATE(2) decline, using BITSTAMP: @7055: Wave-C = Wave-A * 0.500
@6280: Wave-C = Wave-A * 0.618
@5170: Wave-C = Wave-A * 0.786
Summary of support zones, using BITSTAMP: 7230, 7055, 6280, 5425, 5170, 4350 At time of writing, price is currently meandering between the first two aforementioned support levels. Once INTERMEDIATE(2) wave pullback has completed, a rising INTERMEDIATE(3) is expected to commence to resume the bull market. Such a wave is expected to unfold parabolically in nature, and at a minimum, meet or exceed the PRIMARY[3] high set on 17-DEC-2017. In both price and time, this wave is expected to be the longest of the PRIMARY[5] bull market. Where the PRIMARY[5] bull market ends is open to interpretation and speculation. From an Elliott Wave perspective: A common wave relationship guides the price of the fifth wave to be equal to; or extend a Fibonacci 1.618 or 2.618 times; the length from the low of the first wave through to the high of third wave; projected from the low of the fourth wave. This provides a conservative target of the current bull market to conclude between $22,912 or $35,127 or $54,892, calculated using the BraveNewCoin (BLX) index: @22912: PRIMARY[5] = (PRIMARY[1] + PRIMARY[3]) * 1
@35127: PRIMARY[5] = (PRIMARY[1] + PRIMARY[3]) * 1.618
@54892: PRIMARY[5] = (PRIMARY[1] + PRIMARY[3]) * 2.618
 As and when the waves develop and progress, and in the event of subdividing and extending waves, revised price targets shall be calculated with renewed projections.
Bear Scenario The bear market scenario suggests the 2019 bull market was a short-lived affair, and PRIMARY[5] terminated as a failed-fifth truncated wave. PRIMARY[5] started from the 15-DEC-2018 low and completed at the 26-JUN-2019 high. A Fibonacci 88.6% retracement of this uptrend is at 4350 BITSTAMP a decline to this point ought to signal the goose is cooked and market has favoured to deflate.  In this scenario, five completed PRIMARY degree waves have completed a CYCLE I wave structure. And now, a CYCLE II wave bear market pullback is underway and headed to break below the 2018 low.  The wider cryptocurrency market in terms of the Altcoins currently appear to support the outlook of a bear market. So far in 2019, the price structure of majority Altcoins has seemingly unfolded in corrective A-B-C advancing waves, instead of impulsive 1-2-3-4-5 waves. This suggests the majority of Altcoins may be set to break their respective 2018 lows unless an intervention can be coordinated

Analysis is purely speculative, and projections are indicative of price & structure, not time. Happy Thanksgiving!
|
|
|
|
|
|
xxxx123abcxxxx (OP)
|
|
November 27, 2019, 08:16:01 PM
Last edit: November 27, 2019, 09:27:18 PM by xxxx123abcxxxx |
|
 With price/RSI positive divergence on the 4-hr timeframe, the Bitcoin markets have once more, another opportunity to resume the bull market. INTERMEDIATE(1) wave completed at the 26-JUN-2019 high, followed by a 5-month decline retracing just over a Fibonacci 61.8% for INTERMEDIATE(2) wave into the 25-NOV-2019 low. INTERMEDIATE(2) wave decline consisted of three MINOR degree waves: A-B-C. Wave-B was a short-lived 24-hr spike surging +40% into the high of 26-OCT-2019. Wave-C decline has been underway since, and appears to have completed into the 25-NOV-2019 low. In regards to wave relationships, most exchanges exhibited the following Fibonacci relationship: Wave-C = Wave-A * 0.618  . COINBASE came within $47 of the aforementioned relationship (projection: 6478, actual: 6526). BITSTAMP came within $235 of the aforementioned relationship (projection: 6280, actual: 6515). For the bull market to resume, price is now required to advance in impulsive i-ii-iii-iv-v waves, and crucially remain above the 27-NOV-2019 low (i.e. 6850 BITSTAMP). A move below the 27-NOV-2019 low would set-up the premise for an extended decline lower.  BITSTAMP support zones:
7230, 7055, 6280, 5425, 5170, 4350
BITSTAMP resistance zones:
8250, 9330, 10200, 11065, 12300, 13040
|
|
|
|
|
|
xxxx123abcxxxx (OP)
|
|
December 05, 2019, 01:44:41 AM
Last edit: December 05, 2019, 02:27:36 AM by xxxx123abcxxxx |
|
 Three Strikes, And You're Out ! Three Strikes, And You're Out !At this juncture as of 05-DEC-2019, two bullish scenarios are under consideration using the Elliott Wave theory; using COINBASE pricing: 1. INTERMEDIATE(1) wave advanced and completed at the 26-JUN-2019 high; and, INTERMEDIATE(2) wave decline completed at the 25-NOV-2019 low; and, now INTERMEDIATE(3) wave advance is underway. A rise beyond the 29-NOV-2019 high ought to confirm this scenario. 2. INTERMEDIATE(1) wave advanced and completed at the 26-JUN-2019 high; and, INTERMEDIATE(2) wave decline is still in progress. A decline below the 27-NOV-2019 low ought to confirm this scenario is underway, and yet to complete at either of following three Fibonacci support zones... Minor support zones... STRIKE #1:
@6478: MINOR C = MINOR A * 0.618
@6336: MINUTE [c] = MINUTE [a] * 0.382
@6407: AVG
STRIKE #2:
@5862: MINUTE [c] = MINUTE [a] * 0.050
STRIKE #3:
@5431: 78.6% Fibonacci retracement from 15-DEC-2018 to 26-JUN-2019
@5389: MINUTE [c] = MINUTE [a] * 0.618
@5374: MINOR C = MINOR A * 0.786
@5398: AVG
Major support zones... @5431: 78.6% Fibonacci retracement of the entire INTERMEDIATE(1) wave from 15-DEC-2018 to 26-JUN-2019.
@4358: 88.6% Fibonacci retracement of the entire INTERMEDIATE(1) wave from 15-DEC-2018 to 26-JUN-2019. [WARNING: Bull Market Terminated?]
|
|
|
|
|
oarmas
Newbie
Offline
Activity: 12
Merit: 9
|
|
December 05, 2019, 03:16:48 AM |
|
I believe we are indeed very close to the end of the correction. BTC has to breach midpoint of 21 day Bollinger at 7500 aprox for a wave 4 and close below 6515 for a wave 5 ~ 6300. GBTC closes above 9.96 followed by a two week drop to a day morning star around 8.10 for an equivalent buy. GBTC is not confirming upward shot with today's bearish activity, however.
|
|
|
|
|
|
xxxx123abcxxxx (OP)
|
|
December 05, 2019, 07:27:27 AM |
|
I believe we are indeed very close to the end of the correction. BTC has to breach midpoint of 21 day Bollinger at 7500 aprox for a wave 4 and close below 6515 for a wave 5 ~ 6300. GBTC closes above 9.96 followed by a two week drop to a day morning star around 8.10 for an equivalent buy. GBTC is not confirming upward shot with today's bearish activity, however.
GBTC didn't break the 23-OCT-2019 low, whilst all other BTC markets did on 22-NOV-2019. If GBTC is to break the 23-OCT-2019, it would align itself with the wider BTC markets...  |
|
|
|
|
oarmas
Newbie
Offline
Activity: 12
Merit: 9
|
|
December 15, 2019, 12:42:05 AM |
|
Yes, true, and unfortunately, it did not break at 9.96, so it's probably going to turn when BTC does, sometime in the next 7 trading days I believe. Right now, I would be happy with an open and close below 8.45 to buy back in.
|
|
|
|
|
oarmas
Newbie
Offline
Activity: 12
Merit: 9
|
|
December 17, 2019, 06:33:22 PM |
|
Today may well be the day, GBTC is below my target of 8.10 AND its' October low, while the BTC general market has not confirmed. It's possible tonight may see doji below the Bollinger Band indicating a 88-95% of a major move up on daily BTC tonight.
|
|
|
|
|
exstasie
Legendary
Offline
Activity: 1806
Merit: 1521
|
|
December 17, 2019, 08:07:11 PM |
|
Today may well be the day, GBTC is below my target of 8.10 AND its' October low, while the BTC general market has not confirmed. It's possible tonight may see doji below the Bollinger Band indicating a 88-95% of a major move up on daily BTC tonight.
Do you have a chart that shows your internal count, or expected price action? GBTC has indeed caught up to the spot market by breaking below its October and November lows but I'm having trouble counting a complete Wave 5 and thus a complete Wave C. It looks to me like there is still more downside coming. |
|
|
|
|
xxxx123abcxxxx (OP)
|
|
December 17, 2019, 10:12:09 PM
Last edit: December 17, 2019, 10:26:59 PM by xxxx123abcxxxx |
|
  COINBASE minor support zones... ZONE #1:
@6478: MINOR C = MINOR A * 0.618
@6336: MINUTE [c] = MINUTE [a] * 0.382
@6407: AVG
ZONE #2:
@5862: MINUTE [c] = MINUTE [a] * 0.050
ZONE #3:
@5431: 78.6% Fibonacci retracement from 15-DEC-2018 to 26-JUN-2019
@5389: MINUTE [c] = MINUTE [a] * 0.618
@5374: MINOR C = MINOR A * 0.786
@5398: AVG
COINBASE major support zones... @5431: 78.6% Fibonacci retracement from 15-DEC-2018 to 26-JUN-2019.
@4358: 88.6% Fibonacci retracement from 15-DEC-2018 to 26-JUN-2019. [WARNING: Bull Market Terminated?]
|
|
|
|
|
|
xxxx123abcxxxx (OP)
|
|
December 24, 2019, 07:52:22 PM
Last edit: December 24, 2019, 08:42:39 PM by xxxx123abcxxxx |
|
2019 Cryptocurrency (Elliott Wave): Christmas Updatehttps://www.reddit.com/r/BitcoinMarkets/comments/ef65re/2019_cryptocurrency_elliott_wave_christmas_update/Summary: Bitcoin remains in a bull market with an outlook to exceed the 2017 high. However, a price move below $5000 suggests Bitcoin is in a bear market, with price headed to break below the 2018 lows. The majority of Altcoins favour an extended bear market unless an intervention can be coordinated. The outlook for the stockmarket, in particular the USA, is extremely bullish.
From an Elliott Wave perspective, two scenarios are under consideration at this inflection point: a continuing Bull Scenario or a Bear Scenario. In either scenario, the Elliott Wave model proposes a five wave structure, consisting of: three advancing bull market waves, interwoven with two declining bear market waves. Overlaying this model onto Bitcoin suggests: Wave-1: the first bull market wave 2010-2013 (1219 days), followed by;
Wave-2: the first bear market wave 2013-2015 (426 days), followed by;
Wave-3: the second bull market wave 2015-2018 (1065 days), followed by;
Wave-4: the second bear market wave 2018-2019 (363 days), followed by;
Wave-5: the third and final bull market wave 2019-?
 The five aforementioned have been considered as PRIMARY degree waves such waves elapse the course of a few months to a couple of years. Each PRIMARY degree wave is constituted of five INTERMEDIATE degree waves; and in turn, so forth into smaller degree fractals. The Bull Scenario suggests Wave-5 is still underway, with subdividing and extending waves headed for new all-time highs. The Bear Scenario suggests Wave-5 completed at the 26-JUN-2019 high as a truncated fifth wave failure, and a bear market is underway. The majority of Altcoins favour an ongoing bear market.
Bull ScenarioThe bullish scenario suggests a continuing bull market is underway. PRIMARY[5] wave started from the 06-FEB-2019 low, and has completed its first parabolic uptrend labelled as INTERMEDIATE(1) wave at the 26-JUN-2019 high.  Since the 26-JUN-2019 high, INTERMEDIATE(2) wave pullback has been underway and has thus far declined 55% into the low of 18-DEC-2019. The structure of INTERMEDIATE(2) wave decline has thus far unfolded as three A-B-C waves of MINOR degree as follows: Wave-A decline started at the high of 26-JUN-2019 and completed as a complex structure at the low of 23-OCT-2019. Wave-B bounce started at the low of 23-OCT-2019 when the market suddenly spiked and surged over 40% within a day attributed to news of Chinese leader Xi Jinping reportedly stating China should seize the opportunity offered by blockchain. The surge was the third largest 24-hour price gain in Bitcoin's history and a simple structure completed at the high of 26-OCT-2019. Wave-C decline has been underway since the high of 26-OCT-2019. At the low of 18-DEC-2019, Wave-C reached a Fibonacci 0.618% of Wave-A in length on notable BITFINEX and COINBASE exchanges; in addition, created positive divergence of price against momentum indicators such as the Relative Strength Index on the daily timeframe. Given the potential of a completed correction as described in the aforementioned A-B-C decline, the market has arrived at a juncture to consider the end of INTERMEDIATE(2) wave decline at the 18-DEC-2019 low. To provide any credibility to this consideration, price is required to rise from the 18-DEC-2019 low and exceed the high of 29-NOV-2019. In addition, price Is required to unfold in five impulsive i-ii-iii-iv-v rising waves. Thus far as of Christmas Eve, price has risen in one wave from the 18-DEC-2019 low and is below the 29-NOV-2019 high. Alternatively, the INTERMEDIATE(2) wave decline is still to further subdivide and extend lower. A decline below the 18-DEC-2019 low confirms an ongoing INTERMEDIATE(2) wave decline. The following Fibonacci-based levels may be sought as support zones to conclude the pullback; using COINBASE pricing: @5431: 78.6% Fibonacci retracement of the entire INTERMEDIATE(1) wave from 15-DEC-2018 to 26-JUN-2019.
@5374: MINOR C = MINOR A * 0.786
@4358: 88.6% Fibonacci retracement of the entire INTERMEDIATE(1) wave from 15-DEC-2018 to 26-JUN-2019. [WARNING: Bull Market Terminated?]
 Using the Greyscale Bitcoin Fund (GBTC) as a proxy to Bitcoin, the rise from the 18-DEC-2019 low thus far, as of Christmas Eve, appears corrective. Therefore, price action currently favours an ongoing decline:  Once INTERMEDIATE(2) wave pullback has completed, a rising INTERMEDIATE(3) is expected to commence and resume the bull market. Such a wave is expected to unfold parabolically in nature, and at a minimum, meet or exceed the PRIMARY[3] high set on 17-DEC-2017. In both price and time, this wave is expected to be the longest of the PRIMARY[5] bull market. Where the PRIMARY[5] bull market ends is open to interpretation and speculation. From an Elliott Wave perspective: A common wave relationship guides the price of the fifth wave to be equal to; or extend a Fibonacci 1.618 or 2.618 times; the length from the low of the first wave through to the high of third wave; projected from the low of the fourth wave. This provides a conservative target of the current bull market to conclude between $22,912 or $35,127 or $54,892, calculated using the BraveNewCoin (BLX) index: @22912: PRIMARY[5] = (PRIMARY[1] + PRIMARY[3]) * 1
@35127: PRIMARY[5] = (PRIMARY[1] + PRIMARY[3]) * 1.618
@54892: PRIMARY[5] = (PRIMARY[1] + PRIMARY[3]) * 2.618
 As and when the waves develop and progress, and in the event of subdividing and extending waves, revised price targets shall be calculated with renewed projections.
Bear ScenarioThe bear market scenario suggests the 2019 bull market was a short-lived affair, and PRIMARY[5] terminated as a failed-fifth truncated wave. PRIMARY[5] started from the 15-DEC-2018 low and completed at the 26-JUN-2019 high. A Fibonacci 88.6% retracement of this uptrend is at 4350 COINBASE a decline to this point ought to signal the market has favoured to deflate.  In this scenario, five completed PRIMARY degree waves have completed a CYCLE I wave structure. And now, a CYCLE II wave bear market pullback is underway and headed to break below the 2018 low.  The wider cryptocurrency market in terms of the Altcoins currently appear to support the outlook of a bear market. So far in 2019, the price structure of majority Altcoins has seemingly unfolded in corrective A-B-C advancing waves, instead of impulsive 1-2-3-4-5 waves. This suggests the majority of Altcoins may be set to break their respective 2018 lows unless an intervention can be coordinated
  
StockmarketThe outlook for the major global equity stockmarkets, in particular the USA, is extremely bullish. From the 2009 low of the great financial crises, the Dow Jones Industrial Average index has risen in four PRIMARY degree waves, with a fifth and final rising wave underway which began from the low of 2018. In 2020, the stockmarket will be entering its 11th bull market year since the low of 2009. Fibonacci numbers next in sequence are 13, 21, 34. Therefore, the stockmarket isnt likely to run into major headwinds until 2022; or until 2030 if the bull market extends to 21 years:   Since the Brexit vote in 2016, the UK FTSE100 has been directionless. With clarity now emerging on Brexit since the 12-DEC-2019 UK election, the FTSE100 is poised to resume a strong bull market: 
Analysis is purely speculative, and projections are indicative of price & structure, not time. Merry Christmas!
|
|
|
|
|
exstasie
Legendary
Offline
Activity: 1806
Merit: 1521
|
Summary: Bitcoin remains in a bull market with an outlook to exceed the 2017 high. However, a price move below $5000 suggests Bitcoin is in a bear market, with price headed to break below the 2018 lows. The majority of Altcoins favour an extended bear market unless an intervention can be coordinated. The outlook for the stockmarket, in particular the USA, is extremely bullish. Thank you for the update! My overall outlook agrees that we have either completed, or nearly completed, an intermediate Wave 2. The bullish stock market is an excellent backdrop for a continued BTCUSD bull market as well. The wider cryptocurrency market in terms of the Altcoins currently appear to support the outlook of a bear market. So far in 2019, the price structure of majority Altcoins has seemingly unfolded in corrective A-B-C advancing waves, instead of impulsive 1-2-3-4-5 waves. This suggests the majority of Altcoins may be set to break their respective 2018 lows unless an intervention can be coordinated
Altcoins are heavily correlated to BTCUSD. This correlation will likely come into play here. A resumption of the BTC bull market will overrule negative sentiment in the altcoin markets. I believe the same thinking applies to GBTC. |
|
|
|
sedactoo+04
Full Member
Offline
Activity: 161
Merit: 175
Hello World!
|
|
January 09, 2020, 03:57:49 PM |
|
Thanks again for the update, really appreciate it,
I believe that the WXY scenario is more likely -especially- for the altcoins.
I am wondering why you take the 5th wave truncated? There is another option such as the truncated 5th wave being the B wave of a huge ABC correction which will lead to the last 5th big bull wave.
|
|
|
|
|
|
xxxx123abcxxxx (OP)
|
|
January 09, 2020, 07:51:22 PM
Last edit: January 09, 2020, 09:09:04 PM by xxxx123abcxxxx |
|
Thanks again for the update, really appreciate it,
I believe that the WXY scenario is more likely -especially- for the altcoins.
I am wondering why you take the 5th wave truncated? There is another option such as the truncated 5th wave being the B wave of a huge ABC correction which will lead to the last 5th big bull wave.
The following illustrates your suggestion:  The above projection suggests PRIMARY[3] completed at the high of 2017, and a PRIMARY[4] decline is still currently ongoing and underway, with a final PRIMARY[5] rise yet to commence. This suggestion is unlikely because: In both price and time, the decline from 2017-2019 is equivalent to 2013-2015; hence, both of these declines are suited to equivalent wave degrees: Wave-1: the first bull market wave 2010-2013 (1219 days), followed by;
Wave-2: the first bear market wave 2013-2015 (426 days), followed by;
Wave-3: the second bull market wave 2015-2017 (1065 days), followed by;
Wave-4: the second bear market wave 2017-2019 (363 days), followed by;
Wave-5: the third and final bull market wave 2019-?
The rise in 2019 thus far has unfolded parabolically in nature and impulsively in a five wave structure usually uncharacteristic to consider as a corrective B-wave. Since wave-4 cannot overlap wave-1, the ongoing PRIMARY[4] decline is required to complete above where the PRIMARY[1] rise ended; i.e. price cannot decline below 30-NOV-2013 high of ~$1200. In both price and time, a decline below the 2018 lows would be the longest and largest decline in the history of Bitcoin; hence, a CYCLE degree decline would be suited to define the new price action character. Such a decline would likely break below the 2018 lows, but may or may not decline below 30-NOV-2013 high. Beyond this point, whether or not a new bull market commences is an open question.... |
|
|
|
|
|
|
|
xxxx123abcxxxx (OP)
|
|
January 10, 2020, 02:41:58 AM
Last edit: January 10, 2020, 03:22:27 AM by xxxx123abcxxxx Merited by exstasie (3), El duderino_ (2) |
|
Insufficient wave development as of second week of JAN-2020, currently appears to be three waves up from the 18-DEC-2019 low, alluding to the following possibilities at this point:  1. [BULL-GREEN]: Three impulsive waves up, with either a fourth wave pullback underway, or a subdividing third wave pullback underway. 2. [BEAR-RED]: Three completed waves up, with a decline set to break below the 18-DEC-2019 low currently underway. A rise above $8500 begins to favor the first [BULL-GREEN] scenario. A decline below $7500 begins to favor the second [BEAR-RED] scenario.   
Summary: Bitcoin remains in a bull market with an outlook to exceed the 2017 high. However, a price move below $5000 suggests Bitcoin is in a bear market, with price headed to break below the 2018 lows. The majority of Altcoins favour an extended bear market unless an intervention can be coordinated. The outlook for the stockmarket, in particular the USA, is extremely bullish. https://www.reddit.com/r/BitcoinMarkets/comments/ef65re/2019_cryptocurrency_elliott_wave_christmas_update/
This is a 2019 thread, and hence it can now be closed. At present, current commitments suspend creation of a new thread. Responses to questions/feedback for a limited time. Thank you for the discussion, speculation and shared thoughts. Best wishes for a prosperous 2020, happy New Year! |
|
|
|
|
exstasie
Legendary
Offline
Activity: 1806
Merit: 1521
|
Insufficient wave development as of second week of JAN-2020, currently appears to be three waves up from the 18-DEC-2019 low, alluding to the following possibilities at this point: Agreed, notwithstanding the slight differences in our internal counts. My main concern is naturally that ABC possibility. While (1)/(a) could be counted as an impulse, the proportions lend themselves more so to a corrective count. If the subsequent leg up had reached the 1.618 extension of (1) then I would be more confident in the bullish scenario. As it stands, it's inconclusive until we see more price action. This is a 2019 thread, and hence it can now be closed. At present, current commitments suspend creation of a new thread. Responses to questions/feedback for a limited time. Thank you for the discussion, speculation and shared thoughts. Best wishes for a prosperous 2020, happy New Year!
Thanks for sharing your thoughts. Very much looking forward to your next thread! |
|
|
|
oarmas
Newbie
Offline
Activity: 12
Merit: 9
|
I agree with exstasie, although the degree of this wave may be overstated (I2 s/b Major2, if major is next degree lower). Both BTC and GBTC appear to have reached secular lows, we'll see how this plays out over the next few days.
|
|
|
|
|
sedactoo+04
Full Member
Offline
Activity: 161
Merit: 175
Hello World!
|
|
January 23, 2020, 09:52:34 AM |
|
Happy new year dear Steve and looking forward to the new 2020 Cryptocurrency (Elliott Wave) topic.
The market seems to turn a little bit more bearish than bullish however the market sentiment is neutral and most of the people are really cautious, even the moon boys have some question marks on their heads about the bull run - which means it is more likely now -
|
|
|
|
|
|
xxxx123abcxxxx (OP)
|
|
January 23, 2020, 12:25:23 PM |
|
Happy new year dear Steve and looking forward to the new 2020 Cryptocurrency (Elliott Wave) topic.
The market seems to turn a little bit more bearish than bullish however the market sentiment is neutral and most of the people are really cautious, even the moon boys have some question marks on their heads about the bull run - which means it is more likely now -
Thank you, best wishes for a prosperous New Year to you too. At present, current commitments suspend creation of a new thread and further analysis; perhaps may find the time in Spring. Appears to be a complete five set of rising impulsive waves from the 18-DEC-2019 low to 19-JAN-2020 high a solid 1 month uptrend gaining 43%. Barring any wave subdivisions and extensions, a pullback now appears underway, and ought to find support at the following Fibonacci-based zones, using BITSTAMP prices: @7806: 50.0% Fibonacci retracement from 18-DEC-2019 low to 19-JAN-2020 high [MIN]
@7480: 61.8% Fibonacci retracement from 18-DEC-2019 low to 19-JAN-2020 high [AVG]
@7016: 78.6% Fibonacci retracement from 18-DEC-2019 low to 19-JAN-2020 high [MAX]
The degree of waves from the 18-DEC-2019 low to 19-JAN-2020 high, may be subject to revision. A decline below 7000 begins to put the bull market at risk.   |
|
|
|
|
|
Mallyx
|
|
January 27, 2020, 10:41:12 AM |
|
Your analysis is extremely bearish for altcoins, it's the first analysis of that kind I ever saw.
But why not ?
|
|
|
|
|
|
fabiorem
|
|
January 27, 2020, 01:39:19 PM |
|
I believe there is some solid support in the 8k area right now. If we dont go to 5k by April, we will probably be above 10k, maybe even 12k, which could signal a new ATH until the end of this year.
|
|
|
|
|
exstasie
Legendary
Offline
Activity: 1806
Merit: 1521
|
|
January 28, 2020, 09:27:35 AM |
|
Your analysis is extremely bearish for altcoins, it's the first analysis of that kind I ever saw.
That will likely change once BTC enters an obvious new bull market. After all, altcoins are all heavily correlated to BTC. I believe that's sort of what the OP is implying here: The majority of Altcoins favour an extended bear market unless an intervention can be coordinated.
|
|
|
|
|
xxxx123abcxxxx (OP)
|
|
January 30, 2020, 12:26:15 AM |
|
BTC (first chart) is required to exceed $9800 to eliminate a potential irregular b-wave scenario; at which point, the count on GBTC (second chart) begins to be favored...   |
|
|
|
|
|
xxxx123abcxxxx (OP)
|
|
February 08, 2020, 04:52:20 AM |
|
From the 18-DEC-2019 low to the 06-FEB-2020 high, the Bitcoin markets have gained around 50% in 50 days. GBTC (1 st chart): has risen in five completed impulsive waves, thus completing a potential waveset. BTC (2 nd chart): has risen in nine waves. The first five completed as impulsive; whilst the remainder of the four wave rise currently appears corrective, and may be thus far, considered as an irregular B-wave rise. The usual allowable extent of an irregular B-wave rise is a Fibbonacci 1.618 times the length of the A-wave. At around $9800, BTC has reached the maximum extent of an irregular B-wave rise. Barring a wave subdivision and extension, there is now a possibility of a pullback at this juncture; using COINBASE pricing: @8157: 50.0% Fibbonacci retracement from 18-DEC-2019 to 06-FEB-2020 [MIN EXPECTED]
@7750: 61.8% Fibbonacci retracement from 18-DEC-2019 to 06-FEB-2020 [AVG EXPECTED]
@7170: 78.6% Fibbonacci retracement from 18-DEC-2019 to 06-FEB-2020 [MAX EXPECTED]
@6824: 88.6% Fibbonacci retracement from 18-DEC-2019 to 06-FEB-2020 [WARNING]
  Analysis and projections are speculative. |
|
|
|
|
|
|
Desscount
Full Member
Offline
Activity: 1386
Merit: 101
ComboLabs
|
|
February 08, 2020, 11:28:28 AM |
|
it looks like a correction will occur, thanks to the speculation you gave, may I ask about the condition of altcoin? Will the altseason come, sir? thanks
|
|
|
|
|
xxxx123abcxxxx (OP)
|
|
February 09, 2020, 03:25:43 AM
Last edit: February 09, 2020, 03:59:31 AM by xxxx123abcxxxx |
|
From the 18-DEC-2019 low to the 06-FEB-2020 high, the Bitcoin markets have gained around 50% in 50 days. GBTC (1 st chart): has risen in five completed impulsive waves, thus completing a potential waveset. BTC (2 nd chart): has risen in nine waves. The first five completed as impulsive; whilst the remainder of the four wave rise currently appears corrective, and may be thus far, considered as an irregular B-wave rise. The usual allowable extent of an irregular B-wave rise is a Fibbonacci 1.618 times the length of the A-wave. At around $9800, BTC has reached the maximum extent of an irregular B-wave rise. Barring a wave subdivision and extension, there is now a possibility of a pullback at this juncture; using COINBASE pricing: @8157: 50.0% Fibbonacci retracement from 18-DEC-2019 to 06-FEB-2020 [MIN EXPECTED]
@7750: 61.8% Fibbonacci retracement from 18-DEC-2019 to 06-FEB-2020 [AVG EXPECTED]
@7170: 78.6% Fibbonacci retracement from 18-DEC-2019 to 06-FEB-2020 [MAX EXPECTED]
@6824: 88.6% Fibbonacci retracement from 18-DEC-2019 to 06-FEB-2020 [WARNING]
https://i.imgur.com/DeReCoi.pnghttps://i.imgur.com/UyB5Cxs.pngAnalysis and projections are speculative. BTC price has now exceeded the maximum allowable extent of an irregular B-wave as stated aforementioned. A decline below the low of 04-FEB-2020 is required in order to revert and reconsider the aforementioned irregular B-wave scenario. Subsequently at this stage, the following initial assumptive outlook may be considered...  |
|
|
|
|
exstasie
Legendary
Offline
Activity: 1806
Merit: 1521
|
|
February 09, 2020, 07:35:15 AM |
|
BTC price has now exceeded the maximum allowable extent of an irregular B-wave as stated aforementioned. A decline below the low of 04-FEB-2020 is required in order to revert and reconsider the aforementioned irregular B-wave scenario. Subsequently at this stage, the following initial assumptive outlook may be considered... An incredibly bullish nested count! I agree, it's a good possibility now that the proportions no longer suggest an irregular/expanding correction. Any targets for Minor Wave 3, and/or [iii] of 3? |
|
|
|
|
xxxx123abcxxxx (OP)
|
|
February 09, 2020, 10:41:08 AM |
|
it looks like a correction will occur, thanks to the speculation you gave, may I ask about the condition of altcoin? Will the altseason come, sir? thanks
The rising tide of Bitcoin carries all Altcoins. However, the majority of Altcoins have larger sailing distances to reach the shore of all-time highs... BTC is 'only' required to gain 100% from here to reach its all-time high. LTC is required to gain 370% from here to reach its all-time high. ETH is required to gain 520% from here to reach its all-time high. Technically, BTC is only required to reach, and/or marginally exceed, its all-time high to qualify five rising PRIMARY degree Elliott Waves since inception. At which point, the BTC bull market may complete, with the Altcoins lagging behind. |
|
|
|
|
|
xxxx123abcxxxx (OP)
|
|
February 09, 2020, 10:58:33 AM |
|
A potential Leading Diagonal can be eliminated if price exceeds the 26-OCT-2019 high...  |
|
|
|
|
|
xxxx123abcxxxx (OP)
|
|
February 09, 2020, 11:15:08 AM |
|
An incredibly bullish nested count! I agree, it's a good possibility now that the proportions no longer suggest an irregular/expanding correction. Any targets for Minor Wave 3, and/or [iii] of 3? Typically, the usual minimum expected length of a wave-3, at any degree, is a Fibonacci 1.618 times the length of wave-1. So, using BITSTAMP pricing... @23831: INTERMEDIATE (3) = INTERMEDIATE (1) * 1.618
@12683: MINOR 3 = MINOR 1 * 1.618
@11271: MINUTE [iii] = MINUTE [i] * 1.618
The following speculation may illustrate the minimum expected length of INTERMEDIATE(3), using the parabolic nature of INTERMEDIATE(1) as a projection...  |
|
|
|
|
|
xxxx123abcxxxx (OP)
|
|
February 10, 2020, 07:04:13 AM
Last edit: February 11, 2020, 03:06:43 AM by xxxx123abcxxxx |
|
Two potential scenarios to consider at this juncture... Leading Diagonal (1 st chart) A completed Leading Diagonal rising from the 18-DEC-2019 low to 10-FEB-2020 high... Confirmed if price declines below the 04-FEB-2020 low. Eliminated if price advances beyond the 26-OCT-2019 high. Impulse (2 nd chart) An ongoing Impulse rising from the 18-DEC-2019 low... Confirmed if price advances beyond the 26-OCT-2019 high. Eliminated if price declines below the 04-FEB-2019 low.   |
|
|
|
|
MarquiseMuseum
Member
Offline
Activity: 739
Merit: 29
www.MarquiseMuseum.com
|
|
February 10, 2020, 03:59:49 PM |
|
Its gonna go vertical bro, read my recent thread for fundamental reason.
Prime XBT, give me back my longs.
Disfatti di Varo, Battle of the forest.
|
|
|
|
Typex
Jr. Member
Offline
Activity: 61
Merit: 1
|
|
February 10, 2020, 09:04:14 PM |
|
Impulse (2nd chart)
An ongoing Impulse rising from the 18-DEC-2019 low...
Confirmed if price advances beyond the 26-OCT-2019 low.
Eliminated if price declines below the 04-FEB-2019 high.
Did you mean: Confirmed if price advances beyond the 26-OCT-2019 high. Eliminated if price declines below the 04-FEB- 2020 high. |
|
|
|
|
|
xxxx123abcxxxx (OP)
|
|
February 11, 2020, 03:08:34 AM |
|
Did you mean:
Confirmed if price advances beyond the 26-OCT-2019 high.
Eliminated if price declines below the 04-FEB-2020 high.
Error has been corrected, thank you. |
|
|
|
|
|
xxxx123abcxxxx (OP)
|
|
February 13, 2020, 01:30:20 PM |
|
Two potential scenarios to consider at this juncture... Leading Diagonal (1 st chart) A completed Leading Diagonal rising from the 18-DEC-2019 low to 10-FEB-2020 high... Confirmed if price declines below the 04-FEB-2020 low. Eliminated if price advances beyond the 26-OCT-2019 high. Impulse (2 nd chart) An ongoing Impulse rising from the 18-DEC-2019 low... Confirmed if price advances beyond the 26-OCT-2019 high. Eliminated if price declines below the 04-FEB-2019 low. https://i.imgur.com/R32NwEZ.png https://i.imgur.com/NPDIDZ3.pngLeading Diagonal scenario eliminated. GBTC (1 st chart): two Impulsive scenarios, Standard vs Extended. BTC (2 nd chart): one Impulsive scenario, Standard.   |
|
|
|
|
Bbirdy
Newbie
Offline
Activity: 16
Merit: 2
|
Hello xxxx123abcxxxx,
I've recently become interested in Elliot analysis, I'm a beginner in this field, I discovered you through the comments you left on the analysis of the late Tony Caldaro's SP500.
So it is through you that I discovered this site dedicated to cryptomoney and that I am following your very relevant analyses which are very useful to me in my learning of the Elliott Wave.
Given my low level of English I use Deepl translator, so there may be some slight problems !
Have a nice day and thank you for your analyses.
|
|
|
|
|
|
xxxx123abcxxxx (OP)
|
|
February 18, 2020, 09:43:49 PM
Last edit: February 18, 2020, 10:05:13 PM by xxxx123abcxxxx |
|
Hello xxxx123abcxxxx,
I've recently become interested in Elliot analysis, I'm a beginner in this field, I discovered you through the comments you left on the analysis of the late Tony Caldaro's SP500.
So it is through you that I discovered this site dedicated to cryptomoney and that I am following your very relevant analyses which are very useful to me in my learning of the Elliott Wave.
Given my low level of English I use Deepl translator, so there may be some slight problems !
Have a nice day and thank you for your analyses.
Thank you for your message. The analysis is purely speculation sometimes it works, sometimes it doesn't! Here are two ebooks you may find useful in learning the Elliott Wave principle... Elliott Wave Principle: Key To Market Behavior Hardcover
by A.J. Frost, Robert R. Prechter https://gofile.io/?c=kNqpcI (78MB) Bloomberg Visual Guide to Elliott Wave Trading
by Wayne Gorman, Jeffrey Kennedy https://gofile.io/?c=kIBATD (34MB) |
|
|
|
|
|
|
exstasie
Legendary
Offline
Activity: 1806
Merit: 1521
|
|
February 19, 2020, 08:10:19 AM |
|
Interesting. I'm not loving the internal proportions of [iii] but it's certainly possible. Frankly, all the counts I'm looking at are questionable for some reason or other. This sort of powerful, sub-dividing wave (at the minor degree) is inherently difficult to count until it's very clearly over. Thanks for the chart. |
|
|
|
|
xxxx123abcxxxx (OP)
|
|
February 19, 2020, 02:32:35 PM |
|
Interesting. I'm not loving the internal proportions of [iii] but it's certainly possible. Frankly, all the counts I'm looking at are questionable for some reason or other.
This sort of powerful, sub-dividing wave (at the minor degree) is inherently difficult to count until it's very clearly over.
Thanks for the chart.
Yes, its an interesting setup for the internal proportions of MINUTE [iii] wave. MINUTE [i ] is longer than MINUTE [iii] wave. And so since MINUTE [iii] cannot be the shortest wave of the set, the final MINUTE [v] wave (which ought to be currently underway) is limited to a maximum upside of 11756 (BITSTAMP). So if price exceeds 11756 (BITSTAMP), then its likely MINUTE [iii] is extending and subdividing. |
|
|
|
|
|
|
|
criza
|
|
February 24, 2020, 11:06:46 AM |
|
Interesting. I'm not loving the internal proportions of [iii] but it's certainly possible. Frankly, all the counts I'm looking at are questionable for some reason or other. This sort of powerful, sub-dividing wave (at the minor degree) is inherently difficult to count until it's very clearly over. Thanks for the chart. We can't really limit the factors that affects the overall standing or state of Bitcoin because, in general, the possible causes of the rise and fall of a crypto currency is unlimited whether it is an internal factors or external such as the demand for the coin or basically the law of supply and demand and many more. We could only make our best guess from the number of data charts in the movement in its price. Also, for me, as the halving event is coming closer day by day the possible events that will happen narrows tightly unto the demand for Bitcoin to be massive and so is its price. |
|
|
|
|
xxxx123abcxxxx (OP)
|
|
February 24, 2020, 01:44:12 PM |
|
BTC (1 st chart): scenario considered if price advances above 19-FEB-2020 high. GBTC (2 nd/3 rd chart): scenario considered if price declines below 19-FEB-2020 low.   
|
|
|
|
|
CookieFactory
Member
Offline
Activity: 118
Merit: 19
|
|
February 29, 2020, 07:50:08 PM |
|
Ive read your two EW threads and while I started as a skeptic, Ive gotten a lot of useful info from your posts over the years. Keep up the good work!
|
|
|
|
|
|
xxxx123abcxxxx (OP)
|
|
March 01, 2020, 12:18:30 AM |
|
Ive read your two EW threads and while I started as a skeptic, Ive gotten a lot of useful info from your posts over the years. Keep up the good work!
Appreciated, thank you. Always best to keep an open mind. Elliott Wave is highly subjective; and depending on interpretation, the probable outcomes are often a best guess. But combined with disciplined account management, it is possible to develop an edge. Shall endeavor to create a new thread if Bitcoin can find support around 8000, and then resume the bull market. Until then, personal interest wanes. |
|
|
|
|
MarquiseMuseum
Member
Offline
Activity: 739
Merit: 29
www.MarquiseMuseum.com
|
|
March 05, 2020, 12:05:50 PM
Last edit: March 09, 2020, 07:55:50 AM by MarquiseMuseum |
|
*outdated prediction removed*
Update March 8:
Margin reward on primexbt will be removed april 1st when promo campaign ends. For this reason, the above price projection is no longer valid.
I believe all 3 of these had their decade and that competition catched up and will surpass it. Don't leverage these outdated instruments, research more up to date alternatives and invest moderately in those.
Don't become a late bagholder to early adopters with leveraged loss. It's similar to investing heavily in 56k modems at the cusp of fiber revolution.
|
|
|
|
|
|
bathrobehero
Legendary
Offline
Activity: 2002
Merit: 1051
ICO? Not even once.
|
|
March 13, 2020, 02:43:02 AM |
|
Really, a log scale for EW is a thing? WTH |
Not your keys, not your coins!
|
|
|
exstasie
Legendary
Offline
Activity: 1806
Merit: 1521
|
|
March 13, 2020, 10:09:46 AM |
|
Sub $1000 target...
 What do you think about this triangle idea? Easily invalidated by a break below the 2018 bottom. The proportions seem good, and we're seeing a potential V-bottom off the 200-week MA, similar to January 2015. Based on the 2015 and 2018 reactions to said MA I'd like to see how the weekly candle closes. Really, a log scale for EW is a thing? WTH
Why not? |
|
|
|
|
xxxx123abcxxxx (OP)
|
|
March 14, 2020, 07:24:41 AM
Last edit: March 14, 2020, 10:29:53 AM by xxxx123abcxxxx |
|
What do you think about this triangle idea? Easily invalidated by a break below the 2018 bottom. The proportions seem good, and we're seeing a potential V-bottom off the 200-week MA, similar to January 2015. Based on the 2015 and 2018 reactions to said MA I'd like to see how the weekly candle closes. A wave-4 Triangle of such a degree does not alternate with any prior wave-2 in regards to both magnitudes of price and time. |
|
|
|
|
|
xxxx123abcxxxx (OP)
|
|
March 14, 2020, 07:38:13 AM
Last edit: March 14, 2020, 01:34:40 PM by xxxx123abcxxxx |
|
Personal preference is the first scenario below. The first two scenarios suggest price is set to decline below the 15-DEC-2018 low
[1st chart]: The 11-year secular Bitcoin bull market ended in five PRIMARY degree waves at the 26-JUN-2019 high, where the fifth and final wave, i.e. PRIMARY[5] truncated as a failure; completing a CYCLE. Now a secular CYCLE degree bear market is underway, where price is set to decline below the 30-NOV-2013 high. Scenario eliminated if price advances above the 13-FEB-2020 high.[2nd chart]: PRIMARY[4] decline is ongoing, and PRIMARY[5] is yet to commence. PRIMARY[4] is currently progressing in its final INTERMEDIATE(C) wave down, set to complete anywhere above the 30-NOV-2013 high. Scenario eliminated if price overlaps the 30-NOV-2013 high.[3rd chart]: INTEREMDIATE(3) of PRIMARY[5] wave, is yet to imminently commence. Scenario eliminated if price declines below the 06-FEB-2019 low.
https://12345abcdewxy.wordpress.com/
   |
|
|
|
|
exstasie
Legendary
Offline
Activity: 1806
Merit: 1521
|
|
March 14, 2020, 12:13:31 PM |
|
What do you think about this triangle idea? Easily invalidated by a break below the 2018 bottom. The proportions seem good, and we're seeing a potential V-bottom off the 200-week MA, similar to January 2015. Based on the 2015 and 2018 reactions to said MA I'd like to see how the weekly candle closes. A wave-4 Triangle of such a degree does not alternate with a prior wave-2 in regards to both magnitudes of price and time. Could you be more specific? What specific rules or guidelines are being broken? Wave II is a zig zag, Wave IV is a triangle. The proportions may not be ideal, but the only rule I'm aware of is: Although Wave 4 has no minimum time constraint, the maximum time for Wave 4 is twice the time taken by Wave 3. |
|
|
|
|
xxxx123abcxxxx (OP)
|
|
March 14, 2020, 03:20:58 PM
Last edit: March 14, 2020, 04:03:26 PM by xxxx123abcxxxx |
|
What do you think about this triangle idea? Easily invalidated by a break below the 2018 bottom. The proportions seem good, and we're seeing a potential V-bottom off the 200-week MA, similar to January 2015. Based on the 2015 and 2018 reactions to said MA I'd like to see how the weekly candle closes. A wave-4 Triangle of such a degree does not alternate with a prior wave-2 in regards to both magnitudes of price and time. Could you be more specific? What specific rules or guidelines are being broken? Wave II is a zig zag, Wave IV is a triangle. The proportions may not be ideal, but the only rule I'm aware of is: Although Wave 4 has no minimum time constraint, the maximum time for Wave 4 is twice the time taken by Wave 3. It appears you may be suggesting that 2018-present is an ongoing wave-4 Triangle, which is alternating with a wave-2 from 2011. Personally believe this to be incorrect since the suggested wave-2 is of a lower degree with differing price, time and momentum characteristics. Typical momentum indicators, such as the RSI, are measures of magnitude in regards to recent price changes within a defined time period, to evaluate overbought or oversold conditions. Elliott Waves of equivalent degree ought to exhibit similar momentum conditions... 
https://12345abcdewxy.wordpress.com/
|
|
|
|
|
exstasie
Legendary
Offline
Activity: 1806
Merit: 1521
|
|
March 14, 2020, 08:30:50 PM
Last edit: March 15, 2020, 09:32:12 AM by exstasie |
|
It appears you may be suggesting that 2018-present is an ongoing wave-4 Triangle, which is alternating with a wave-2 from 2011.
Personally believe this to be incorrect since the suggested wave-2 is of a lower degree with differing price, time and momentum characteristics.
Typical momentum indicators, such as the RSI, are measures of magnitude in regards to recent price changes within a defined time period, to evaluate overbought or oversold conditions. Elliott Waves of equivalent degree ought to exhibit similar momentum conditions...
We'll have to agree to disagree on this one. By time and price, the count is valid. I've gone through all rules and guidelines multiple times and there is nothing wrong there. As for momentum and degree, the proper method (if there is one) would be the Elliott Wave oscillator or similar measure of absolute difference. We don't have enough data to plot 2011 at the monthly time frame but EWO appears to support the referenced count (as well as your count):  It doesn't seem appropriate to apply a relative oscillator, especially at the weekly level, to determine degree on a decade long chart. It looks like you're just pointing out weekly overbought and oversold extremes. None of this is mandatory by Elliott Wave rules anyway, though I see where you're coming from. Anyway, I appreciate your opinion, to each his own. I thought it was an alternative worth keeping in mind before assuming sub-$1K prices. If the triangle wave (a) is breached, it's obviously easy to rule out. Cheers. |
|
|
|
|
|
Afrikoin
Legendary
Offline
Activity: 1540
Merit: 1003
alan watts is all you need
|
|
April 30, 2020, 08:45:27 PM |
|
Wave C broken down into 5 counts
this move will top and go back down
so im going with your 2nd chart
|
▄▄▄██████▄▄▄
▄██████████████████▄
▄████████████████████████▄
▄▄ ▄████████████████████████████▄
███████████████████████████████████▄
▀▀█████████████████████████████████▄
██████████████████████████████████
██████████████████████████████████
██████████████████████████████████
██████████████████████████████████
▀████████████████████████████████▀
▀██████████████████████████████▀
▀▀██████████████████████████▀
▀██████████████████████▀
▀▀▀████████████▀▀▀ | .
| .....█
.....█
.....█
.....█
.....█
.....█ | | █
█
█
█
█
█ |
|
|
|
JL0
Full Member
Offline
Activity: 817
Merit: 158
Bitcoin the Digital Gold
|
|
April 30, 2020, 09:03:28 PM |
|
Wave C broken down into 5 counts
this move will top and go back down
so im going with your 2nd chart
Whic Chart you mean? |
|
|
|
|
Afrikoin
Legendary
Offline
Activity: 1540
Merit: 1003
alan watts is all you need
|
|
May 10, 2020, 07:35:20 AM |
|
Wave C broken down into 5 counts
this move will top and go back down
so im going with your 2nd chart
Whic Chart you mean? this one |
▄▄▄██████▄▄▄
▄██████████████████▄
▄████████████████████████▄
▄▄ ▄████████████████████████████▄
███████████████████████████████████▄
▀▀█████████████████████████████████▄
██████████████████████████████████
██████████████████████████████████
██████████████████████████████████
██████████████████████████████████
▀████████████████████████████████▀
▀██████████████████████████████▀
▀▀██████████████████████████▀
▀██████████████████████▀
▀▀▀████████████▀▀▀ | .
| .....█
.....█
.....█
.....█
.....█
.....█ | | █
█
█
█
█
█ |
|
|
|
Afrikoin
Legendary
Offline
Activity: 1540
Merit: 1003
alan watts is all you need
|
|
May 10, 2020, 07:44:02 AM |
|
from twitter the big debate now is whether this was a C wave ie a C wave with 5 subwaves topping off OR it has been a 5 wave move up from the last low One means we have to wait longer for a bull run the other means, a correction to follow before a higher order 5 wave fractal   |
▄▄▄██████▄▄▄
▄██████████████████▄
▄████████████████████████▄
▄▄ ▄████████████████████████████▄
███████████████████████████████████▄
▀▀█████████████████████████████████▄
██████████████████████████████████
██████████████████████████████████
██████████████████████████████████
██████████████████████████████████
▀████████████████████████████████▀
▀██████████████████████████████▀
▀▀██████████████████████████▀
▀██████████████████████▀
▀▀▀████████████▀▀▀ | .
| .....█
.....█
.....█
.....█
.....█
.....█ | | █
█
█
█
█
█ |
|
|
|
Afrikoin
Legendary
Offline
Activity: 1540
Merit: 1003
alan watts is all you need
|
|
May 10, 2020, 07:51:22 AM |
|
Before i suspected a top based on these trendlines, wo we are i a decisive territory   |
▄▄▄██████▄▄▄
▄██████████████████▄
▄████████████████████████▄
▄▄ ▄████████████████████████████▄
███████████████████████████████████▄
▀▀█████████████████████████████████▄
██████████████████████████████████
██████████████████████████████████
██████████████████████████████████
██████████████████████████████████
▀████████████████████████████████▀
▀██████████████████████████████▀
▀▀██████████████████████████▀
▀██████████████████████▀
▀▀▀████████████▀▀▀ | .
| .....█
.....█
.....█
.....█
.....█
.....█ | | █
█
█
█
█
█ |
|
|
|
|
|
exstasie
Legendary
Offline
Activity: 1806
Merit: 1521
|
|
May 11, 2020, 07:22:13 AM |
|
So we might be in the early stages of a bubble, but if the market breaks below $7,466 then we're going to the $700s? Quite a binary situation! I'm still watching this triangle scenario. With wave (d) possibly complete now, $5,500-$7K could be next for wave (e). |
|
|
|
Afrikoin
Legendary
Offline
Activity: 1540
Merit: 1003
alan watts is all you need
|
|
May 11, 2020, 08:46:48 AM |
|
So we might be in the early stages of a bubble, but if the market breaks below $7,466 then we're going to the $700s? Quite a binary situation! I'm still watching this triangle scenario. With wave (d) possibly complete now, $5,500-$7K could be next for wave (e). The more options the better. I don't like the binary split, and the $1200 - $700 scenario looks too grim. It would not leave enough time to capitulate and recover back to $9k. I feel will are much closer to a bull run, maybe 6 - 12 months out. |
▄▄▄██████▄▄▄
▄██████████████████▄
▄████████████████████████▄
▄▄ ▄████████████████████████████▄
███████████████████████████████████▄
▀▀█████████████████████████████████▄
██████████████████████████████████
██████████████████████████████████
██████████████████████████████████
██████████████████████████████████
▀████████████████████████████████▀
▀██████████████████████████████▀
▀▀██████████████████████████▀
▀██████████████████████▀
▀▀▀████████████▀▀▀ | .
| .....█
.....█
.....█
.....█
.....█
.....█ | | █
█
█
█
█
█ |
|
|
|
Afrikoin
Legendary
Offline
Activity: 1540
Merit: 1003
alan watts is all you need
|
|
May 13, 2020, 04:28:46 PM |
|
So we might be in the early stages of a bubble, but if the market breaks below $7,466 then we're going to the $700s? Quite a binary situation! I'm still watching this triangle scenario. With wave (d) possibly complete now, $5,500-$7K could be next for wave (e). One more leg up it seems to complete you d Been looking at it closely and I think there is at least a 30% chance it is one of the outcomes Each of the waves (a, b, c and now d) look like 3 wave structures (a-b-c) The coming weeks will tell us more. OP I love your thread! I lurk here way too often and I appreciate you putting your thoughts out for the public. Thank you! PS: THIS CHART IS NOT AN INDICATOR OF TIME, ONLY DIRECTION.  |
▄▄▄██████▄▄▄
▄██████████████████▄
▄████████████████████████▄
▄▄ ▄████████████████████████████▄
███████████████████████████████████▄
▀▀█████████████████████████████████▄
██████████████████████████████████
██████████████████████████████████
██████████████████████████████████
██████████████████████████████████
▀████████████████████████████████▀
▀██████████████████████████████▀
▀▀██████████████████████████▀
▀██████████████████████▀
▀▀▀████████████▀▀▀ | .
| .....█
.....█
.....█
.....█
.....█
.....█ | | █
█
█
█
█
█ |
|
|
|
exstasie
Legendary
Offline
Activity: 1806
Merit: 1521
|
|
May 14, 2020, 02:53:55 AM |
|
So we might be in the early stages of a bubble, but if the market breaks below $7,466 then we're going to the $700s? Quite a binary situation! I'm still watching this triangle scenario. With wave (d) possibly complete now, $5,500-$7K could be next for wave (e). One more leg up it seems to complete you d Been looking at it closely and I think there is at least a 30% chance it is one of the outcomes Each of the waves (a, b, c and now d) look like 3 wave structures (a-b-c) The coming weeks will tell us more. Certainly possible. I'll admit bulls look resilient with the strong (if low volume) recovery off $8,100. The internals of (d) are not totally clear to me yet. One preliminary count still puts us in a lower degree C wave. We could be in iv or v:  The danger here is a failed fifth wave, considering that iv already passed the 0.5 retracement level. I have been speculating about a wick towards the $11K area for some time though. If the above count is correct then we could wick to (or through) $10.5K and complete the yellow scenario outlined here: In Elliott Wave theory, triangle bounds are not formed by existing trend lines (like the one extending from $19,666). The bounds are formed by the A-C and B-D lines. Assuming the $10,074 high completed Wave D, then the aqua converging lines shown here are now the basis for our triangle:  |
|
|
|
|
xxxx123abcxxxx (OP)
|
|
May 15, 2020, 07:04:25 AM |
|
So we might be in the early stages of a bubble, but if the market breaks below $7,466 then we're going to the $700s? Quite a binary situation! I'm still watching this triangle scenario. With wave (d) possibly complete now, $5,500-$7K could be next for wave (e). One more leg up it seems to complete you d Been looking at it closely and I think there is at least a 30% chance it is one of the outcomes Each of the waves (a, b, c and now d) look like 3 wave structures (a-b-c) The coming weeks will tell us more. OP I love your thread! I lurk here way too often and I appreciate you putting your thoughts out for the public. Thank you! PS: THIS CHART IS NOT AN INDICATOR OF TIME, ONLY DIRECTION. https://i.imgur.com/QrycNdk.jpgThank you, appreciate the comment. Not given the time to post often this year. Analysis is guesswork at best! |
|
|
|
|
|
|
|
|
|
Paycoinzzz
|
|
May 21, 2020, 07:19:25 AM |
|
The intention of this thread is to speculatively forecast the price of Bitcoin via subjectively using the Elliott Wave principle. Analysis is purely guesswork with an endeavour to provide sporadic fortnightly updates. Previous thread: 2018 Cryptocurrency Crash (Elliott Wave) in fact it is also true of the Dow theory. Anything that grows too fast will fall down quickly. It takes place anywhere in your life. The internet has also once dominated the stock market for a time when businesses were overpriced. But when the bubble burst, everything was reset. so do not invest in things that have been fomo too much, the risk is very high while the profit is very low. |
|
|
|
|
exstasie
Legendary
Offline
Activity: 1806
Merit: 1521
|
|
May 21, 2020, 10:43:21 PM |
|
Dipping into the $8,000s but the bull scenario appears to be still alive, just barely. Here's a look at that trend line:  Place your bets, gentlemen! Failure here will likely imply a trip to the $5,000s though I'd like to see $8,100 break as a final confirmation of a strong downtrend. |
|
|
|
|
|
|
muf18
|
|
May 24, 2020, 02:26:18 PM |
|
The intention of this thread is to speculatively forecast the price of Bitcoin via subjectively using the Elliott Wave principle. Analysis is purely guesswork with an endeavour to provide sporadic fortnightly updates. Previous thread: 2018 Cryptocurrency Crash (Elliott Wave) in fact it is also true of the Dow theory. Anything that grows too fast will fall down quickly. It takes place anywhere in your life. The internet has also once dominated the stock market for a time when businesses were overpriced. But when the bubble burst, everything was reset. so do not invest in things that have been fomo too much, the risk is very high while the profit is very low. Actually after 20 years - Internet and tech ones again dominate the world. |
|
|
|
|
Afrikoin
Legendary
Offline
Activity: 1540
Merit: 1003
alan watts is all you need
|
|
May 30, 2020, 04:51:33 AM
Last edit: May 30, 2020, 05:03:11 AM by Afrikoin |
|
So we might be in the early stages of a bubble, but if the market breaks below $7,466 then we're going to the $700s? Quite a binary situation! I'm still watching this triangle scenario. With wave (d) possibly complete now, $5,500-$7K could be next for wave (e). One more leg up it seems to complete you d Been looking at it closely and I think there is at least a 30% chance it is one of the outcomes Each of the waves (a, b, c and now d) look like 3 wave structures (a-b-c) The coming weeks will tell us more. OP I love your thread! I lurk here way too often and I appreciate you putting your thoughts out for the public. Thank you! PS: THIS CHART IS NOT AN INDICATOR OF TIME, ONLY DIRECTION.
2. Into a pattern
3. At a place of resistance
4. Next is a break out
5. Question is what direction in
a the short term
b the medium term
 a  b  |
▄▄▄██████▄▄▄
▄██████████████████▄
▄████████████████████████▄
▄▄ ▄████████████████████████████▄
███████████████████████████████████▄
▀▀█████████████████████████████████▄
██████████████████████████████████
██████████████████████████████████
██████████████████████████████████
██████████████████████████████████
▀████████████████████████████████▀
▀██████████████████████████████▀
▀▀██████████████████████████▀
▀██████████████████████▀
▀▀▀████████████▀▀▀ | .
| .....█
.....█
.....█
.....█
.....█
.....█ | | █
█
█
█
█
█ |
|
|
|
|
xxxx123abcxxxx (OP)
|
|
May 30, 2020, 09:13:42 PM
Last edit: May 31, 2020, 12:01:42 AM by xxxx123abcxxxx |
|
|
|
|
|
|
exstasie
Legendary
Offline
Activity: 1806
Merit: 1521
|
|
May 30, 2020, 10:24:42 PM |
|
Goodness, that would be an epic troll and would confuse the hell out of the market. I've been keeping a head fake through $10.5K in mind for quite a while now. A short-lived wick into the $11,000s (the yellow squiggle) was the original trajectory for this idea: However there is a possible impulsive interpretation here. Two possibilities I see:  A push to the $11,000s or $12,000s would likely suggest a higher degree Wave 1 to me. In that case I'm looking for a 0.382-0.618 retracement for Wave 2 and then a continued bull market. Thanks for the updates as always. |
|
|
|
|
xxxx123abcxxxx (OP)
|
|
May 30, 2020, 11:55:32 PM |
|
https://i.imgur.com/CiOlOtz.png Goodness, that would be an epic troll and would confuse the hell out of the market. I've been keeping a head fake through $10.5K in mind for quite a while now. A short-lived wick into the $11,000s (the yellow squiggle) was the original trajectory for this idea: https://i.imgur.com/zgABnbJ.png However there is a possible impulsive interpretation here. Two possibilities I see: https://i.imgur.com/Jp1prF6.png A push to the $11,000s or $12,000s would likely suggest a higher degree Wave 1 to me. In that case I'm looking for a 0.382-0.618 retracement for Wave 2 and then a continued bull market. Thanks for the updates as always. Yes, it would be quite a tricky market to fool both bulls & bears alike if this scenario manifests. Currently not seeing the rise from the 13-MAR-2020 low to present as impulsive, yet. So, either this rise is all of wave-X heading to >10,500 but <14,000, or it may subdivide as a three legged A-B-C affair as illustrated. |
|
|
|
|
Walt Dyer
Jr. Member
Offline
Activity: 55
Merit: 12
|
|
June 21, 2020, 09:24:51 PM |
|
xxxx123abcxxxx - And in the more medium-term version, as you see the waves, please tell me. Now the volume is low and it's not quite clear.
|
|
|
|
|
|
xxxx123abcxxxx (OP)
|
|
June 27, 2020, 03:31:04 PM |
|
xxxx123abcxxxx - And in the more medium-term version, as you see the waves, please tell me. Now the volume is low and it's not quite clear.
Guessing the following at the moment...   |
|
|
|
|
Walt Dyer
Jr. Member
Offline
Activity: 55
Merit: 12
|
|
June 29, 2020, 02:02:02 PM |
|
xxxx123abcxxxx - And in the more medium-term version, as you see the waves, please tell me. Now the volume is low and it's not quite clear.
Guessing the following at the moment... Thank you, Master ! |
|
|
|
|
|
|
Bbirdy
Newbie
Offline
Activity: 16
Merit: 2
|
|
August 09, 2020, 07:04:08 AM |
|
Hello
Is it possible according to the Elliott rules that the [X] rise exceeds the top of Primary [5]?
Thank you very much for your help.
|
|
|
|
|
exstasie
Legendary
Offline
Activity: 1806
Merit: 1521
|
|
August 09, 2020, 11:08:27 AM |
|
Hello
Is it possible according to the Elliott rules that the [X] rise exceeds the top of Primary [5]?
Thank you very much for your help.
I believe that would invalidate the count as drawn, since it's a double zig zag. One of the hard rules for double and triple zig zags is: Wave X must be smaller than Wave W by price. http://www.wavemagician.com/rules.htmIf BTC breaks above the June 2019 high, multiple bearish counts will be broken. |
|
|
|
Bbirdy
Newbie
Offline
Activity: 16
Merit: 2
|
|
August 12, 2020, 06:54:19 AM |
|
Thank you extasie
|
|
|
|
|
Afrikoin
Legendary
Offline
Activity: 1540
Merit: 1003
alan watts is all you need
|
|
September 09, 2020, 06:00:03 AM |
|
LOOKs like this chart is back in play with the top at D So we might be in the early stages of a bubble, but if the market breaks below $7,466 then we're going to the $700s? Quite a binary situation! I'm still watching this triangle scenario. With wave (d) possibly complete now, $5,500-$7K could be next for wave (e). One more leg up it seems to complete you d Been looking at it closely and I think there is at least a 30% chance it is one of the outcomes Each of the waves (a, b, c and now d) look like 3 wave structures (a-b-c) The coming weeks will tell us more. OP I love your thread! I lurk here way too often and I appreciate you putting your thoughts out for the public. Thank you! PS: THIS CHART IS NOT AN INDICATOR OF TIME, ONLY DIRECTION. |
▄▄▄██████▄▄▄
▄██████████████████▄
▄████████████████████████▄
▄▄ ▄████████████████████████████▄
███████████████████████████████████▄
▀▀█████████████████████████████████▄
██████████████████████████████████
██████████████████████████████████
██████████████████████████████████
██████████████████████████████████
▀████████████████████████████████▀
▀██████████████████████████████▀
▀▀██████████████████████████▀
▀██████████████████████▀
▀▀▀████████████▀▀▀ | .
| .....█
.....█
.....█
.....█
.....█
.....█ | | █
█
█
█
█
█ |
|
|
|
exstasie
Legendary
Offline
Activity: 1806
Merit: 1521
|
|
September 09, 2020, 08:35:05 PM |
|
LOOKs like this chart is back in play with the top at D So we might be in the early stages of a bubble, but if the market breaks below $7,466 then we're going to the $700s? Quite a binary situation! I'm still watching this triangle scenario. With wave (d) possibly complete now, $5,500-$7K could be next for wave (e). One more leg up it seems to complete you d Been looking at it closely and I think there is at least a 30% chance it is one of the outcomes It's definitely still in play, but how likely it is I'm still not sure. I believe the March-August rally can be counted impulsively. A reversal in the $12,000s could easily imply the start of a Wave 2 pullback, just as much as it could imply the start of a Wave E in our multi-year triangle. We'll have to play it by ear! |
|
|
|
|
|
JL0
Full Member
Offline
Activity: 817
Merit: 158
Bitcoin the Digital Gold
|
|
November 07, 2020, 03:46:41 PM |
|
Can you explain it please ? What do you mean by that or what do you want to tell us?
|
|
|
|
|
exstasie
Legendary
Offline
Activity: 1806
Merit: 1521
|
Can you explain it please ? What do you mean by that or what do you want to tell us?
It's an ultra bullish EW count. At a bird's eye view, it puts us in Historic Wave 5, same as Masterluc's count. At the lower degree, he shows a nested wave count, indicated by the "(1)-(2), 1-2, (i)-(ii)" progression. Not only are Wave 3s already very powerful, but this indicates an extended Wave (3) with an expectation of further sub-dividing waves. If the count is correct, then this will result in an even more powerful upside move. We're talking about another bubble. Potential nested counts are tricky though. They are very......binary.....in their outcomes. The count will be confirmed once we see an obvious Wave 3 towards the previous ATH. If we don't see that happen relatively soon, then the impulsive count starts to look invalid and we're probably likely looking at another pattern entirely. |
|
|
|
JL0
Full Member
Offline
Activity: 817
Merit: 158
Bitcoin the Digital Gold
|
|
November 07, 2020, 11:04:31 PM |
|
Can you explain it please ? What do you mean by that or what do you want to tell us?
It's an ultra bullish EW count. At a bird's eye view, it puts us in Historic Wave 5, same as Masterluc's count. At the lower degree, he shows a nested wave count, indicated by the "(1)-(2), 1-2, (i)-(ii)" progression. Not only are Wave 3s already very powerful, but this indicates an extended Wave (3) with an expectation of further sub-dividing waves. If the count is correct, then this will result in an even more powerful upside move. We're talking about another bubble. Potential nested counts are tricky though. They are very......binary.....in their outcomes. The count will be confirmed once we see an obvious Wave 3 towards the previous ATH. If we don't see that happen relatively soon, then the impulsive count starts to look invalid and we're probably likely looking at another pattern entirely. Thank you for that  |
|
|
|
|
dragonvslinux
Legendary
Offline
Activity: 1666
Merit: 2204
Crypto Swap Exchange
|
|
November 09, 2020, 08:35:44 PM
Last edit: September 10, 2023, 01:28:43 PM by dragonvslinux |
|
LOOKs like this chart is back in play with the top at D So we might be in the early stages of a bubble, but if the market breaks below $7,466 then we're going to the $700s? Quite a binary situation! I'm still watching this triangle scenario. With wave (d) possibly complete now, $5,500-$7K could be next for wave (e). One more leg up it seems to complete you d Been looking at it closely and I think there is at least a 30% chance it is one of the outcomes Each of the waves (a, b, c and now d) look like 3 wave structures (a-b-c) The coming weeks will tell us more. OP I love your thread! I lurk here way too often and I appreciate you putting your thoughts out for the public. Thank you! PS: THIS CHART IS NOT AN INDICATOR OF TIME, ONLY DIRECTION. 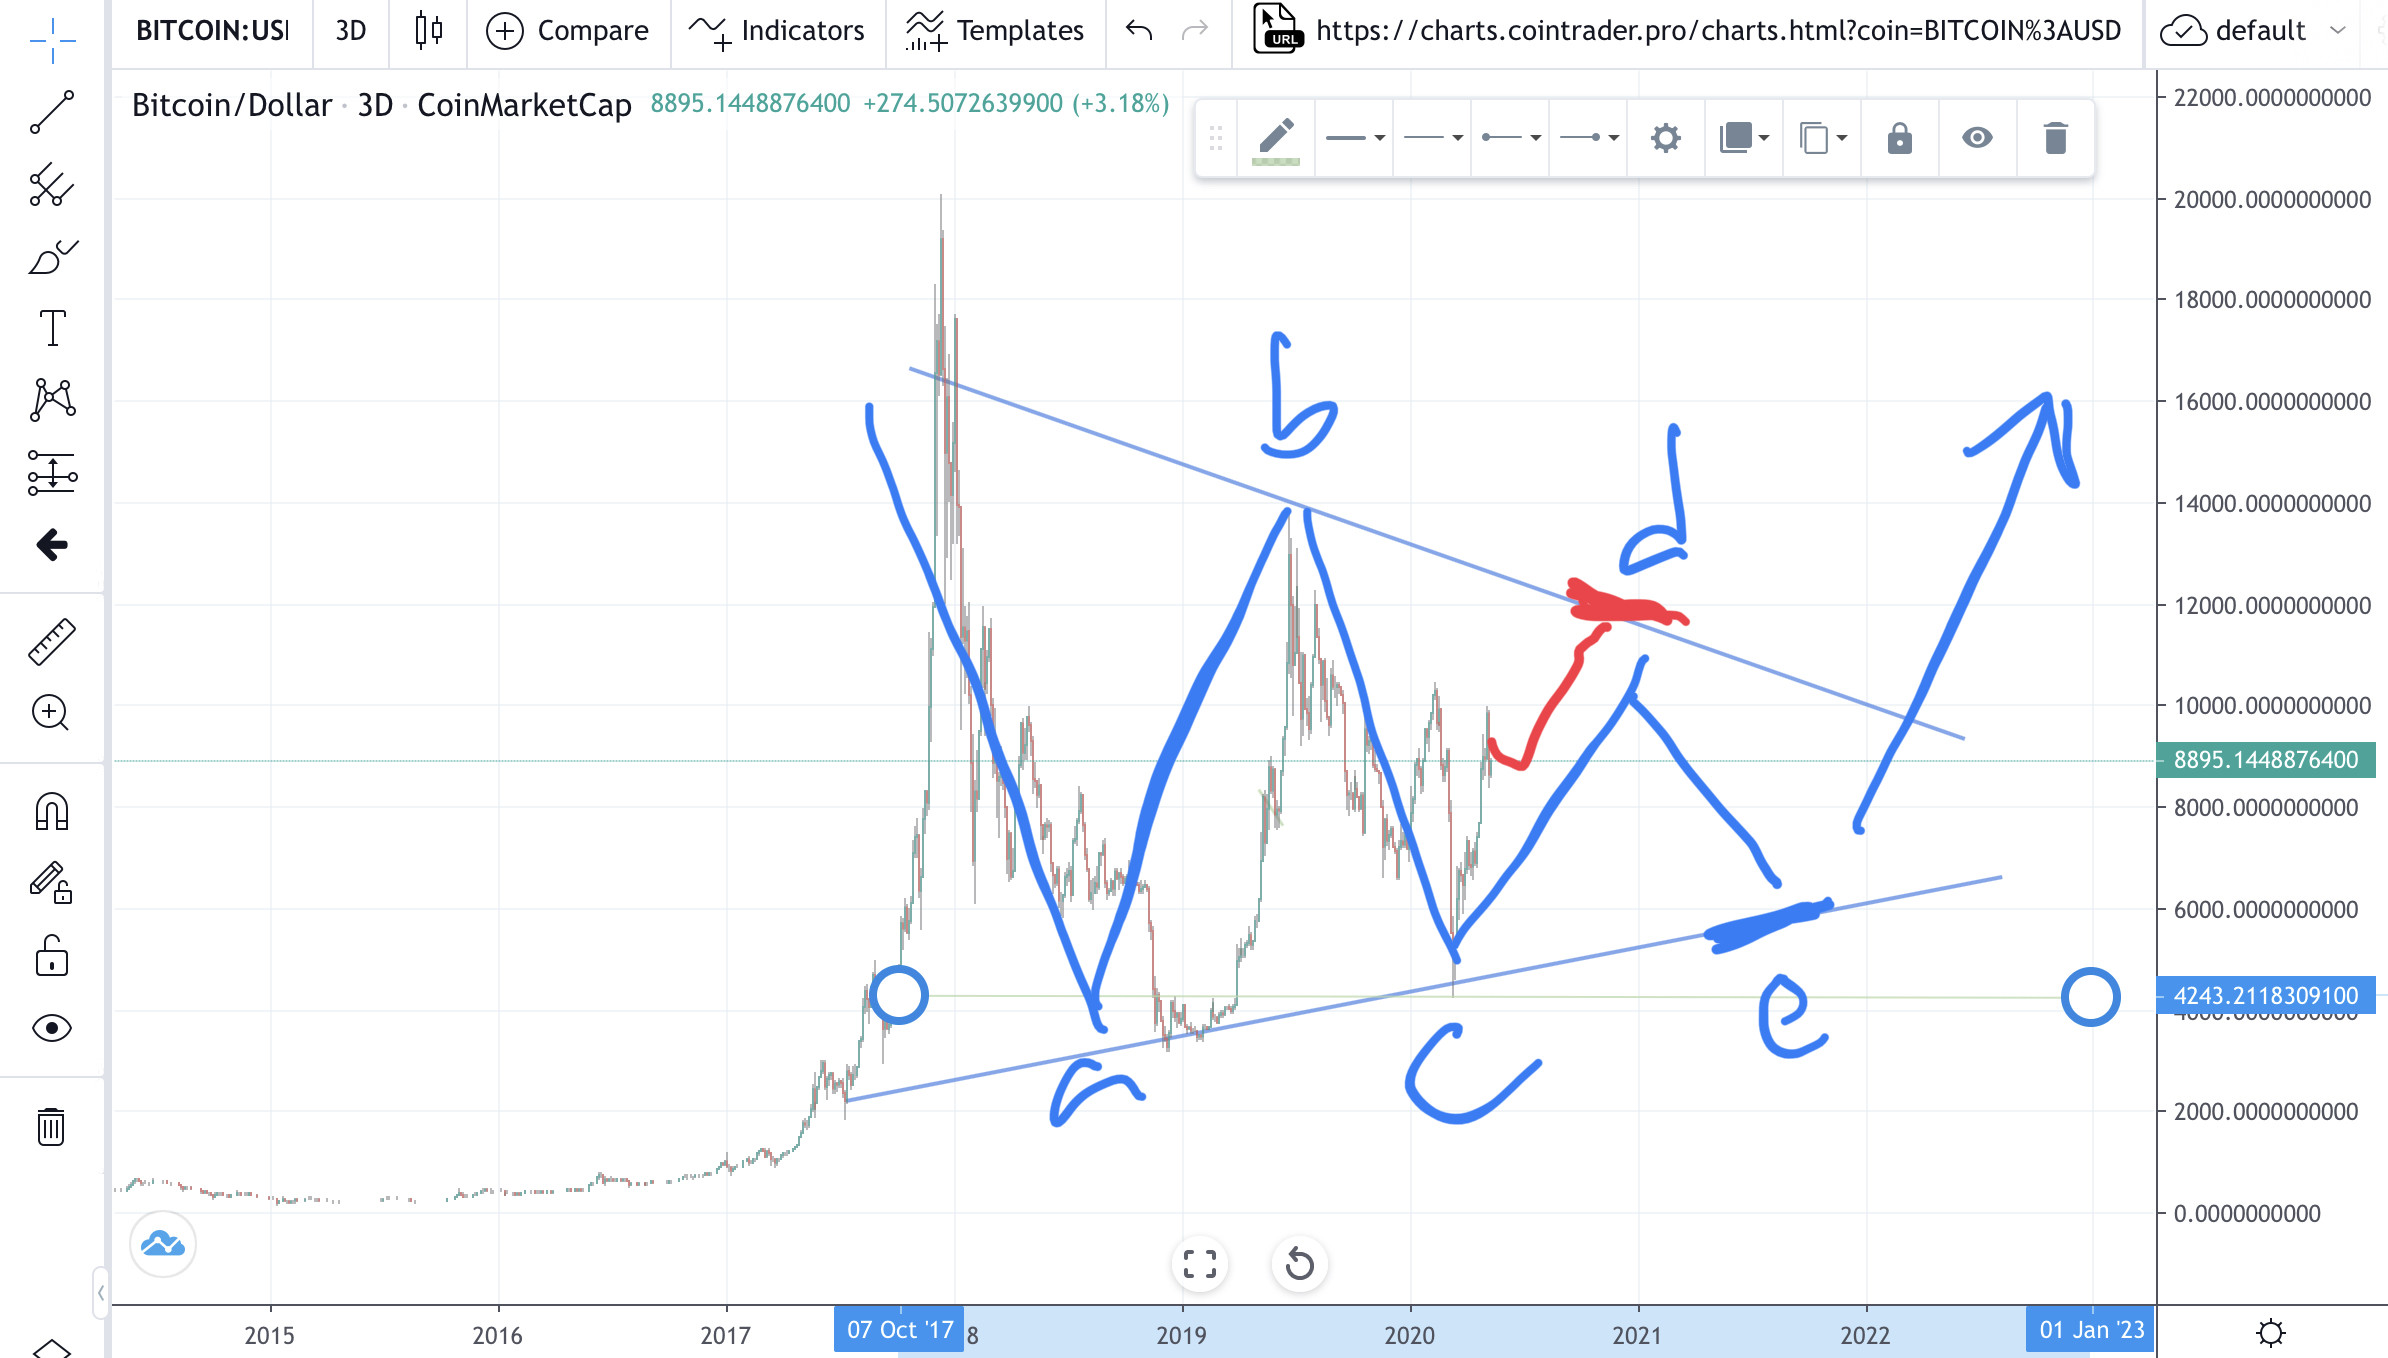 This looks like a crazy thought, given lots of other metrics, but none the less completely possible it seems... |
|
|
|
exstasie
Legendary
Offline
Activity: 1806
Merit: 1521
|
|
November 10, 2020, 12:58:54 AM |
|
This looks like a crazy thought, given lots of other metrics, but none the less completely possible it seems...
Returning to the $6,000s is technically possible, but in my opinion very unlikely. Based on historic bull market corrections, anything below the $9,000s would surprise me greatly. Either way, that triangle has long been invalidated, ever since the B pivot in the $13,800s was broken. From an EW perspective, we're definitely looking at something else now. |
|
|
|
|
josegines
|
|
January 22, 2021, 10:15:03 AM |
|
I imagine you are waiting for a correction so you can update this count from 2.5 months ago. There is no chance that the ending of PRIMARY [4] is actually the March low, marked as (2)? |
|
|
|
|
xxxx123abcxxxx (OP)
|
|
January 22, 2021, 10:28:46 AM |
|
I imagine you are waiting for a correction so you can update this count from 2.5 months ago.
There is no chance that the ending of PRIMARY [4] is actually the March low, marked as (2)?
The count remains unchanged, and requires no updating. PRIMARY[4] bear market ended in DEC-2018, and PRIMARY[5] bull market has been underway since. See new thread here: 2021 Elliott Wave |
|
|
|
|
Bbirdy
Newbie
Offline
Activity: 16
Merit: 2
|
|
January 22, 2021, 10:38:07 AM |
|
Thank you for indicating the new thread  |
|
|
|
|
|
josegines
|
|
January 22, 2021, 10:57:41 AM |
|
thanks also, because i didn't know the new thread.
|
|
|
|
|


