dragonvslinux (OP)
Legendary

 Offline Offline
Activity: 1666
Merit: 2204
Crypto Swap Exchange

|
 |
December 12, 2019, 05:11:57 PM
Last edit: September 10, 2023, 02:33:36 PM by dragonvslinux |
|
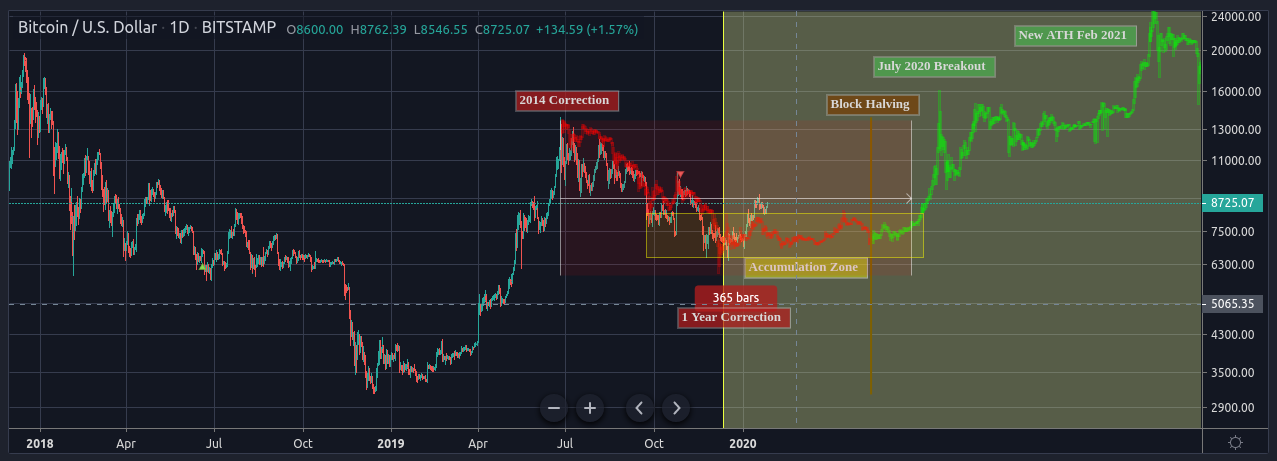
Source: TradingView, December 12th 2019. Screenshot: Mach 9th 2020. Sometimes the simplest extrapolations are best. No indicators on this chart, this is a pure extrapolation of the 2014-2015 correction and accumulation phase, that although is not in proportion by time or price, has notable similarities with the current fractal in play. Could $6,500 be the new swing low? Absolutely. This would imply an accumulation zone between $6.5-$8.3K for approximately 40 weeks, with the current correction lasting a reasonable 1 Year. This current extrapolation points to a breakout in price above $14K in July 2020, followed by a new all time high 6 months later in February 2021. |
|
|
|
|
|
|
|
|
"Governments are good at cutting off the heads of a centrally
controlled
networks like Napster, but pure P2P networks like Gnutella and Tor seem
to be holding their own." -- Satoshi
|
|
|
Advertised sites are not endorsed by the Bitcoin Forum. They may be unsafe, untrustworthy, or illegal in your jurisdiction.
|
|
|
|
|
|
|
dragonvslinux (OP)
Legendary
Offline
Activity: 1666
Merit: 2204
Crypto Swap Exchange
|
|
December 19, 2019, 11:32:47 AM
Last edit: September 10, 2023, 02:30:35 PM by dragonvslinux |
|
Could $6,500 be the low? @Sawcruhteez explores the possibility in his latest video featuring this chart:
https://www.youtube.com/watch?v=lYs2MQshjiE&feature=youtu.com&t=2058
Updated chart (December 19th):Comment: Recent price action wicked just below the support level of the accumulation zone, similar to 2014 correction, and remains on the path of accumulation. 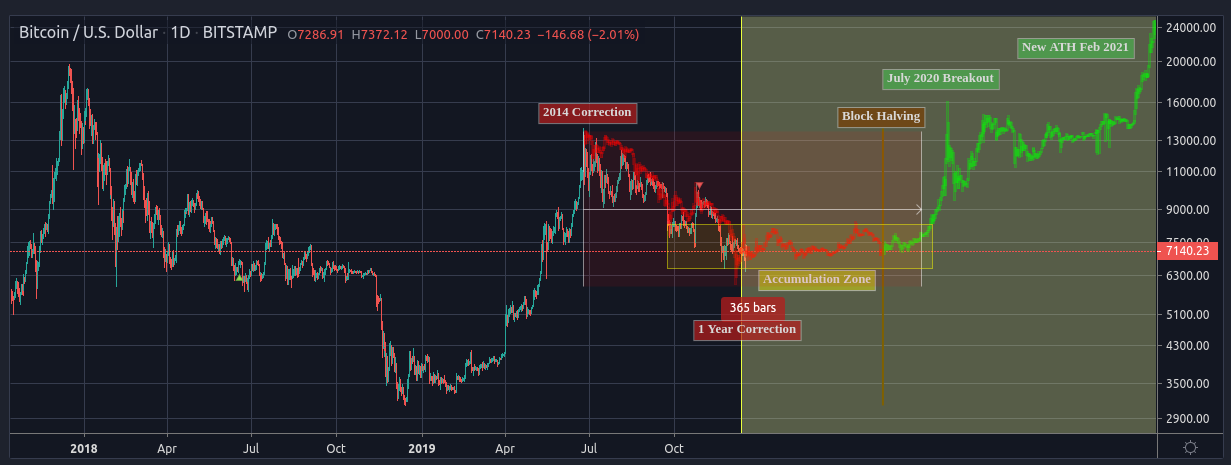
|
|
|
|
dragonvslinux (OP)
Legendary
Offline
Activity: 1666
Merit: 2204
Crypto Swap Exchange
|
|
December 23, 2019, 12:20:00 PM
Last edit: September 10, 2023, 02:27:20 PM by dragonvslinux |
|
Back above the middle of the accumulation zone around $7,400. We could be looking for a move back up to $8,000 "New years rally" to re-test the top of the accumulation zone before re-testing $6,850 next year in February. If you look at 2014-2019 data, February is where we see swing lows arrive, specifically between February 6th-11th suspiciously.  Making my first time-based prediction: The next low for #Bitcoin will be between February 6th-11th 2020.
February 10th 2014 low: $553
February 10th 2015 low: $215
February 11th 2016 low: $361
February 9th 2017 low: $925
February 6th 2018 low: $5,873
February 8th 2019 low: $3,344 |
|
|
|
Tytanowy Janusz
Legendary
Offline
Activity: 2142
Merit: 1622
|
|
December 23, 2019, 01:54:25 PM Merited by JayJuanGee (1) |
|
You are taking whole 2014 correction and compare it with 06/2019 - 2020 correction. There is one thing missing here. Whole 2018 year and half of 2019 where the actual correction from ATH started. Bear market is here for full 2 years despite 3 bullish months. I hardly doubt this analysis has any economical background ... just wishful thinking.
|
|
|
|
|
dragonvslinux (OP)
Legendary
Offline
Activity: 1666
Merit: 2204
Crypto Swap Exchange
|
|
December 24, 2019, 01:47:58 PM |
|
You are taking whole 2014 correction and compare it with 06/2019 - 2020 correction. There is one thing missing here. Whole 2018 year and half of 2019 where the actual correction from ATH started. Bear market is here for full 2 years despite 3 bullish months. I hardly doubt this analysis has any economical background ... just wishful thinking.
To put it simply: wrong. I have not taken the whole 2013-2014 correction, I have taken the second part of it, from the peak of the "dead cat bounce" that occurred half way through the bear market. If we are to consider that we have been in a bear market for 2 years, with a mini bull run in between, then this extrapolation becomes very relevant, hence accurate so far. Regardless of the fact that in 2014 the price made lower lows, as clearly the mini bull run was twice as strong of the 2014 dead cat bounce (and went twice as far). Hence the extrapolation is based on the price dropping in a similar manner (from peak of dead cat bounce down to the low), but therefore in this case not a lower low than $3,200. |
|
|
|
darkangel11
Legendary
Offline
Activity: 2338
Merit: 1345
Defend Bitcoin and its PoW: bitcoincleanup.com
|
|
December 24, 2019, 03:26:08 PM |
|
6k was the strong low level of 2018 and everything below that happened due to manipulation. It wasn't natural for BTC to go to 3k and the market showed it by sharply recovering from that low and a year later finding a support at the same level. 6k is the level of profitability for miners and it can be defended. I believe that if we dip down below it it's going to be shallow and temporary. Maybe 5,5k for a few days followed by a recovery above 6k once again.
|
| | .
.Duelbits. | │ | ..........UNLEASH..........
THE ULTIMATE
GAMING EXPERIENCE | │ | DUELBITS
FANTASY
SPORTS | ████▄▄▄█████▄▄▄
░▄████████████████▄
▐██████████████████▄
████████████████████
████████████████████▌
█████████████████████
████████████████▀▀▀
███████████████▌
███████████████▌
████████████████
████████████████
████████████████
████▀▀███████▀▀ | .
▬▬
VS
▬▬ | ████▄▄▄█████▄▄▄
░▄████████████████▄
▐██████████████████▄
████████████████████
████████████████████▌
█████████████████████
███████████████████
███████████████▌
███████████████▌
████████████████
████████████████
████████████████
████▀▀███████▀▀ | /// PLAY FOR FREE ///
WIN FOR REAL | │ | ..PLAY NOW.. | |
|
|
|
BrewMaster
Legendary
Offline
Activity: 2114
Merit: 1292
There is trouble abrewing
|
|
December 24, 2019, 03:47:14 PM Merited by JayJuanGee (1) |
|
but that chart doesn't make any sense. for starters why is the 2014 correction starting from July 2019 since by then the correction was not only long over but also we have been about 150% above the bottom of the correction!!! in other words what this charts refers to as "2014 correction" looks to me like the 2015 correction after the first biggest rise which is more like a bear trap that due to some drama got longer. this is how i would extrapolate 2014 data to today's data. the first 2 periods (bubble pop and bull traps) happened exactly like 2014 then the next step of reaching bottom and having the accumulation ($150 vs $3200) is exactly the same but it was shorter this time as expected to be shorter and then the recovery which started in 2016 has already started in 2018 when price went out of $3200 and moved towards $13k. then the drop from that is just a correction that is similar to "2016" bear trap.  |
There is a FOMO brewing...
|
|
|
dragonvslinux (OP)
Legendary
Offline
Activity: 1666
Merit: 2204
Crypto Swap Exchange
|
|
December 24, 2019, 06:25:53 PM |
|
but that chart doesn't make any sense. for starters why is the 2014 correction starting from July 2019 since by then the correction was not only long over but also we have been about 150% above the bottom of the correction!!! I'm sorry this chart doesn't make sense to you, if you are not able to see an alternative perspective. Price has been falling for 6 months, in the past two years it has formed lower highs on a macro scale ($20K and $14K), so no, I don't believe there is confirmation of the "end" of the correction/bear market - as there still hasn't been long enough consolidation period in proportion with the length of the correction (whether 1 year or 2 years, depending on your perspective). The more I read people's thoughts that "we're in a bull market" and there won't be any further consolidation, despite a wealth of evidence to the contrary, the more I'm convinced there will be consolidation in the near future (if not already in play). It reminds me of the notorious "we won't break $6K" mentality in 2018, before we obviously did. this is how i would extrapolate 2014 data to today's data.
I won't argue your extrapolation, as you failed to extrapolate the price - mainly because the overlay would be irrelevant. You have a very different perspective, that's great, but I think you're best of arguing why this extrapolation isn't relevant with a version of your own, as opposed to unrelated alternative theories. For starters, your recovery and bear trap area extrapolated would indicate a 35% drop as a bear trap, whereas price has already fallen 50+%. Needless to say, it's barely possible to extrapolate. Not forgetting that in 2016 we had considerable amount of consolidation, within your recovery and bear trap area, so ironically your chart would only prove my point of further consolidation. |
|
|
|
exstasie
Legendary
Offline
Activity: 1806
Merit: 1521
|
|
December 24, 2019, 07:53:47 PM Merited by JayJuanGee (1) |
|
You are taking whole 2014 correction and compare it with 06/2019 - 2020 correction. There is one thing missing here. Whole 2018 year and half of 2019 where the actual correction from ATH started. Bear market is here for full 2 years despite 3 bullish months. I hardly doubt this analysis has any economical background ... just wishful thinking.
To put it simply: wrong. I have not taken the whole 2013-2014 correction, I have taken the second part of it, from the peak of the "dead cat bounce" that occurred half way through the bear market. In my opinion, that's why it won't work out. The context doesn't make sense. The 2015 accumulation range was the bottom of a multi-year bear market. The entire downtrend was characterized by lower highs and lower lows until late 2015 when the bear market was broken. In contrast, the 2018 bear market was broken by virtually all metrics in early 2019. So in terms of Wyckoff analysis, this projection doesn't make sense. The rally to the $13,800s marked a massive sign of strength (much larger than the one that initiated the 2016-2017 bull market). That puts us in Phase D of an accumulation schematic, where the market is re-accumulating above the previous $3K-$6K trading range. For this phase to fail would mean we are in the middle of a distribution cycle again. There's no way we would just go sideways here for a year in that case. We've already been ranging for 2 years now, so historically the argument for continued long term ranging is getting weaker by the day. |
|
|
|
adaseb
Legendary
Offline
Activity: 3738
Merit: 1708
|
I lived thru the 2014-2015 bear market and I looked at your chart and I was puzzled and basically had to load-up the BTCUSD from that era and there is a difference and the difference is significant.
You don't have this shown on your chart but in Aug 2015 on Bitfinex, there was some event (forgot what ) that lead to bitcoin having a double bottom actually at the $165 area. I know this because I actually had a short from $300 that I covered exactly when that low broke and pretty much covered at the lowest low price in the last 5 years.
Bitfinex charts should be given preference since back then its where most of the trading was done. Had the most volume and liquidity. There was no Bitmex back then. So you should update your chart using the Bitfinex data.
|
|
|
|
dragonvslinux (OP)
Legendary
Offline
Activity: 1666
Merit: 2204
Crypto Swap Exchange
|
|
December 25, 2019, 12:32:50 PM |
|
I lived thru the 2014-2015 bear market and I looked at your chart and I was puzzled and basically had to load-up the BTCUSD from that era and there is a difference and the difference is significant.
You don't have this shown on your chart but in Aug 2015 on Bitfinex, there was some event (forgot what ) that lead to bitcoin having a double bottom actually at the $165 area. I know this because I actually had a short from $300 that I covered exactly when that low broke and pretty much covered at the lowest low price in the last 5 years.
Bitfinex charts should be given preference since back then its where most of the trading was done. Had the most volume and liquidity. There was no Bitmex back then. So you should update your chart using the Bitfinex data.
I hear you, $162 was that low in August 2015 on Bitfinex. You're right it wouldn't been a lot better using Bitfinex data for this chart, that $162 wick would no doubt be testing the support of the accumulation zone (around $6,500) for the second and last time, effectively confirming the range as accumulation. Thanks for pointing that out. I usually avoid Bitfinex charts due to the tether scam price fluctuations that occurs on it. Really I want the Bitfinex extrapolation on a Coinbase/BLX chart, since Bitfinex doesn't have the volume or stability it used to compared to other exchanges, but otherwise any older extrapolations should be based on this exchange volume as you put it. Without re-publishing (that I don't think is necessarily), I will make a comment on the chart with your reference point, and bare this in mind for future extrapolations:  |
|
|
|
BrewMaster
Legendary
Offline
Activity: 2114
Merit: 1292
There is trouble abrewing
|
|
December 25, 2019, 01:43:02 PM |
|
Price has been falling for 6 months,
if you look at the bigger picture the end result won't look as bad. the bigger picture is where price is $3200 and it goes up to $13800 then comes down to $7xxx. in other words what we have here is the correction after a 330% rise. and the result is still 125% above the price at the beginning of the year. as there still hasn't been long enough consolidation period in proportion with the length of the correction
and what law says there must be a certain proportion here? i don't know of any and there is no reason why there should be any. The more I read people's thoughts that "we're in a bull market" and there won't be any further consolidation, despite a wealth of evidence to the contrary, the more I'm convinced there will be consolidation in the near future (if not already in play).
i wouldn't put too much value in what people say online. most of them are emotional and saying their wishes. i remember when price was $3200 everyone was saying it will drop to $1000 and they were expecting the rise to start in 2020 when halving starts! with that logic we should have never seen the 330% rise this year... I won't argue your extrapolation, as you failed to extrapolate the price - mainly because the overlay would be irrelevant. You have a very different perspective, that's great, but I think you're best of arguing why this extrapolation isn't relevant with a version of your own, as opposed to unrelated alternative theories.
i don't really like or believe in extrapolation because i don't believe in repetition of any kind of cycles so i won't try to justify it. but i say that if there were any repetition then it should look like what i posted above and it starts from the peek ($20k) not from one of the peeks in 2019 long after the bubble |
There is a FOMO brewing...
|
|
|
dragonvslinux (OP)
Legendary
Offline
Activity: 1666
Merit: 2204
Crypto Swap Exchange
|
|
December 25, 2019, 01:55:31 PM |
|
Price has been falling for 6 months,
if you look at the bigger picture the end result won't look as bad. the bigger picture is where price is $3200 and it goes up to $13800 then comes down to $7xxx. in other words what we have here is the correction after a 330% rise. and the result is still 125% above the price at the beginning of the year. This is precisely why I believe this could be an accumulation zone, buyers and sellers are matched. Still 2x from the low, 50% down from the high. Kind of obvious really. as there still hasn't been long enough consolidation period in proportion with the length of the correction
and what law says there must be a certain proportion here? i don't know of any and there is no reason why there should be any. It's nothing to do with law, it's based on probability of market cycles. Probability is based on mathematics, that in itself is based on fixed constants, tried and tested for thousands of years. The more I read people's thoughts that "we're in a bull market" and there won't be any further consolidation, despite a wealth of evidence to the contrary, the more I'm convinced there will be consolidation in the near future (if not already in play).
i wouldn't put too much value in what people say online. most of them are emotional and saying their wishes. i remember when price was $3200 everyone was saying it will drop to $1000 and they were expecting the rise to start in 2020 when halving starts! with that logic we should have never seen the 330% rise this year... Your example is exactly why I do put value in the online sentiment, as well as other metrics such as fear & greed index. When everyone thought at $3200 price would drop lower, it didn't. Now everyone thinks that the price will either moon or dump, maybe it won't you know as per usual most people will be wrong, including myself.. This is how markets also work. I won't argue your extrapolation, as you failed to extrapolate the price - mainly because the overlay would be irrelevant. You have a very different perspective, that's great, but I think you're best of arguing why this extrapolation isn't relevant with a version of your own, as opposed to unrelated alternative theories.
i don't really like or believe in extrapolation because i don't believe in repetition of any kind of cycles so i won't try to justify it. Check out these 8 long-term extrapolations. 3 of which have completed (were correct), the other 5 remain accurate or relevant (still active): https://bitcointalk.org/index.php?topic=5188537 |
|
|
|
BrewMaster
Legendary
Offline
Activity: 2114
Merit: 1292
There is trouble abrewing
|
|
December 25, 2019, 02:22:56 PM |
|
Your example is exactly why I do put value in the online sentiment, as well as other metrics such as fear & greed index. When everyone thought at $3200 price would drop lower, it didn't. Now everyone thinks that the price will either moon or dump, maybe it won't you know as per usual most people will be wrong, including myself.. This is how markets also work.
that might have been a bad example since the reverse happened but the point is that the statements you read online doesn't always reflect what people think. in case of $3200 example all the chatter pointed to a big fear factor and logically price should have fallen. but the reality was that most people were actually buying even though they were telling others not to. right now things are exactly the same. if you look around most speculators are expecting a drop! they call it end of the year Christmas dump, miner capitulation, plus token scam, ... and their guesses are in range of $5000 and $6000 but as we can see there is no drops happening. |
There is a FOMO brewing...
|
|
|
Wexlike
Legendary
Offline
Activity: 1473
Merit: 1086
|
|
December 25, 2019, 02:23:31 PM |
|
You are taking whole 2014 correction and compare it with 06/2019 - 2020 correction. There is one thing missing here. Whole 2018 year and half of 2019 where the actual correction from ATH started. Bear market is here for full 2 years despite 3 bullish months. I hardly doubt this analysis has any economical background ... just wishful thinking.
To put it simply: wrong. I have not taken the whole 2013-2014 correction, I have taken the second part of it, from the peak of the "dead cat bounce" that occurred half way through the bear market. In my opinion, that's why it won't work out. The context doesn't make sense. The 2015 accumulation range was the bottom of a multi-year bear market. The entire downtrend was characterized by lower highs and lower lows until late 2015 when the bear market was broken. In contrast, the 2018 bear market was broken by virtually all metrics in early 2019. So in terms of Wyckoff analysis, this projection doesn't make sense. The rally to the $13,800s marked a massive sign of strength (much larger than the one that initiated the 2016-2017 bull market). That puts us in Phase D of an accumulation schematic, where the market is re-accumulating above the previous $3K-$6K trading range. For this phase to fail would mean we are in the middle of a distribution cycle again. There's no way we would just go sideways here for a year in that case. We've already been ranging for 2 years now, so historically the argument for continued long term ranging is getting weaker by the day. Correct, I really enjoy reading your analysis and mind set. In 2015 the halving was also far far away and it felt so unsecure if Bitcoin will even survive. I'm also leaning strongly towards that we are in an accumulation period right now. |
|
|
|
|
dragonvslinux (OP)
Legendary
Offline
Activity: 1666
Merit: 2204
Crypto Swap Exchange
|
|
December 25, 2019, 02:40:11 PM |
|
Your example is exactly why I do put value in the online sentiment, as well as other metrics such as fear & greed index. When everyone thought at $3200 price would drop lower, it didn't. Now everyone thinks that the price will either moon or dump, maybe it won't you know as per usual most people will be wrong, including myself.. This is how markets also work. that might have been a bad example since the reverse happened but the point is that the statements you read online doesn't always reflect what people think. in case of $3200 example all the chatter pointed to a big fear factor and logically price should have fallen. but the reality was that most people were actually buying even though they were telling others not to. right now things are exactly the same. if you look around most speculators are expecting a drop! they call it end of the year Christmas dump, miner capitulation, plus token scam, ... and their guesses are in range of $5000 and $6000 but as we can see there is no drops happening. I do see this argument I'm not going to deny. Another perspective would be at $6K when the minority believed prices would fall to the $4-5K area, the majority felt we'd hold the $6K area and/or breakout to the upside, instead we reached $3.2K, that I tiny minority were calling for. Personally I feel the majority are expecting accumulation or continued bullish price, but it depends what you read and who you follow etc. Instead I feel the minority are again expecting it to drop to $5-6K, whereas we may bottom out in the low $4K range instead as few are suggesting it, who knows. The only thing I would say for certain is you can't be 100% sure on any theory, even if you are 90% confident.  1 week left until bear-cross is confirmed on Monthly chart: fact not opinion. |
|
|
|
dragonvslinux (OP)
Legendary
Offline
Activity: 1666
Merit: 2204
Crypto Swap Exchange
|
|
December 30, 2019, 11:08:19 AM
Last edit: September 10, 2023, 02:24:52 PM by dragonvslinux |
|
OP updated, still very much following the accumulation path, not much else to add:  The network strength now has confluence with $6,500 being the low, as well as accumulation theory: Daily chart 2015-2019 - currently signalling recovery stage of miner capitulation, awaiting price follow through for buy signal:Signals (2015-2019): $234, January 28th 2015 (5) $234, May 2nd 2015 (6) $238 May 28th 2015 (7) $612, September 4th 2016 ( 8) $3652, January 11th 2019 (9) $7245, December 27th 2019 (10) Average of 1 buy signal per year in the past 9 years. 2 buy signals have occurred in the past 3 years. Weekly chart - has been flirting with recovery stage of miner capitulation, similar to August 2016:Signals (2011-2019): $5.28, December 26th 2011 (1) $6.35, June 18th 2012 (2) $23.80, February 4th 2013 (3) $227, January 26th 2015 (4) $231, May 25th 2015 (5) $3533, January 7th 2019 (6) $7385, December 30th 2019 (7) Average of 1 buy signal every 18 months in the past 9 years. 2 signals have occurred in the past 3 years.[/center] |
|
|
|
dragonvslinux (OP)
Legendary
Offline
Activity: 1666
Merit: 2204
Crypto Swap Exchange
|
|
January 03, 2020, 09:37:50 AM
Last edit: September 10, 2023, 02:24:21 PM by dragonvslinux |
|
Updated OP screenshot, still looking good following the accumulation path and finding support from near base support this time.  |
|
|
|
dragonvslinux (OP)
Legendary
Offline
Activity: 1666
Merit: 2204
Crypto Swap Exchange
|
|
January 08, 2020, 11:52:28 AM
Last edit: September 10, 2023, 02:21:49 PM by dragonvslinux |
|
Currently testing the horizontal resistance level of the accumulation zone after bouncing back from horizontal support: 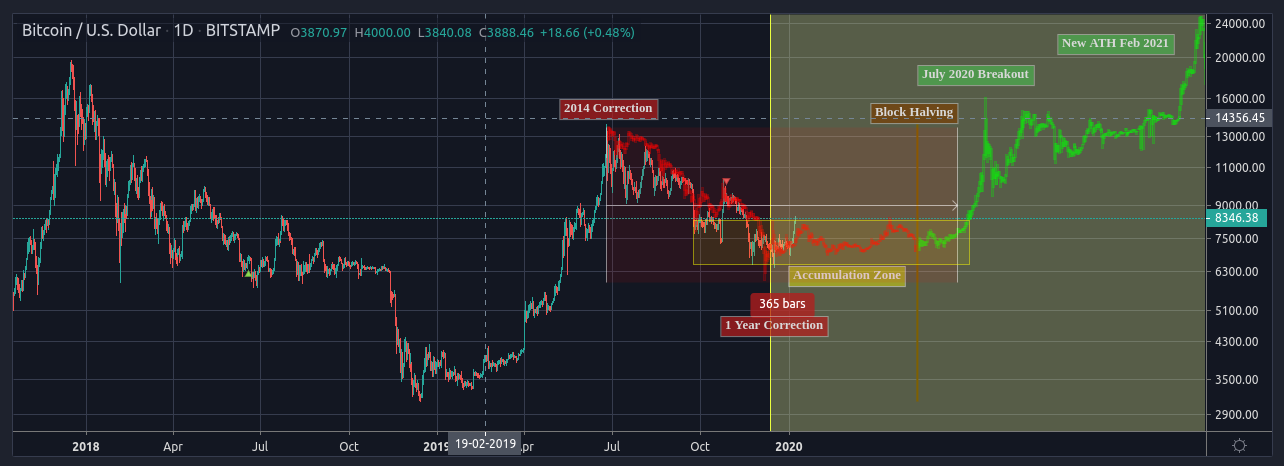 Continuing on the 2014 path would imply an orderly correction back down to $6,800-6,900 to continue forming a horizontal channel by early next month, fitting in line nicely with this time-based analysis:  |
|
|
|
dragonvslinux (OP)
Legendary
Offline
Activity: 1666
Merit: 2204
Crypto Swap Exchange
|
|
January 27, 2020, 01:58:22 PM
Last edit: September 10, 2023, 02:14:53 PM by dragonvslinux |
|
 [/center] Price noticeably finding support from the upper band of the anticipated accumulation zone (based on 2015 accumulation), indicating that accumulation may now be over. Unless we fall back into this range with consecutive candle closes, my outlook is now bullish: |
|
|
|
|


