bitmover (OP)
Legendary

 Online Online
Activity: 2282
Merit: 5878
bitcoindata.science


|
 |
December 22, 2020, 07:29:44 PM
Last edit: January 19, 2021, 07:31:10 PM by bitmover |
|
Hello all, Bitcoin Blockdata Dashboard I created this dashboard using LoyceV CSV Blockdata from the 24hours data and from the last week! Last week data has **only** 700kb, so I think I can work with it online! You can access it here: https://bitcoindata.science/blockdata-dashboard.htmlYou can see many interesting statistcs, such as average fees, average transaction size, pools that mined blocks, block size, and so on. Here are a few screen shots. Click this button to see weekly and daily data!


|
.
.BLACKJACK ♠ FUN. | | | ███▄██████
██████████████▀
████████████
█████████████████
████████████████▄▄
░█████████████▀░▀▀
██████████████████
░██████████████
█████████████████▄
░██████████████▀
████████████
███████████████░██
██████████ | | CRYPTO CASINO &
SPORTS BETTING | | │ | | │ | ▄▄███████▄▄
▄███████████████▄
███████████████████
█████████████████████
███████████████████████
█████████████████████████
█████████████████████████
█████████████████████████
███████████████████████
█████████████████████
███████████████████
▀███████████████▀
███████████████████ | | .
|
|
|
|
|
|
|
TalkImg was created especially for hosting images on bitcointalk.org: try it next time you want to post an image
|
|
|
Advertised sites are not endorsed by the Bitcoin Forum. They may be unsafe, untrustworthy, or illegal in your jurisdiction.
|
Bitcoin_Arena
Copper Member
Legendary
 Offline Offline
Activity: 2016
Merit: 1771
฿itcoin for all, All for ฿itcoin.
|
 |
December 22, 2020, 11:25:28 PM |
|
Is it possible to include the number of empty blocks and stale blocks mined in the last 24 hours and perhaps also include the number mined by each pool? I am also curious in knowing what happened to block size and transaction type per block at the specific time I have marked with the arrow  |
|
|
|
bitmover (OP)
Legendary
Online
Activity: 2282
Merit: 5878
bitcoindata.science
|
|
December 23, 2020, 12:01:26 AM |
|
Is it possible to include the number of empty blocks and stale blocks mined in the last 24 hours and perhaps also include the number mined by each pool? I am also curious in knowing what happened to block size and transaction type per block at the specific time I have marked with the arrow It is already included. Last line in the first table. Empty Block: 662364 - mined by F2Pool I Will make it more visible, as this is still a very early version |
.
.BLACKJACK ♠ FUN. | | | ███▄██████
██████████████▀
████████████
█████████████████
████████████████▄▄
░█████████████▀░▀▀
██████████████████
░██████████████
█████████████████▄
░██████████████▀
████████████
███████████████░██
██████████ | | CRYPTO CASINO &
SPORTS BETTING | | │ | | │ | ▄▄███████▄▄
▄███████████████▄
███████████████████
█████████████████████
███████████████████████
█████████████████████████
█████████████████████████
█████████████████████████
███████████████████████
█████████████████████
███████████████████
▀███████████████▀
███████████████████ | | .
|
|
|
|
tranthidung
Legendary
Offline
Activity: 2254
Merit: 3968
Farewell o_e_l_e_o
|
|
December 23, 2020, 02:22:40 AM
Last edit: December 23, 2020, 02:40:59 AM by tranthidung |
|
It is good to see you develop your website very well, congratulations.
I have my small contribution for that page, specifically the pie chart for the mining pools. Currently, you use a pie chart for it but its size is too large and it has not been displayed well. You could adjust the size smaller a bit. However, I suggest you to use bar chart (horizontally) due to 2 advantages at least: - Human eyes are more easily to assess and realize differences in the vertical or horizontal line. More easily than when we have to compare (by eyes) differences in arcs or angles.
- The second advantage is to help you better show labels of mining pools.
- To make the proposal is not from my subjective opinion, I searched and here you go with the article that presents some disadvantages of pie chart: How to Choose Between a Bar Chart and Pie Chart
- Horizontal bar chart is better than vertical bar chart if you have too many sub-groups need to be displayed on the chart with their label names
Example with a chart is taken from there Top-10 mining pools on bitcoin network over years (2009 - May 2020) |
|
|
|
SFR10
Legendary
Offline
Activity: 2982
Merit: 3408
Crypto Swap Exchange
|
|
December 24, 2020, 07:05:35 AM |
|
You can see many interesting statistcs, such as average fees, average transaction size, pools that mined blocks, block size, and so on.
Another interesting way of showing those stats [you never fail to amaze me], keep them coming  - Suggestions/questions:
- Would it be possible to include also the pool names that mined each block when hovering over the "Block Size (bytes)" chart?
- tranthidung made a valid point but perhaps you could stick with the pie chart and just remove the names [it'll be cleaner] and only show them when someone hovers over them [e.g. like your Segwit adoption pie chart].
- You might want to also reconsider the color combination for "some" of its parts and the white-colored font [it'sa bit hard on the eyes].
|
|
|
|
tranthidung
Legendary
Offline
Activity: 2254
Merit: 3968
Farewell o_e_l_e_o
|
|
December 24, 2020, 07:16:53 AM |
|
@SFR10, - Your post reminds me that the current pie chart is arbitrarily displayed. I don't know how mining pools are sorted out in that chart as I can not find any orders by alphabetical or percentage orders.
- If @bitmover wants to stick with the piechart, I think it's better to use a simple color theme (in the order of transparency (light to dark or cold to hot and vice versa).
- The color theme from jochen-hoenicke.de can be considered. It is better than mempool.space's color theme (that somewhat is similar to the current color in the pie chart, mix arbitraritly).
- I explained my idea there
|
|
|
|
bitmover (OP)
Legendary
Online
Activity: 2282
Merit: 5878
bitcoindata.science
|
SFR10 and tranthidung, you both are right and made nice suggestions
I can add guessed miner to the line chart tooltip. I can also sort the piechart by size( it is now sorted by who mined first in the time period).
The colors from the website you suggested are not match the dark theme colors. I need to take a look more carefully at that.
I will do all suggestions when I get home next week , I am traveling now away from my dev environment. This wasa rush job, but I really wanted to release it . Maybe it was a bad decision. But the community really give nice inputs.
I need to make a better table for miners as well. I will add many stats there for each miner, like total reward earned in the period in usd and btc, hashpower % , and so on.
Empty blocks also need more attention, as well as zero segwit blocks.
|
.
.BLACKJACK ♠ FUN. | | | ███▄██████
██████████████▀
████████████
█████████████████
████████████████▄▄
░█████████████▀░▀▀
██████████████████
░██████████████
█████████████████▄
░██████████████▀
████████████
███████████████░██
██████████ | | CRYPTO CASINO &
SPORTS BETTING | | │ | | │ | ▄▄███████▄▄
▄███████████████▄
███████████████████
█████████████████████
███████████████████████
█████████████████████████
█████████████████████████
█████████████████████████
███████████████████████
█████████████████████
███████████████████
▀███████████████▀
███████████████████ | | .
|
|
|
|
tranthidung
Legendary
Offline
Activity: 2254
Merit: 3968
Farewell o_e_l_e_o
|
|
December 24, 2020, 03:49:30 PM |
|
The colors from the website you suggested are not match the dark theme colors. I need to take a look more carefully at that.
It is only example to explain my suggestion to customize your chart's color bands. I don't know Python (I will begin my Python learning in 2021) but a quick search points me to these guides from PIL import Image
im = Image.open('image.jpg').convert('RGB')
# Split into 3 channels
r, g, b = im.split()
# Increase Reds
r = r.point(lambda i: i * 1.2)
# Decrease Greens
g = g.point(lambda i: i * 0.9)
# Recombine back to RGB image
result = Image.merge('RGB', (r, g, b))
result.save('result.png')
It is similar to what I code for my chart color when I want to customize it. Default colors are always terrible, you know. Link |
|
|
|
bitmover (OP)
Legendary
Online
Activity: 2282
Merit: 5878
bitcoindata.science
|
|
December 24, 2020, 05:34:27 PM |
|
Python is amazing, but it cannot be used for web development. I created this website with javascript Python has similar syntax, so it kind of helped me (I learned python first) |
.
.BLACKJACK ♠ FUN. | | | ███▄██████
██████████████▀
████████████
█████████████████
████████████████▄▄
░█████████████▀░▀▀
██████████████████
░██████████████
█████████████████▄
░██████████████▀
████████████
███████████████░██
██████████ | | CRYPTO CASINO &
SPORTS BETTING | | │ | | │ | ▄▄███████▄▄
▄███████████████▄
███████████████████
█████████████████████
███████████████████████
█████████████████████████
█████████████████████████
█████████████████████████
███████████████████████
█████████████████████
███████████████████
▀███████████████▀
███████████████████ | | .
|
|
|
|
|
Insanerman
|
|
December 24, 2020, 06:48:35 PM |
|
With regards to how Mining Pool data should be shown, I do suggest you can try to improvise how Coin360.com displays the crypto markets price using boxes which size depends on how huge a single element are compared to the others. I would be pleased to try and design/redesign the website if you would let me to  Python is amazing, but it cannot be used for web development. I created this website with javascript
Python has similar syntax, so it kind of helped me (I learned python first)
Actually, you can. There is a framework called Django (most famous for web dev), which lets you create a backend of a website. With regards to syntax, Python is much simpler and easier to understand. There are tons of javascript syntax that is complicated in ways that a Python can provide in a single line of code. Have you also tried node.js? It is a better version of JavaScript |
|
|
|
|
bitmover (OP)
Legendary
Online
Activity: 2282
Merit: 5878
bitcoindata.science
|
|
December 24, 2020, 08:13:23 PM |
|
With regards to how Mining Pool data should be shown, I do suggest you can try to improvise how Coin360.com displays the crypto markets price using boxes which size depends on how huge a single element are compared to the others. I would be pleased to try and design/redesign the website if you would let me to Tree charts (the chart from coin360 you are referring to) are not exactly loved by statisticians Take a look at this comparison:it is worse than bars in every single case. https://www.theinformationlab.co.uk/2014/12/16/treemap-vs-bar-chart-end-treemap/Treempas Are basically a fancy pie. I think bar charts, as suggested by tranthidung are the way to go. If I had only 5-10 pools pie would be better. But bars are really more effective for nearly 20 pools. I will try to chart are chose better colors for the pie.. if I cant I will move to bars . You are free to make design suggestions, but this is just an alpha version of the dashboard. |
.
.BLACKJACK ♠ FUN. | | | ███▄██████
██████████████▀
████████████
█████████████████
████████████████▄▄
░█████████████▀░▀▀
██████████████████
░██████████████
█████████████████▄
░██████████████▀
████████████
███████████████░██
██████████ | | CRYPTO CASINO &
SPORTS BETTING | | │ | | │ | ▄▄███████▄▄
▄███████████████▄
███████████████████
█████████████████████
███████████████████████
█████████████████████████
█████████████████████████
█████████████████████████
███████████████████████
█████████████████████
███████████████████
▀███████████████▀
███████████████████ | | .
|
|
|
|
bitmover (OP)
Legendary
Online
Activity: 2282
Merit: 5878
bitcoindata.science
|
|
December 30, 2020, 06:23:23 PM |
|
Is it possible to include the number of empty blocks and stale blocks mined in the last 24 hours and perhaps also include the number mined by each pool?
I am also curious in knowing what happened to block size and transaction type per block at the specific time I have marked with the arrow
I cannot add Stable blocks because they are not in the current blockchain (not the longest chain). I added the information regarding empty blocks. It is now more visible and you can see a tooltip:  I have my small contribution for that page, specifically the pie chart for the mining pools. Currently, you use a pie chart for it but its size is too large and it has not been displayed well. You could adjust the size smaller a bit.
However, I suggest you to use bar chart (horizontally) due to 2 advantages at least:
I also sorted the miners pie chart and create a new bar chart (vertical, as horizontal was too crowed). I liked the visual. By mistake I made the background green and I liked. I will redesign the dashboard soon with new colors.  |
.
.BLACKJACK ♠ FUN. | | | ███▄██████
██████████████▀
████████████
█████████████████
████████████████▄▄
░█████████████▀░▀▀
██████████████████
░██████████████
█████████████████▄
░██████████████▀
████████████
███████████████░██
██████████ | | CRYPTO CASINO &
SPORTS BETTING | | │ | | │ | ▄▄███████▄▄
▄███████████████▄
███████████████████
█████████████████████
███████████████████████
█████████████████████████
█████████████████████████
█████████████████████████
███████████████████████
█████████████████████
███████████████████
▀███████████████▀
███████████████████ | | .
|
|
|
|
tranthidung
Legendary
Offline
Activity: 2254
Merit: 3968
Farewell o_e_l_e_o
|
|
December 31, 2020, 12:58:14 PM |
|
I also sorted the miners pie chart and create a new bar chart (vertical, as horizontal was too crowed).
You are talented! Generally, you did a great work to improve that page, especially visual chart. It is good to know you are an open-minded person and this characteristic will help you growing more. Some people are too conservative and that characteristic restricts their learning, and working process.  Would you mind explaining what is crowed? I don't understand it. I can imagine the horizontal bar chart can contain too much space on your page and it can be a trouble for that page, generally. Is it what you meant?
I liked the visual. By mistake I made the background green and I liked. I will redesign the dashboard soon with new colors. I still think the font size for mining pool names should be a little bit smaller. Better visual and also better to catch attention of viewers on main and non-main points on your chart. Of course, it is personal perspective on which is main/ non-main points. My heads up. - Is it possible to include % (on top of bar) for top mining pools? Currently, the stats are in total blocks found by each mining pool.
- It will be messy if you include % for all pools and I only suggest for top mining pools every day. For non-top mining pools, skip the %.
|
|
|
|
examplens
Legendary
Online
Activity: 3262
Merit: 3142
Crypto Swap Exchange
|
|
December 31, 2020, 01:30:10 PM |
|
Wow, @bitmover, this is very nice work from you. I was just checking the server load from your account, you are very frugal 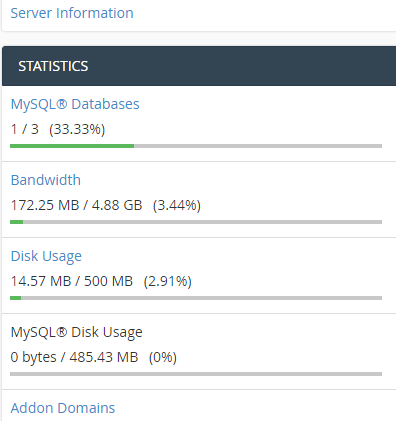 I still think the font size for mining pool names should be a little bit smaller. Better visual and also better to catch attention of viewers on main and non-main points on your chart. Of course, it is personal perspective on which is main/ non-main points.
maybe theres not even a need for another type of font. Heading may be marked with biggest/smallest or bolded font if they need. I think differnet font type draws attention, more than the size. |
|
|
|
bitmover (OP)
Legendary
Online
Activity: 2282
Merit: 5878
bitcoindata.science
|
|
December 31, 2020, 07:30:29 PM Merited by tranthidung (2) |
|
You are talented! Generally, you did a great work to improve that page, especially visual chart. It is good to know you are an open-minded person and this characteristic will help you growing more. Some people are too conservative and that characteristic restricts their learning, and working process. Thank you for your kind words Would you mind explaining what is crowed? I don't understand it.
I can imagine the horizontal bar chart can contain too much space on your page and it can be a trouble for that page, generally. Is it what you meant?
Too much information in the vertical axis. As tehre are near 20 pools, it is better to display it vertically. I still think the font size for mining pool names should be a little bit smaller. Better visual and also better to catch attention of viewers on main and non-main points on your chart. Of course, it is personal perspective on which is main/ non-main points. My heads up. - Is it possible to include % (on top of bar) for top mining pools? Currently, the stats are in total blocks found by each mining pool.
- It will be messy if you include % for all pools and I only suggest for top mining pools every day. For non-top mining pools, skip the %.
I just added all suggestions.  Wow, @bitmover, this is very nice work from you. I was just checking the server load from your account, you are very frugal Thanks for nice words examples. I am still learning and being as minimalist as possible. |
.
.BLACKJACK ♠ FUN. | | | ███▄██████
██████████████▀
████████████
█████████████████
████████████████▄▄
░█████████████▀░▀▀
██████████████████
░██████████████
█████████████████▄
░██████████████▀
████████████
███████████████░██
██████████ | | CRYPTO CASINO &
SPORTS BETTING | | │ | | │ | ▄▄███████▄▄
▄███████████████▄
███████████████████
█████████████████████
███████████████████████
█████████████████████████
█████████████████████████
█████████████████████████
███████████████████████
█████████████████████
███████████████████
▀███████████████▀
███████████████████ | | .
|
|
|
|
bitmover (OP)
Legendary
Online
Activity: 2282
Merit: 5878
bitcoindata.science
|
|
January 07, 2021, 01:23:37 AM Merited by tranthidung (1) |
|
Some updates. I guess the dashboard is mostly done now. added 3 main sections. First one is the block session, with rewards and block size data (focus on empty blocks)
 Second is about transactions. Segwit Adoption and fees.  And mining section, with total mined blocks per pool and segwit adoption per pool. I noticed some pools are resisting to adopt segwit.  Soon I will add weekly data.
I also added funded address section, with LoyceV database of funded addresses:
 |
.
.BLACKJACK ♠ FUN. | | | ███▄██████
██████████████▀
████████████
█████████████████
████████████████▄▄
░█████████████▀░▀▀
██████████████████
░██████████████
█████████████████▄
░██████████████▀
████████████
███████████████░██
██████████ | | CRYPTO CASINO &
SPORTS BETTING | | │ | | │ | ▄▄███████▄▄
▄███████████████▄
███████████████████
█████████████████████
███████████████████████
█████████████████████████
█████████████████████████
█████████████████████████
███████████████████████
█████████████████████
███████████████████
▀███████████████▀
███████████████████ | | .
|
|
|
|
bitmover (OP)
Legendary
Online
Activity: 2282
Merit: 5878
bitcoindata.science
|
|
January 14, 2021, 02:20:49 AM Merited by tranthidung (1) |
|
I made a big update! Finally I was able to handle week data, thanks to LoyceV who created a new directory for me. Now you can just click on the button "last week" or "last day" to get the data you want (you will need to wait a few moments, 700kb file needs to be loaded)
Following tranthidung suggestion, I made an horizontal bar charts for miners: and my favorite one, the scatter plot of block reward x segwit adoption:  Here we can see that miners who put more segwit transacftions inside a block get more fee rewards. That's interesting. I will try to find a way to get more data into it! |
.
.BLACKJACK ♠ FUN. | | | ███▄██████
██████████████▀
████████████
█████████████████
████████████████▄▄
░█████████████▀░▀▀
██████████████████
░██████████████
█████████████████▄
░██████████████▀
████████████
███████████████░██
██████████ | | CRYPTO CASINO &
SPORTS BETTING | | │ | | │ | ▄▄███████▄▄
▄███████████████▄
███████████████████
█████████████████████
███████████████████████
█████████████████████████
█████████████████████████
█████████████████████████
███████████████████████
█████████████████████
███████████████████
▀███████████████▀
███████████████████ | | .
|
|
|
|
tranthidung
Legendary
Offline
Activity: 2254
Merit: 3968
Farewell o_e_l_e_o
|
|
January 14, 2021, 02:31:57 AM
Last edit: January 14, 2021, 02:44:37 AM by tranthidung |
|
I made a big update!
You are a very hard-working guy, bitmover. Following tranthidung suggestion, I made an horizontal bar charts for miners:
Thanks. However, the important thing is at the end, how do you feel about pie chart, bar chart and especially the difference between horizontal versus vertical bar charts? I will spend time to look at your updates and will focus on the last one, for Segwit.
i had a little chat with a friend who is statistician and he said barcharts are the way to go (just like the article I shared earlier)
Vertical / Horizontal depends on the amount of data you have.
Personally, I will just keep pie charts if I have less than 5 values to compare. Otherwise, bar charts.
I think horizontal ones are more beautiful. But I like vertical ones as well.
That's helpfulness and beauty of bar charts. |
|
|
|
bitmover (OP)
Legendary
Online
Activity: 2282
Merit: 5878
bitcoindata.science
|
|
January 14, 2021, 02:39:51 AM
Last edit: January 14, 2021, 02:50:57 AM by bitmover Merited by Vod (1), tranthidung (1) |
|
You are a very hard-working guy, bitmover. Thanks. I had a lot of time to study JavaScript and python in this quarantine. I like to work on this. I think i will take a break now, before my next project (no plans yet) Thanks. However, the important thing is at the end, how do you feel about pie chart, bar chart and especially the difference between horizontal versus vertical bar charts?
i had a little chat with a friend who is statistician and he said barcharts are the way to go (just like the article I shared earlier) Vertical / Horizontal depends on the amount of data you have. Personally, I will just keep pie charts if I have less than 5 values to compare. Otherwise, bar charts. I think horizontal ones are more beautiful. But I like vertical ones as well. Edit: I will spend time to look at your updates and will focus on the last one, for Segwit.
I noticied some miners are really resistant to segwit Take a look for example EMCD in daily data. It mined 3 blocks. No empty blocks. How come they only have 37.2% segwit adoption while all others have 50%? They are intentionally removing segwit transactions, you can see that when you compare their total reward: it is lower than the others, only 7.08BTC per block, while the average is 7.36. I am thinking about sharing this kind of data in the mining board, but I am afraid of those moderators who just delete everything lol I think it is important that people become aware that some mining pools are getting lower rewards just to favor legacy transactions. Edit2: This can also be seen here: There are no miners in the bottom right side of the chart: Low Reward and High Adoption. But you can see many miners in the bottom left side: Low Reward and low adoption. All high reward miners are in the top right side: High Reward and High adoption. if you want to work with the raw data: https://loyce.club/bitmover/blockdata.lastweek.txthttps://loyce.club/blockdata/blockdata.lastday.txtI have all that data in json format in the domain, which I prefer. I can help you access it if you need. |
.
.BLACKJACK ♠ FUN. | | | ███▄██████
██████████████▀
████████████
█████████████████
████████████████▄▄
░█████████████▀░▀▀
██████████████████
░██████████████
█████████████████▄
░██████████████▀
████████████
███████████████░██
██████████ | | CRYPTO CASINO &
SPORTS BETTING | | │ | | │ | ▄▄███████▄▄
▄███████████████▄
███████████████████
█████████████████████
███████████████████████
█████████████████████████
█████████████████████████
█████████████████████████
███████████████████████
█████████████████████
███████████████████
▀███████████████▀
███████████████████ | | .
|
|
|
|
SFR10
Legendary
Offline
Activity: 2982
Merit: 3408
Crypto Swap Exchange
|
|
January 14, 2021, 03:47:00 AM |
|
Now you can just click on the button "last week" or "last day" to get the data you want (you will need to wait a few moments, 700kb file needs to be loaded)
How about a little modification to show results within certain blocks or dates? and my favorite one, the scatter plot of block reward x segwit adoption:
Stop flirting with my brain Here we can see that miners who put more segwit transacftions inside a block get more fee rewards. That's interesting. Indeed, it is interesting and it makes perfect [ish] sense I am thinking about sharing this kind of data in the mining board, but I am afraid of those moderators who just delete everything lol
I think we both know the moderator that clearly enjoys moderating that section in a strange way - He/she is the reason why I haven't posted or even lurked on those boards in the past few years. |
|
|
|
|


