Technical chart patterns are a popular analytical tool used by traders to identify potential trading opportunities. Analyzing chart patterns can provide valuable insights into market dynamics and the behavior of buyers and sellers. I wanted to share one of the articles about the bull flag pattern and how to use them effectively. Here is
the source where also you can find other chart patterns.
What is the Bull Flag Pattern?The bull flag is a bullish pattern that forms when the two upward price movements are separated by a short period of consolidation. The initial spike in the price is vertical, catching bears off-guard as buyers take over. This rise is represented by the flagpole. After the flagpole, usually, theres a retracement that forms a rectangular shape, with two parallel trendlines connecting the highs and lows which called as Flag Pattern.
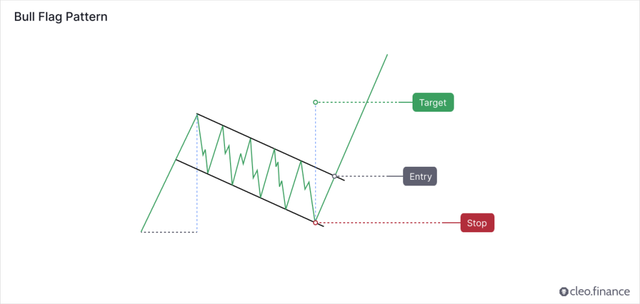
The breakout occurs when the upper resistance trendline is broken. This often leads to another uptrend move with prices surging toward the high of the formation.
Is the Bull Flag Pattern a Continuation or Reversal Pattern?Bull flag is generally considered to be a continuation pattern. It signals a pause or consolidation in a bullish trend before the price continues to move higher. When the price breaks out of the bull flag, it often continues its upward trend, usually with high trading volumes. It is generally not recommended to enter a trade at a random price in hopes of an extension to the upside. Instead, traders should look for either a break of an important resistance or a pullback.
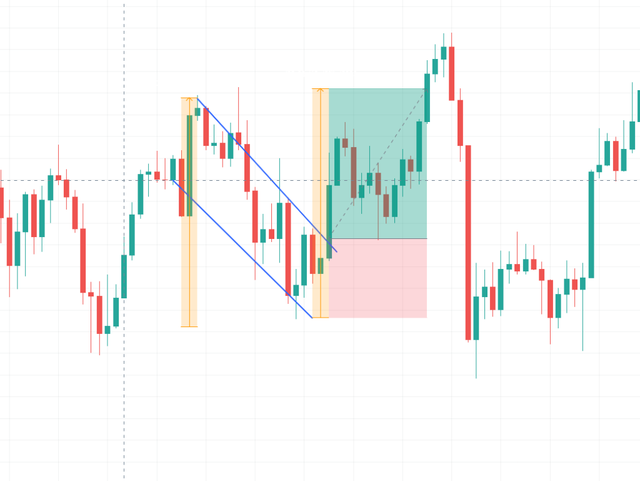
ETHUSDT H4 - Bull Flag Pattern
How to Identify a Good Bull Flag Pattern?In order the identify a good bull flag pattern there are some guidelines traders can follow. The bull flag pattern is a chart pattern that occurs during an uptrend. Traders should look for a sharp and quick price rise (flagpole) followed by a period of consolidation (flag) that is bounded by two parallel down-trending trend lines.
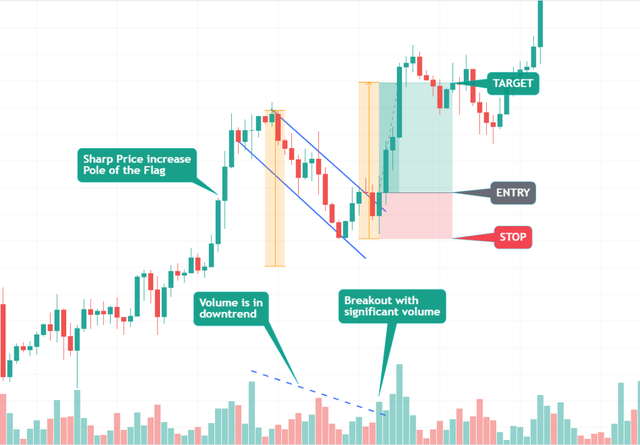
EURUSD H2 Bull Flag Pattern
Another characteristic to watch out for is the downward volume trend during the formation, however, diminishing volume is not an absolute rule. The breakout from the flag pattern should occur on high volume and confirm the continuation of the uptrend. The strength of the bull flag depends on how sharp the initial price spike was in the flagpole. During the consolidation phase, traders watch out for the price break up through the upper trendline and make a new high since it shows the bulls are in control again to push another rally.
Where to Place Target and Stop Loss?The target can be placed by measuring the distance from the start of the sharp price movement (the pole of the bull flag) to the point where the patterns lower trend line ends.
The stop loss can be placed below the lower trend line of the pattern. And you should aim for a risk-to-reward ratio of at least 2R. (for every 1 unit of risk you expect 2 units of reward).
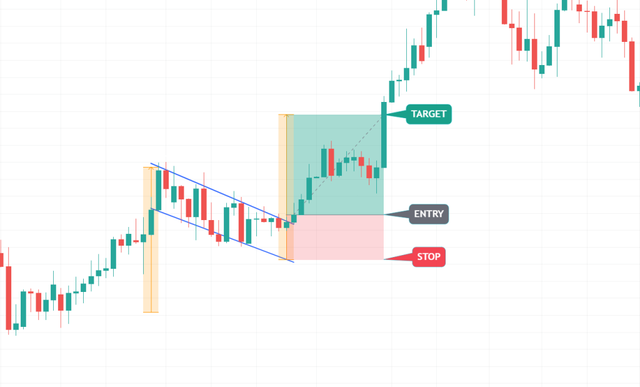
GBPUSD M30 Bull Flag Pattern
ConclusionThe bull flag typically occurs in an uptrend, characterized by a sharp and rapid increase in price (known as the flagpole), followed by a period of consolidation forming a flag shape. The volume is often in a downtrend during the consolidation phase, although this is not always the case. Traders should keep an eye on the price action during this period, looking for signs of a breakout above the upper trendline and a new high, which would signal that the bulls are regaining control and could push the price higher. Traders can achieve better results by using the pattern in conjunction with other technical indicators.


