placidhead
Newbie

 Offline Offline
Activity: 2
Merit: 0

|
 |
March 11, 2022, 06:29:40 PM |
|
Hey I was wondering if you could update the bitcoin regression equation? It looks like you said in 2021 it's updated regularly but I'm seeing that the last update was in 2017.
|
|
|
|
|
|
|
|
|
|
|
|
|
|
Be very wary of relying on JavaScript for security on crypto sites. The site can change the JavaScript at any time unless you take unusual precautions, and browsers are not generally known for their airtight security.
|
|
|
Advertised sites are not endorsed by the Bitcoin Forum. They may be unsafe, untrustworthy, or illegal in your jurisdiction.
|
|
|
|
|
JayJuanGee
Legendary
 Offline
Activity: 3696
Merit: 10148
Self-Custody is a right. Say no to"Non-custodial"
|
|
March 13, 2022, 01:01:39 AM |
|
Hey I was wondering if you could update the bitcoin regression equation? It looks like you said in 2021 it's updated regularly but I'm seeing that the last update was in 2017.
If you click on the link within hotpassion's post - two post above yours, then you will see that the update of the graph goes all the way to today's date. |
1) Self-Custody is a right. There is no such thing as "non-custodial" or "un-hosted." 2) ESG, KYC & AML are attack-vectors on Bitcoin to be avoided or minimized. 3) How much alt (shit)coin diversification is necessary? if you are into Bitcoin, then 0%......if you cannot control your gambling, then perhaps limit your alt(shit)coin exposure to less than 10% of your bitcoin size...Put BTC here: bc1q49wt0ddnj07wzzp6z7affw9ven7fztyhevqu9k
|
|
|
placidhead
Newbie
Offline
Activity: 2
Merit: 0
|
|
March 13, 2022, 06:01:18 PM |
|
If you click on the link within hotpassion's post - two post above yours, then you will see that the update of the graph goes all the way to today's date. This only goes back to 2012 and only forwards until 2025. I feel like Trolololo's graph was more accurate since it went farther back. I'd also like to forecast what bitcoin's value (the yellow line) might be in the long term. |
|
|
|
|
yurets_z
Newbie
Offline
Activity: 8
Merit: 5
|
|
May 09, 2022, 12:02:12 PM
Last edit: January 25, 2023, 09:59:55 PM by yurets_z |
|
Hey I was wondering if you could update the bitcoin regression equation? It looks like you said in 2021 it's updated regularly but I'm seeing that the last update was in 2017.
If you click on the link within hotpassion's post - two post above yours, then you will see that the update of the graph goes all the way to today's date. The graph is updated (current BTC price), but not the model from logarithmic regression. Currently, it looks smth like this https://i.ibb.co/wLTgwtw/BTC-Plan-29.pngP.S. I dunno how do you guys paste pictures here so they are displayed |
|
|
|
|
mmortal03
Legendary
Offline
Activity: 1762
Merit: 1010
|
|
May 22, 2022, 07:07:33 PM |
|
Bump! MoonMath.win is down. People should buy him some pizzas.
|
|
|
|
|
yurets_z
Newbie
Offline
Activity: 8
Merit: 5
|
|
May 24, 2022, 02:14:41 PM |
|
Now it's OK. But maybe it's time to slightly update the model behind it.
|
|
|
|
|
mmortal03
Legendary
Offline
Activity: 1762
Merit: 1010
|
|
June 18, 2022, 09:54:50 AM |
|
|
|
|
|
|
mmortal03
Legendary
Offline
Activity: 1762
Merit: 1010
|
|
August 21, 2022, 09:24:53 AM Merited by JayJuanGee (1) |
|
P.S. I dunno how do you guys paste pictures here so they are displayed
I think it works if it's a jpg.  |
|
|
|
|
dragonvslinux
Legendary
Offline
Activity: 1666
Merit: 2204
Crypto Swap Exchange
|
|
August 21, 2022, 12:27:08 PM
Last edit: September 10, 2023, 12:55:55 PM by dragonvslinux Merited by JayJuanGee (1) |
|
There's actually two slightly differing models here, if not more online by now, not just the blockchain center version of the chart. 1. https://www.blockchaincenter.net/en/bitcoin-rainbow-chart/2. https://www.lookintobitcoin.com/charts/bitcoin-rainbow-chart/I reference this as the LookIntoBitcoin version looks more relevant, as factors in the March 2020 low more accurately, as seems to have been adjusted to include it. 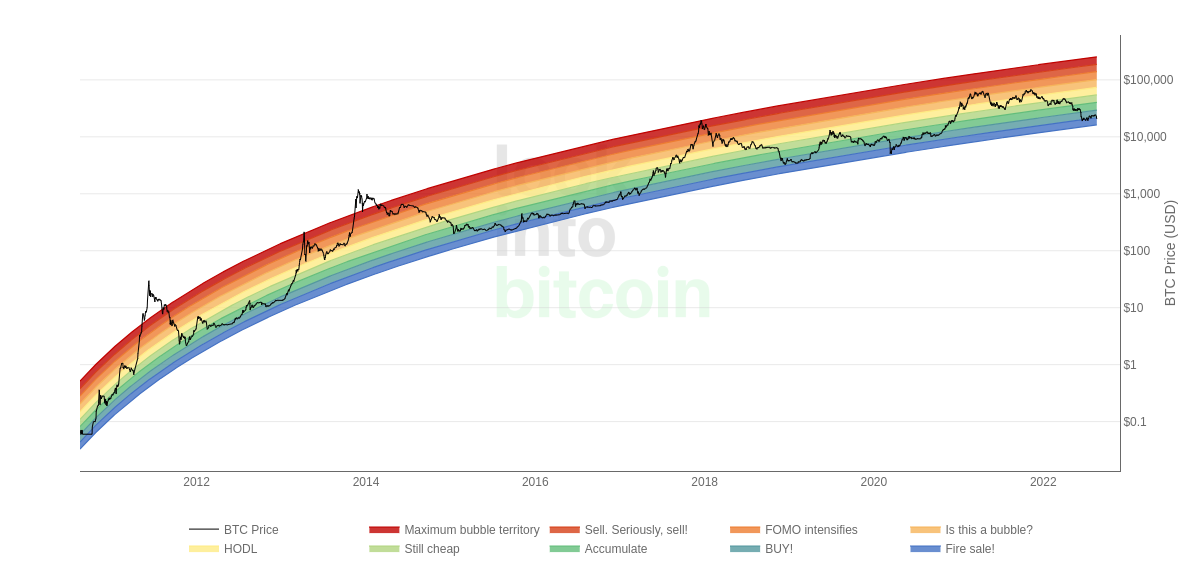 This chart also gives a bit more room to the downside potential, with the lower band at $16.2K whereas the other is around $18K if not mistaken. |
|
|
|
yurets_z
Newbie
Offline
Activity: 8
Merit: 5
|
|
August 23, 2022, 06:41:53 PM
Last edit: August 23, 2022, 06:52:13 PM by yurets_z Merited by NotATether (2) |
|
I reference this as the LookIntoBitcoin version looks more relevant, as factors in the March 2020 low more accurately, as seems to have been adjusted to include it.
You should always remember what is written on one of the referenced web pages: "The color bands follow a logarithmic regression (introduced by Bitcointalk User trolololo in 2014), but are otherwise completely arbitrary and without any scientific basis." |
|
|
|
|
dragonvslinux
Legendary
Offline
Activity: 1666
Merit: 2204
Crypto Swap Exchange
|
|
August 23, 2022, 07:48:54 PM |
|
I reference this as the LookIntoBitcoin version looks more relevant, as factors in the March 2020 low more accurately, as seems to have been adjusted to include it.
You should always remember what is written on one of the referenced web pages: "The color bands follow a logarithmic regression (introduced by Bitcointalk User trolololo in 2014), but are otherwise completely arbitrary and without any scientific basis." Clearly it's not arbitrary when LookIntoBitcoin have modified the logarithmic curve, and haven't referenced the fact it's arbitrary or lacks any scientific basis. Probably because it's a mathematical based curve, nothing to do with science. The irony being that a logarithmic curve in itself isn't arbitrary, it's simply how you style it (connect the dots), even if the original remains arbitrary and unchanged. |
|
|
|
yurets_z
Newbie
Offline
Activity: 8
Merit: 5
|
|
August 24, 2022, 05:35:20 AM
Last edit: January 25, 2023, 10:01:24 PM by yurets_z |
|
Clearly it's not arbitrary when LookIntoBitcoin have modified the logarithmic curve, and haven't referenced the fact it's arbitrary or lacks any scientific basis. Probably because it's a mathematical based curve, nothing to do with science. The irony being that a logarithmic curve in itself isn't arbitrary, it's simply how you style it (connect the dots), even if the original remains arbitrary and unchanged.
You didn't get me. The Log curve is an approximation of price history (logarithmic regression). That is the scientific part. But the rainbow is made by duplicating that curve parallel to itself with certain intervals that are not somehow "scientifically" linked to volatility, ATHs ant Lows. And it does not look like they have modified the curve either. Here is my view of the trend as for now https://i.ibb.co/wLTgwtw/BTC-Plan-29.jpg |
|
|
|
|
mmortal03
Legendary
Offline
Activity: 1762
Merit: 1010
|
|
August 24, 2022, 09:05:07 AM |
|
Clearly it's not arbitrary when LookIntoBitcoin have modified the logarithmic curve, and haven't referenced the fact it's arbitrary or lacks any scientific basis. Probably because it's a mathematical based curve, nothing to do with science. The irony being that a logarithmic curve in itself isn't arbitrary, it's simply how you style it (connect the dots), even if the original remains arbitrary and unchanged.
You didn't get me. The Log curve is an approximation of price history (logarithmic regression). That is the scientific part. But the rainbow is made by duplicating that curve parallel to itself with certain intervals that are not somehow "scientifically" linked to volatility, ATHs ant Lows. And it does not look like they have modified the curve either. Here is my view of the trend as for now https://i.ibb.co/q9MmZx3/BTC-Plan-17.pngLike I said, just change the file extension to jpg (the server already has it) and put it inside the img brackets and it will show the image: |
|
|
|
|
yurets_z
Newbie
Offline
Activity: 8
Merit: 5
|
|
August 24, 2022, 09:09:20 AM
Last edit: January 25, 2023, 10:03:06 PM by yurets_z Merited by JayJuanGee (1) |
|
Like I said, just change the file extension to jpg (the server already has it) and put it inside the img brackets and it will show the image:
Probably that does not work for the Newbie users https://i.ibb.co/wLTgwtw/BTC-Plan-29.jpg |
|
|
|
|
dragonvslinux
Legendary
Offline
Activity: 1666
Merit: 2204
Crypto Swap Exchange
|
|
August 24, 2022, 09:32:06 AM Merited by JayJuanGee (1) |
|
Clearly it's not arbitrary when LookIntoBitcoin have modified the logarithmic curve, and haven't referenced the fact it's arbitrary or lacks any scientific basis. Probably because it's a mathematical based curve, nothing to do with science. The irony being that a logarithmic curve in itself isn't arbitrary, it's simply how you style it (connect the dots), even if the original remains arbitrary and unchanged.
You didn't get me. The Log curve is an approximation of price history (logarithmic regression). That is the scientific part. But the rainbow is made by duplicating that curve parallel to itself with certain intervals that are not somehow "scientifically" linked to volatility, ATHs ant Lows. And it does not look like they have modified the curve either. Here is my view of the trend as for now Fair enough I hear ya. Looks like blockchaincenter have had a botched version for sometime now then, as clearly it's very different than how it should be, for whatever reason. Thanks for pointing out which one is more accurate, I'll stick to the lookintobitcoin version from now on, even if it's not clear if this is based on the original model: The first example of a logarithmic regression curve for Bitcoin was created by Bitcoin Talk user trolololo. This is the original chart [chart below], which shows how $BTC price could potentially evolve over time using log growth regression analysis: It seems they are almost implying this is a different version of the rainbow chart (no copyright) that's based on logarithmic values, but not necessarily the "original hard-coded version". If you look more in-depth, I think you'll find it is slightly different (look at the March 2020 lows as well as current price), because ultimately they've made a good effort to remove any confirmation that they using the original arbitrary version. This is why I said it's not arbitrary anymore, as there are two versions (if not more), even if it should be but only when based on the original (that has no copyright). |
|
|
|
yurets_z
Newbie
Offline
Activity: 8
Merit: 5
|
|
August 24, 2022, 09:57:40 AM |
|
@dragonvslinux
Concerning the model, I believe the curve should be updated after adding new historical data to it. At least that is what I do to build the plot that I use for my forecasts.
|
|
|
|
|
|
Trolololo (OP)
|
|
September 20, 2022, 04:52:28 PM |
|
@dragonvslinux
(...) the curve should be updated after adding new historical data to it (...)
That is correct. |
|
|
|
|
mmortal03
Legendary
Offline
Activity: 1762
Merit: 1010
|
|
November 09, 2022, 12:08:31 AM |
|
I prefer the lookintobitcoin one, but, unfortunately, it only updates at a resolution of one day, so it isn't necessarily showing the lowest price points (or, if it does, it doesn't show them in the middle of the day while it's happening). |
|
|
|
|
|
|
of00160
Newbie
Offline
Activity: 8
Merit: 1
|
|
November 20, 2022, 01:18:48 AM |
|
@dragonvslinux
(...) the curve should be updated after adding new historical data to it (...)
That is correct. Great to have you back Trolololo |
|
|
|
|
|


