|
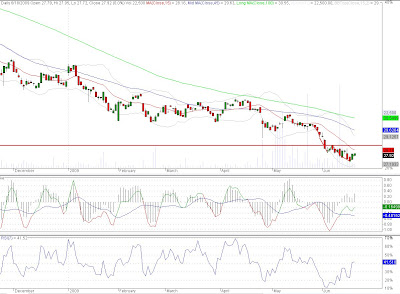
Title: The Log Chart Myth Post by: N12 on September 06, 2011, 06:46:15 PM Does this really like like a healthy, historically normal correction to you?
https://i.imgur.com/b3kaH.png Title: Re: The Log Chart Myth Post by: NothinG on September 06, 2011, 06:54:26 PM I don't see why everyone has their panties in a wad.
Title: Re: The Log Chart Myth Post by: N12 on September 06, 2011, 06:56:12 PM I don't see why everyone has their panties in a wad. Because there is a lot at stake.Will the log chartists please stand up? Show me evidence this is a normal correction and not an exceptionally deep and long one! Title: Re: The Log Chart Myth Post by: Elwar on September 06, 2011, 06:58:27 PM This:
http://1.bp.blogspot.com/_0jshcRmzyKA/Sjtm8Mw7shI/AAAAAAAAXQg/6qOS8UaGhOM/s400/ScreenHunter_7258.jpg Title: Re: The Log Chart Myth Post by: fcmatt on September 06, 2011, 06:59:35 PM This: http://1.bp.blogspot.com/_0jshcRmzyKA/Sjtm8Mw7shI/AAAAAAAAXQg/6qOS8UaGhOM/s400/ScreenHunter_7258.jpg Hey Elwar, you did not start your chart at 0.000001. Why is that? Are you trying to show some type of bias here that others who post a chart starting at .000001 do not seem to have? ;-) Title: Re: The Log Chart Myth Post by: Jixtreme on September 06, 2011, 06:59:58 PM *standing*
Math major here, vouching for log chart. Title: Re: The Log Chart Myth Post by: Elwar on September 06, 2011, 07:01:14 PM This: http://1.bp.blogspot.com/_0jshcRmzyKA/Sjtm8Mw7shI/AAAAAAAAXQg/6qOS8UaGhOM/s400/ScreenHunter_7258.jpg Hey Elwar, you did not start your chart at 0.000001. Why is that? Are you trying to show some type of bias here that others who post a chart starting at .000001 do not seem to have? ;-) The random chart I found on the Internet did not start at .000001 I just wanted to feel included in the chart posting. :P Title: Re: The Log Chart Myth Post by: ElectricMucus on September 06, 2011, 07:12:58 PM Log chartist reporting.
What's up? 8) srsly what's your problem, just thing of it this way: Blow up the chart to 2030 or so and draw a tanh() funtion over it. It only behaves linearly (or exponential on a linear chart) because we are looking at a small fraction of it. here did that for ya: http://img694.imageshack.us/img694/984/uselesspredictionchart.png Title: Re: The Log Chart Myth Post by: greyhawk on September 06, 2011, 07:27:30 PM I scrolled to the end of that huge picture in hope there was a funny ending to it.
There wasn't. :( Title: Re: The Log Chart Myth Post by: ElectricMucus on September 06, 2011, 07:36:31 PM I scrolled to the end of that huge picture in hope there was a funny ending to it. k fixedThere wasn't. :( Sorry not very creative :-\ Title: Re: The Log Chart Myth Post by: d'aniel on September 06, 2011, 07:42:26 PM Log chartist reporting. Are you modelling the diffusion of Bitcoin with the logistic differential equation? Is that why you used tanh?What's up? 8) srsly what's your problem, just thing of it this way: Blow up the chart to 2030 or so and draw a tanh() funtion over it. It only behaves linearly (or exponential on a linear chart) because we are looking at a small fraction of it. Title: Re: The Log Chart Myth Post by: ElectricMucus on September 06, 2011, 07:44:02 PM Log chartist reporting. Are you modelling the diffusion of Bitcoin with the logistic differential equation? Is that why you used tanh?What's up? 8) srsly what's your problem, just thing of it this way: Blow up the chart to 2030 or so and draw a tanh() funtion over it. It only behaves linearly (or exponential on a linear chart) because we are looking at a small fraction of it. But you might be on to something here ;) Title: Re: The Log Chart Myth Post by: d'aniel on September 06, 2011, 08:02:18 PM Log chartist reporting. Are you modelling the diffusion of Bitcoin with the logistic differential equation? Is that why you used tanh?What's up? 8) srsly what's your problem, just thing of it this way: Blow up the chart to 2030 or so and draw a tanh() funtion over it. It only behaves linearly (or exponential on a linear chart) because we are looking at a small fraction of it. But you might be on to something here ;) Title: Re: The Log Chart Myth Post by: ElectricMucus on September 06, 2011, 08:08:15 PM Log chartist reporting. Are you modelling the diffusion of Bitcoin with the logistic differential equation? Is that why you used tanh?What's up? 8) srsly what's your problem, just thing of it this way: Blow up the chart to 2030 or so and draw a tanh() funtion over it. It only behaves linearly (or exponential on a linear chart) because we are looking at a small fraction of it. But you might be on to something here ;) thanks, I've already looked it up, pretty interesting. But we have a problem: Scaling the function to the actual data would be quite a demanding task, and would require skillfull programming instead of naive curve drawing by hand ;D Title: Re: The Log Chart Myth Post by: wee baby seamus on September 06, 2011, 08:40:39 PM are you guys just drawing lines with paint, or are you actually fitting to some curve or something? nothing's properly labeled so I can't tell, but it seems like you're just making this shit up
Title: Re: The Log Chart Myth Post by: Synaptic on September 06, 2011, 08:42:07 PM are you guys just drawing lines with paint, or are you actually fitting to some curve or something? nothing's properly labeled so I can't tell, but it seems like you're just making this shit up Welcome to Bitcoin. Please purchase your tokens now. Title: Re: The Log Chart Myth Post by: d'aniel on September 06, 2011, 08:43:04 PM Log chartist reporting. Are you modelling the diffusion of Bitcoin with the logistic differential equation? Is that why you used tanh?What's up? 8) srsly what's your problem, just thing of it this way: Blow up the chart to 2030 or so and draw a tanh() funtion over it. It only behaves linearly (or exponential on a linear chart) because we are looking at a small fraction of it. But you might be on to something here ;) thanks, I've already looked it up, pretty interesting. But we have a problem: Scaling the function to the actual data would be quite a demanding task, and would require skillfull programming instead of naive curve drawing by hand ;D Plus, I think you'd want to use the linear scaling when fitting the logistic function. Would be a pretty bad fit, then :) Title: Re: The Log Chart Myth Post by: d'aniel on September 06, 2011, 08:49:00 PM are you guys just drawing lines with paint, or are you actually fitting to some curve or something? nothing's properly labeled so I can't tell, but it seems like you're just making this shit up Mostly just having fun with some math.I wouldn't place much confidence in the predictive power of this model. Too many significant hurdles yet to be overcome to say it's just a simple matter of spreading the word. Title: Re: The Log Chart Myth Post by: Minsc on September 06, 2011, 11:38:42 PM Title: Re: The Log Chart Myth Post by: Surawit on September 06, 2011, 11:51:39 PM You don't need to use a log chart. Simply view the standard price chart
http://bitcoincharts.com/charts/mtgoxUSD#rg60zvztgSzm1g10zm2g25 > set axis to 6-months Now, you simply apply a Milton-Keynesian correction transform to the market data, like so: https://i.imgur.com/qqtEf.png Using this metric it is clear the value of bitcoin has stabilised on the horizontal. BUY BUY BUY Title: Re: The Log Chart Myth Post by: NothinG on September 06, 2011, 11:54:53 PM You don't need to use a log chart. Simply view the standard price chart That made my laugh harder than it should.http://bitcoincharts.com/charts/mtgoxUSD#rg60zvztgSzm1g10zm2g25 > set axis to 6-months Now, you simply apply a Milton-Keynesian correction transform to the market data, like so: Using this metric it is clear the value of bitcoin has stabilised on the horizontal. BUY BUY BUY Title: Re: The Log Chart Myth Post by: mute20 on September 07, 2011, 12:12:00 AM You don't need to use a log chart. Simply view the standard price chart That made my laugh harder than it should.http://bitcoincharts.com/charts/mtgoxUSD#rg60zvztgSzm1g10zm2g25 > set axis to 6-months Now, you simply apply a Milton-Keynesian correction transform to the market data, like so: Using this metric it is clear the value of bitcoin has stabilised on the horizontal. BUY BUY BUY That caught me off guard to. Seems funnier the more I look at it. Title: Re: The Log Chart Myth Post by: Cluster2k on September 07, 2011, 12:26:56 AM The log chart is distorted as it includes essentially irrelevant data when bitcoins were worth a few cents each. While it's valid to include the data (it's factual) it's also irrelevant to bitcoin users today. So what that the price now is still 1000 times higher than it was a year ago? It doesn't change the fact that bitcoin's value is down almost 75% from its peak.
Maybe the Japanese can use log graphs of the Nikkei Index starting from the 1970s to make themselves feel better. They are still in a bull market today! ::) Title: Re: The Log Chart Myth Post by: d'aniel on September 07, 2011, 12:44:54 AM The log chart is distorted as it includes essentially irrelevant data when bitcoins were worth a few cents each. While it's valid to include the data (it's factual) it's also irrelevant to bitcoin users today. So what that the price now is still 1000 times higher than it was a year ago? It doesn't change the fact that bitcoin's value is down almost 75% from its peak. Does this one make you happier?http://bitcoincharts.com/charts/chart.png?width=947&m=mtgoxUSD&k=&r=120&i=&c=0&s=&e=&Prev=&Next=&v=1&cv=0&ps=0&l=1&p=0&t=S&b=&a1=&m1=10&a2=&m2=25&x=0&i1=&i2=&i3=&i4=&SubmitButton=Draw& Title: Re: The Log Chart Myth Post by: ElectricMucus on September 07, 2011, 12:46:14 AM I find the hostility towards it very amusing and that all the naysayers come up with comparisons our the fiat money world even more so. ;D
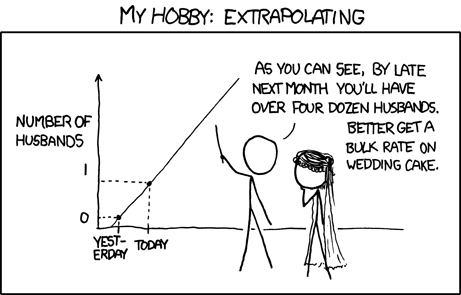
Since I am the one who has drawn this trend lines you deserve at least some explanation: ;) These lines will obviously be broken at some point but when is irrelevant since you cant put a real world value on the entire potential supply of USD. Alot of emotional detachment is needed to view this trend with a rational mind. So to make it easier for you just replace the USD with bytes of computer memory, if you think about it a little you know what I mean :P Title: Re: The Log Chart Myth Post by: Minsc on September 07, 2011, 12:58:02 AM I find the hostility towards it very amusing and that all the naysayers come up with comparisons our the fiat money world even more so. ;D Since I am the one who has drawn this trend lines you deserve at least some explanation: ;) These lines will obviously be broken at some point but when is irrelevant since you cant put a real world value on the entire potential supply of USD. Alot of emotional detachment is needed to view this trend with a rational mind. So to make it easier for you just replace the USD with bytes of computer memory, if you think about it a little you know what I mean :P http://imgs.xkcd.com/comics/extrapolating.png http://www.minyanville.com/assets/Image/tulipmania.jpg Title: Re: The Log Chart Myth Post by: ElectricMucus on September 07, 2011, 01:06:41 AM awsome you posted the same pic twice in two different threads.
Welcome to my shitlist ;D Title: Re: The Log Chart Myth Post by: mmortal03 on September 07, 2011, 01:07:27 AM If it's already mapped to a log scale, and it STILL looks parabolic, then you know it's probably oversold. Silver did this earlier this year, then corrected. Now, that doesn't mean bitcoin still won't go down, though, but this hasn't been tulip mania just yet. Title: Re: The Log Chart Myth Post by: Minsc on September 07, 2011, 01:08:49 AM Now, that doesn't mean bitcoin still won't go down, though, but this hasn't been tulip mania just yet. Unless you can buy most things with these coins, they are a bad investment. Tulip mania. Title: Re: The Log Chart Myth Post by: RandyFolds on September 07, 2011, 01:12:39 AM The log chart is distorted as it includes essentially irrelevant data when bitcoins were worth a few cents each. While it's valid to include the data (it's factual) it's also irrelevant to bitcoin users today. So what that the price now is still 1000 times higher than it was a year ago? It doesn't change the fact that bitcoin's value is down almost 75% from its peak. Maybe the Japanese can use log graphs of the Nikkei Index starting from the 1970s to make themselves feel better. They are still in a bull market today! ::) The log chart is distorted as it includes history? C'mon, man. That is just retarded. It's relevant to users today in as much as the current price is relevant. Do you buy stocks by only looking at today's price? Hey, XXX is trading at $23. That seems like a pretty cool number... Title: Re: The Log Chart Myth Post by: Minsc on September 07, 2011, 01:24:55 AM awsome you posted the same pic twice in two different threads. Welcome to my shitlist ;D Hey you just proved your charts are wrong because you refuse to take criticism. Title: Re: The Log Chart Myth Post by: Surawit on September 07, 2011, 01:27:15 AM The log chart is distorted as it includes history? C'mon, man. That is just retarded. It's relevant to users today in as much as the current price is relevant. You are just retardedDo you buy stocks by only looking at today's price? Hey, XXX is trading at $23. That seems like a pretty cool number... When you look at historical data for a company... that company hasn't changed much in the last few years. Roughly the same number of employees doing the same shit. The price of bitcoin in its infancy is irrelevant because it had a totally different userbase. It used to be a very small group of people doing it as a nerdy project. Now we have several orders of magnitude more participants, and they have markedly different motivations from the original group (!!!$$$get rich quick$$$!!!). It's a totally different market after the wave of publicity in May-June Title: Re: The Log Chart Myth Post by: Minsc on September 07, 2011, 01:28:51 AM The price of bitcoin in its infancy is irrelevant because it had a totally different userbase. It used to be a very small group of people doing it as a nerdy project. Now we have several orders of magnitude more participants, and they have markedly different motivations from the original group (!!!$$$get rich quick$$$!!!). It's a totally different market after the wave of publicity in May-June Yes, people making linear charts are just dead innacurate. People need to see bitcoin frenzy this summer as like a gasoline fire. Title: Re: The Log Chart Myth Post by: RandyFolds on September 07, 2011, 02:35:50 AM You are just retarded When you look at historical data for a company... that company hasn't changed much in the last few years. Roughly the same number of employees doing the same shit. The price of bitcoin in its infancy is irrelevant because it had a totally different userbase. It used to be a very small group of people doing it as a nerdy project. Now we have several orders of magnitude more participants, and they have markedly different motivations from the original group (!!!$$$get rich quick$$$!!!). It's a totally different market after the wave of publicity in May-June But you think selecting specifically for an anomalous series is accurate? It's short-sighted and basically just sounds like early-investory-i'm-jelly syndrome, which is spreading on this forum like mouth herpes at a rave. Title: Re: The Log Chart Myth Post by: nmat on September 07, 2011, 02:57:33 AM Honestly, none of the graphs really work if you are in for long term predictions (since you are including 1 year of data, I assume we are talking about mid/long term). An year ago we had like 10 people with great technical knowlege. Right now, we have 1000 people and 90% only wants to profit. Next year, bitcon could be outlawed, completely dead or it could be flourishing.
There are a lot of changes in the userbase and in the environment surrounding bitcons that make it very very difficult to predict long term prices (with or without charts). Title: Re: The Log Chart Myth Post by: Surawit on September 07, 2011, 03:06:23 AM But you think selecting specifically for an anomalous series is accurate? It's short-sighted and basically just sounds like early-investory-i'm-jelly syndrome, which is spreading on this forum like mouth herpes at a rave. Not 'jelly' of someone who wins the lottery. Or someone who gets in on the ground floor of a pyramid scam and makes some cash. In both cases both have made some money against the odds, and can't really claim anything but blind luck. The same goes with bitcoins.I don't think it's short sighted at all to divide things into pre/post publicity blitz. The 'early investors' came in April/May 2011. Before that I wouldn't describe the people using bitcoin way before that as investors.... maybe 'bitcoin enthusiasts' would be a better term. Do you think the guy who bought a pizza for 20000 bitcoins was an 'early investor'? Hugely different number of people with hugely different motivations = hugely different market, sorry Title: Re: The Log Chart Myth Post by: RandyFolds on September 07, 2011, 03:16:18 AM But you think selecting specifically for an anomalous series is accurate? It's short-sighted and basically just sounds like early-investory-i'm-jelly syndrome, which is spreading on this forum like mouth herpes at a rave. Not 'jelly' of someone who wins the lottery. Or someone who gets in on the ground floor of a pyramid scam and makes some cash. In both cases both have made some money against the odds, and can't really claim anything but blind luck. The same goes with bitcoins.I don't think it's short sighted at all to divide things into pre/post publicity blitz. The 'early investors' came in April/May 2011. Before that I wouldn't describe the people using bitcoin way before that as investors.... maybe 'bitcoin enthusiasts' would be a better term. Do you think the guy who bought a pizza for 20000 bitcoins was an 'early investor'? Hugely different number of people with hugely different motivations = hugely different market, sorry So I said investor instead of adopter. I'm such an asshole for that slip in semantics. Title: Re: The Log Chart Myth Post by: Synaptic on September 07, 2011, 03:17:33 AM But you think selecting specifically for an anomalous series is accurate? It's short-sighted and basically just sounds like early-investory-i'm-jelly syndrome, which is spreading on this forum like mouth herpes at a rave. Not 'jelly' of someone who wins the lottery. Or someone who gets in on the ground floor of a pyramid scam and makes some cash. In both cases both have made some money against the odds, and can't really claim anything but blind luck. The same goes with bitcoins.I don't think it's short sighted at all to divide things into pre/post publicity blitz. The 'early investors' came in April/May 2011. Before that I wouldn't describe the people using bitcoin way before that as investors.... maybe 'bitcoin enthusiasts' would be a better term. Do you think the guy who bought a pizza for 20000 bitcoins was an 'early investor'? Hugely different number of people with hugely different motivations = hugely different market, sorry So I said investor instead of adopter. I'm such an asshole for that slip in semantics. Yeah, fuck you, asshole! GTFO. Title: Re: The Log Chart Myth Post by: Surawit on September 07, 2011, 03:23:29 AM So I said investor instead of adopter. I'm such an asshole for that slip in semantics. It's not semantics at all. Investors have very different motivations than adoptersThis is what it looks like when a bunch of investors suddenly jump into a market http://www.minyanville.com/assets/Image/tulipmania.jpg Does that shape look familiar perchance? Title: Re: The Log Chart Myth Post by: RandyFolds on September 07, 2011, 03:44:31 AM Poor choice of words then. Jesus christ...now you are definitely arguing semantics. Just keep posting that tulip graph over and over. I am sure it has some sort of point.
Title: Re: The Log Chart Myth Post by: d'aniel on September 07, 2011, 03:45:58 AM Honestly, none of the graphs really work if you are in for long term predictions (since you are including 1 year of data, I assume we are talking about mid/long term). An year ago we had like 10 people with great technical knowlege. Right now, we have 1000 people and 90% only wants to profit. Next year, bitcon could be outlawed, completely dead or it could be flourishing. I think you're mistaken. We're not looking to make predictions from these graphs (at least I'm not, and neither was niko). They simply present a story about the past.There are a lot of changes in the userbase and in the environment surrounding bitcons that make it very very difficult to predict long term prices (with or without charts). Title: Re: The Log Chart Myth Post by: d'aniel on September 07, 2011, 03:56:57 AM I don't think it's short sighted at all to divide things into pre/post publicity blitz. The 'early investors' came in April/May 2011. Before that I wouldn't describe the people using bitcoin way before that as investors.... maybe 'bitcoin enthusiasts' would be a better term. Do you think the guy who bought a pizza for 20000 bitcoins was an 'early investor'? Hugely different number of people with hugely different motivations = hugely different market, sorry I agree with your reasoning. This one tells the story of the bubble alone:http://bitcoincharts.com/charts/chart.png?width=947&m=mtgoxUSD&k=&r=150&i=&c=0&s=&e=&Prev=&Next=&v=1&cv=0&ps=0&l=1&p=0&t=S&b=&a1=&m1=10&a2=&m2=25&x=0&i1=&i2=&i3=&i4=&SubmitButton=Draw& Could be a long ride down if none of the capital accumulated during the media blitz ends up sticking. I'd bet at least some will, though. Title: Re: The Log Chart Myth Post by: osmosis on September 07, 2011, 04:01:53 AM Now, that doesn't mean bitcoin still won't go down, though, but this hasn't been tulip mania just yet. Unless you can buy most things with these coins, they are a bad investment. Tulip mania. read: Unless everyone else is already using them, they are a bad investment. Title: Re: The Log Chart Myth Post by: d'aniel on September 07, 2011, 04:05:13 AM Now, that doesn't mean bitcoin still won't go down, though, but this hasn't been tulip mania just yet. Unless you can buy most things with these coins, they are a bad investment. Tulip mania. read: Unless everyone else is already using them, they are a bad investment. Title: Re: The Log Chart Myth Post by: phelix on September 07, 2011, 09:39:13 AM Log chartist reporting. What's up? 8) srsly what's your problem, just thing of it this way: Blow up the chart to 2030 or so and draw a tanh() funtion over it. It only behaves linearly (or exponential on a linear chart) because we are looking at a small fraction of it. [...] You don't need to use a log chart. Simply view the standard price chart http://bitcoincharts.com/charts/mtgoxUSD#rg60zvztgSzm1g10zm2g25 > set axis to 6-months Now, you simply apply a Milton-Keynesian correction transform to the market data, like so: [...] +1 to you guys! hilarious pics! zlolz Title: Re: The Log Chart Myth Post by: netrin on September 09, 2011, 02:17:12 AM The log chart tells a story that is completely lost in a linear graph. A jump from .1 to .2 is just as much a surprise as 1 to 2 or 10 to 20. When the DJI gains or loses 100 points it's not news, but if an ounce of silver gained 100 against the dollar it would be in headlines. It's all relative and logarithms capture the relativity. Certainly bitcoin's $32 in June was the peak of a bubble and the log chart shows just how remarkable that was relative to two previous peaks. It explains why the market is in despair right now while reminding the mathematically inclined that the price is well within the historical trend.
http://genaud.net/bitcoin/2011/20110908-2350.png Title: Re: The Log Chart Myth Post by: mute20 on September 09, 2011, 02:41:27 AM The log chart tells a story that is completely lost in a linear graph. A jump from .1 to .2 is just as much a surprise as 1 to 2 or 10 to 20. When the DJI gains or loses 100 points it's not news, but if an ounce of silver gained 100 against the dollar it would be in headlines. It's all relative and logarithms capture the relativity. Certainly bitcoin's $32 in June was the peak of a bubble and the log chart shows just how remarkable that was relative to two previous peaks. It explains why the market is in despair right now while reminding the mathematically inclined that the price is well within the historical trend. http://genaud.net/bitcoin/2011/20110908-2350.png Looks good. Since I am a casual miner and this was a investment just as a upgrade for my last card. I know many think of it in the short term for the most part. Every week we see many calling "doomsday" for bitcoins. I am sure the big investors know better and will just buy up when the price is low. Title: Re: The Log Chart Myth Post by: Gerken on September 09, 2011, 02:53:49 AM Quote I am sure the big investors know better and will just buy up when the price is low. Sure they will, we won't be the only one left holding the bag. Right guys? Guys? https://i.imgur.com/Ky3rH.gif |