N12 (OP)
Donator
Legendary

 Offline Offline
Activity: 1610
Merit: 1010

|
 |
September 06, 2011, 06:46:15 PM |
|
Does this really like like a healthy, historically normal correction to you?  |
|
|
|
|
|
|
|
|
|
There are several different types of Bitcoin clients. The most secure are full nodes like Bitcoin Core, which will follow the rules of the network no matter what miners do. Even if every miner decided to create 1000 bitcoins per block, full nodes would stick to the rules and reject those blocks.
|
|
|
Advertised sites are not endorsed by the Bitcoin Forum. They may be unsafe, untrustworthy, or illegal in your jurisdiction.
|
|
|
|
|
|
NothinG
|
|
September 06, 2011, 06:54:26 PM |
|
I don't see why everyone has their panties in a wad.
|
|
|
|
N12 (OP)
Donator
Legendary
Offline
Activity: 1610
Merit: 1010
|
|
September 06, 2011, 06:56:12 PM |
|
I don't see why everyone has their panties in a wad.
Because there is a lot at stake. Will the log chartists please stand up? Show me evidence this is a normal correction and not an exceptionally deep and long one! |
|
|
|
|
Elwar
Legendary
 Offline
Activity: 3598
Merit: 2386
Viva Ut Vivas

|
|
September 06, 2011, 06:58:27 PM |
|
This: 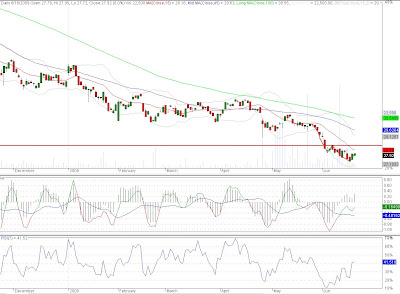 |
First seastead company actually selling sea homes: Ocean Builders https://ocean.builders Of course we accept bitcoin. |
|
|
fcmatt
Legendary
Offline
Activity: 2072
Merit: 1001
|
|
September 06, 2011, 06:59:35 PM |
|
This: Hey Elwar, you did not start your chart at 0.000001. Why is that? Are you trying to show some type of bias here that others who post a chart starting at .000001 do not seem to have? ;-) |
|
|
|
|
|
Jixtreme
|
|
September 06, 2011, 06:59:58 PM |
|
*standing*
Math major here, vouching for log chart.
|
|
|
|
|
Elwar
Legendary
Offline
Activity: 3598
Merit: 2386
Viva Ut Vivas
|
|
September 06, 2011, 07:01:14 PM |
|
This: Hey Elwar, you did not start your chart at 0.000001. Why is that? Are you trying to show some type of bias here that others who post a chart starting at .000001 do not seem to have? ;-) The random chart I found on the Internet did not start at .000001 I just wanted to feel included in the chart posting.  |
First seastead company actually selling sea homes: Ocean Builders https://ocean.builders Of course we accept bitcoin. |
|
|
ElectricMucus
Legendary
Offline
Activity: 1666
Merit: 1057
Marketing manager - GO MP
|
|
September 06, 2011, 07:12:58 PM
Last edit: September 06, 2011, 07:35:59 PM by ElectricMucus |
|
Log chartist reporting. What's up?  srsly what's your problem, just thing of it this way: Blow up the chart to 2030 or so and draw a tanh() funtion over it. It only behaves linearly (or exponential on a linear chart) because we are looking at a small fraction of it. here did that for ya:  |
|
|
|
|
|
greyhawk
|
|
September 06, 2011, 07:27:30 PM |
|
I scrolled to the end of that huge picture in hope there was a funny ending to it. There wasn't.  |
|
|
|
|
ElectricMucus
Legendary
Offline
Activity: 1666
Merit: 1057
Marketing manager - GO MP
|
|
September 06, 2011, 07:36:31 PM |
|
I scrolled to the end of that huge picture in hope there was a funny ending to it. There wasn't. k fixed Sorry not very creative  |
|
|
|
|
|
d'aniel
|
|
September 06, 2011, 07:42:26 PM |
|
Log chartist reporting. What's up? srsly what's your problem, just thing of it this way: Blow up the chart to 2030 or so and draw a tanh() funtion over it. It only behaves linearly (or exponential on a linear chart) because we are looking at a small fraction of it. Are you modelling the diffusion of Bitcoin with the logistic differential equation? Is that why you used tanh? |
|
|
|
|
ElectricMucus
Legendary
Offline
Activity: 1666
Merit: 1057
Marketing manager - GO MP
|
|
September 06, 2011, 07:44:02 PM |
|
Log chartist reporting. What's up? srsly what's your problem, just thing of it this way: Blow up the chart to 2030 or so and draw a tanh() funtion over it. It only behaves linearly (or exponential on a linear chart) because we are looking at a small fraction of it. Are you modelling the diffusion of Bitcoin with the logistic differential equation? Is that why you used tanh? I'm sorry I have no idea what you are talking about But you might be on to something here  |
|
|
|
|
|
d'aniel
|
|
September 06, 2011, 08:02:18 PM |
|
Log chartist reporting. What's up? srsly what's your problem, just thing of it this way: Blow up the chart to 2030 or so and draw a tanh() funtion over it. It only behaves linearly (or exponential on a linear chart) because we are looking at a small fraction of it. Are you modelling the diffusion of Bitcoin with the logistic differential equation? Is that why you used tanh? I'm sorry I have no idea what you are talking about But you might be on to something here Oh. If you're interested: http://en.wikipedia.org/wiki/Diffusion_of_innovations. Notice the graph at the top of the page, and the "logistic function" link underneath. |
|
|
|
|
ElectricMucus
Legendary
Offline
Activity: 1666
Merit: 1057
Marketing manager - GO MP
|
|
September 06, 2011, 08:08:15 PM |
|
Log chartist reporting. What's up? srsly what's your problem, just thing of it this way: Blow up the chart to 2030 or so and draw a tanh() funtion over it. It only behaves linearly (or exponential on a linear chart) because we are looking at a small fraction of it. Are you modelling the diffusion of Bitcoin with the logistic differential equation? Is that why you used tanh? I'm sorry I have no idea what you are talking about But you might be on to something here Oh. If you're interested: http://en.wikipedia.org/wiki/Diffusion_of_innovations. Notice the graph at the top of the page, and the "logistic function" link underneath. thanks, I've already looked it up, pretty interesting. But we have a problem: Scaling the function to the actual data would be quite a demanding task, and would require skillfull programming instead of naive curve drawing by hand  |
|
|
|
|
wee baby seamus
Newbie
 Offline
Activity: 15
Merit: 0
|
|
September 06, 2011, 08:40:39 PM |
|
are you guys just drawing lines with paint, or are you actually fitting to some curve or something? nothing's properly labeled so I can't tell, but it seems like you're just making this shit up
|
|
|
|
|
Synaptic
Member
Offline
Activity: 84
Merit: 10
|
|
September 06, 2011, 08:42:07 PM |
|
are you guys just drawing lines with paint, or are you actually fitting to some curve or something? nothing's properly labeled so I can't tell, but it seems like you're just making this shit up
Welcome to Bitcoin. Please purchase your tokens now. |
|
|
|
|
|
d'aniel
|
|
September 06, 2011, 08:43:04 PM |
|
Log chartist reporting. What's up? srsly what's your problem, just thing of it this way: Blow up the chart to 2030 or so and draw a tanh() funtion over it. It only behaves linearly (or exponential on a linear chart) because we are looking at a small fraction of it. Are you modelling the diffusion of Bitcoin with the logistic differential equation? Is that why you used tanh? I'm sorry I have no idea what you are talking about But you might be on to something here Oh. If you're interested: http://en.wikipedia.org/wiki/Diffusion_of_innovations. Notice the graph at the top of the page, and the "logistic function" link underneath. thanks, I've already looked it up, pretty interesting. But we have a problem: Scaling the function to the actual data would be quite a demanding task, and would require skillfull programming instead of naive curve drawing by hand lol Plus, I think you'd want to use the linear scaling when fitting the logistic function. Would be a pretty bad fit, then  |
|
|
|
|
|
d'aniel
|
|
September 06, 2011, 08:49:00 PM |
|
are you guys just drawing lines with paint, or are you actually fitting to some curve or something? nothing's properly labeled so I can't tell, but it seems like you're just making this shit up
Mostly just having fun with some math. I wouldn't place much confidence in the predictive power of this model. Too many significant hurdles yet to be overcome to say it's just a simple matter of spreading the word. |
|
|
|
|
|
Minsc
|
|
September 06, 2011, 11:38:42 PM |
|
|
1DcXvfJdeJch9uptKopte5XQarTtj5ZjpL
|
|
|
|
|
|


