|
Title: Bitcoin Still Repeating History? 10 Part TA Series (September-October 2019) Post by: dragonvslinux on September 29, 2019, 11:47:30 AM Descending Triangle Breakdowns Part 1: Descending Triangle Looking Similar To 2018 Part 3: A repeat of 2014? Worst Case Scenario A $2,500 Low Other Indicators Part 10: Extrapolating the 50 & 200 Day MA bear crosses Click on images for "live" trading view charts, see next post (https://bitcointalk.org/index.php?topic=5188537.msg52592987#msg52592987) for newer analysis Analysis & Status Similar (7)] | Relevant (3) | Irrelevant (0) Short (7) | Neutral (3) | Long (0) Active (3) | Completed (5) | Inactive (2) Updated: March 14th 2019 Part 1: Descending Triangle Looking Similar To 2018 (Short - Re-active) Update 14/03/20: Price broke through major support that will now act as strong resistance, putting the $2,600 possibility back on the table. https://talkimg.com/images/2023/09/10/mpPiZ.png (https://www.tradingview.com/chart/BTCUSD/kRkd0baZ-If-Bitcoin-Repeats-History-Descending-Triangle-Looking-Similar/) Source: Trading View, September 14th 2019. Screenshot: March 14h 2020. (https://www.tradingview.com/chart/BTCUSD/kRkd0baZ-If-Bitcoin-Repeats-History-Descending-Triangle-Looking-Similar/) The daily bars of the 2018 descending triangle are starting to match the current 2019 descending triangle . If the bearish breakdown also repeats itself in the same way, then this would be the outcome, continuing on from where the charts fit together. Notice how a similar bearish breakdown would take us to the 200 Week MA, given its current trajectory. This would be long-term bullish if this happened, ie finding support again one year later $2K higher. I'd therefore find it unlikely to return to a bear market, or even continued consolidation (which would both be under the 200 Week MA). Update 23/12: Broke down as expected with a delayed but eventual re-test of triangle resistance that held up, price reached target within a $20 margin or error. https://talkimg.com/images/2023/09/10/mpTu8.png (https://www.tradingview.com/chart/BTCUSD/lfSA4LWe-BTCUSD-Measuring-The-Move-of-the-Descending-Triangle-Breakdown/) Source: Trading View, September 15th 2019. Screenshot: January 30th 2019. (https://www.tradingview.com/chart/BTCUSD/lfSA4LWe-BTCUSD-Measuring-The-Move-of-the-Descending-Triangle-Breakdown/) In 2018 there was an accuracy within 0.25% ($16) of the measured breakdown of the descending triangle . The calculation equaled $3,145 (-48.2%) with the low arriving at $3,129. Based on the 2019 Weekly descending triangle, the measured move of -32% takes the price to $6,410, give or take $16. If this Weekly triangle is breached to the upside I will calculate the Daily descending triangle, that has a reduced measured move. Part 3: A repeat of 2014? Worst Case Scenario A $2,500 Low (Short - Re-active) Update 14/03/20: Price has fallen back into the 2014 fractal, with $6,200 now anticipated as strong resistance as indicated. $2,500 is back on the table. https://talkimg.com/images/2023/09/10/mptN3.png (https://www.tradingview.com/chart/BLX/g0rcfzsk-BTCUSD-A-repeat-of-2014-Worst-Case-Scenario-A-2-500-Low/) Source: Trading View, September 15th 2019. Screenshot: March 14th 2020. (https://www.tradingview.com/chart/BLX/g0rcfzsk-BTCUSD-A-repeat-of-2014-Worst-Case-Scenario-A-2-500-Low/) This worst case scenario extrapolates the second half of the 2014 bear market going into 2020 with ATL at $2,500 and new ATH in November 2021, as well as reaching $30,000 within the same year. This assumes a double bottom will form in April 2020 prior to the halving, followed by 1.5 years of accumulation/consolidation, with a new ATH being made 4 years after the 2017 ATH. Update 14/03/20: Despite price breaking down to similar levels to the 2012 descending triangle breakdown, price has fallen through the range-bound channel. https://talkimg.com/images/2023/09/10/mpz4w.png (https://www.tradingview.com/chart/BLX/uMUkplNy-BTCUSD-If-Bitcoin-Repeats-History-Extrapolating-2012-Breakdown/) Source: Trading View, September 16th 2019. Screenshot: March 14th 2020. (https://www.tradingview.com/chart/BLX/uMUkplNy-BTCUSD-If-Bitcoin-Repeats-History-Extrapolating-2012-Breakdown/) Bitcoin 2012: Descending triangle breakdown to measured target of -20%. Price consolidated in a tight range between $4.21 to $5.30 after disbelief rally. 7 years later, Bitcoin 2019: Descending triangle with measured breakdown target of -32%. Repeating 2012 suggests a consolidation between $6,415 to $9,420 for 1 year. The time frames are very different, however the emphasis here is on a BTCUSD descending triangle at the top of a disbelief rally from the bottom of the bear market after a 250% (3.5x) rise. The measured move back then was -20% that Bitcoin achieved. The -32% breakdown target after a 340% (4.4x) doesn't seem unreasonable. Credit to KaliCrypto (https://www.tradingview.com/chart/BTCUSD/oMKax0DV-Descending-Triangle-On-a-Uptrend-fractal/) for the inspiration. Updated 23/11: The re-test of triangle resistance was delayed but price successfully achieved breakdown target of $6,875, as expected. https://talkimg.com/images/2023/09/10/mpFx9.png (https://www.tradingview.com/chart/BLX/IYyJeGzs-BTCUSD-If-2017-Descending-Triangle-Repeats-Best-Case-Scenario/) Source: Trading View, September 17th 2019. Screenshot: November 23rd 2019. (https://www.tradingview.com/chart/BLX/IYyJeGzs-BTCUSD-If-2017-Descending-Triangle-Repeats-Best-Case-Scenario/) I remind you of July 2017 descending triangle that completely overshot the measured target by around 12%. This is for all the traders who claim descending triangles never break to the downside in bull markets at the top of the trend. Bare in mind this was at the top of a full-blown bull market, after reaching a new ATH and 3.2x from April 2017 low. This was otherwise half way through the 2017 bull market from a 2016 low of $150, so roughly 20x. This is yet another example in the repeating Bitcoin history series to show how they do break to the downside, especially after parabolic bull markets. The extrapolated breakdown comes to a low of $5,350 (-43%) with a measured target on the Daily descending triangle of $6,875 (-27%). Note this is different to the Weekly descending triangle measured target of $6,410 (-32% see Part 2 above), and [1] Never happened, BTC broke down from Weekly descending triangle. Update 23/01: Price flipped this month to a Green 1, which remains unconfirmed, but implies that the 1-4 candle correction is over, as opposed to a 7-9 count. https://talkimg.com/images/2023/09/10/mpEPN.png (https://www.tradingview.com/chart/BLX/HAUjlGtc-BTCUSD-If-Bitcoin-Repeats-History-Monthly-TD-Sequential-Red-1/) Source: Trading View, September 28th 2019. Screenshot: January 23rd 2020. (https://www.tradingview.com/chart/BLX/HAUjlGtc-BTCUSD-If-Bitcoin-Repeats-History-Monthly-TD-Sequential-Red-1/) With the month of September coming to close in the coming days on a Monthly TD Sequential Red 1 price flip, October will be critical as to whether Bitcoin's monthly candle will close as a green 1 to break the sequential correction, or continue with another 6-8 red candles - as has happened in 2014 and 2018 during bear markets. Note that the Monthly Red 1 candles immediately preceding ATH have been excluded, as previously only have led to a 1-4 candle correction. As intriguing is that 4 years have now passed since Bitcoin's 2014 Monthly Red 1 candle that led to the 2016-2017 bull market. Additionally, the monthly RSI has broken down from 60 (bullish) to neutral territory, indicating scope for a 7-9 candle correction. Update 24/10: Price broke down after further rejection followed by the bearish crossover as the nail in the coffin, pattern completed. https://talkimg.com/images/2023/09/10/mpIra.png (https://www.tradingview.com/chart/BLX/Zv5WgHM3-BTCUSD-Another-Bearish-Indicator-200-EMA-MA-Bearcross/) Source: Trading View, October 9th 2019. Screenshot: October 24th 2019. (https://www.tradingview.com/chart/BLX/Zv5WgHM3-BTCUSD-Another-Bearish-Indicator-200-EMA-MA-Bearcross/) A quick look at the projected 200 EMA & MA bear-cross on the Daily chart . From the March 16th 2018 bearcross at $8,273, the bullcross didn't occur until over a year later on April 4th 2019 at $4,911 after a 40% correction. The current gain in price since this 2019 bullcross has been 60%. Unless the price moves above $8500 within the coming days, the EMA & MA bear-cross is due to occur by the end of the week. Many traders complain that due to Bitcoin's volatility the MA bull & bear crosses on longer timeframes are delayed indicators, while others prefer to utilize the EMA's (Exponential Moving Averages) for this reason. Here you see the value of trading the 200 EMA & MA bull & bear crosses. Note that following the 2018 bearcross the price first increased by 20% to the 200 Day MA, before signaling the longer-term downtrend. Update 24/10: Price notably continued to move downwards after making a final swing high during the Harvest Moon, pattern completed. https://talkimg.com/images/2023/09/10/mpsOo.png (https://www.tradingview.com/chart/BLX/iDJRauqr-BTCUSD-Bitcoin-s-Full-Moon-Reversal-6-Month-Pattern/) Source: TradingView, October 13th 2019. Screenshot: October 24th 2019. (https://www.tradingview.com/chart/BLX/iDJRauqr-BTCUSD-Bitcoin-s-Full-Moon-Reversal-6-Month-Pattern/) Full moons in 2019
Source: https://www.space.com/16830-full-moon-calendar.html Updated 14/03/20: Price accurately followed the path of the "bullish TD 9" since the 9, but ultimately failed to maintain this momentum. https://talkimg.com/images/2023/09/10/mpkCT.png (https://www.tradingview.com/chart/BTCUSD/VF2IVQaP-BTCUSD-TD-Sequential-9-Next-Week-To-Decide-Direction/) Source: TradingView, October 20th 2019. Screenshot: March 14th 2019. (https://www.tradingview.com/chart/BTCUSD/VF2IVQaP-BTCUSD-TD-Sequential-9-Next-Week-To-Decide-Direction/) Next week looks set for a bullish TD Sequential 9 on the Weekly chart that hasn't been seen since July 2018. Back then this led to a 40% increase in the price of Bitcoin followed by 4 months of consolidation. This scenario is labeled "A". Extrapolation C is the inverse of the "bearish" TD 9 in April 2019 that led to a continuation of the bull trend. Hence, C is labeled as the "bullish" TD 9 but would be the most bearish scenario. Scenario B is the extrapolation of the 2018 wedge breakdown, as documented in Part 1 of the Bitcoin repeating history series. The two year vpvr "average price" is referenced as a key level to break (and close) above at $8376. Part 10: Extrapolating the 50 & 200 Day MA bear crosses (Short - Active) Update 14/03/20: Price is noticeably dropped to similar levels as the 2012 death cross, . https://talkimg.com/images/2023/09/10/mpvvl.png (https://www.tradingview.com/chart/BTCUSD/5ocQN4r6-BTCUSD-Extrapolating-the-50-200-Day-MA-bear-crosses/) Source: TradingView, October 27th 2019. Screenshot: March 14th 2020. (https://www.tradingview.com/chart/BTCUSD/5ocQN4r6-BTCUSD-Extrapolating-the-50-200-Day-MA-bear-crosses/) It's time to talk about the bear cross that was confirmed yesterday, the 50 Day MA crossing the 200 Day MA. 3 out of 4 of Bitcoin's bear crosses have been bearish long-term indicating a further 50% drop in price (2011*, 2014 and 2018). In the shorter-term, Bitcoin also twice rallied by 50% in two of these occasions (2014 and 2015) before continuing higher or falling back down. Only 1 out of 4 of these cases it came at the end of the bear market, in 2015. Here are the current statistics and visual representation of the bear crosses: 2011*, 2014, 2015 and 2018. *Correction: 2011 not 2012, as originally stated Extrapolating these bear crosses to the current bear cross suggests the following:
If Bitcoin Repeats History? Descending Triangles Breakdown Summary
That's a range between $2,500 and $6,875, with anywhere between 2-18 months of consolidation. ✔ Conclusion: Anything could happen. Look for clues. Own work (https://bitcointalk.org/index.php?topic=1159946.msg51280905#msg51280905): dragononcrypto (https://www.tradingview.com/u/dragononcrypto/) Title: Technical Analysis Continued: November 2019 - January 2020 Post by: dragonvslinux on September 29, 2019, 12:54:57 PM Previous updates archived (https://web.archive.org/web/20191223114532/https://bitcointalk.org/index.php?topic=5188537.msg52592987%23msg52592987), now moved to OP. Merit received based on archived version of post.
Recent Bitcoin TA: https://talkimg.com/images/2023/09/10/mpSoc.png (https://www.tradingview.com/chart/BLX/x1qlgpz8-BTCUSD-Two-Four-Year-MA-s-Claim-It-s-Time-To-Accumulate/) https://talkimg.com/images/2023/09/10/mpZxP.png (https://www.tradingview.com/chart/BTCUSD/vtFKuk1E-BTCUSD-Extrapolating-2014-Correction-Could-6-500-Be-The-Low/)[/center] https://talkimg.com/images/2023/09/10/mpQjj.png (https://www.tradingview.com/chart/BLX/fYAFsDj8-BTCUSD-Volume-Profile-Accumulation-Zone-5-910-8-630/) https://talkimg.com/images/2023/09/10/mp6vf.png (https://www.tradingview.com/chart/BTCUSD/aV6MM1zp-BTCUSD-VPVR-Part-2-Volume-Point-of-Control-Now-Turned-Support/) Title: Re: If Bitcoin Repeats History? 5 Part TA Series On Descending Triangle Breakdowns Post by: YuginKadoya on September 29, 2019, 05:43:52 PM Anything can sure happen, but I really like your research and looking back on the recent charts and recent movements for bitcoin I should say your assumption is pretty detailed it can sure happen for the year of December could be a new All-time high but it could be a red flag as well, But if we passed the 2020 red outbreak we may welcome a real All-time high, well judging by the chart if my theory is correct, But that period of consolidation is very long, Well I can handle the wait but that is how it works, 4 year wait then we might get another bull run for the year 2021 or 2020, in my opinion,
But this is all speculation and my way of analysis the charts. Title: Re: If Bitcoin Repeats History? 5 Part TA Series On Descending Triangle Breakdowns Post by: Pab on September 29, 2019, 05:59:30 PM Thanks for sharing your work
If Bitcoin will close below 7350 $ on weekly or even on daily i will be very bearish 7350$ is 114 MA Peter Brandt trend line second one is 14 MA I don"t believe any 3K or something like that but i am sure we will have a lot of dirty games and manipulation what will force people to sell at low level. It could be that level of consolidation will be between 6600$ -7600$ or around Many things begin to happen in the world and more will come Personally i am not recognizing Bitcoin like a safe heaven but rather highly risky asset So when appetite on risk will be back bitcoin price will begin to increase Title: Re: If Bitcoin Repeats History? 5 Part TA Series On Descending Triangle Breakdowns Post by: adaseb on September 29, 2019, 08:16:54 PM Giving you a merit because unlike most posts you at least support your analysis with a few charts. And I mostly am looking at the same thing. Right now however it doesn't look like we will hit the $6400 area yet without retesting the $9100 area resistance within the next few days or weeks.
But I think the halving should be interesting because historically it presented a small rising before the halving and usually a few weeks after the halving a huge surge happened. However we only have 2 data points so who knows if this time will it be the same. People are expecting a pump and we might get the opposite, a dump. Just like people were expecting the $6000 area support to hold back in Nov 2018. Title: Re: If Bitcoin Repeats History? 5 Part TA Series On Descending Triangle Breakdowns Post by: exstasie on September 29, 2019, 08:37:26 PM Interesting comparison, although it employs some curve-fitting. The chart cuts off the first half of 2018 which makes it look like last year's triangle was much smaller than it really is. The 2018 triangle was 3x as long (time-wise) than this one, implying a much stronger breakout in percentage terms. I don't think we can necessarily plan on a 63% decline this time. Title: Re: If Bitcoin Repeats History? 5 Part TA Series On Descending Triangle Breakdowns Post by: josephdd1 on September 29, 2019, 08:53:47 PM It is very common for people to assume that a descending triangle is a falling wedge.. i for some time though they were the same, in fact, both are different are give two different indications.
Falling wedge is good. A descending triangle.. not so much. Falling wedge is almost always a bullish indicator and is different from a descending triangle as it has a sloping base. In case of a descending triangle, the base is horizontal.. Title: Re: If Bitcoin Repeats History? 5 Part TA Series On Descending Triangle Breakdowns Post by: dragonvslinux on September 29, 2019, 09:10:21 PM Giving you a merit because unlike most posts you at least support your analysis with a few charts. And I mostly am looking at the same thing. Right now however it doesn't look like we will hit the $6400 area yet without retesting the $9100 area resistance within the next few days or weeks. I agree with this sentiment, a retest of triangle breakdown does seem more likely and the current scenarios that are playing out (Part 2, 4 and arguably 5) include this likelihood. Interesting comparison, although it employs some curve-fitting. The chart cuts off the first half of 2018 which makes it look like last year's triangle was much smaller than it really is. The 2018 triangle was 3x as long (time-wise) than this one, implying a much stronger breakout in percentage terms. I don't think we can necessarily plan on a 63% decline this time. Agreed, hence the measured move (Part 2) working out to $6,410 instead for the Weekly triangle that broke down, rather than the $5k area of -63% (top to bottom). Consider Part 2 a correction to Part 1 regarding he measured move of the breakdown (hence the title). Part 1 was an extrapolation of the 2017 drop, which I found interesting as it would take the price towards the trajectory of the 200 Week MA for support (where BTC was last supported at it's swing low), but they are not proportionate you are right. The descending triangle also broke down much sooner than that of 2018, as you mentioned, so should not be considered a valid pattern at present. https://talkimg.com/images/2023/09/10/mbeFJ.png (https://www.tradingview.com/chart/BTCUSD/lfSA4LWe-BTCUSD-Measuring-The-Move-of-the-Descending-Triangle-Breakdown/) I don't see how you could extend the triangle any further than the above however. That initial wick down to $6k you see was the first time the price reached this support level. I'd be happy to see an alternative triangle which shows a drop further than 50%, given the swing high was $12k and the low was $6k, but would consider the evidence if provided. Title: Re: If Bitcoin Repeats History? 5 Part TA Series On Descending Triangle Breakdowns Post by: Strongkored on September 29, 2019, 09:52:52 PM Observations and analyzes that can help many people.
I myself think that Bitcoin will always follow the same pattern every year especially if approaching the halving year. Out there are too many predictions that say it will touch the price of $3,000 I feel is impossible. In my opinion it is difficult to drop below $5,000, but the worse case maybe can happen there many different thing affacted BTC currently. Title: Re: If Bitcoin Repeats History? 5 Part TA Series On Descending Triangle Breakdowns Post by: dragonvslinux on September 30, 2019, 10:52:59 AM Here's the first update for Part 1-5 from the Weekly close, for those who can't press play to see the result of the analysis.
I think it's fair to say there are similarities in all these scenarios so far. Part 1: Descending Triangle Looking Similar To 2018 https://talkimg.com/images/2023/09/10/mbiVo.png Part 2: Measuring The Move of the Descending Triangle Breakdown https://talkimg.com/images/2023/09/10/mb8DT.png Part 3: A repeat of 2014? Worst Case Scenario A $2,500 Low https://talkimg.com/images/2023/09/10/mbbZl.png Part 4: If Bitcoin Repeats History? Extrapolating 2012 Breakdown https://talkimg.com/images/2023/09/10/mbpk1.png Part 5: If 2017 Descending Triangle Repeats? Best Case Scenario https://talkimg.com/images/2023/09/10/mbDgm.png Own work (https://bitcointalk.org/index.php?topic=1159946.msg51280905#msg51280905): dragononcrypto (https://www.tradingview.com/u/dragononcrypto/) Title: Re: If Bitcoin Repeats History? 5 Part TA Series On Descending Triangle Breakdowns Post by: carlfebz2 on September 30, 2019, 03:04:34 PM Im not fan of looking or to believe on triangle breakouts but its good to look at which we do have at least some basis. Does history repeat itself? Lets see on upcoming days and weeks. Title: Re: If Bitcoin Repeats History? 5 Part TA Series On Descending Triangle Breakdowns Post by: figmentofmyass on September 30, 2019, 07:12:58 PM
That's a range between $2,500 and $6,875, with anywhere between 2-18 months of consolidation. Conclusion: Anything could happen. Look for clues. the bears must be licking their chops now! $2500---i think that's the lowest target i've seen yet! i'm leaning towards $6300-$7500 range for a final bottom and definitely favoring "part 5" more than any of the others. what odds would you give that scenario? Title: Re: If Bitcoin Repeats History? 5 Part TA Series On Descending Triangle Breakdowns Post by: dragonvslinux on September 30, 2019, 07:49:04 PM
That's a range between $2,500 and $6,875, with anywhere between 2-18 months of consolidation. Conclusion: Anything could happen. Look for clues. the bears must be licking their chops now! $2500---i think that's the lowest target i've seen yet! i'm leaning towards $6300-$7500 range for a final bottom and definitely favoring "part 5" more than any of the others. what odds would you give that scenario? Yeh $2500 is not a level I would expect either, as I referenced that would be so bearish if we got near there we'd be talking about $1500 again! So very doubtful imo. I can only see it happening if we get stuck between $6k and $8k for "too long" without being able to break through resistance. Then we would plunge lower for sure. Personally I'm leaning to $5,500 to $6,500, to the measured target with the possibility of people getting confused and overselling it, similarly to Part 5. The chance of Part 5 happening, at this point in time, is probably the same as flipping a coin and seeing if it lands on heads or tails. None of these charts give you any probabilities, they only showing where price has previously gone when measured targets are set based on bearish patterns. Apart from Part 3, the worst case scenario, they all look more or less accurate for now, so the price could follow any direction from here onwards. Disclaimer: I'm buying it as it goes down because of what these charts tell me. Title: Re: If Bitcoin Repeats History? 5 Part TA Series On Descending Triangle Breakdowns Post by: exstasie on September 30, 2019, 08:22:58 PM Personally I'm leaning to $5,500 to $6,500, to the measured target with the possibility of people getting confused and overselling it, similarly to Part 5. The chance of Part 5 happening, at this point in time, is probably the same as flipping a coin and seeing if it lands on heads or tails. None of these charts give you any probabilities, they only showing where price has previously gone when measured targets are set based on bearish patterns. Apart from Part 3, the worst case scenario, they all look more or less accurate for now, so the price could follow any direction from here onwards. Disclaimer: I'm buying it as it goes down because of what these charts tell me. Excellent analysis. My expected target range is essentially the 0.618-0.786 retracement area, (https://bitcointalk.org/index.php?topic=5188569.msg52597541#msg52597541) which lines up nicely with some historic S/R. In the "overselling" scenario, that points to a bottom in the $5,400s. That would be a hell of a knife catch opportunity! Title: Re: If Bitcoin Repeats History? 5 Part TA Series On Descending Triangle Breakdowns Post by: Heimer on September 30, 2019, 09:37:51 PM Part 1: Descending Triangle Looking Similar To 2018 Part 2: Measuring The Move of the Descending Triangle Breakdown Part 3: A repeat of 2014? Worst Case Scenario A $2,500 Low Part 4: If Bitcoin Repeats History? Extrapolating 2012 Breakdown Part 5: If 2017 Descending Triangle Repeats? Best Case Scenario Part 6: If Bitcoin Repeats History? Monthly TD Sequential Red 1 Click on images for "live" trading view charts or click here (https://bitcointalk.org/index.php?topic=5188537.msg52592987#msg52592987) for updated versions Part 1: Descending Triangle Looking Similar To 2018 https://i.imgur.com/z3SQZmp.png (https://www.tradingview.com/chart/BTCUSD/kRkd0baZ-If-Bitcoin-Repeats-History-Descending-Triangle-Looking-Similar/) Source: Trading View, September 14th 2019 (https://www.tradingview.com/chart/BTCUSD/kRkd0baZ-If-Bitcoin-Repeats-History-Descending-Triangle-Looking-Similar/) The daily bars of the 2018 descending triangle are starting to match the current 2019 descending triangle . If the bearish breakdown also repeats itself in the same way, then this would be the outcome, continuing on from where the charts fit together. Notice how a similar bearish breakdown would take us to the 200 Week MA, given its current trajectory. This would be long-term bullish if this happened, ie finding support again one year later $2K higher. I'd therefore find it unlikely to return to a bear market, or even continued consolidation (which would both be under the 200 Week MA). Part 2: Measuring The Move of the Descending Triangle Breakdown https://i.imgur.com/T8gwsSn.png (https://www.tradingview.com/chart/BTCUSD/lfSA4LWe-BTCUSD-Measuring-The-Move-of-the-Descending-Triangle-Breakdown/) Source: Trading View, September 15th 2019 (https://www.tradingview.com/chart/BTCUSD/lfSA4LWe-BTCUSD-Measuring-The-Move-of-the-Descending-Triangle-Breakdown/) In 2018 there was an accuracy within 0.25% ($16) of the measured breakdown of the descending triangle . The calculation equaled $3,145 (-48.2%) with the low arriving at $3,129. Based on the 2019 Weekly descending triangle, the measured move of -32% takes the price to $6,410, give or take $16. If this Weekly triangle is breached to the upside I will calculate the Daily descending triangle, that has a reduced measured move. Part 3: A repeat of 2014? Worst Case Scenario A $2,500 Low https://i.imgur.com/wMuBNP2.png (https://www.tradingview.com/chart/BLX/g0rcfzsk-BTCUSD-A-repeat-of-2014-Worst-Case-Scenario-A-2-500-Low/) Source: Trading View, September 15th 2019 (https://www.tradingview.com/chart/BLX/g0rcfzsk-BTCUSD-A-repeat-of-2014-Worst-Case-Scenario-A-2-500-Low/) This worst case scenario extrapolates the second half of the 2014 bear market going into 2020 with ATL at $2,500 and new ATH in November 2021, as well as reaching $30,000 within the same year. This assumes a double bottom will form in April 2020 prior to the halving, followed by 1.5 years of accumulation/consolidation, with a new ATH being made 4 years after the 2017 ATH. Part 4: If Bitcoin Repeats History? Extrapolating 2012 Breakdown https://i.imgur.com/Wok64H7.png (https://www.tradingview.com/chart/BLX/uMUkplNy-BTCUSD-If-Bitcoin-Repeats-History-Extrapolating-2012-Breakdown/) Source: Trading View, September 16th 2019 (https://www.tradingview.com/chart/BLX/uMUkplNy-BTCUSD-If-Bitcoin-Repeats-History-Extrapolating-2012-Breakdown/) Bitcoin 2012: Descending triangle breakdown to measured target of -20%. Price consolidated in a tight range between $4.21 to $5.30 after disbelief rally. 7 years later, Bitcoin 2019: Descending triangle with measured breakdown target of -32%. Repeating 2012 suggests a consolidation between $6,415 to $9,420 for 1 year. The time frames are very different, however the emphasis here is on a BTCUSD descending triangle at the top of a disbelief rally from the bottom of the bear market after a 250% (3.5x) rise. The measured move back then was -20% that Bitcoin achieved. The -32% breakdown target after a 340% (4.4x) doesn't seem unreasonable. Credit to KaliCrypto (https://www.tradingview.com/chart/BTCUSD/oMKax0DV-Descending-Triangle-On-a-Uptrend-fractal/) for the inspiration. Part 5: If 2017 Descending Triangle Repeats? Best Case Scenario https://i.imgur.com/byekKRa.png (https://www.tradingview.com/chart/BLX/IYyJeGzs-BTCUSD-If-2017-Descending-Triangle-Repeats-Best-Case-Scenario/) Source: Trading View, September 17th 2019 (https://www.tradingview.com/chart/BLX/IYyJeGzs-BTCUSD-If-2017-Descending-Triangle-Repeats-Best-Case-Scenario/) I remind you of July 2017 descending triangle that completely overshot the measured target by around 12%. This is for all the traders who claim descending triangles never break to the downside in bull markets at the top of the trend. Bare in mind this was at the top of a full-blown bull market, after reaching a new ATH and 3.2x from April 2017 low. This was otherwise half way through the 2017 bull market from a 2016 low of $150, so roughly 20x. This is yet another example in the repeating Bitcoin history series to show how they do break to the downside, especially after parabolic bull markets. The extrapolated breakdown comes to a low of $5,350 (-43%) with a measured target on the Daily descending triangle of $6,875 (-27%). Note this is different to the Weekly descending triangle measured target of $6,410 (-32% see Part 2 above), and [1] Never happened, BTC broke down from Weekly descending triangle. Part 6: If Bitcoin Repeats History? Monthly TD Sequential Red 1 https://i.imgur.com/1LIDxTi.png (https://www.tradingview.com/chart/BLX/HAUjlGtc-BTCUSD-If-Bitcoin-Repeats-History-Monthly-TD-Sequential-Red-1/) Source: Trading View, September 28th 2019 (https://www.tradingview.com/chart/BLX/HAUjlGtc-BTCUSD-If-Bitcoin-Repeats-History-Monthly-TD-Sequential-Red-1/) With the month of September coming to close in the coming days on a Monthly TD Sequential Red 1 price flip, October will be critical as to whether Bitcoin's monthly candle will close as a green 1 to break the sequential correction, or continue with another 6-8 red candles - as has happened in 2014 and 2018 during bear markets. Note that the Monthly Red 1 candles immediately preceding ATH have been excluded, as previously only have led to a 1-4 candle correction. As intriguing is that 4 years have now passed since Bitcoin's 2014 Monthly Red 1 candle that led to the 2016-2017 bull market. Additionally, the monthly RSI has broken down from 60 (bullish) to neutral territory, indicating scope for a 7-9 candle correction. If Bitcoin Repeats History?
That's a range between $2,500 and $6,875, with anywhere between 2-18 months of consolidation. Conclusion: Anything could happen. Look for clues. Own work (https://bitcointalk.org/index.php?topic=1159946.msg51280905#msg51280905): dragononcrypto (https://www.tradingview.com/u/dragononcrypto/) Title: Re: If Bitcoin Repeats History? 5 Part TA Series On Descending Triangle Breakdowns Post by: scambust on October 01, 2019, 07:35:42 PM I dunno. I also feel bearish but the weekly chart is way too oversold. Maybe if the next cycle high momentum is weak and stalls around $9,500 - $10,000, we will indeed be seeing your predicted lows.
But do not discount the buying before the May 2020 halving event. Title: Re: If Bitcoin Repeats History? 5 Part TA Series On Descending Triangle Breakdowns Post by: mazdafunsun on October 01, 2019, 08:11:33 PM I also have red several predictions tied to 2017 btc pattern and I agree that it would be best case scenario. The thing i did not know that in 2017 pattern there was important event - mt gox and I dont believe tat bakkt is equally important event. So thats a negative aspect for the best case scenario.
Title: Re: If Bitcoin Repeats History? 5 Part TA Series On Descending Triangle Breakdowns Post by: scambust on October 07, 2019, 08:21:28 PM I also have red several predictions tied to 2017 btc pattern and I agree that it would be best case scenario. The thing i did not know that in 2017 pattern there was important event - mt gox and I dont believe tat bakkt is equally important event. So thats a negative aspect for the best case scenario. Bakkt launch was an important event. It was probably the reason why the Bitcoin price took off in March. Something like buying the rumor and selling the news type of trading. As you can see the price fell from the triangle exactly on September 23. But the thing is unlike December 2017, the price is not yet in a parabolic move. I think the halving event will be the parabolic move. Title: Re: If Bitcoin Repeats History? 5 Part TA Series On Descending Triangle Breakdowns Post by: figmentofmyass on October 08, 2019, 09:59:24 PM Bakkt launch was an important event. It was probably the reason why the Bitcoin price took off in March. Something like buying the rumor and selling the news type of trading. we were already trading in the $8000s in may when we got the first bakkt news of the year that user acceptance testing was slated for july. (https://medium.com/bakkt-blog/bitcoin-futures-custody-bakkts-differentiated-approach-59b88d6984b5) so i hardly think bakkt hype was the reason for the whole bull run. it was a "sell the news" event, i'll give you that. but i think the "buy the rumor" phase was in mid-august when they finally announced a launch date. Title: Re: If Bitcoin Repeats History? 5 Part TA Series On Descending Triangle Breakdowns Post by: Pab on October 08, 2019, 10:36:09 PM There is problem with liquidity in general.Best pattern what works for me now is RSI 30 buy and RSI around 60 sell.Of course it can change.Price is stagnant volume is low.Financial environment not so much supporting risky assets like Bitcoin is.Crash on stocks is coming i don"t think Wall Street will avoid really big sell .i don"t believe in Bitcoin price below 6600 $ and even in not so much in 6600$
Title: Re: If Bitcoin Repeats History? 5 Part TA Series On Descending Triangle Breakdowns Post by: 1Referee on October 08, 2019, 10:49:35 PM But the thing is unlike December 2017, the price is not yet in a parabolic move. I think the halving event will be the parabolic move. There is no such a thing as a textbook parabolic move that we have to see. 2017 bull run was driven by insane demand for Bitcoin and from ICO investors aka gamblers buying Bitcoin to buy into an ICO. What we have seen happen this year is quite parabolic if you ask me. It's not a 1000% parabolic move, but 350% in a matter of months is up there as well. What asset has done the same in the last couple of years? Bitcoin did it twice where other assets have only been trending up at most. I wouldn't expect anything from the market until we go back above the 200 daily MA/EMA. $7000-$7500 is very realistic to happen before the end of the month if we don't get above these averages quick. Title: Re: If Bitcoin Repeats History? 5 Part TA Series On Descending Triangle Breakdowns Post by: dragonvslinux on October 09, 2019, 10:02:29 AM Part 7 added to OP. This doesn't come with any prediction/target (see Parts 1-5 for targets), but instead documents another valid indicator of Bitcoin's bearish downtrend.
Part 7: Another Bearish Bitcoin Indicator: 200 EMA & MA Bearcross https://talkimg.com/images/2023/09/10/mb6XJ.png (https://www.tradingview.com/chart/BLX/Zv5WgHM3-BTCUSD-Another-Bearish-Indicator-200-EMA-MA-Bearcross/) Source: Trading View, October 9th 2019 (https://www.tradingview.com/chart/BLX/Zv5WgHM3-BTCUSD-Another-Bearish-Indicator-200-EMA-MA-Bearcross/) A quick look at the projected 200 EMA & MA bear-cross on the Daily chart . From the March 16th 2018 bearcross at $8,273, the bullcross didn't occur until over a year later on April 4th 2019 at $4,911 after a 40% correction. The current gain in price since this 2019 bullcross has been 60%. Unless the price moves above $8500 within the coming days, the EMA & MA bear-cross is due to occur by the end of the week. Many traders complain that due to Bitcoin's volatility the MA bull & bear crosses on longer timeframes are delayed indicators, while others prefer to utilize the EMA's (Exponential Moving Averages) for this reason. Here you see the value of trading the 200 EMA & MA bull & bear crosses. Note that following the 2018 bearcross the price first increased by 20% to the 200 Day MA, before signaling the longer-term downtrend. Own work (https://bitcointalk.org/index.php?topic=1159946.msg51280905#msg51280905): dragononcrypto (https://www.tradingview.com/u/dragononcrypto/) Title: Re: If Bitcoin Repeats History? 5 Part TA Series On Descending Triangle Breakdowns Post by: dragonvslinux on October 12, 2019, 09:40:15 AM Unsurprisingly strong resistance from rallying into the EMA&MA bearcross.
Quote from: Trading View 200 Day MA & EMA bear cross now confirmed for October 14th (Monday) by MA & EMA forecasts*. The crossover price is currently forecasted at $8,710 (EMA) and $8,725 (MA). https://www.tradingview.com/x/6BbexU7d (https://www.tradingview.com/chart/BLX/Zv5WgHM3-Another-Bearish-Bitcoin-Indicator-200-EMA-MA-Bearcross/) Own work (https://bitcointalk.org/index.php?topic=1159946.msg51280905#msg51280905): dragononcrypto (https://www.tradingview.com/u/dragononcrypto/) *courtesy of LVR programming for EMA forecast Title: Re: If Bitcoin Repeats History? 5 Part TA Series On Descending Triangle Breakdowns Post by: exstasie on October 12, 2019, 06:14:41 PM Part 7 added to OP. This doesn't come with any prediction/target (see Parts 1-5 for targets), but instead documents another valid indicator of Bitcoin's bearish downtrend. Part 7: Another Bearish Bitcoin Indicator: 200 EMA & MA Bearcross Looks bearish but I'm hesitant to put much stock into any long term MA analysis. The historic data is lacking. Here's a counterpoint to offer. We had one such bearish cross in the summer of 2013, on the way to a new ATH a few months later. You can also see two slight false bearish crosses in 2012. The MA is in teal, the EMA in orange: https://i.imgur.com/1J3mby8.png Title: Re: If Bitcoin Repeats History? 5 Part TA Series On Descending Triangle Breakdowns Post by: dragonvslinux on October 12, 2019, 07:02:33 PM Part 7 added to OP. This doesn't come with any prediction/target (see Parts 1-5 for targets), but instead documents another valid indicator of Bitcoin's bearish downtrend. Part 7: Another Bearish Bitcoin Indicator: 200 EMA & MA Bearcross Looks bearish but I'm hesitant to put much stock into any long term MA analysis. The historic data is lacking. Here's a counterpoint to offer. We had one such bearish cross in the summer of 2013, on the way to a new ATH a few months later. You can also see two slight false bearish crosses in 2012. The MA is in teal, the EMA in orange: https://talkimg.com/images/2023/09/10/mbA0a.png That's a nice view and fair point. The main counter is the price was already consolidating above the 200 EMA/MA's after finding strong support from these levels with a V-shaped recovery, thus was by facto more bullish. The difference this time is we've fallen below them and they've become strong resistance on three occasions so far. It's should go without saying if we rally above them, the price would again be bullish. So far, it's notable that we haven't for the second week now. Title: Re: If Bitcoin Repeats History? 5 Part TA Series On Descending Triangle Breakdowns Post by: exstasie on October 12, 2019, 09:12:09 PM It's should go without saying if we rally above them, the price would again be bullish. So far, it's notable that we haven't for the second week now. It's fair to assume the market is bearish at least until it recovers above the 200-day average. The 20-week might be a better gauge. Either way, there's no denying we're in a mid-term downtrend. I just think the jury is out regarding the long term trend and my suspicion based on the 2012 and 2013 models is the Q2 rally was the beginning of new bull market. Title: Re: If Bitcoin Repeats History? TA Series On Descending Triangle Breakdowns Post by: dragonvslinux on October 13, 2019, 02:59:33 PM Part 8 now added, full moon tonight folks. Will it play out with a reversal or big move deciding the next direction as has happened in previous months?
It'd hard to deny we have started to trade in a tight range, this is a neutral call, as it's difficult to define what a "reversal" implies given the current price context. Part 8: Bitcoin's Full Moon Reversal 6 Month Pattern https://talkimg.com/images/2023/09/10/mbwcN.png (https://www.tradingview.com/chart/BLX/iDJRauqr-BTCUSD-Bitcoin-s-Full-Moon-Reversal-6-Month-Pattern/) Source: TradingView, October 13th 2019 (https://www.tradingview.com/chart/BLX/iDJRauqr-BTCUSD-Bitcoin-s-Full-Moon-Reversal-6-Month-Pattern/) Full moons in 2019
Source: https://www.space.com/16830-full-moon-calendar.html Own work (https://bitcointalk.org/index.php?topic=1159946.msg51280905#msg51280905): dragononcrypto (https://www.tradingview.com/u/dragononcrypto/) Title: Re: If Bitcoin Repeats History? 5 Part TA Series On Descending Triangle Breakdowns Post by: buwaytress on October 13, 2019, 08:19:41 PM There is no such a thing as a textbook parabolic move that we have to see. 2017 bull run was driven by insane demand for Bitcoin and from ICO investors aka gamblers buying Bitcoin to buy into an ICO. What we have seen happen this year is quite parabolic if you ask me. It's not a 1000% parabolic move, but 350% in a matter of months is up there as well. What asset has done the same in the last couple of years? Bitcoin did it twice where other assets have only been trending up at most. I wouldn't expect anything from the market until we go back above the 200 daily MA/EMA. $7000-$7500 is very realistic to happen before the end of the month if we don't get above these averages quick. I agree, even if others would say Bitcoin's done it at least 4 or 5 times in its history (I don't really give much credit to anything pre-2016). And that's kind of why I'm a wee bit disappointed that this year we had that bubble (or parabola?), because I'd have much preferred price to remain under pressure the entire year. I actually would also rather we get to 7k this year first. Title: Re: If Bitcoin Repeats History? TA Series On Descending Triangle Breakdowns Post by: adaseb on October 14, 2019, 04:15:44 AM Part 8 now added, full moon tonight folks. Will it play out with a reversal or big move deciding the next direction as has happened in previous months? It'd hard to deny we have started to trade in a tight range, this is a neutral call, as it's difficult to define what a "reversal" implies given the current price context. Part 8: Bitcoin's Full Moon Reversal 6 Month Pattern https://i.imgur.com/48zhyu8.png (https://www.tradingview.com/chart/BLX/iDJRauqr-BTCUSD-Bitcoin-s-Full-Moon-Reversal-6-Month-Pattern/) Source: TradingView, October 13th 2019 (https://www.tradingview.com/chart/BLX/iDJRauqr-BTCUSD-Bitcoin-s-Full-Moon-Reversal-6-Month-Pattern/) Full moons in 2019
Source: https://www.space.com/16830-full-moon-calendar.html Own work (https://bitcointalk.org/index.php?topic=1159946.msg51280905#msg51280905): dragononcrypto (https://www.tradingview.com/u/dragononcrypto/) This is the first technical analysis I have seen that takes into account the full moons. And looking at the chart you posted it doesn't seem like it's any pattern at all just completely random. The full moon actually reminds me of the old Byteball airdrops back in 2017, where every full moon there was an airdrop and price usually tanked and then rallied shortly after. It dropped due to the people dumping their free Coins for BTC so it had a more accurate pattern then, but now I don't think these full moons mean much. If there is a reversal then I think it's nothing more than a coincidence. Title: Re: If Bitcoin Repeats History? 5 Part TA Series On Descending Triangle Breakdowns Post by: exstasie on October 14, 2019, 07:33:49 AM I agree, even if others would say Bitcoin's done it at least 4 or 5 times in its history (I don't really give much credit to anything pre-2016). And that's kind of why I'm a wee bit disappointed that this year we had that bubble (or parabola?), because I'd have much preferred price to remain under pressure the entire year. I actually would also rather we get to 7k this year first. You and a whole lot of other people. :P I've been waiting for another shakeout to $7K or below but it's looking like a tossup now. Bears ushered in another high volume sell yesterday but there was zero follow through. Price just drifted back up into the previous range. I'm beginning to wonder if we all missed the bottom and will be forced to start chasing soon. I know that's David's opinion. (https://bitcointalk.org/index.php?topic=5140701.msg52705365#msg52705365) Title: Re: If Bitcoin Repeats History? 5 Part TA Series On Descending Triangle Breakdowns Post by: dragonvslinux on October 14, 2019, 08:36:59 AM I agree, even if others would say Bitcoin's done it at least 4 or 5 times in its history (I don't really give much credit to anything pre-2016). And that's kind of why I'm a wee bit disappointed that this year we had that bubble (or parabola?), because I'd have much preferred price to remain under pressure the entire year. I actually would also rather we get to 7k this year first. You and a whole lot of other people. :P I've been waiting for another shakeout to $7K or below but it's looking like a tossup now. Bears ushered in another high volume sell yesterday but there was zero follow through. Price just drifted back up into the previous range. I'm beginning to wonder if we all missed the bottom and will be forced to start chasing soon. I know that's David's opinion. (https://bitcointalk.org/index.php?topic=5140701.msg52705365#msg52705365) I don't think there is any hurry to get below $7k, many were expecting it would happen in a hurry with a bearflag formation, or continued capitulation below $7.8k, but clearly it never happened - and while it may never happen - to me this doesn't make the likelihood of bouncing back from current levels to $9k more likely, the odds are the still around the same (as probability generally claims a re-test is most likely before further downside). This also means there may be a lot of sellers waiting on the sidelines, as this re-test still hasn't happened, but is still the most likely event. By the looks of it we can continue moving sideways for another 2 weeks towards $9,050 while still being quite bearish. Price would still be below the 200 Day MA, without a bounce the price would be notably weak and we'd still be trapped by the descending triangle resistance (or arguably now parallel channel). If we don't start closing back above the 200 DMA, the price isn't going anywhere basically. https://www.tradingview.com/x/zPwukUSZ/ The only bullish case I can see is that it could start to resemble the Feb/March consolidation pattern as a form of fractal, and we all know how that ended. https://www.tradingview.com/x/a4XywI8B/ I've seen a chart of the comparison which has started to play out, but I still don't buy it yet. I'm a natural skeptic :D Own work (https://bitcointalk.org/index.php?topic=1159946.msg51280905#msg51280905): dragononcrypto (https://www.tradingview.com/u/dragononcrypto/) Title: Re: If Bitcoin Repeats History? 5 Part TA Series On Descending Triangle Breakdowns Post by: dragonvslinux on October 14, 2019, 08:46:59 AM Updated bi-weekly screenshots (https://bitcointalk.org/index.php?topic=5188537.msg52592987#msg52592987) for Part 1-5. Parts 6-8 haven't really changed yet so no updates to share.
Not much has changed, apart from changed Part 5 from Relevant to Similar. Updated: October 14th 2019 For those who don't have a tradingview account to press play... Similar | Relevant | Unlikely Part 1: Descending Triangle Looking Similar To 2018 Comment: Broke down too soon for confirmation of similarity. Could still follow same pattern but unlikely https://talkimg.com/images/2023/09/10/mKlbf.png Part 2: Measuring The Move of the Descending Triangle Breakdown Comment: Broke down as expected and following similar enough pattern https://talkimg.com/images/2023/09/10/mb2SZ.png Part 3: A repeat of 2014? Worst Case Scenario A $2,500 Low Comment: Broke down too fast and too far for similarity of a "slow grind" reversal https://talkimg.com/images/2023/09/10/mbUs8.png Part 4: If Bitcoin Repeats History? Extrapolating 2012 Breakdown Comment: Broke down as expected, following similar pattern though starting to drift off https://talkimg.com/images/2023/09/10/mba93.png Part 5: If 2017 Descending Triangle Repeats? Best Case Scenario Comment: Broke too soon to confirm Daily descending triangle target but now following similar pattern https://talkimg.com/images/2023/09/10/mbdXw.png Own work (https://bitcointalk.org/index.php?topic=1159946.msg51280905#msg51280905): dragononcrypto (https://www.tradingview.com/u/dragononcrypto/) Title: Re: If Bitcoin Repeats History? 5 Part TA Series On Descending Triangle Breakdowns Post by: exstasie on October 14, 2019, 08:47:33 AM The only bullish case I can see is that it could start to resemble the Feb/March consolidation pattern as a form of fractal, and we all know how that ended. https://www.tradingview.com/x/a4XywI8B/ I've seen a chart of the comparison which has started to play out, but I still don't buy it yet. I'm a natural skeptic :D There's good reason to be skeptical, and I'm sympathetic to that. I'm often one of the pessimists in disbelief as markets climb the wall of worry. (https://www.investopedia.com/terms/w/wallofworry.asp) I am very familiar with the above formation in BTCUSD though. It could be a classic scam curve. (https://bitcointalk.org/index.php?topic=5190785.msg52753170#msg52753170) You better be prepared for it to break in either direction. :P Title: Re: If Bitcoin Repeats History? 5 Part TA Series On Descending Triangle Breakdowns Post by: dragonvslinux on October 16, 2019, 08:16:08 AM Updated screenshots (https://bitcointalk.org/index.php?topic=5188537.msg52592987#msg52592987) of Parts 6-8 now posted as there has been a bit of price movement since publishing.
Updated: October 16th 2019 Part 6: If Bitcoin Repeats History? Monthly TD Sequential Red 1 Comment: Half way through the month and the TD Sequential is currently reading a Red 2 but still another 2 weeks to go https://www.tradingview.com/x/Cab4Xyup/ Part 7: Another Bearish Bitcoin Indicator: 200 EMA & MA Bearcross Comment: Rejected by the 200 Day MA & EMA a few days before the bear cross on October 14th https://talkimg.com/images/2023/09/10/mKBbd.png Part 8: Bitcoin's Full Moon Reversal 6 Month Pattern Comment: Still no definitive price direction since full moon but noticeably drifting downwards similar to Harvest Moon https://talkimg.com/images/2023/09/10/mKiH5.png Own work (https://bitcointalk.org/index.php?topic=1159946.msg51280905#msg51280905): dragononcrypto (https://www.tradingview.com/u/dragononcrypto/) Title: Re: If Bitcoin Repeats History? TA Series On Descending Triangles & Other Indicators Post by: dragonvslinux on October 21, 2019, 02:12:15 PM Part 9 added. Not sure how many parts of this series will be added, probably once definite directions in the market take place, and/or these forecasts no longer become relevant.
Also bare in the mind the relationship with the TD Sequential on the Monthly chart (Part 6 (https://bitcointalk.org/index.php?topic=5188537.0)) in relationship to Part 9, that would likely have more of an influence (as longer timefame). Part 9: TD Sequential 9 Next Week To Decide Direction? https://talkimg.com/images/2023/09/10/mK9yI.png (https://www.tradingview.com/chart/BTCUSD/VF2IVQaP-BTCUSD-TD-Sequential-9-Next-Week-To-Decide-Direction/) Source: TradingView, October 20th 2019 (https://www.tradingview.com/chart/BTCUSD/VF2IVQaP-BTCUSD-TD-Sequential-9-Next-Week-To-Decide-Direction/) Next week looks set for a bullish TD Sequential 9 on the Weekly chart that hasn't been seen since July 2018. Back then this led to a 40% increase in the price of Bitcoin followed by 4 months of consolidation. This scenario is labeled "A". Extrapolation C is the inverse of the "bearish" TD 9 in April 2019 that led to a continuation of the bull trend. Hence, C is labeled as the "bullish" TD 9 but would be the most bearish scenario. Scenario B is the extrapolation of the 2018 wedge breakdown, as documented in Part 1 of the Bitcoin repeating history series. The two year vpvr "average price" is referenced as a key level to break (and close) above at $8376. Own work (https://bitcointalk.org/index.php?topic=1159946.msg51280905#msg51280905): dragononcrypto (https://www.tradingview.com/u/dragononcrypto/) Title: Re: If Bitcoin Repeats History? TA Series On Descending Triangles & Other Indicators Post by: exstasie on October 22, 2019, 06:07:02 AM Part 9 added. Not sure how many parts of this series will be added, probably once definite directions in the market take place, and/or these forecasts no longer become relevant. Which scenarios are looking most likely now? Too many to keep track of. :P I'm still favoring something like Part 5, though I'm not sure we'll get a full on capitulation. We might just start slowly sliding upwards like late summer 2013. The two year vpvr "average price" is referenced as a key level to break (and close) above at $8376. Ah, that VPVR shows why price is sticking to this level. Even in the bearish case, the market will want to fill that gap in the $9,000s. Title: Re: If Bitcoin Repeats History? 5 Part TA Series On Descending Triangle Breakdowns Post by: Wexnident on October 22, 2019, 07:37:19 AM Bakkt launch was an important event. It was probably the reason why the Bitcoin price took off in March. Something like buying the rumor and selling the news type of trading. As you can see the price fell from the triangle exactly on September 23. But the thing is unlike December 2017, the price is not yet in a parabolic move. I think the halving event will be the parabolic move. I doubt you could push bakkt into the front as the reason. BTC was indeed hyped up when Bakkt announced its launch so a lot of analysts deduced that bitcoin could push for a bullish run after its launch. Sadly, the launch itself hardly had any effect on the market, and the market even went down to 7500 $ or so after the launch.Id expect a close scenario similar with 2017 or the part 5 as indicated by OP. Well, halving is just around the corner and we all would expect the price surge once it happens. I'm gonna wait for the results for changes next week again. Still waiting for a part 5 repeat next year. Title: Re: If Bitcoin Repeats History? TA Series On Descending Triangles & Other Indicators Post by: dragonvslinux on October 22, 2019, 11:43:14 AM Which scenarios are looking most likely now? Too many to keep track of. :P [...] Ah, that VPVR shows why price is sticking to this level. Even in the bearish case, the market will want to fill that gap in the $9,000s. Part 2 still has a 70-80% chance of playing out in my opinion, despite descending triangles only having a 60% chance of reaching the measured target, BTC has proven more reliable. Part 5 is looking very similar. If I had drawn the overlay of the breakdown within the bakkt timeframe like I did with other parts it would be pretty identical, despite different time-frames. Yes the VPVR is quite relevant in my opinion, hence charting it for a change. Especially when we are finding support from the 100 Week MA (roughly 2 year moving average) but getting rejected by the two year average volume price just above it. Reminds me of when we were stuck between the 200 Day EMA & MA before breaking down. Title: Re: If Bitcoin Repeats History? 5 Part TA Series On Descending Triangle Breakdowns Post by: scambust on October 22, 2019, 05:14:30 PM Bakkt launch was an important event. It was probably the reason why the Bitcoin price took off in March. Something like buying the rumor and selling the news type of trading. As you can see the price fell from the triangle exactly on September 23. But the thing is unlike December 2017, the price is not yet in a parabolic move. I think the halving event will be the parabolic move. I doubt you could push bakkt into the front as the reason. BTC was indeed hyped up when Bakkt announced its launch so a lot of analysts deduced that bitcoin could push for a bullish run after its launch. Sadly, the launch itself hardly had any effect on the market, and the market even went down to 7500 $ or so after the launch.Id expect a close scenario similar with 2017 or the part 5 as indicated by OP. Well, halving is just around the corner and we all would expect the price surge once it happens. I'm gonna wait for the results for changes next week again. Still waiting for a part 5 repeat next year. You don't understand. The day Bakkt launched, the event was already priced in as the price climbs from $3,000 back in early 2019. It is a trading strategy to buy something before the actual event - which can be a launch, opening, listing, etc. If the announcement never happened, the btc price could just be ranging around $3,000 - $6,000 until today. Title: Re: If Bitcoin Repeats History? 5 Part TA Series On Descending Triangle Breakdowns Post by: exstasie on October 22, 2019, 05:24:45 PM I doubt you could push bakkt into the front as the reason. BTC was indeed hyped up when Bakkt announced its launch so a lot of analysts deduced that bitcoin could push for a bullish run after its launch. Sadly, the launch itself hardly had any effect on the market, and the market even went down to 7500 $ or so after the launch. You don't understand. The day Bakkt launched, the event was already priced in as the price climbs from $3,000 back in early 2019. It is a trading strategy to buy something before the actual event - which can be a launch, opening, listing, etc. if the announcement never happened, the btc price could just be ranging around $3,000 - $6,000 until today. The Bakkt launch played out as a "sell the news" event but it would be foolish to attribute the entire 2019 bull run to the announcements. Bakkt repeatedly missed their earlier launch estimates last year. By the time the bull run exploded this past April, there was zero indication they would ever launch. By then, people had forgotten about Bakkt just like they did with ETFs. The "buy the rumor" event was when Bakkt finally announced a firm launch date in August. (https://cointelegraph.com/news/bakkt-announces-sept-23-launch-of-futures-and-custody-platform-in-us) We got a 15% relief rally off the news. Title: Re: If Bitcoin Repeats History? 5 Part TA Series On Descending Triangle Breakdowns Post by: dragonvslinux on October 23, 2019, 02:30:51 PM Part 9 Updated now that the TD Sequential 9 is in play. For anyone who didn't understand the relevance of a TD 9, I hope you do now.
Will update parts 1-8 tomorrow once BLX has updated, to see how relevant they are still looking now that there has been some price action. Part 9: TD Sequential 9 Next Week To Decide Direction? Comment: TD Sequential 9 now glowing on Weekly chart as expected. Waiting to see how the Week will close. https://www.tradingview.com/x/I9pSfthd Own work (https://bitcointalk.org/index.php?topic=1159946.msg51280905#msg51280905): dragononcrypto (https://www.tradingview.com/u/dragononcrypto/) Title: Re: If Bitcoin Repeats History? 5 Part TA Series On Descending Triangle Breakdowns Post by: dragonvslinux on October 24, 2019, 05:21:23 PM Part 1-8 now updated with recent price action, analysis changed of certain parts from similar to relevant and visa versa. Now included whether the analysis is short, neutral or long, as well as active, completed or inactive, as shown below. Currently all of these parts still appear relevant, with most of them still similar. 2:1 ratio of short to neutral calls, no longs.
Conclusion: Bitcoin is still repeating price history, nothing has dramatically changed. Don't forget to click the quote for larger images. Analysis & Status Similar (6) | Relevant (3) | Irrelevant (0) Short (6) | Neutral (3) | Long (0) Active (7) | Completed (2) | Inactive (0) Updated: October 24th 2019 Part 1: Descending Triangle Looking Similar To 2018 (Short - Active) Comment: Broke down too soon for confirmation of similarity. Could still follow same pattern but less likely https://talkimg.com/images/2023/09/10/mKveo.png Part 2: Measuring The Move of the Descending Triangle Breakdown (Short - Active) Comment: Broke down as expected and following similar enough pattern, still awaiting for target. https://talkimg.com/images/2023/09/10/mKfGT.png Part 3: A repeat of 2014? Worst Case Scenario A $2,500 Low (Short - Active) Comment: Broke down too fast and too far for similarity of a "slow grind" reversal, though notably fallen to a similar breakdown level. https://talkimg.com/images/2023/09/10/mKyfl.png Part 4: If Bitcoin Repeats History? Extrapolating 2012 Breakdown (Short - Active) Comment: Broke down as expected, following similar enough pattern, waiting to see if range is formed. https://talkimg.com/images/2023/09/10/mKJK1.png Part 5: If 2017 Descending Triangle Repeats? Best Case Scenario (Short - Active) Comment: Broke too soon to confirm Daily descending triangle target but now following similar pattern with a bear flag prior to continued breakdown. https://talkimg.com/images/2023/09/10/mKjHm.png Part 6: If Bitcoin Repeats History? Monthly TD Sequential Red 1 (Neutral - Active) Comment: Red 2 following similar 2014 breakdown structure so far, waiting to see if 20 Month MA will prop up the price for further confirmation. https://talkimg.com/images/2023/09/10/mKrIW.png Part 7: Another Bearish Bitcoin Indicator: 200 EMA & MA Bearcross (Short - Completed) Comment: Price broke down after further rejection followed by the bearish crossover as the nail in the coffin, pattern completed. https://talkimg.com/images/2023/09/10/mK17J.png Part 8: Bitcoin's Full Moon Reversal 6 Month Pattern (Neutral - Completed) Comment: Price notably continued to move downwards after making a final swing high during the Harvest Moon, pattern completed. https://talkimg.com/images/2023/09/10/mKcaC.png Updated: October 23rd 2019 Part 9: TD Sequential 9 Next Week To Decide Direction? (Neutral - Active) Comment: TD Sequential 9 now in play, waiting to see if "full blown" wedge breakdown (B) will occur, or (C) pattern will continue. https://www.tradingview.com/x/I9pSfthd Own work (https://bitcointalk.org/index.php?topic=1159946.msg51280905#msg51280905): dragononcrypto (https://www.tradingview.com/u/dragononcrypto/) Title: Re: Bitcoin Is Repeating History? TA Series On Repeating Past Patterns Post by: dragonvslinux on October 27, 2019, 03:29:56 PM Part 10: The Final Part.
A short call at $9,500 above the 200 Day MA, have I gone mad? This part was an attempt to look at the bullish case of rallying above the 50 & 200 Day bear cross, but unfortunately we've seen this twice before and it only once gave us the bullish case we were hoping for, the other three cases were bearish. Here is therefore the outlook based on extrapolation of past price history and basic probability (nothing else) of what the bear cross implies, if Bitcoin repeats history. Part 10: Extrapolating the 50 & 200 Day MA bear crosses https://talkimg.com/images/2023/09/10/mKNI3.pngg (https://www.tradingview.com/chart/BTCUSD/5ocQN4r6-BTCUSD-Extrapolating-the-50-200-Day-MA-bear-crosses/) Source: TradingView, October 27th 2019 (https://www.tradingview.com/chart/BTCUSD/5ocQN4r6-BTCUSD-Extrapolating-the-50-200-Day-MA-bear-crosses/) It's time to talk about the bear cross that was confirmed yesterday, the 50 Day MA crossing the 200 Day MA. 3 out of 4 of Bitcoin's bear crosses have been bearish long-term indicating a further 50% drop in price (2012, 2014 and 2018). In the shorter-term, Bitcoin also twice rallied by 50% in two of these occasions (2014 and 2015) before continuing higher or falling back down. Only 1 out of 4 of these cases it came at the end of the bear market, in 2015. Here are the current statistics and visual representation of the bear crosses: 2012, 2014, 2015 and 2018. Extrapolating these bear crosses to the current bear cross suggests the following:
Own work (https://bitcointalk.org/index.php?topic=1159946.msg51280905#msg51280905): dragononcrypto (https://www.tradingview.com/u/dragononcrypto/) Part 1-9 will otherwise be udpated at the end of the week when BLX is updated. Many parts are still relevant, some less some more, some completed, others inactive etc. Title: Re: Bitcoin Is Repeating History? TA Series On Repeating Past Patterns Post by: figmentofmyass on October 27, 2019, 06:30:48 PM Part 10: The Final Part. A short call at $9,500 above the 200 Day MA, have I gone mad? This part was an attempt to look at the bullish case of rallying above the 50 & 200 Day bear cross, but unfortunately we've seen this twice before and it only once gave us the bullish case we were hoping for, the other three cases were bearish. context is everything. the death crosses that actually followed through occurred after bubble pops, in april 2014 and april 2018. these aren't representative of our current market position. the failed death cross in september 2015 seems like a much more accurate comparison---the first pullback after a long term bullish reversal/trend change. Title: Re: Bitcoin Is Repeating History? TA Series On Repeating Past Patterns Post by: dragonvslinux on October 27, 2019, 06:34:58 PM Part 10: The Final Part. A short call at $9,500 above the 200 Day MA, have I gone mad? This part was an attempt to look at the bullish case of rallying above the 50 & 200 Day bear cross, but unfortunately we've seen this twice before and it only once gave us the bullish case we were hoping for, the other three cases were bearish. context is everything. the death crosses that actually followed through occurred after bubble pops, in april 2014 and april 2018. these aren't representative of our current market position. the failed death cross in september 2015 seems like a much more accurate comparison---the first pullback after a reversal/trend change. I'd like to believe that, but this death cross came at the end of the bull market (and relative highs), not the end (or lows) of the bear market (like in 2015). But obviously this is subjective to the time frame you are looking at, etc, etc. I think it's most likely this death cross will be unique in it's own way too. Title: Re: Bitcoin Is Repeating History? TA Series On Repeating Past Patterns Post by: figmentofmyass on October 27, 2019, 08:31:35 PM context is everything. the death crosses that actually followed through occurred after bubble pops, in april 2014 and april 2018. these aren't representative of our current market position. the failed death cross in september 2015 seems like a much more accurate comparison---the first pullback after a reversal/trend change. I'd like to believe that, but this death cross came at the end of the bull market (and relative highs), not the end (or lows) of the bear market (like in 2015). But obviously this is subjective to the time frame you are looking at, etc, etc. yes, time frame is crucial to this assessment. pull up a monthly chart---we need some perspective. there is no comparison between 2013, 2017, and......now. the death crosses from april 2014 and april 2018 came after multi-year bull markets that ended with exponential gains and parabolic bubbles. the current situation is very different. june-october = the first pullback of this bull market on the monthly time frame. you think it's the end?! this correction (and where we are in the market cycle) looks much more like fall 2012 or early 2016---in the early stages a multi-year bull market. in that sense, the late 2015 failed death cross is a much better comparison IMO. Title: Re: Bitcoin Is Repeating History? TA Series On Repeating Past Patterns Post by: dragonvslinux on October 27, 2019, 08:50:12 PM context is everything. the death crosses that actually followed through occurred after bubble pops, in april 2014 and april 2018. these aren't representative of our current market position. the failed death cross in september 2015 seems like a much more accurate comparison---the first pullback after a reversal/trend change. I'd like to believe that, but this death cross came at the end of the bull market (and relative highs), not the end (or lows) of the bear market (like in 2015). But obviously this is subjective to the time frame you are looking at, etc, etc. yes, time frame is crucial to this assessment. pull up a monthly chart---we need some perspective. Here it is already, published last month. The Red 1 monthly candle suggested it was time to make a big decision, either much more downside or the month being more of an "anomaly" and last dip before the bull-run. So far the price has followed the bullish path by flipping to a Green 1, that I imagine at this rate will close a Green 1 too. This is bullish, I agree. Hence the neutral outlook on the monthly chart, despite the bearish scenarios that could have (but didn't) happen. Once the month closes, I'll consider doing another piece of TA, but until then, I don't see the relevance as the intra-week movements are just noise. Part 6: If Bitcoin Repeats History? Monthly TD Sequential Red 1 https://talkimg.com/images/2023/09/10/mKTff.png (https://www.tradingview.com/chart/BLX/HAUjlGtc-BTCUSD-If-Bitcoin-Repeats-History-Monthly-TD-Sequential-Red-1/) Source: Trading View, September 28th 2019 (https://www.tradingview.com/chart/BLX/HAUjlGtc-BTCUSD-If-Bitcoin-Repeats-History-Monthly-TD-Sequential-Red-1/) Own work (https://bitcointalk.org/index.php?topic=1159946.msg51280905#msg51280905): dragononcrypto (https://www.tradingview.com/u/dragononcrypto/) there is no comparison between 2013, 2017, and......now. the death crosses from april 2014 and april 2018 came after multi-year bull markets that ended with exponential gains and parabolic bubbles. the current situation is very different. june-october = the first pullback of this bull market on the monthly time frame. you think it's the end?! this correction (and where we are in the market cycle) looks much more like fall 2012 or early 2016---in the early stages a multi-year bull market. in that sense, the late 2015 failed death cross is a much better comparison IMO. I'm definiately not denying this time it's very different, hence being able to draw a series of different scenarios that can ensue. You're right I haven't done enough comparisons with 2013 and 2017, due to lack of similarities I've been able to find. If you have any suggestions I'm all ears by the way, I could do with the inspiration. Although I feel this is similar to how people suggested I compared "bullish" descending triangles instead of just "bearish" ones, until they realised that generally speaking they don't exist for BTC. However think Part 5 is a fair comparison of what could occur during a bull market, and is playing out, regarding a "quick dip" scenario. Part 5: If 2017 Descending Triangle Repeats? Best Case Scenario https://talkimg.com/images/2023/09/10/mKtKZ.png (https://www.tradingview.com/chart/BLX/IYyJeGzs-BTCUSD-If-2017-Descending-Triangle-Repeats-Best-Case-Scenario/) Source: Trading View, September 17th 2019 (https://www.tradingview.com/chart/BLX/IYyJeGzs-BTCUSD-If-2017-Descending-Triangle-Repeats-Best-Case-Scenario/) Own work (https://bitcointalk.org/index.php?topic=1159946.msg51280905#msg51280905): dragononcrypto (https://www.tradingview.com/u/dragononcrypto/) FYI I'm still hodling long, despite the bearish analysis. I even bought the dip at $7800 and $7500, and a bit of the pump at $9800 (https://bitcointalk.org/index.php?topic=178336.msg52899143#msg52899143), so probably not as "bearish" as you may think. Title: Re: If Bitcoin Repeats History? 5 Part TA Series On Descending Triangle Breakdowns Post by: dragonvslinux on October 28, 2019, 12:16:52 PM End up week updates for all active patterns.
Main updates include 2012 descending triangle no longerappearing relevant (now labeled as inactive). 2014 slow grind reversal now looking more relevant again so now considered similar (sorry folks). Part 6 & 9 (TD based analysis) are playing out nicely so worth looking at again. Analysis & Status Similar (8] | Relevant (1) | Irrelevant (1) Short (7) | Neutral (3) | Long (0) Active (7) | Completed (2) | Inactive (1) Updated: October 28th 2019 Part 1: Descending Triangle Looking Similar To 2018 (Short - Active) Comment: Broke down too soon for confirmation of similarity. Could still follow same pattern but less likely https://talkimg.com/images/2023/09/10/mKZAz.png Part 2: Measuring The Move of the Descending Triangle Breakdown (Short - Active) Comment: Broke down as expected with a delayed but eventual re-test of triangle resistance, still awaiting for target. https://talkimg.com/images/2023/09/10/mKnI2.png Part 3: A repeat of 2014? Worst Case Scenario A $2,500 Low (Short - Active) Comment: Price is returning to the path of a "slow grind" reversal as well as notably fallen to a similar breakdown level. https://talkimg.com/images/2023/09/10/mKC5c.png Comment: Broke down as expected but by re-testing triangle resistance it has invalidated the continued sell off into a range. https://talkimg.com/images/2023/09/10/mKGUP.png Part 5: If 2017 Descending Triangle Repeats? Best Case Scenario (Short - Active) Comment: Broke too soon to confirm Daily descending triangle target. The re-test of triangle resistance was late, but now returning to similar breakdown pattern. https://talkimg.com/images/2023/09/10/mKMRq.png Part 6: If Bitcoin Repeats History? Monthly TD Sequential Red 1 (Neutral - Active) Comment: The engulfing green monthly candle (yet to close) looks to be taking the bullish path of the continued bull-run, despite still being a Red 2. https://talkimg.com/images/2023/09/10/mKm1j.png Part 9: TD Sequential 9 Next Week To Decide Direction? (Neutral - Active) Comment: Despite price flipping from a Red 9 to a Green 1, price is none the less now following the path of the "bullish TD 9". https://talkimg.com/images/2023/09/10/mK6eG.png Part 10: Extrapolating the 50 & 200 Day MA bear crosses (Short - Active) Comment: Price is currently following the 2014 and 2015 death cross route with a target of $12,000 by the end of the month, could still go either way. https://talkimg.com/images/2023/09/10/mKRQD.png Own work (https://bitcointalk.org/index.php?topic=1159946.msg51280905#msg51280905): dragononcrypto (https://www.tradingview.com/u/dragononcrypto/) Other Indicators Part 6: If Bitcoin Repeats History? Monthly TD Sequential Red 1 Part 9: TD Sequential 9 Next Week To Decide Direction? Part 10: Extrapolating the 50 & 200 Day MA bear crosses Title: Re: Bitcoin Is Repeating History? TA Series On Repeating Past Patterns Post by: dragonvslinux on November 03, 2019, 12:05:58 AM A few random thoughts from charts from this week while awaiting for weekly charts to close to update parts 1-10.
Bear trend or bull flag? https://www.tradingview.com/x/P2opozIk/ Do we need to fill the VPVR gap? https://www.tradingview.com/x/aMEHbRp0/ 50 & 100 Week MA bullish cross incoming? https://www.tradingview.com/x/tq9FefNV/ Ascending broadening wedge forming? https://www.tradingview.com/x/0D4I7yKz/ Or really just another bearish descending triangle (https://bitcointalk.org/index.php?topic=5198331.0)? https://talkimg.com/images/2023/09/10/mKdWg.png (https://bitcointalk.org/index.php?topic=5198331.0) So many potential patterns, all mean nothing without confirmation. Own work (https://bitcointalk.org/index.php?topic=1159946.msg51280905#msg51280905): dragononcrypto (https://www.tradingview.com/u/dragononcrypto/) Fear & Greed Index: (https://alternative.me/crypto/fear-and-greed-index/) https://alternative.me/crypto/fear-and-greed-index.png Title: Re: If Bitcoin Repeats History? 5 Part TA Series On Descending Triangle Breakdowns Post by: dragonvslinux on November 04, 2019, 08:07:58 PM Active Parts updated (1, 2, 3, 5, 6, 9, 10). More bearish bias confirmed (2, 3, 5), as well as neutral/bullish (6, 9, 10) bias confirmed compared to last week.
A lot of mixed price signals suggesting a lack of definite direction at the moment. Best to remain neutral until further confirmation in my opinion, despite individual biases. Analysis & Status Similar (8] | Relevant (1) | Irrelevant (1) Short (7) | Neutral (3) | Long (0) Active (7) | Completed (2) | Inactive (1) Updated: November 4th 2019 Part 1: Descending Triangle Looking Similar To 2018 (Short - Active) Comment: Broke down too soon for confirmation of similarity. Could still follow same pattern if breaks down again soon, but unlikely. https://talkimg.com/images/2023/09/10/m8yw2.png Part 2: Measuring The Move of the Descending Triangle Breakdown (Short - Active) Comment: Broke down as expected with a delayed but eventual re-test of triangle resistance that held up, still awaiting target until breakdown is invalidated. https://talkimg.com/images/2023/09/10/m8JNc.png Part 3: A repeat of 2014? Worst Case Scenario A $2,500 Low (Short - Active) Comment: Price is returning to the path of a "slow grind" reversal as well as notably fallen to a similar breakdown level. https://talkimg.com/images/2023/09/10/m8V4P.png Part 5: If 2017 Descending Triangle Repeats? Best Case Scenario (Short - Active) Comment: The re-test of triangle resistance was late, but now returning to similar price range that suggests further downside. https://talkimg.com/images/2023/09/10/m8jxq.png Part 6: If Bitcoin Repeats History? Monthly TD Sequential Red 1 (Neutral - Active) Comment: Last months green monthly candle looks to be taking the bullish path of the continued bull-run. However now sequential is on a Red 3, price could still go either way. https://talkimg.com/images/2023/09/10/m81Pj.png Part 9: TD Sequential 9 Next Week To Decide Direction? (Neutral - Active) Comment: Price is currently following the path of the "bullish TD 9", despite the price flip. Extrapolation suggests a re-test of support before higher highs. https://talkimg.com/images/2023/09/10/m8LrG.png Part 10: Extrapolating the 50 & 200 Day MA bear crosses (Short - Active) Comment: Price remains within the 2014-2015 paths despite failing to $12,000 last month, suggesting further upside or consolidation. https://talkimg.com/images/2023/09/10/m8cOD.png Own work (https://bitcointalk.org/index.php?topic=1159946.msg51280905#msg51280905): dragononcrypto (https://www.tradingview.com/u/dragononcrypto/) Title: Re: If Bitcoin Repeats History? 5 Part TA Series On Descending Triangle Breakdowns Post by: dragonvslinux on November 20, 2019, 10:37:46 AM Active parts updated. These longer term extrapolations and patterns are looking more relevant than ever as we return to bearish price movements.
Changes include Part 1 now gone from relevant to similar, making all 7 remaining active patterns similar to previous price history. The OP has also been updated with up-to-date screenshots as was becoming a bit updated. Analysis & Status Similar (9] | Relevant (0) | Irrelevant (1) Short (7) | Neutral (3) | Long (0) Active (7) | Completed (2) | Inactive (1) Updated: November 19th 2019 Part 1: Descending Triangle Looking Similar To 2018 (Short - Active) Comment: Broke down too soon for confirmation of similarity but now started to follow similar capitulation as 2018. https://talkimg.com/images/2023/09/10/m8GDl.png Part 2: Measuring The Move of the Descending Triangle Breakdown (Short - Active) Comment: Broke down as expected with a delayed but eventual re-test of triangle resistance that held up, still awaiting target until breakdown is invalidated. https://talkimg.com/images/2023/09/10/m8mn1.png Part 3: A repeat of 2014? Worst Case Scenario A $2,500 Low (Short - Active) Comment: Price is returning to the path of a "slow grind" reversal after notably breaking down to a similar support level. https://talkimg.com/images/2023/09/10/m86vm.png Part 5: If 2017 Descending Triangle Repeats? Best Case Scenario (Short - Active) Comment: The re-test of triangle resistance was delayed but now price is at a similar value as 2017 breakdown, implying a bounce to the upside. https://talkimg.com/images/2023/09/10/m8PgW.png Part 6: If Bitcoin Repeats History? Monthly TD Sequential Red 1 (Neutral - Active) Comment: The Monthly Red 3 candle now looks to in between the "bullish" and bearish paths, however the sequential 3 has a bearish bias. https://talkimg.com/images/2023/09/10/m8TuJ.png Part 9: TD Sequential 9 Next Week To Decide Direction? (Neutral - Active) Comment: Price is currently following the path of the "bullish TD 9", despite the price flip. Price continues to target support level of 100 Week MA. https://talkimg.com/images/2023/09/10/m8tNC.png Part 10: Extrapolating the 50 & 200 Day MA bear crosses (Short - Active) Comment: Price failed to follow the 2014 & 2015 path targeting $12,000 last month, now in line with 2018 correction, but with a bounce expected. https://talkimg.com/images/2023/09/10/m8zob.png Own work (https://bitcointalk.org/index.php?topic=1159946.msg51280905#msg51280905): dragononcrypto (https://www.tradingview.com/u/dragononcrypto/) Title: Re: If Bitcoin Repeats History? 5 Part TA Series On Descending Triangle Breakdowns Post by: dragonvslinux on November 22, 2019, 11:42:17 AM Active parts updated. These longer term extrapolations and patterns are looking more relevant than ever as we return to bearish price movements. Bumping this due to the relevancy. Will wait for the Weekly close before updating the charts, but goes to show the value of identifying longer term trends and previous patterns. Title: Re: Bitcoin Is Repeating History? TA Series On Repeating Past Patterns Post by: jostorres on November 22, 2019, 01:19:55 PM Yes, bitcoin repeats history. Let's take high and low and halving since 2013 (the year where bitcoin hit its first $1000 value). In 2014, the then ATH was ~$1200 and prices kept lowering through out the year. Same happened in 2018 after the current ATH of $19,800 happened. In 2015 the low happened which was around 20% of ATH which was below $200. So far the low after current ATH is ~$3800 happened in 2019 which approximately 20% of current ATH.
In 2016, the second halving happened and in 2020 we are going to have the 3rd halving. During the time of second halving there is no significant bull run but prices were in bull mode compared to the time of lowest price happening. It seems right now there is no ACTIVE BULL market but we are in bullish mode by considering the lowest prices after the current ATH. This may last up to end of 2020 (even after the 3rd halving). But, we may have new ATH by end of 2020 like how 2016 ended and how 2017's beginning had a new ATH. Hence, in 2021 we may have the new ATH of next bull cycle which may be 100x of lowest prices of current cycle. Because, current ATH of ~$20k is 100x of low of previous cycle which was $200. Title: Re: Bitcoin Is Repeating History? TA Series On Repeating Past Patterns Post by: dragonvslinux on November 25, 2019, 11:00:01 AM Part 2 completed.
Within a margin of error, in this case $116 (approx 1%), I'm boldly claiming that the original descending triangle target of $6,410 has been achieved. It's usual for descending triangles to come close to their measured move targets, but just shy of it - as too many investors are watching these levels. https://talkimg.com/images/2023/09/10/m8ug3.png Could we go lower? Of course. Could this be the bottom for the year? Absolutely! Has the bearish triangle target been reached? I believe so. Am I bullish? Short term yes, mid-term neutral, long-term always bullish. Relevance? A bearish targeting lasting more than 2 months is finally over. Updates to rest of active Parts coming soon... Title: Re: Bitcoin Is Repeating History? TA Series On Repeating Past Patterns Post by: dragonvslinux on November 28, 2019, 11:45:29 AM Related TA, specifically to Part 10, but also the general theme of Bitcoin incessantly repeating history:
https://talkimg.com/images/2023/09/10/m82VD.png (https://www.tradingview.com/chart/BTCUSD/4NYu7BX6-BTCUSD-Miner-Capitulation-Is-Here-Back-Down-To-3-200/) Source: Trading View, November 28th 2019 (https://bitcointalk.org/index.php?topic=5188537.0). The chart speaks for itself. The extrapolated price comes from the "2018 miner capitulation" that caused the price to drop 50%. Will we go back to $3,800? Unlikely, but clearly this is possible if the capitulation is as aggressive as 2018. Notably the VPVR is supporting the price target of $3,800, as is the extrapolation, with forecasted price for the block halving in May 2020 above $6K followed by another swift recovery and subsequent bull-run. This isn't the first theory regarding price forming a higher low double bottom instead of holding the $5-6K area. As published last month, the 50 & 200 Day death cross (https://bitcointalk.org/index.php?topic=5188537.0) [Part 10] also resulted in a 50% drop in price in 2014 and 2018, implying a 50% probability of such an outcome (using 4 sets of available data). Credit to Willy Woo for the Bitcoin Difficulty Ribbon (http://charts.woobull.com/bitcoin-difficulty-ribbon/) chart and the Hash Ribbons (https://www.tradingview.com/script/kT7jIvqv-Hash-Ribbons/) indicator by capriole_charles. Own work (https://bitcointalk.org/index.php?topic=1159946.msg51280905#msg51280905): dragononcrypto (https://www.tradingview.com/u/dragononcrypto/) Updated to active parts next week. Title: Re: Bitcoin Is Repeating History? TA Series On Repeating Past Patterns Post by: dragonvslinux on December 03, 2019, 12:57:04 PM Analysis & Status Similar (9] | Relevant (1) | Irrelevant (0) Short (7) | Neutral (3) | Long (0) Active (6) | Completed (4) | Inactive (0) Updates finally made, most relevantly another two patterns have completed as quoted below. Part 3 Re-Activated making all other Active Parts relevant again. This TA series has become increasingly relevant as time goes on. Also see first bullish accumulation long call at the bottom :o Comment: The re-test of triangle resistance was delayed but price successfully achieved breakdown target of $6,875, as expected. https://talkimg.com/images/2023/09/10/mic3W.png Comment: Broke down as expected with a delayed but eventual re-test of triangle resistance that held up, price reached target within a <1% margin or error. https://talkimg.com/images/2023/09/10/mihBJ.png Part 1: Descending Triangle Looking Similar To 2018 (Short - Active) Comment: .Price now started to follow similar capitulation as 2018, notably finding support precisely where resistance is forecasted in the future.. https://talkimg.com/images/2023/09/10/mi4dC.png Part 3: A repeat of 2014? Worst Case Scenario A $2,500 Low (Short - Active) Comment: Price has returned to the path of a "slow grind" reversal after notably breaking down to similar support levels. https://talkimg.com/images/2023/09/10/mi5zb.png Part 4: If Bitcoin Repeats History? Extrapolating 2012 Breakdown (Short - Re-Active) Comment: Price has notably returned to the same range as the 2012 descending triangle post-breakdown, suggesting further consildation. https://talkimg.com/images/2023/09/10/mi7hv.png Part 6: If Bitcoin Repeats History? Monthly TD Sequential Red 1 (Neutral - Active) Comment: The Monthly Red 4 candle now looks definitively on the bearish path, implying another 3-5 months of correction. https://talkimg.com/images/2023/09/10/mi9lH.png Part 9: TD Sequential 9 Next Week To Decide Direction? (Neutral - Active) Comment: Price accurately followed the path of the "bullish TD 9" with a 1-4 candle correction, but now drifting away from continuation of pattern. https://talkimg.com/images/2023/09/10/miiVI.png Part 10: Extrapolating the 50 & 200 Day MA bear crosses (Short - Active) Comment: Price followed the 2018 death cross path and more-or-less reaching it's first 75% probability target of $6,410. https://talkimg.com/images/2023/09/10/mi8Dd.png Completed Patterns Last Updated: December 3rd 2019 Comment: Price broke down after further rejection followed by the bearish crossover as the nail in the coffin, pattern completed. https://talkimg.com/images/2023/09/10/mibZ5.png Comment: Price notably continued to move downwards after making a final swing high during the Harvest Moon, pattern completed. https://talkimg.com/images/2023/09/10/mipkz.png Own work (https://bitcointalk.org/index.php?topic=1159946.msg51280905#msg51280905): dragononcrypto (https://www.tradingview.com/u/dragononcrypto/) https://talkimg.com/images/2023/09/10/miDg2.png (https://www.tradingview.com/chart/BLX/x1qlgpz8-BTCUSD-Two-Four-Year-MA-s-Claim-It-s-Time-To-Accumulate/) Source: TradingView, December 3rd 2019 (https://www.tradingview.com/chart/BLX/x1qlgpz8-BTCUSD-Two-Four-Year-MA-s-Claim-It-s-Time-To-Accumulate/) Bitcoin has now entered the accumulation phase between the 2 & 4 Year MA's, represented by the 730 & 1460 MA's. As highlighted in green, this investment strategy has historically been the best tie to accumulate BTC for the long-term 4-year cycle, for 2014/2015, as well as 2018/2019. The forecasted extrapolation is merely an example of where the price may consolidate in the coming months, but is far from a price target. The reference here is the accumulation phase is currently between $4650 and $7750, which may last only a matter of weeks, but historically lasts for a considerable amount of time, such as in 2014-2015 where there was an 11-month period of price consolidation and therefore accumulation. Time to BTFD. Here's a closer look at how price is currently moving in a similar way to the Winter 2014 breakdown: https://talkimg.com/images/2023/09/10/miWdc.png (https://www.tradingview.com/chart/BLX/x1qlgpz8-BTCUSD-Two-Four-Year-MA-s-Claim-It-s-Time-To-Accumulate/) Own work (https://bitcointalk.org/index.php?topic=1159946.msg51280905#msg51280905): dragononcrypto (https://www.tradingview.com/u/dragononcrypto/) Title: Re: Bitcoin Repeating History: 10 Part TA Series On Repeating Past Patterns Post by: dragonvslinux on December 18, 2019, 10:23:01 AM Taking into account this TA series, as well as some (https://bitcointalk.org/index.php?topic=5206530.msg53247794#msg53247794) other (https://bitcointalk.org/index.php?topic=5205261.msg53202274#msg53202274) technical analysis (https://bitcointalk.org/index.php?topic=5209110.msg53330184#msg53330184) published here via trading view (https://www.tradingview.com/u/dragononcrypto/)...
Here are my guesstimates* for the 2019/2020 low: $6500 - 20% $5000 - 30% (50%) $4500 - 25% (75%) $3600 - 15% (90%) $3200 - 7% (97%) $2500 - 2% (99%) $2000 - 0.9% (99.9%) $1500 - 0.1% (100%) Source: https://twitter.com/DragonOnRedirec/status/1206893152336011265 Related: 📊Dragonvslinux Technical Analysis 📈 3 Month Graphical Review 📉 (https://bitcointalk.org/index.php?topic=5209327.msg53335667#msg53335667) *Guessimates are estimates using a mixture of guesswork and calculation. Guesstimates are subject to change based on outcome (https://bitcointalk.org/index.php?topic=5188537.msg52592987#msg52592987) of current (https://bitcointalk.org/index.php?topic=5188537) and future (https://www.tradingview.com/u/dragononcrypto/) TA. https://talkimg.com/images/2023/09/10/miZJd.png (https://www.tradingview.com/chart/BTCUSD/HuaZniIz-Dragononcrypto-3-Month-Graphical-Review/) Updates to TA Series coming next week, given recent relevant price movements. Title: Re: Bitcoin Repeating History: 10 Part TA Series On Repeating Past Patterns Post by: dragonvslinux on December 19, 2019, 11:56:31 AM For reference sake, here are a couple of charts (on the 4hr and Daily timeframe) published last week that remain very relevant today.
Is the bear market over? Far from it, but as others have put it, we are at a crossroads. Zooming Into The Weekly Chart Doesn't Look Good (December 14th) Comment: Note we are still being rejected by the median downtrend resistance of the long-term bear flag after briefly wicking above it followed by getting rejected by it on the 4hr chart, as well as for now, the 0.382 fib retracement at $7,231. We remain bearish on the Weekly chart, the price requires follow through in order to become bullish. https://talkimg.com/images/2023/09/10/miUsJ.png (https://www.tradingview.com/chart/BTCUSD/4TXirZmc-BTCUSD-Zooming-Into-The-Weekly-Chart-Doesn-t-Look-Good/) Could This Descending Triangle Be The Final Fake Out? (December 13th) Comment: As anticipated, while breaking down to the target of $6,525 (4hr chart) and $6,600 (Daily chart), it was a bear trap. We are now finding resistance close to the apex of the descending triangle in the breakout zone, ie the downtrend resistance line around $7,250, as well as the horizontal support around $7,170. https://talkimg.com/images/2023/09/10/mia9C.png (https://www.tradingview.com/chart/BTCUSD/kNVz94aE-BTCUSD-Could-This-Descending-Triangle-Be-The-Final-Fake-Out/) See also related longer-term TA: Could $6,500 be the low? @Sawcruhteez (https://twitter.com/Sawcruhteez) explores the possibility in his latest video featuring this chart: https://www.youtube.com/watch?v=lYs2MQshjiE&feature=youtu.com&t=2058 Updated chart (December 19th): Comment: Recent price action wicked just below the support level of the accumulation zone, similar to 2014 correction, and remains on the path of accumulation. https://talkimg.com/images/2023/09/10/midab.png (https://www.tradingview.com/chart/BTCUSD/vtFKuk1E-BTCUSD-Extrapolating-2014-Correction-Could-6-500-Be-The-Low/) Title: Re: Bitcoin Repeating History: 10 Part TA Series On Repeating Past Patterns Post by: dragonvslinux on December 23, 2019, 11:50:57 AM Updates completed, now moved to OP from second post. Will use second post for compilation of latest TA, coming soon.
Change log: Part 9 considered completed, Part 1 changed from Similar to Relevant, as referenced. 5 Patterns out of 10 now completed, 5 more to go! Descending Triangle Breakdowns Part 1: Descending Triangle Looking Similar To 2018 Part 2: Part 3: A repeat of 2014? Worst Case Scenario A $2,500 Low Part 4: If Bitcoin Repeats History? Extrapolating 2012 Breakdown Part 5: Other Indicators Part 6: If Bitcoin Repeats History? Monthly TD Sequential Red 1 Part 10: Extrapolating the 50 & 200 Day MA bear crosses Click on images for "live" trading view charts, see next post (https://bitcointalk.org/index.php?topic=5188537.msg52592987#msg52592987) for newer analysis Analysis & Status Similar (8] | Relevant (2) | Irrelevant (0) Short (7) | Neutral (3) | Long (0) Active (5) | Completed (5) | Inactive (0) Updated: December 23rd 2019 Part 1: Descending Triangle Looking Similar To 2018 (Short - Active) Update 23/12: Price notably finding support precisely where resistance is forecasted in the future. Holding this level would continue to negate the $2,600 possibility. https://talkimg.com/images/2023/09/10/mgjH2.png (https://www.tradingview.com/chart/BTCUSD/kRkd0baZ-If-Bitcoin-Repeats-History-Descending-Triangle-Looking-Similar/) Source: Trading View, September 14th 2019. Screenshot: December 23rd 2019. (https://www.tradingview.com/chart/BTCUSD/kRkd0baZ-If-Bitcoin-Repeats-History-Descending-Triangle-Looking-Similar/) The daily bars of the 2018 descending triangle are starting to match the current 2019 descending triangle . If the bearish breakdown also repeats itself in the same way, then this would be the outcome, continuing on from where the charts fit together. Notice how a similar bearish breakdown would take us to the 200 Week MA, given its current trajectory. This would be long-term bullish if this happened, ie finding support again one year later $2K higher. I'd therefore find it unlikely to return to a bear market, or even continued consolidation (which would both be under the 200 Week MA). Update 23/12: Broke down as expected with a delayed but eventual re-test of triangle resistance that held up, price reached target within a $20 margin or error. https://talkimg.com/images/2023/09/10/mgrIc.png (https://www.tradingview.com/chart/BTCUSD/lfSA4LWe-BTCUSD-Measuring-The-Move-of-the-Descending-Triangle-Breakdown/) Source: Trading View, September 15th 2019. Screenshot: December 23rd 2019. (https://www.tradingview.com/chart/BTCUSD/lfSA4LWe-BTCUSD-Measuring-The-Move-of-the-Descending-Triangle-Breakdown/)[/center] In 2018 there was an accuracy within 0.25% ($16) of the measured breakdown of the descending triangle . The calculation equaled $3,145 (-48.2%) with the low arriving at $3,129. Based on the 2019 Weekly descending triangle, the measured move of -32% takes the price to $6,410, give or take $16. If this Weekly triangle is breached to the upside I will calculate the Daily descending triangle, that has a reduced measured move. Part 3: A repeat of 2014? Worst Case Scenario A $2,500 Low (Short - Active) Update 23/12: Price continuing to follow the path of a "slow grind" reversal after notably breaking down to similar support levels. Target remains $2,500. https://talkimg.com/images/2023/09/10/mg17P.png (https://www.tradingview.com/chart/BLX/g0rcfzsk-BTCUSD-A-repeat-of-2014-Worst-Case-Scenario-A-2-500-Low/) Source: Trading View, September 15th 2019. Screenshot: December 23rd 2019. (https://www.tradingview.com/chart/BLX/g0rcfzsk-BTCUSD-A-repeat-of-2014-Worst-Case-Scenario-A-2-500-Low/) This worst case scenario extrapolates the second half of the 2014 bear market going into 2020 with ATL at $2,500 and new ATH in November 2021, as well as reaching $30,000 within the same year. This assumes a double bottom will form in April 2020 prior to the halving, followed by 1.5 years of accumulation/consolidation, with a new ATH being made 4 years after the 2017 ATH. Part 4: If Bitcoin Repeats History? Extrapolating 2012 Breakdown (Short - Re-Active) Update 23/12: Price remains within the same range as the 2012 descending triangle post-breakdown, suggesting further consolidation until block halving. https://talkimg.com/images/2023/09/10/mgcUq.png (https://www.tradingview.com/chart/BLX/uMUkplNy-BTCUSD-If-Bitcoin-Repeats-History-Extrapolating-2012-Breakdown/) Source: Trading View, September 16th 2019. Screenshot: December 23rd 2019. (https://www.tradingview.com/chart/BLX/uMUkplNy-BTCUSD-If-Bitcoin-Repeats-History-Extrapolating-2012-Breakdown/) Bitcoin 2012: Descending triangle breakdown to measured target of -20%. Price consolidated in a tight range between $4.21 to $5.30 after disbelief rally. 7 years later, Bitcoin 2019: Descending triangle with measured breakdown target of -32%. Repeating 2012 suggests a consolidation between $6,415 to $9,420 for 1 year. The time frames are very different, however the emphasis here is on a BTCUSD descending triangle at the top of a disbelief rally from the bottom of the bear market after a 250% (3.5x) rise. The measured move back then was -20% that Bitcoin achieved. The -32% breakdown target after a 340% (4.4x) doesn't seem unreasonable. Credit to KaliCrypto (https://www.tradingview.com/chart/BTCUSD/oMKax0DV-Descending-Triangle-On-a-Uptrend-fractal/) for the inspiration. Updated 23/11: The re-test of triangle resistance was delayed but price successfully achieved breakdown target of $6,875, as expected. https://talkimg.com/images/2023/09/10/mghTj.png (https://www.tradingview.com/chart/BLX/IYyJeGzs-BTCUSD-If-2017-Descending-Triangle-Repeats-Best-Case-Scenario/) Source: Trading View, September 17th 2019. Screenshot: November 23rd 2019. (https://www.tradingview.com/chart/BLX/IYyJeGzs-BTCUSD-If-2017-Descending-Triangle-Repeats-Best-Case-Scenario/) I remind you of July 2017 descending triangle that completely overshot the measured target by around 12%. This is for all the traders who claim descending triangles never break to the downside in bull markets at the top of the trend. Bare in mind this was at the top of a full-blown bull market, after reaching a new ATH and 3.2x from April 2017 low. This was otherwise half way through the 2017 bull market from a 2016 low of $150, so roughly 20x. This is yet another example in the repeating Bitcoin history series to show how they do break to the downside, especially after parabolic bull markets. The extrapolated breakdown comes to a low of $5,350 (-43%) with a measured target on the Daily descending triangle of $6,875 (-27%). Note this is different to the Weekly descending triangle measured target of $6,410 (-32% see Part 2 above), and [1] Never happened, BTC broke down from Weekly descending triangle. Part 6: If Bitcoin Repeats History? Monthly TD Sequential Red 1 (Neutral - Active) Update 23/12: Despite the bounce, the Red 4 candle remains definitively on the bearish path, implying another 3-5 months of correction, starting with another dump next month. https://talkimg.com/images/2023/09/10/mgoLG.png (https://www.tradingview.com/chart/BLX/HAUjlGtc-BTCUSD-If-Bitcoin-Repeats-History-Monthly-TD-Sequential-Red-1/) Source: Trading View, September 28th 2019. Screenshot: December 23rd 2019. (https://www.tradingview.com/chart/BLX/HAUjlGtc-BTCUSD-If-Bitcoin-Repeats-History-Monthly-TD-Sequential-Red-1/) With the month of September coming to close in the coming days on a Monthly TD Sequential Red 1 price flip, October will be critical as to whether Bitcoin's monthly candle will close as a green 1 to break the sequential correction, or continue with another 6-8 red candles - as has happened in 2014 and 2018 during bear markets. Note that the Monthly Red 1 candles immediately preceding ATH have been excluded, as previously only have led to a 1-4 candle correction. As intriguing is that 4 years have now passed since Bitcoin's 2014 Monthly Red 1 candle that led to the 2016-2017 bull market. Additionally, the monthly RSI has broken down from 60 (bullish) to neutral territory, indicating scope for a 7-9 candle correction. Update 24/10: Price broke down after further rejection followed by the bearish crossover as the nail in the coffin, pattern completed. https://talkimg.com/images/2023/09/10/mg4eD.png (https://www.tradingview.com/chart/BLX/Zv5WgHM3-BTCUSD-Another-Bearish-Indicator-200-EMA-MA-Bearcross/) Source: Trading View, October 9th 2019. Screenshot: October 24th 2019. (https://www.tradingview.com/chart/BLX/Zv5WgHM3-BTCUSD-Another-Bearish-Indicator-200-EMA-MA-Bearcross/) A quick look at the projected 200 EMA & MA bear-cross on the Daily chart . From the March 16th 2018 bearcross at $8,273, the bullcross didn't occur until over a year later on April 4th 2019 at $4,911 after a 40% correction. The current gain in price since this 2019 bullcross has been 60%. Unless the price moves above $8500 within the coming days, the EMA & MA bear-cross is due to occur by the end of the week. Many traders complain that due to Bitcoin's volatility the MA bull & bear crosses on longer timeframes are delayed indicators, while others prefer to utilize the EMA's (Exponential Moving Averages) for this reason. Here you see the value of trading the 200 EMA & MA bull & bear crosses. Note that following the 2018 bearcross the price first increased by 20% to the 200 Day MA, before signaling the longer-term downtrend. Update 24/10: Price notably continued to move downwards after making a final swing high during the Harvest Moon, pattern completed. https://talkimg.com/images/2023/09/10/mg7Gf.png (https://www.tradingview.com/chart/BLX/iDJRauqr-BTCUSD-Bitcoin-s-Full-Moon-Reversal-6-Month-Pattern/) Source: TradingView, October 13th 2019. Screenshot: October 24th 2019. (https://www.tradingview.com/chart/BLX/iDJRauqr-BTCUSD-Bitcoin-s-Full-Moon-Reversal-6-Month-Pattern/) Full moons in 2019
Source: https://www.space.com/16830-full-moon-calendar.html Updated 23/12: Price accurately followed the path of the "bullish TD 9" with a 1-4 candle correction, but has failed to consolidate above the MAs and continue the bullish path. https://talkimg.com/images/2023/09/10/mg9yZ.png (https://www.tradingview.com/chart/BTCUSD/VF2IVQaP-BTCUSD-TD-Sequential-9-Next-Week-To-Decide-Direction/) Source: TradingView, October 20th 2019. Screenshot: December 23rd 2019. (https://www.tradingview.com/chart/BTCUSD/VF2IVQaP-BTCUSD-TD-Sequential-9-Next-Week-To-Decide-Direction/) Next week looks set for a bullish TD Sequential 9 on the Weekly chart that hasn't been seen since July 2018. Back then this led to a 40% increase in the price of Bitcoin followed by 4 months of consolidation. This scenario is labeled "A". Extrapolation C is the inverse of the "bearish" TD 9 in April 2019 that led to a continuation of the bull trend. Hence, C is labeled as the "bullish" TD 9 but would be the most bearish scenario. Scenario B is the extrapolation of the 2018 wedge breakdown, as documented in Part 1 of the Bitcoin repeating history series. The two year vpvr "average price" is referenced as a key level to break (and close) above at $8376. Part 10: Extrapolating the 50 & 200 Day MA bear crosses (Short - Active) Update 23/12: Price between the 2012 and 2018 death cross paths, reaching it's first 75% probability target of $6.4K, the next 75% probability target is $4K. https://talkimg.com/images/2023/09/10/mgBK8.png (https://www.tradingview.com/chart/BTCUSD/5ocQN4r6-BTCUSD-Extrapolating-the-50-200-Day-MA-bear-crosses/) Source: TradingView, October 27th 2019. Screenshot: December 23rd 2019. (https://www.tradingview.com/chart/BTCUSD/5ocQN4r6-BTCUSD-Extrapolating-the-50-200-Day-MA-bear-crosses/) It's time to talk about the bear cross that was confirmed yesterday, the 50 Day MA crossing the 200 Day MA. 3 out of 4 of Bitcoin's bear crosses have been bearish long-term indicating a further 50% drop in price (2011*, 2014 and 2018). In the shorter-term, Bitcoin also twice rallied by 50% in two of these occasions (2014 and 2015) before continuing higher or falling back down. Only 1 out of 4 of these cases it came at the end of the bear market, in 2015. Here are the current statistics and visual representation of the bear crosses: 2011*, 2014, 2015 and 2018. *Correction: 2011 not 2012, as originally stated Extrapolating these bear crosses to the current bear cross suggests the following:
If Bitcoin Repeats History? Descending Triangles Breakdown Summary
That's a range between $2,500 and $6,875, with anywhere between 2-18 months of consolidation. Conclusion: Anything could happen. Look for clues. Own work (https://bitcointalk.org/index.php?topic=1159946.msg51280905#msg51280905): dragononcrypto (https://www.tradingview.com/u/dragononcrypto/) Title: Re: Bitcoin Repeating History: 10 Part TA Series On Repeating Past Patterns Post by: dragonvslinux on January 06, 2020, 10:51:35 AM OP updated with 5 (out of 10) Parts still active. These remaining extrapolations are now giving very mixed signals, despite continuing to be useful and accurate, implying long-term indecision in the market that will likely be clarified in the coming weeks, or by next month. For bullish TA from November-December 2019, click here (https://bitcointalk.org/index.php?topic=5188537.msg52592987#msg52592987).
Part 1: Descending Triangle Looking Similar To 2018 (Short - Active) Update 06/01/20: Price continuing to find support where resistance is forecasted in the future, therefore continuing to negate the $2,600 possibility. https://talkimg.com/images/2023/09/10/mgaRG.png (https://www.tradingview.com/chart/BTCUSD/kRkd0baZ-If-Bitcoin-Repeats-History-Descending-Triangle-Looking-Similar/) Source: Trading View, September 14th 2019. Screenshot: January 6th 2020. (https://www.tradingview.com/chart/BTCUSD/kRkd0baZ-If-Bitcoin-Repeats-History-Descending-Triangle-Looking-Similar/) Part 3: A repeat of 2014? Worst Case Scenario A $2,500 Low (Short - Active) Update 06/01/20: Price continues to follow the path of a "slow grind" reversal, implying further downside, unless price breaks away from previous pattern . Target remains $2,500. https://talkimg.com/images/2023/09/10/mgXrD.png (https://www.tradingview.com/chart/BLX/g0rcfzsk-BTCUSD-A-repeat-of-2014-Worst-Case-Scenario-A-2-500-Low/) Source: Trading View, September 15th 2019. Screenshot: January 6th 2020. (https://www.tradingview.com/chart/BLX/g0rcfzsk-BTCUSD-A-repeat-of-2014-Worst-Case-Scenario-A-2-500-Low/) Part 4: If Bitcoin Repeats History? Extrapolating 2012 Breakdown (Short - Re-Active) Update 23/12: Price continues to find support from similar breakdown level as the 2012 consolidation, suggesting further range-bound prices until block halving. https://talkimg.com/images/2023/09/10/mgdWf.png (https://www.tradingview.com/chart/BLX/uMUkplNy-BTCUSD-If-Bitcoin-Repeats-History-Extrapolating-2012-Breakdown/) Source: Trading View, September 16th 2019. Screenshot: January 6th 2020. (https://www.tradingview.com/chart/BLX/uMUkplNy-BTCUSD-If-Bitcoin-Repeats-History-Extrapolating-2012-Breakdown/) Part 6: If Bitcoin Repeats History? Monthly TD Sequential Red 1 (Neutral - Active) Update 23/12: The Red 5 candle remains definitively on the bearish path, implying another 2-4 months of correction, with an implied dump this month. https://talkimg.com/images/2023/09/10/mgwQZ.png (https://www.tradingview.com/chart/BLX/HAUjlGtc-BTCUSD-If-Bitcoin-Repeats-History-Monthly-TD-Sequential-Red-1/) Source: Trading View, September 28th 2019. Screenshot: January 6th 2020. (https://www.tradingview.com/chart/BLX/HAUjlGtc-BTCUSD-If-Bitcoin-Repeats-History-Monthly-TD-Sequential-Red-1/) Part 10: Extrapolating the 50 & 200 Day MA bear crosses (Short - Active) Update 23/12: Price is precisely same level as 2018 bear-cross after reaching it's first 75% probability target of $6.4K, the next 75% probability target is $4K. https://talkimg.com/images/2023/09/10/mgAY8.png (https://www.tradingview.com/chart/BTCUSD/5ocQN4r6-BTCUSD-Extrapolating-the-50-200-Day-MA-bear-crosses/) Source: TradingView, October 27th 2019. Screenshot: January 5th 2020. (https://www.tradingview.com/chart/BTCUSD/5ocQN4r6-BTCUSD-Extrapolating-the-50-200-Day-MA-bear-crosses/) Own work (https://bitcointalk.org/index.php?topic=1159946.msg51280905#msg51280905): dragononcrypto (https://www.tradingview.com/u/dragononcrypto/) Title: Re: Bitcoin Repeating History: 10 Part TA Series (September-October 2019) Post by: dragonvslinux on January 23, 2020, 09:48:56 AM OP finally updated, a few parts no longer active, only a few that remain relevant now. Half have now completed.
Descending Triangle Breakdowns Part 4: If Bitcoin Repeats History? Extrapolating 2012 Breakdown Other Indicators Part 9: TD Sequential 9 Next Week To Decide Direction? Part 10: Extrapolating the 50 & 200 Day MA bear crosses Click on images for "live" trading view charts, see next post (https://bitcointalk.org/index.php?topic=5188537.msg52592987#msg52592987) for newer analysis More relevant is some TA from the past few months: Recent Bitcoin TA: https://talkimg.com/images/2023/09/10/mBSoH.png (https://www.tradingview.com/chart/BLX/x1qlgpz8-BTCUSD-Two-Four-Year-MA-s-Claim-It-s-Time-To-Accumulate/) https://talkimg.com/images/2023/09/10/mBZlg.png (https://www.tradingview.com/chart/BTCUSD/vtFKuk1E-BTCUSD-Extrapolating-2014-Correction-Could-6-500-Be-The-Low/)[/center] https://talkimg.com/images/2023/09/10/mBQjd.png (https://www.tradingview.com/chart/BLX/fYAFsDj8-BTCUSD-Volume-Profile-Accumulation-Zone-5-910-8-630/) Will probably update this monthly from now on, unless the there are major changes in how these 3 final parts are looking. Title: Re: Bitcoin Repeating History: 10 Part TA Series (September-October 2019) Post by: dragonvslinux on January 30, 2020, 10:00:00 AM Updated OP summary with results of initial targets (❓/❌/✔) for transparency sake. Looks like my summarized target has been achieved ;)
If Bitcoin Repeats History? Descending Triangles Breakdown Summary
That's a range between $2,500 and $6,875, with anywhere between 2-18 months of consolidation. ✔ Conclusion: Anything could happen. Look for clues. Prediction reference: Published on TradingView (Part 5) (https://www.tradingview.com/chart/BLX/IYyJeGzs-BTCUSD-If-2017-Descending-Triangle-Repeats-Best-Case-Scenario/) September 17th 2019 @ $10,265. As a reminder, we are now at the horizontal resistance level of the descending triangle breakdown, in case you might be wondering why price is facing resistance: https://talkimg.com/images/2023/09/10/m9bZ3.png (https://www.tradingview.com/chart/BTCUSD/lfSA4LWe-BTCUSD-Measuring-The-Move-of-the-Descending-Triangle-Breakdown/) Although a descending triangle from many months ago may seem irrelevant, on the bigger picture, it's still the resistance level that needs to be broken (and found support above) for price to move higher. Fortunately, this isn't the first time testing this resistance level, so the chances of making breaking above and turning it into support is more likely, though bare in mind this acted as support for 3 months (July-September), hence acting as resistance for 3 months would not be surprising (October-January). Credit to @Sawcruhteez for reminding me (https://www.youtube.com/watch?v=wrrQkILTB9Y) of this resistance level, despite the confirmation of a cup & handle pattern with a target of $11,800. Personally, I wouldn't be surprised to see prices move upto $10K this week based on 2019 possible fractal, followed by a pull back, then further upside: https://talkimg.com/images/2023/09/10/m9pkw.png (https://www.tradingview.com/chart/BTCUSD/aV6MM1zp-BTCUSD-VPVR-Part-2-Volume-Point-of-Control-Now-Turned-Support/) Title: Re: Bitcoin Repeating History: 10 Part TA Series (September-October 2019) Post by: dragonvslinux on March 14, 2020, 12:09:00 PM Thought it was time to review some of last year's technical analysis before attempting to provide any fresh perspectives.
Part 1 and 3 have therefore been re-activated due to their relevance returning with Part 10 also cointuing to remain relevant: Part 1: Descending Triangle Looking Similar To 2018 (Short - Re-active) Update 14/03/20: Price broke through major support that will now act as strong resistance, putting the $2,600 possibility back on the table. https://talkimg.com/images/2023/09/10/m5ei9.png (https://www.tradingview.com/chart/BTCUSD/kRkd0baZ-If-Bitcoin-Repeats-History-Descending-Triangle-Looking-Similar/) Part 3: A repeat of 2014? Worst Case Scenario A $2,500 Low (Short - Re-active) Update 14/03/20: Price has fallen back into the 2014 fractal, with $6,200 now anticipated as strong resistance as indicated. $2,500 is back on the table. https://talkimg.com/images/2023/09/10/m50wN.png (https://www.tradingview.com/chart/BLX/g0rcfzsk-BTCUSD-A-repeat-of-2014-Worst-Case-Scenario-A-2-500-Low/) Part 10: Extrapolating the 50 & 200 Day MA bear crosses (Short - Active) Update 14/03/20: Price is noticeably dropped to similar levels as the 2012 death cross, . https://talkimg.com/images/2023/09/10/m5lEa.png (https://www.tradingview.com/chart/BTCUSD/5ocQN4r6-BTCUSD-Extrapolating-the-50-200-Day-MA-bear-crosses/) Similar to Tone Vays who thinks there's a 10% of breaking new lows, I also believe there is a low chance (around 20-25%) of falling lower than the new $3,850 low. I will be providing some neutral/bullish analysis next week, after the Weekly close, as given the uber-bearish sentiment in the markets, I'm feeling more bullish again :D |
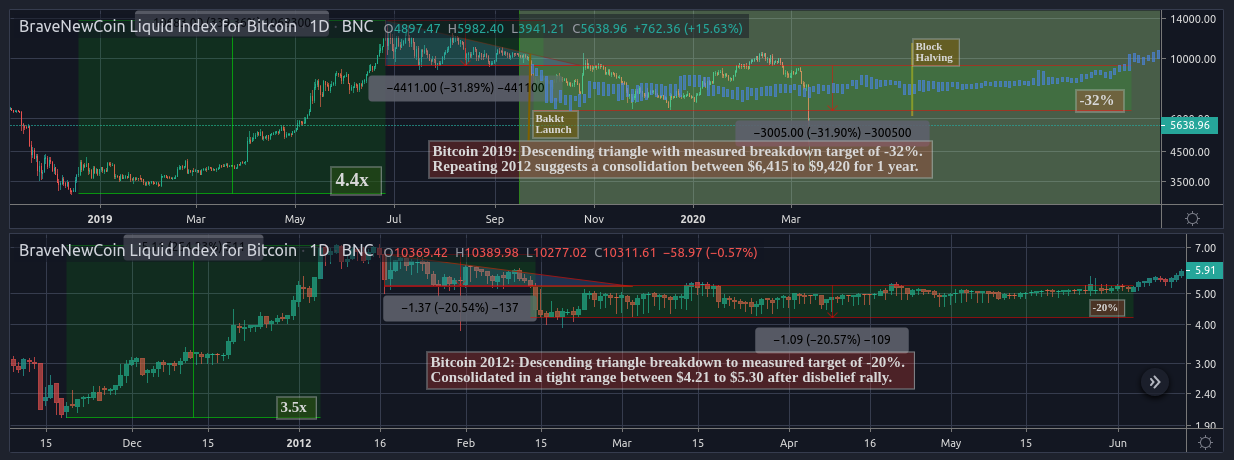
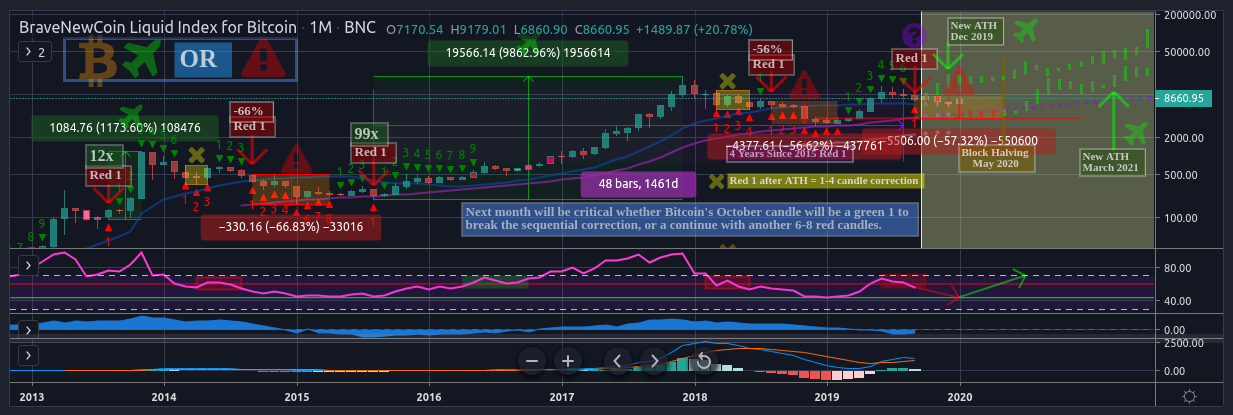
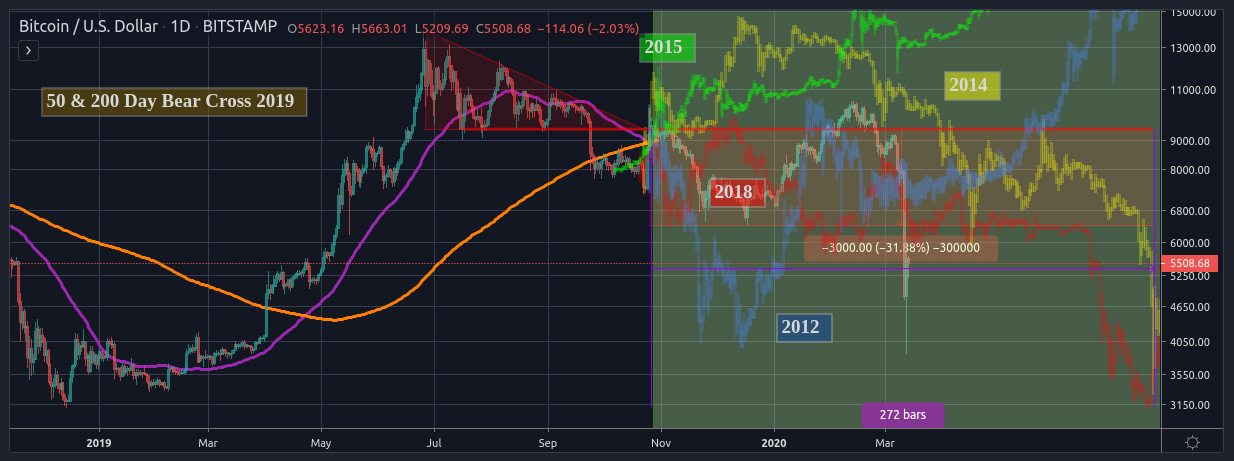
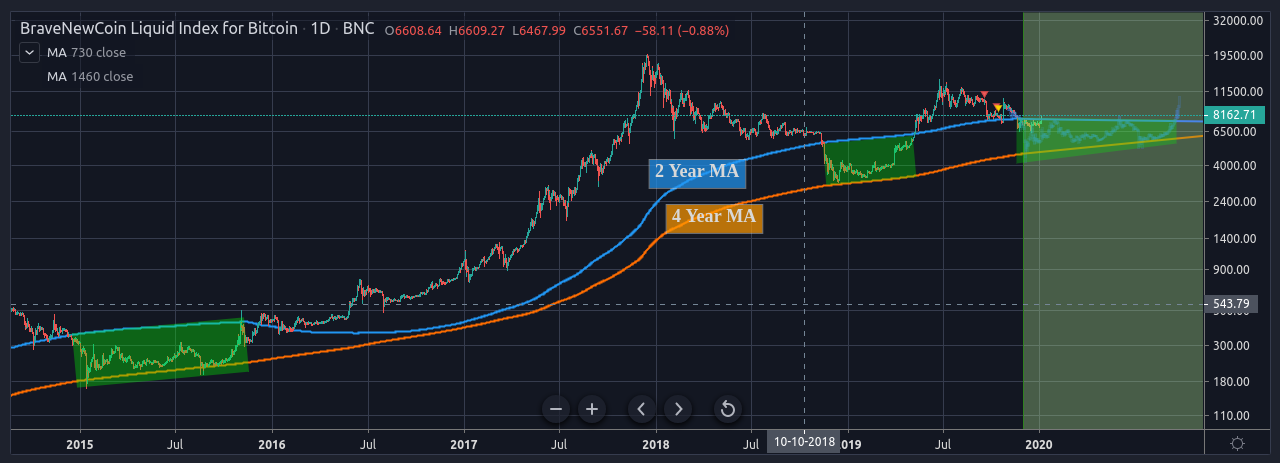
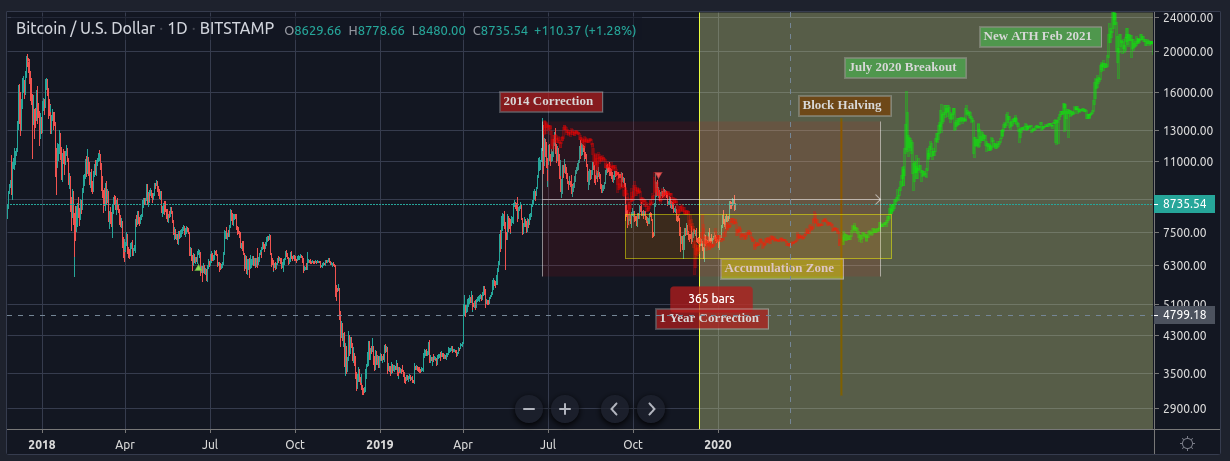
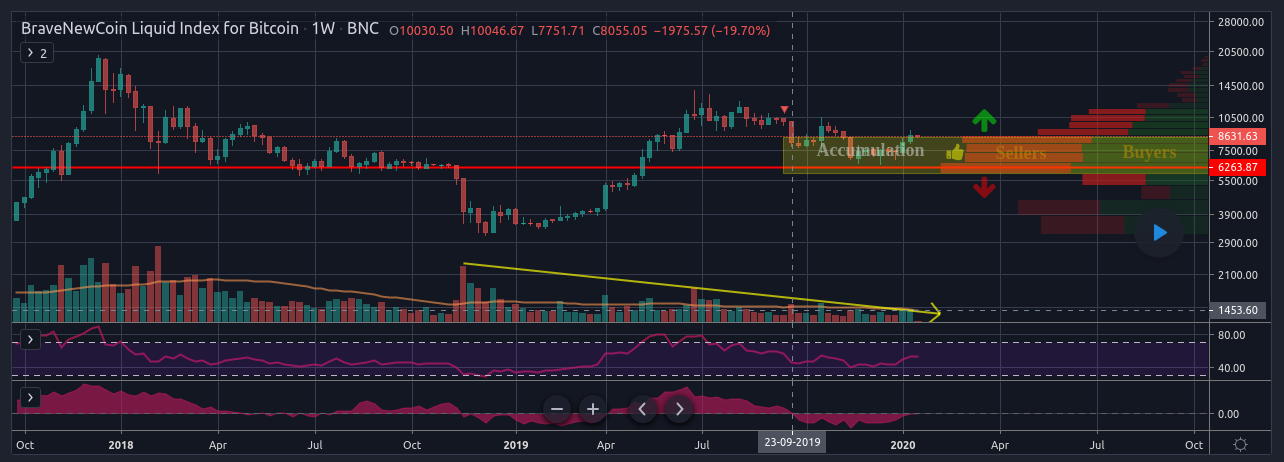
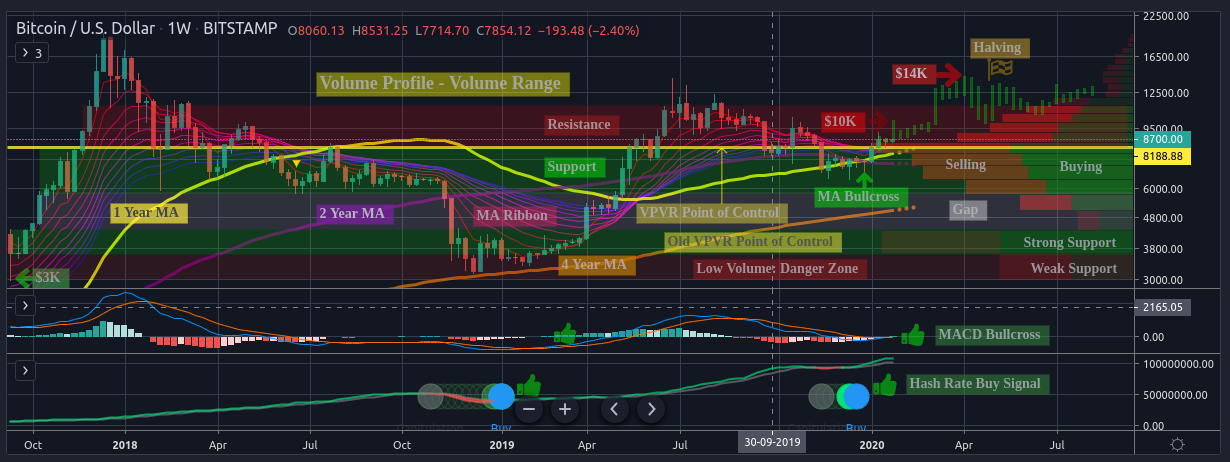
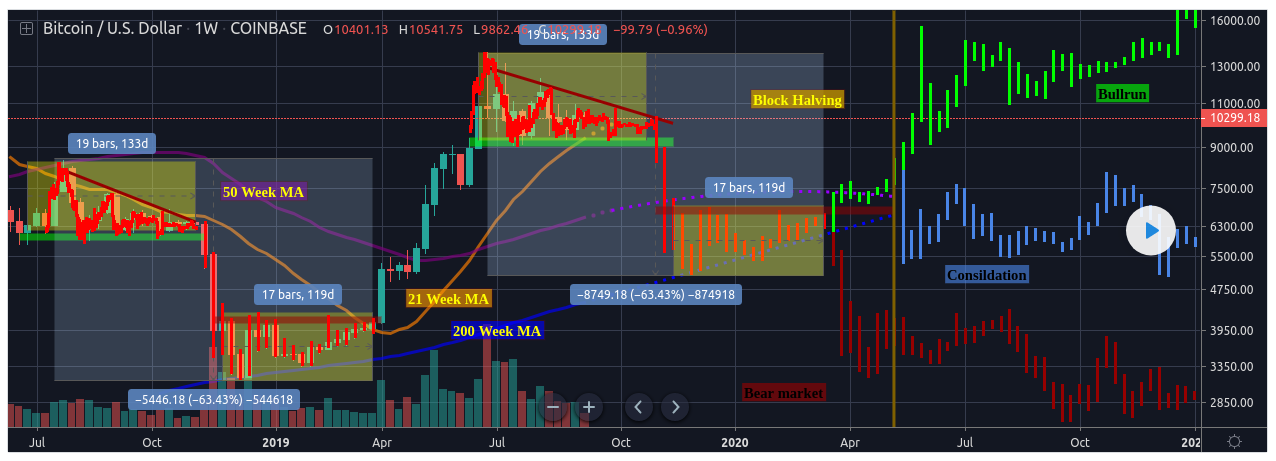
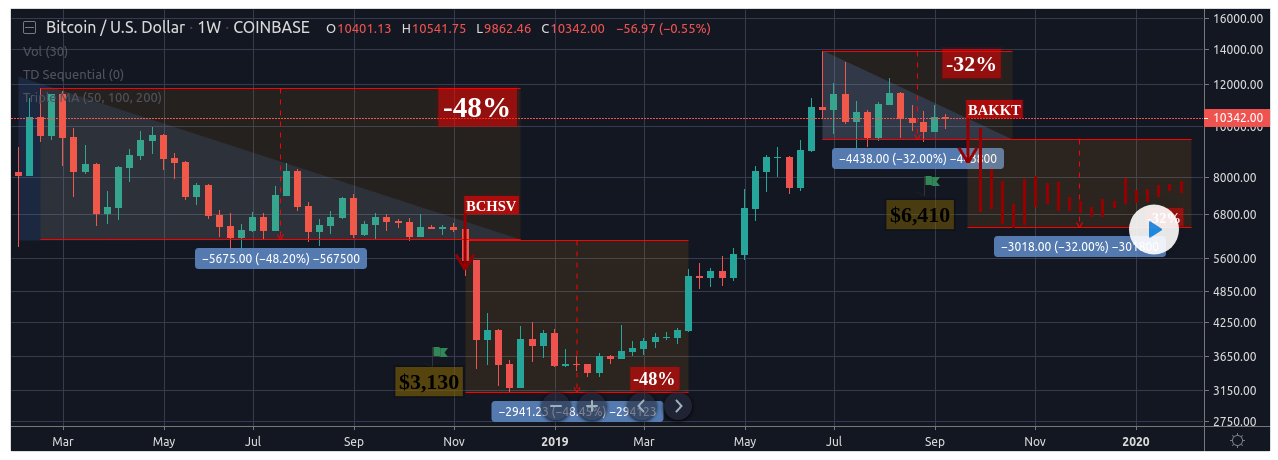
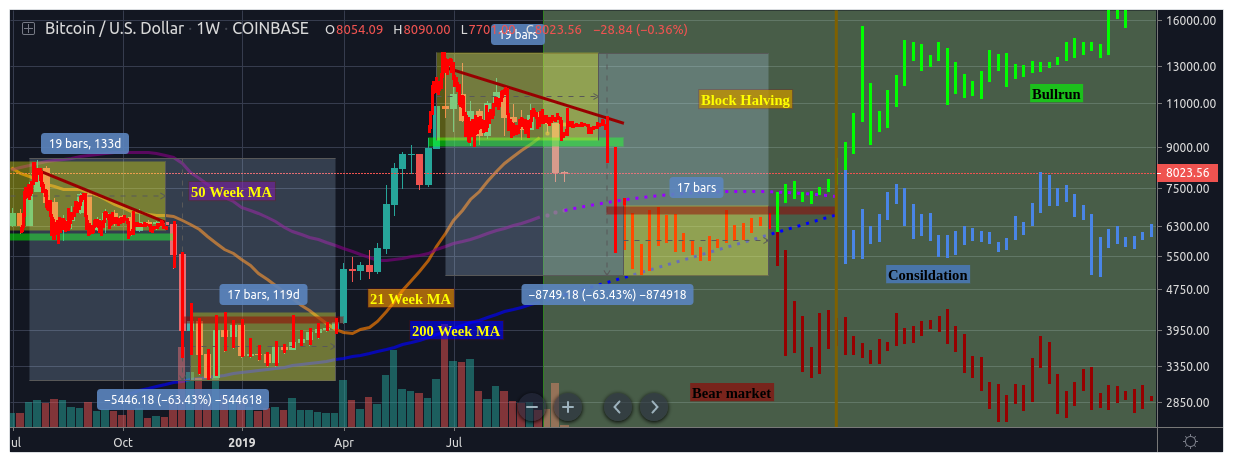
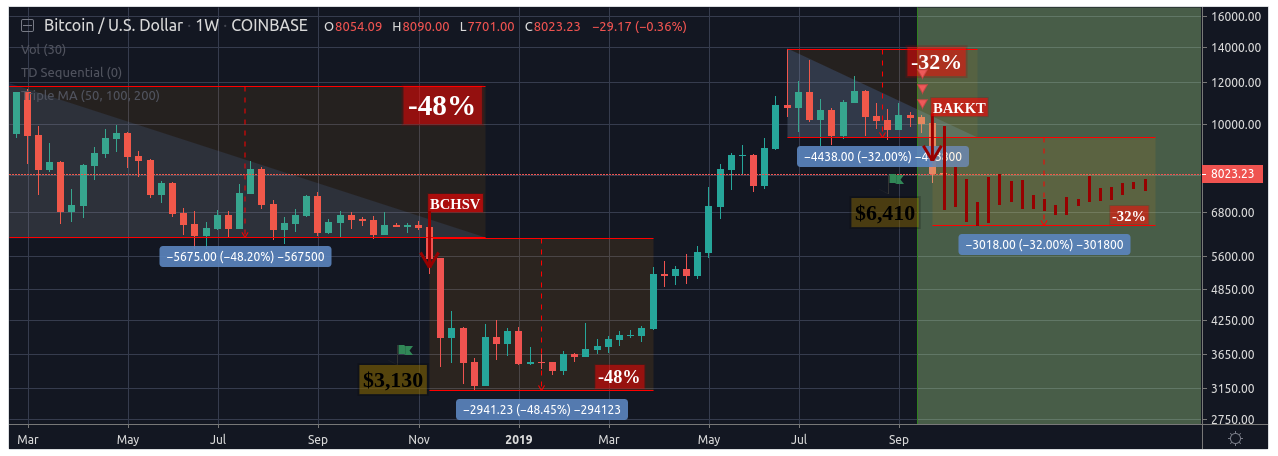
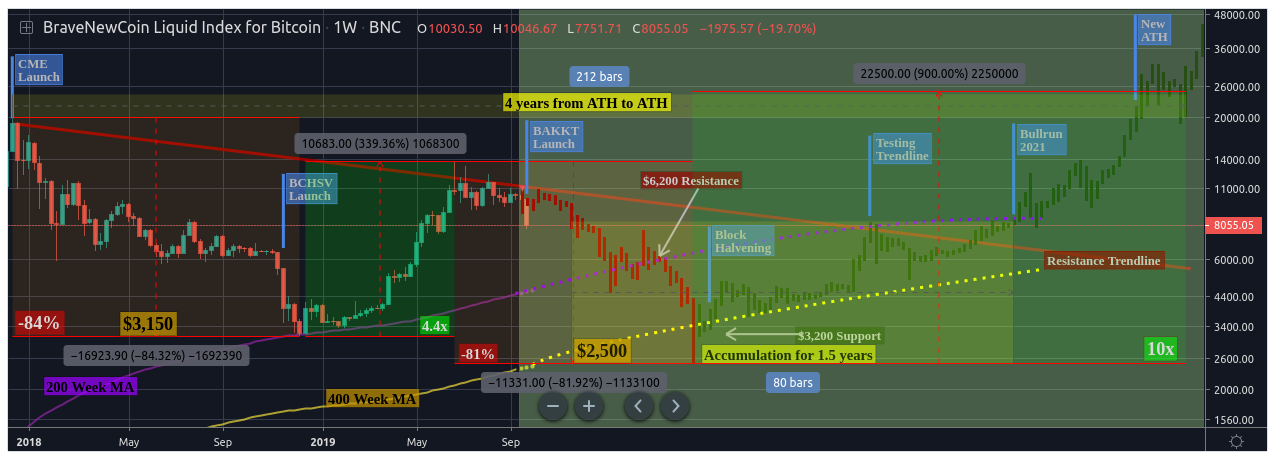
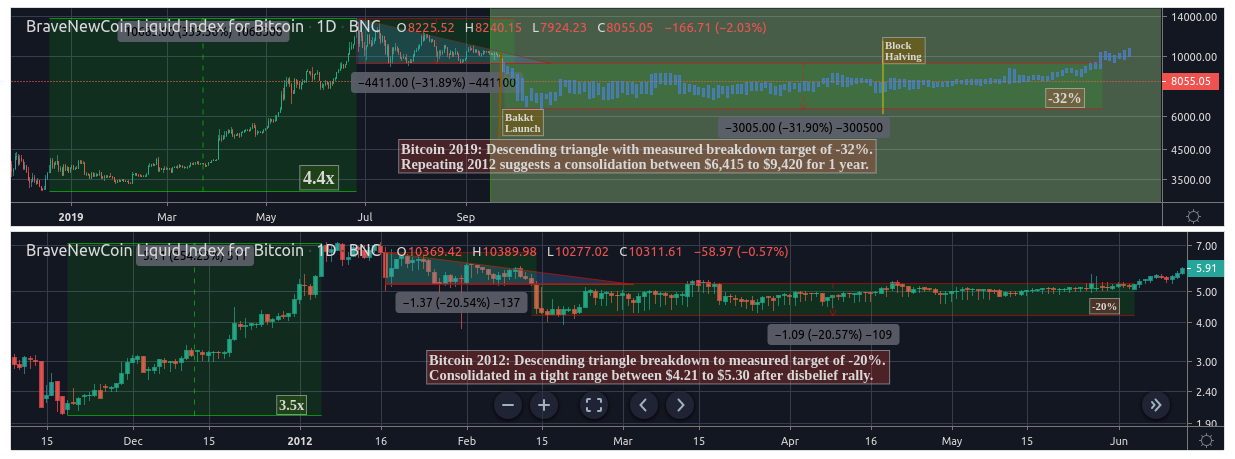
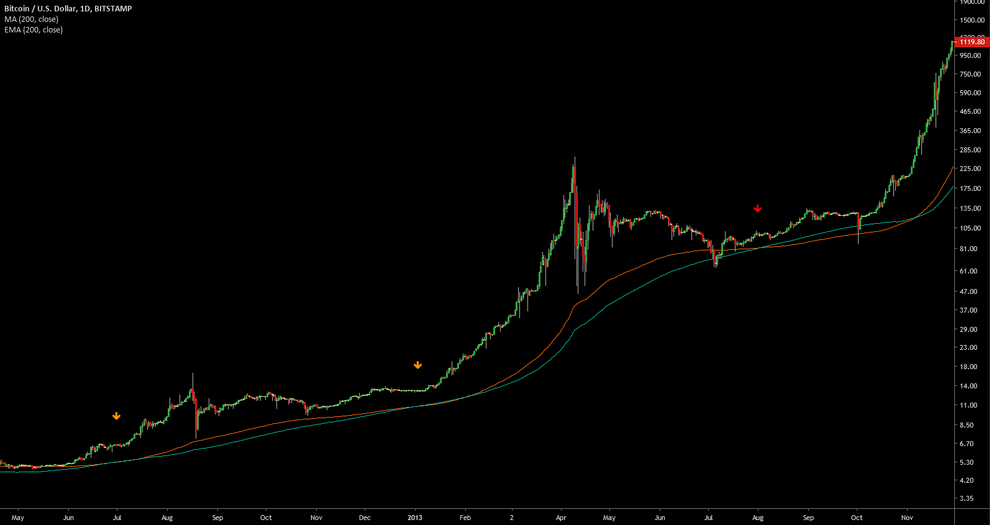
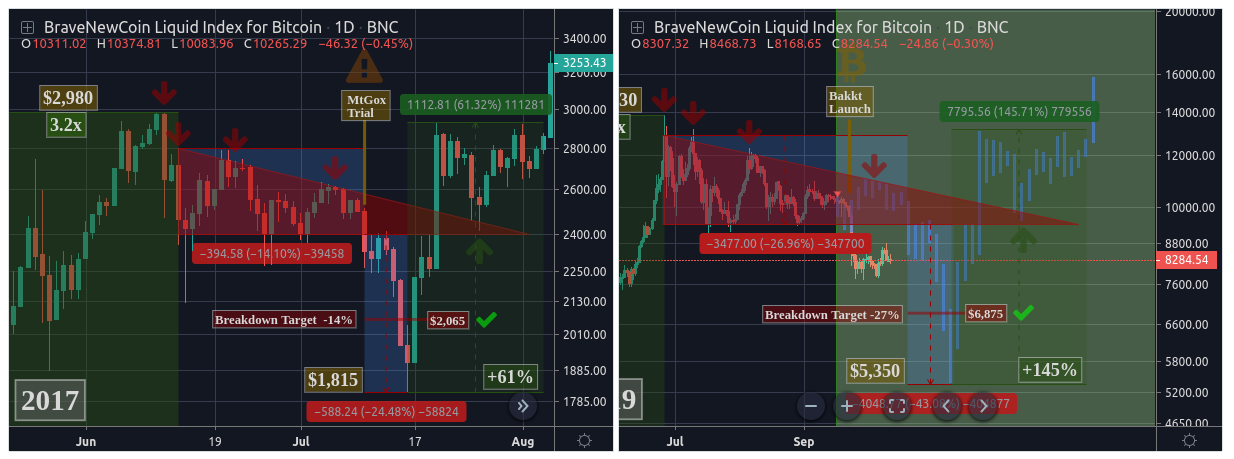
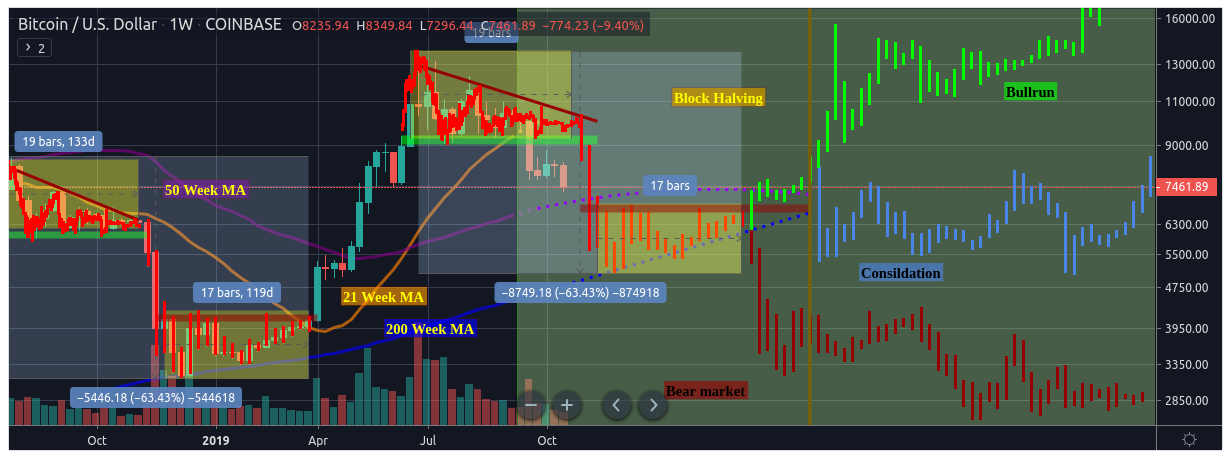
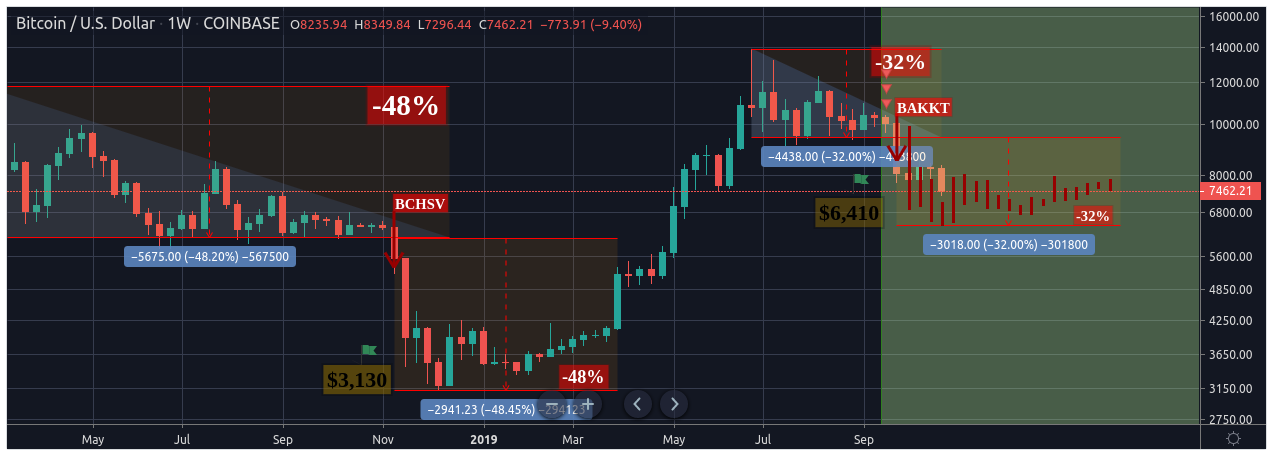
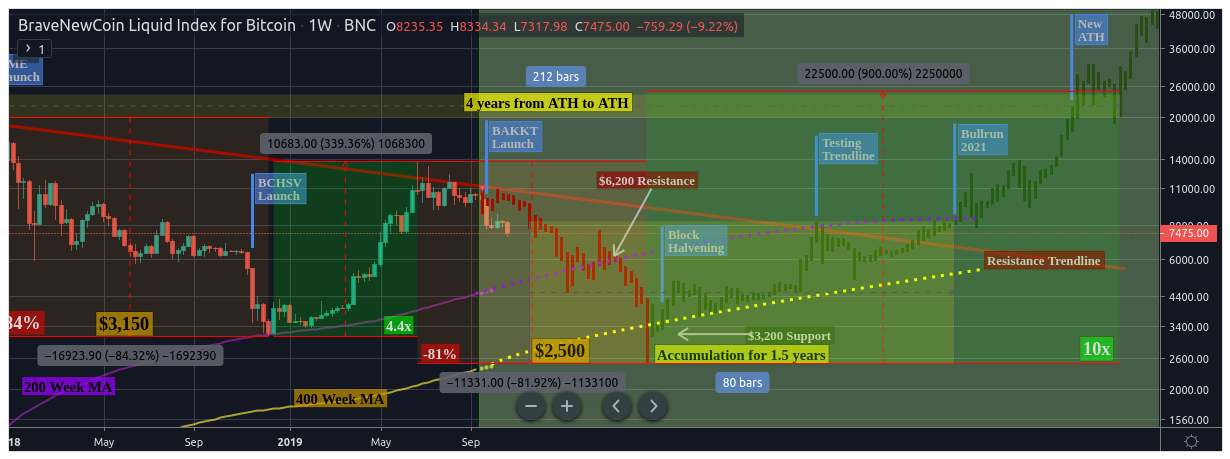
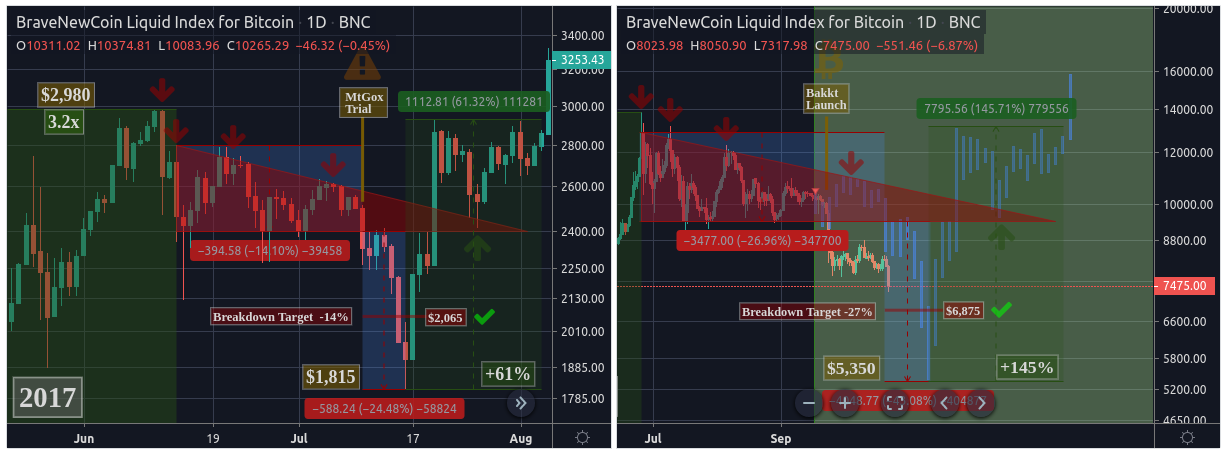
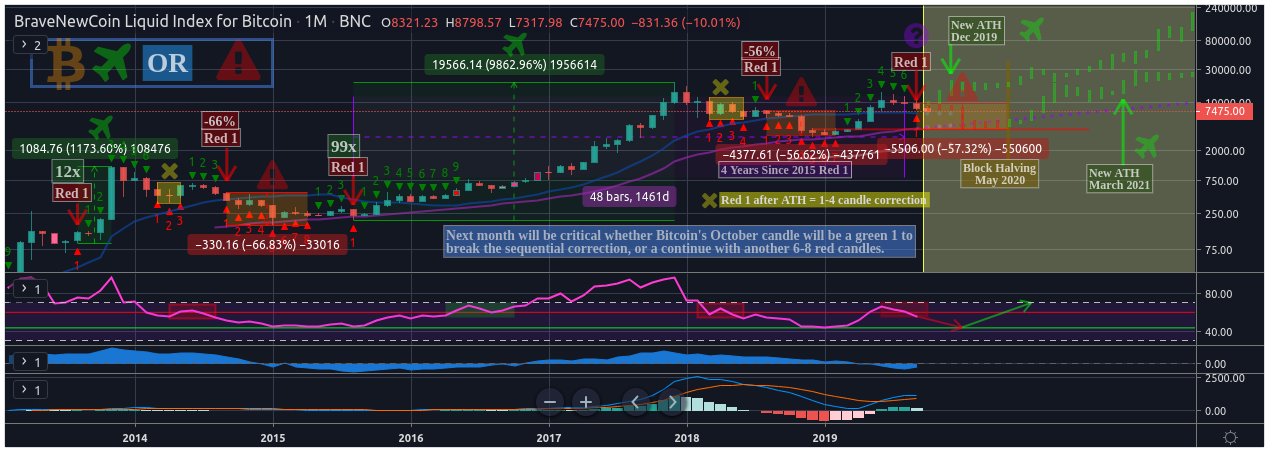
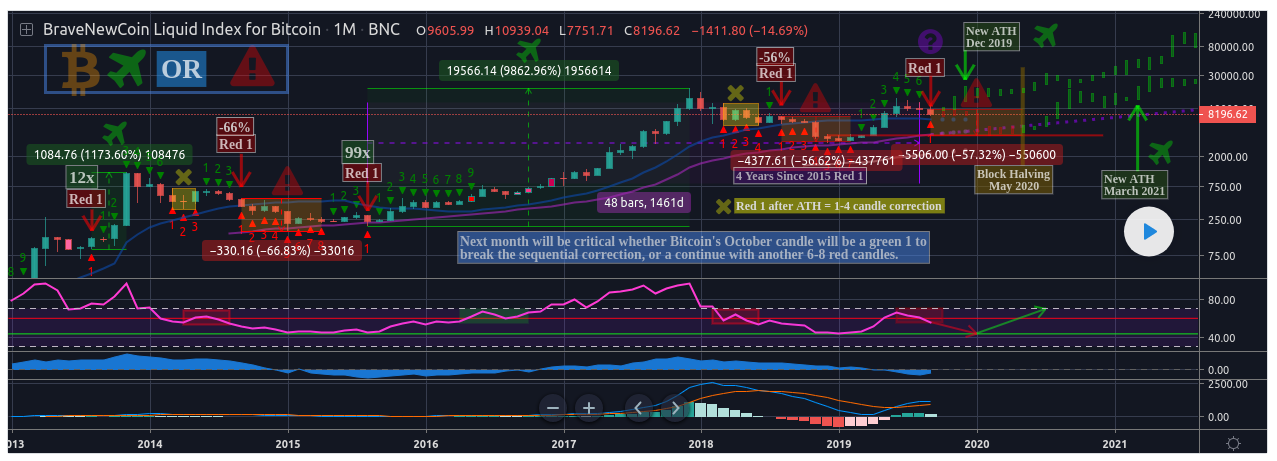
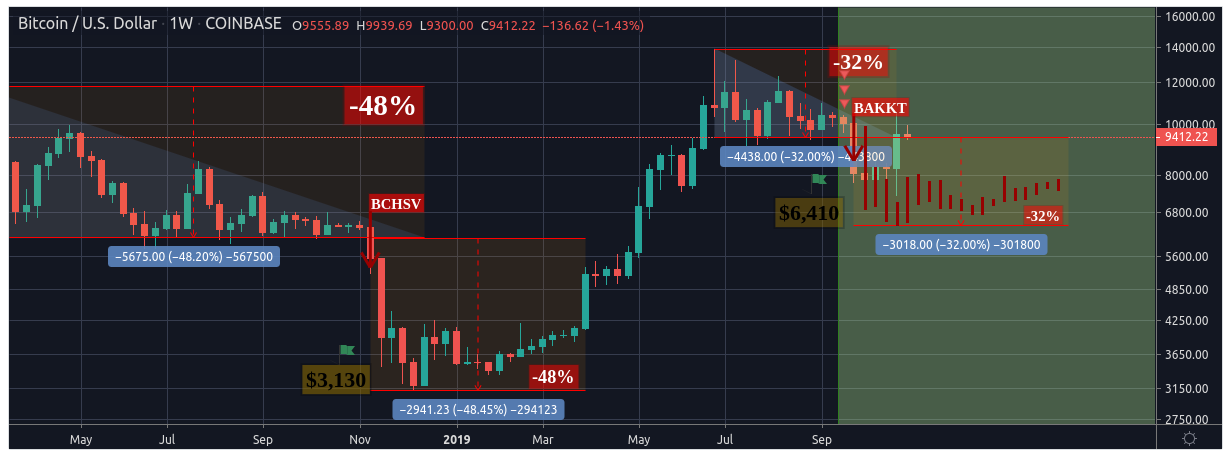
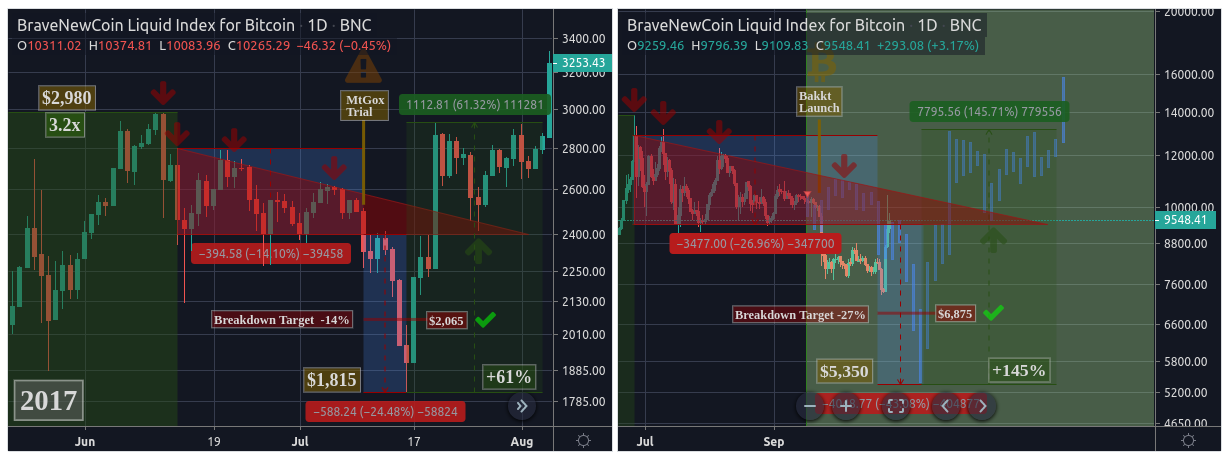
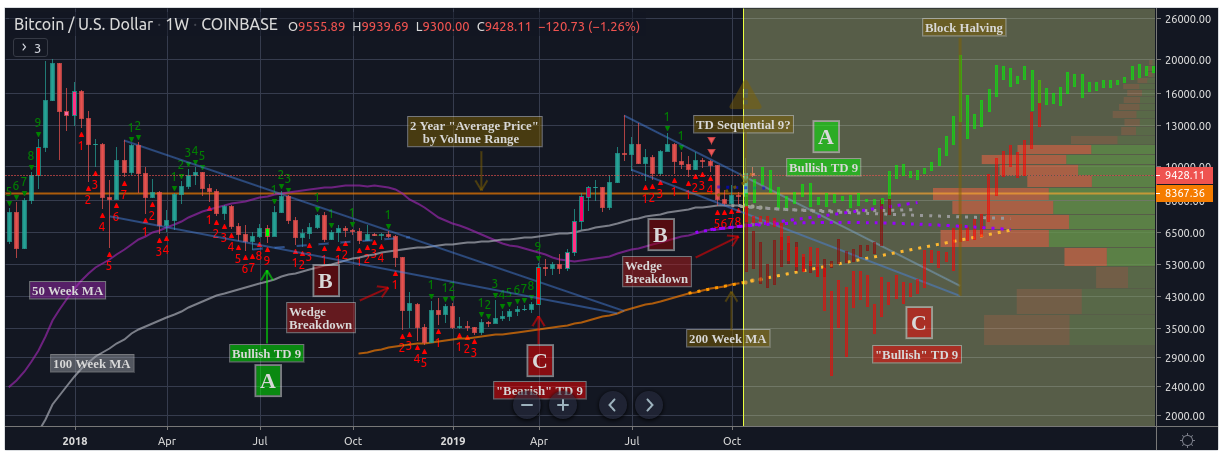
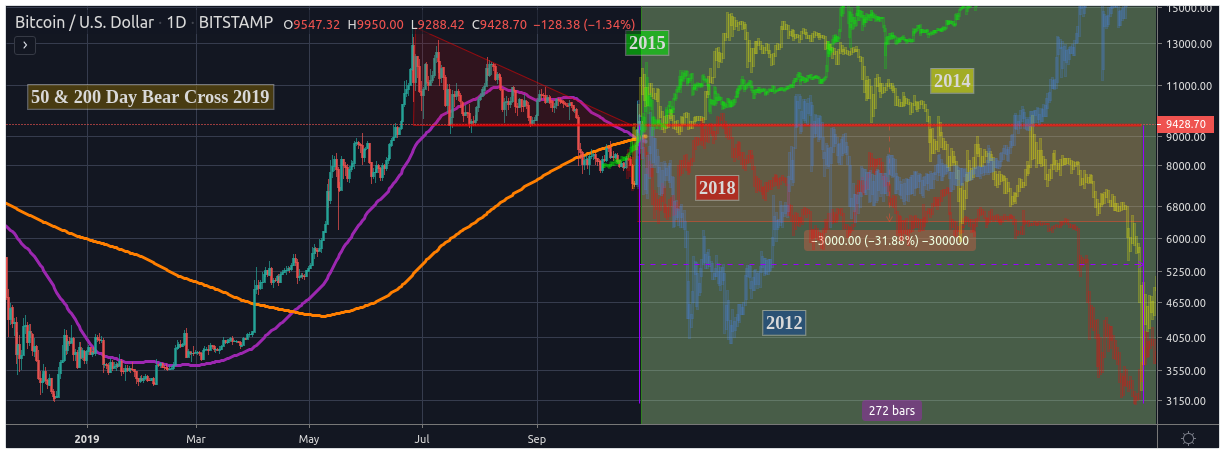
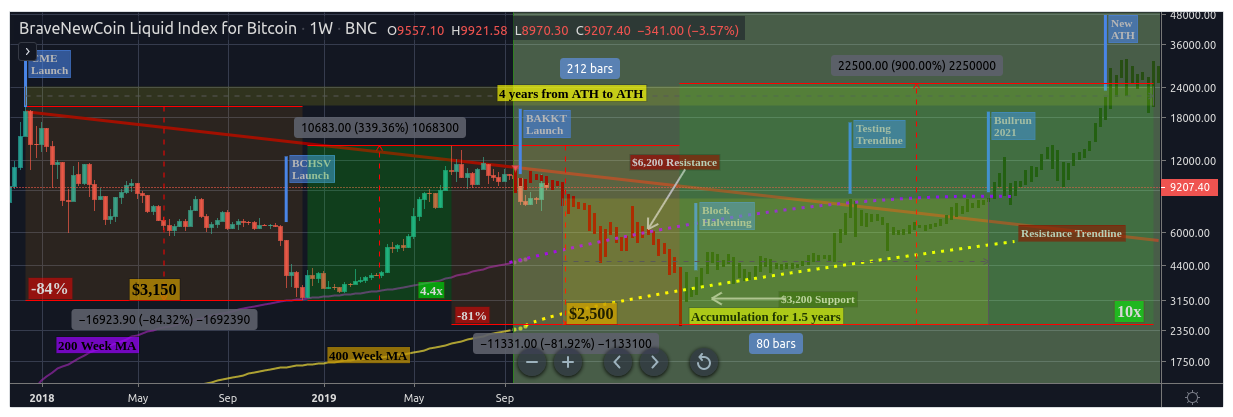
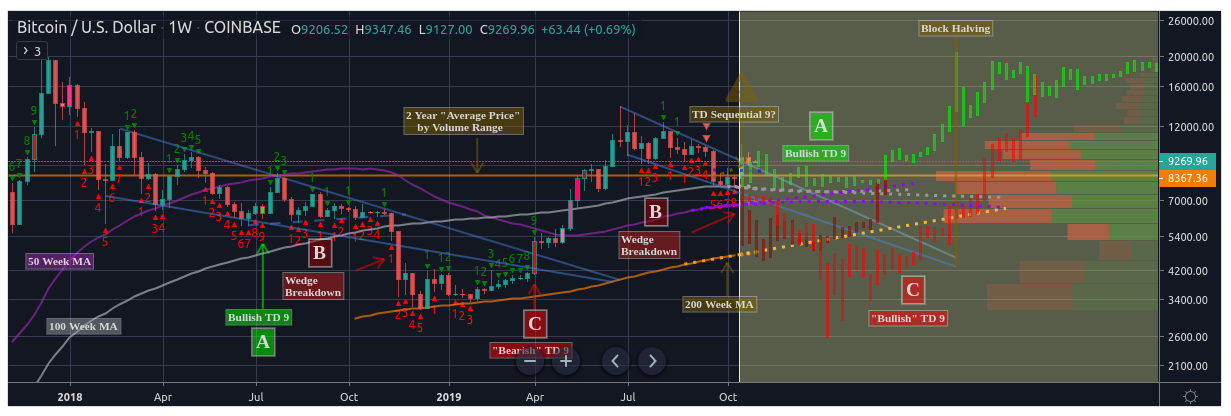
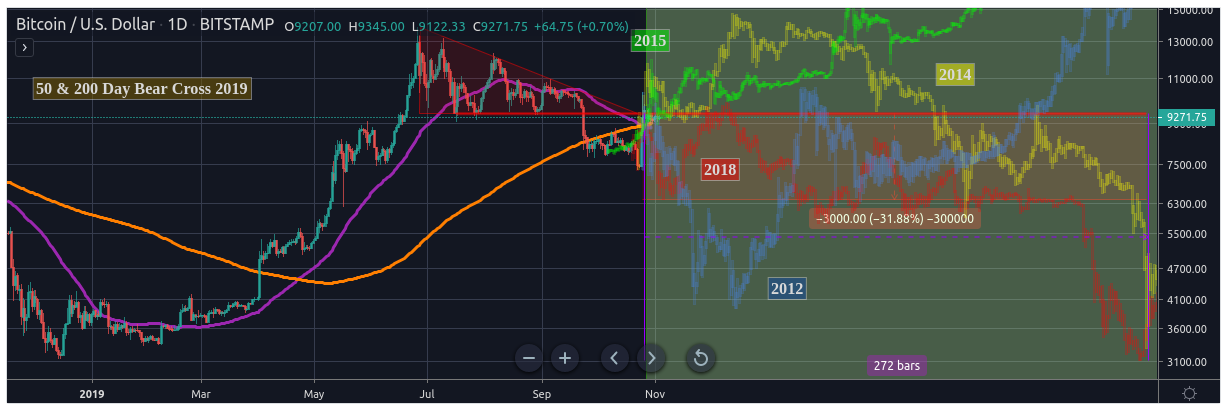
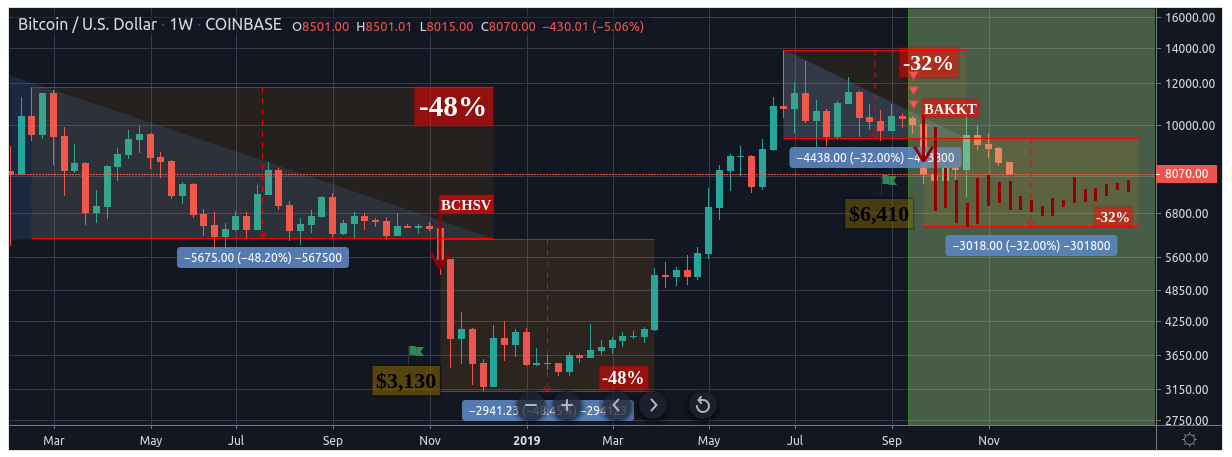
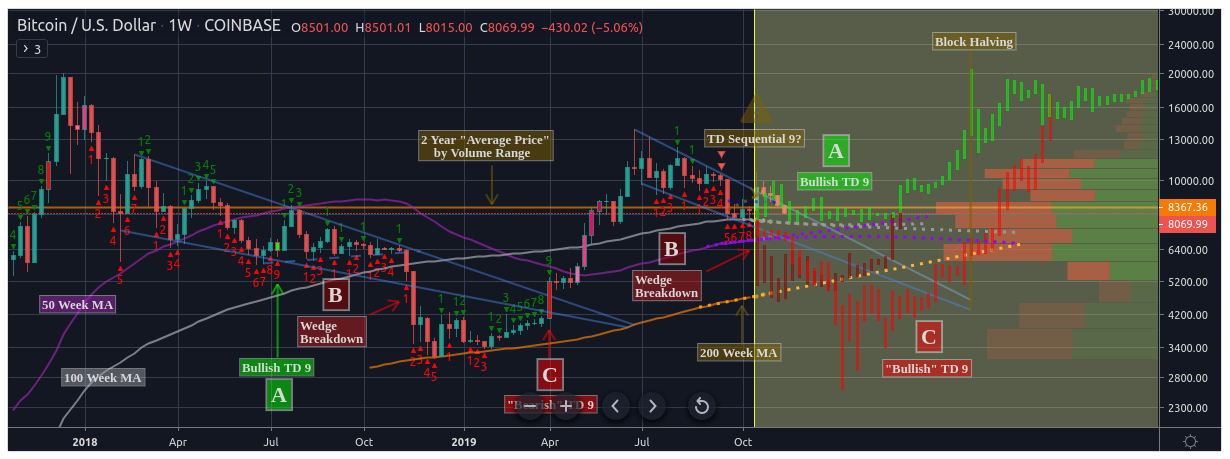
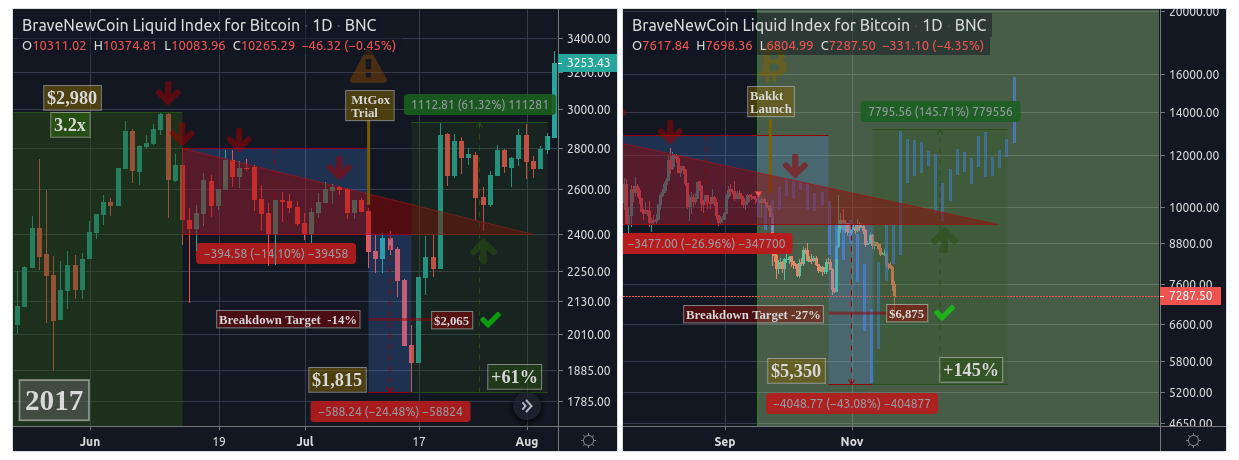
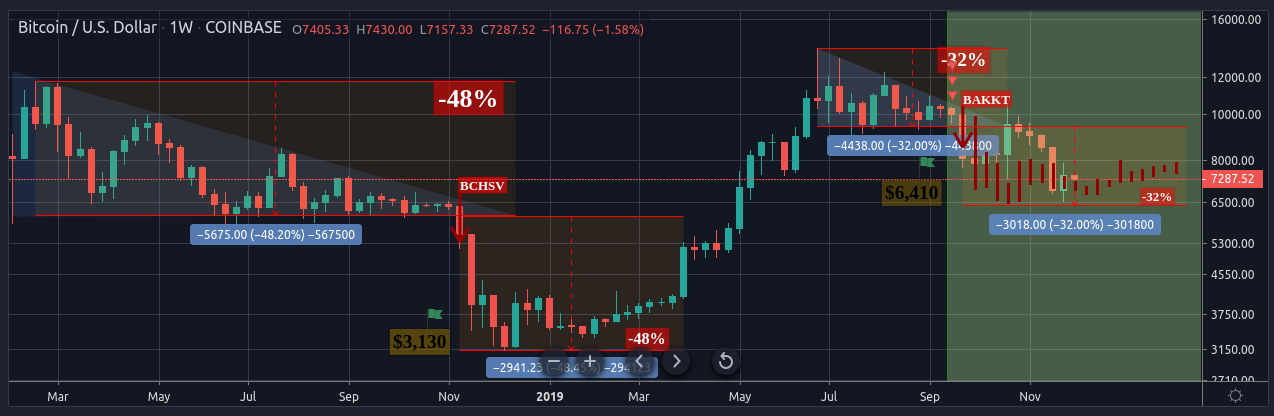
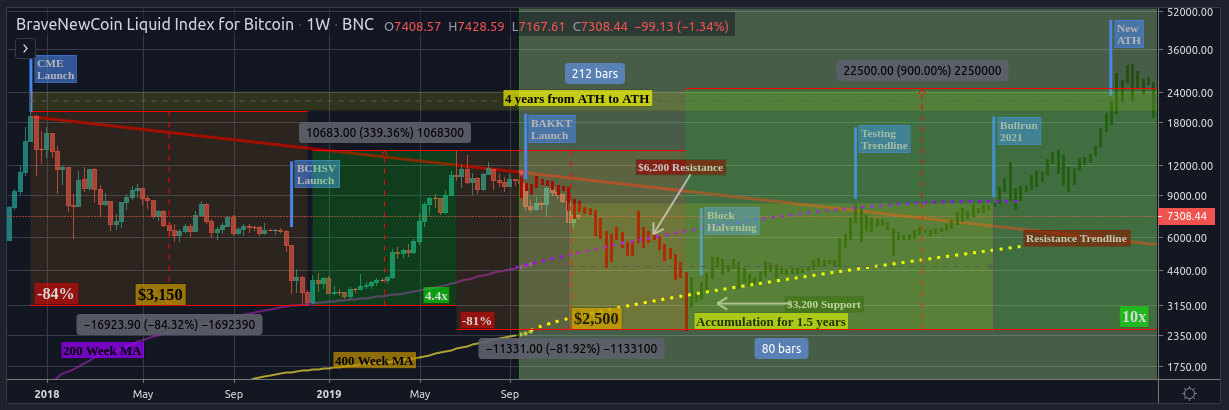
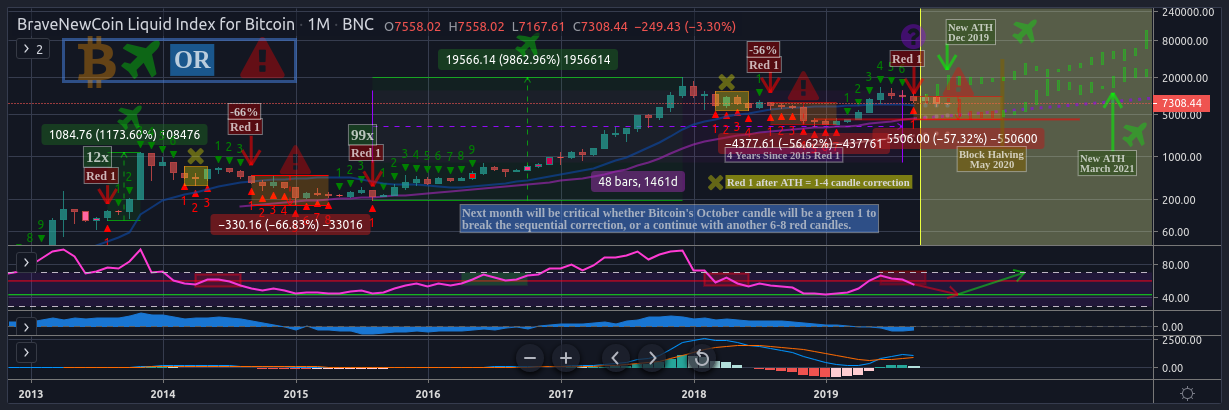
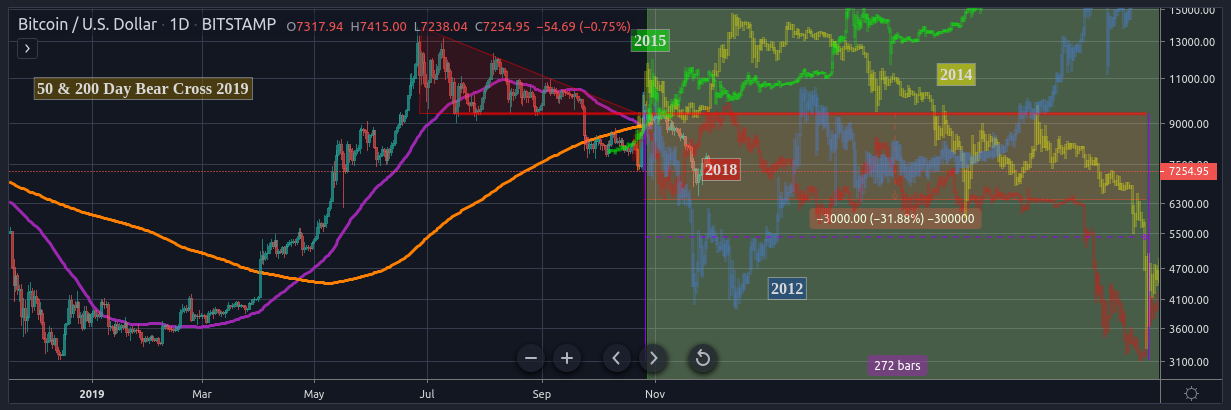
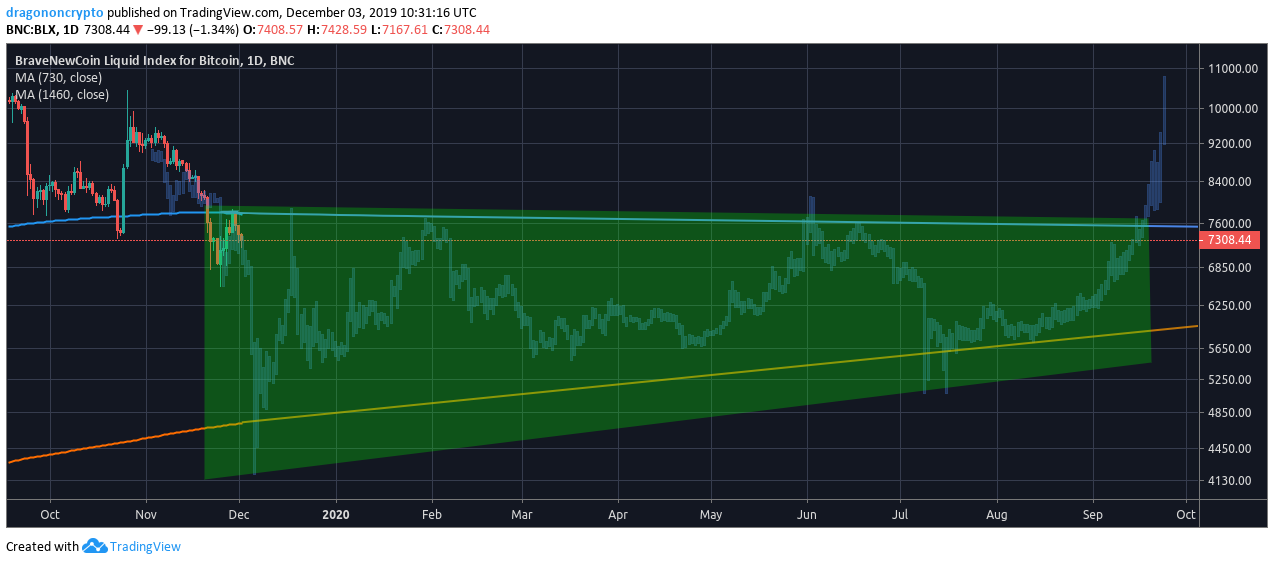
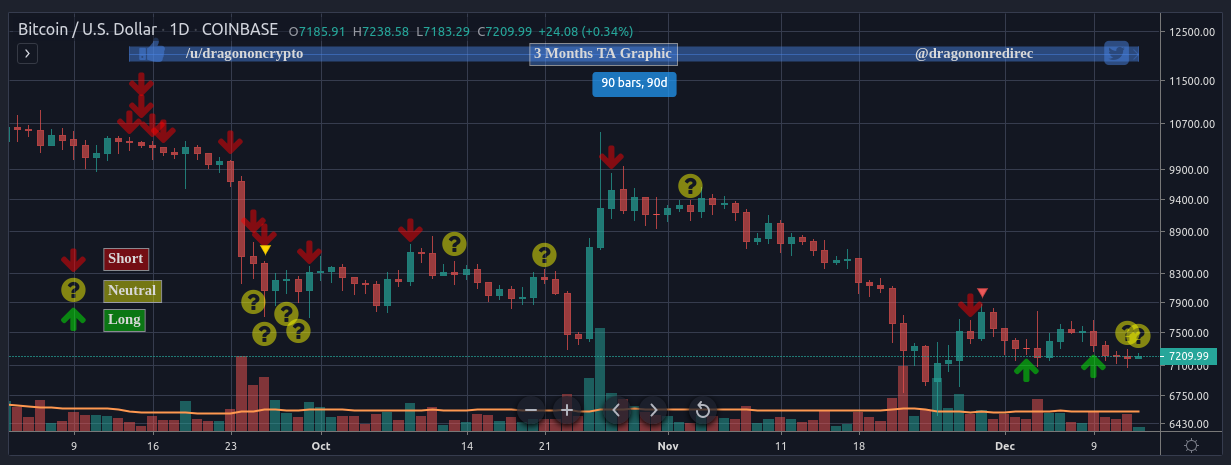
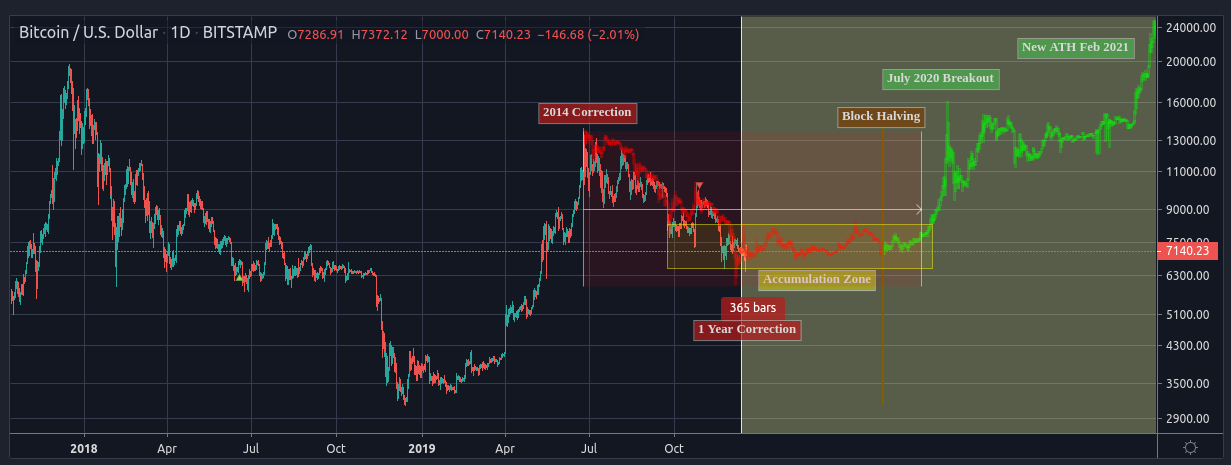
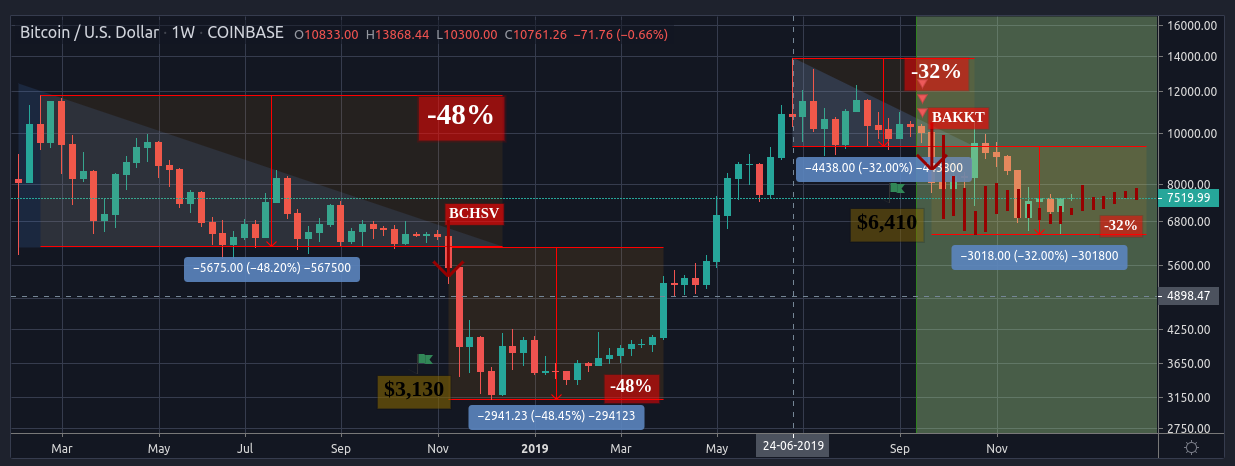
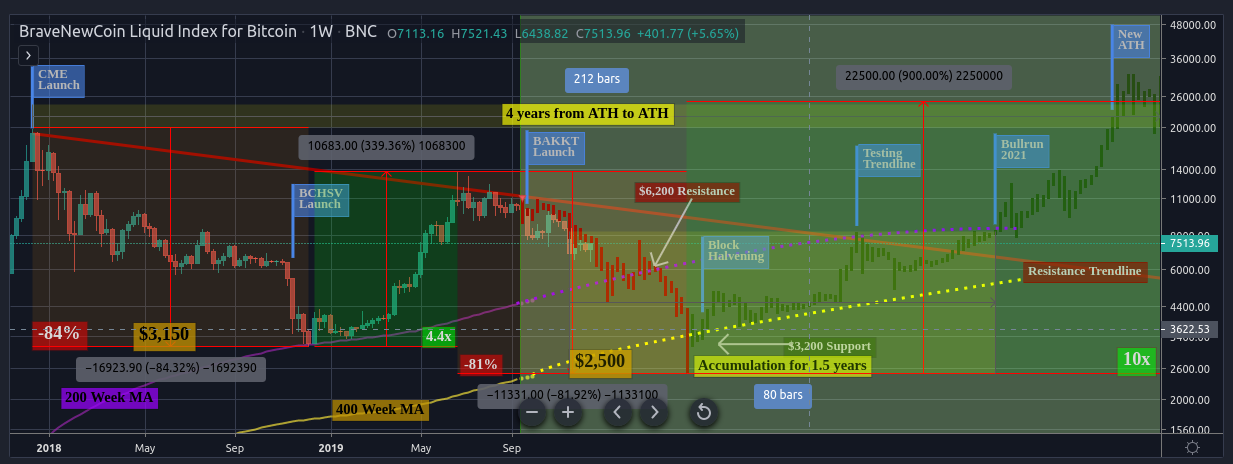
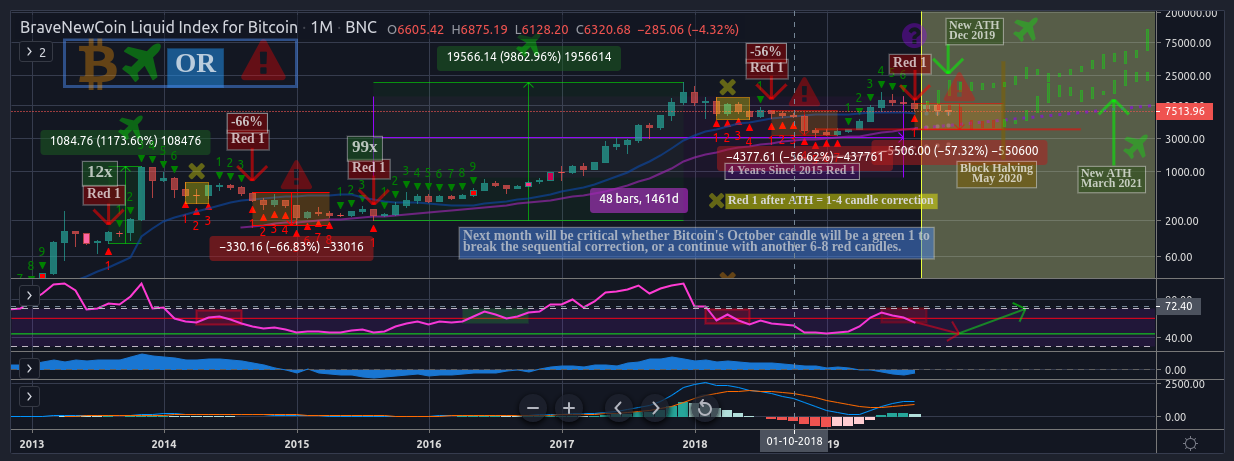
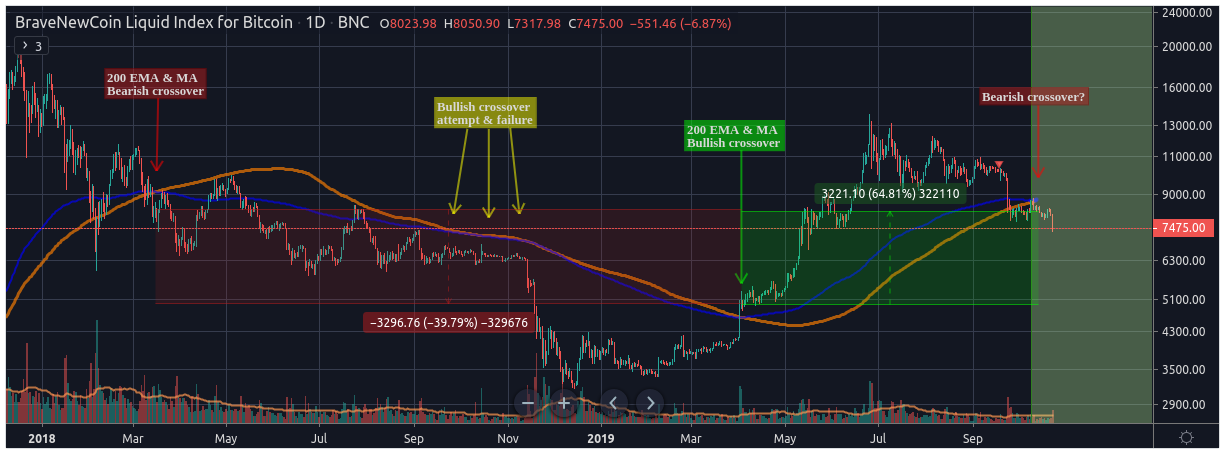
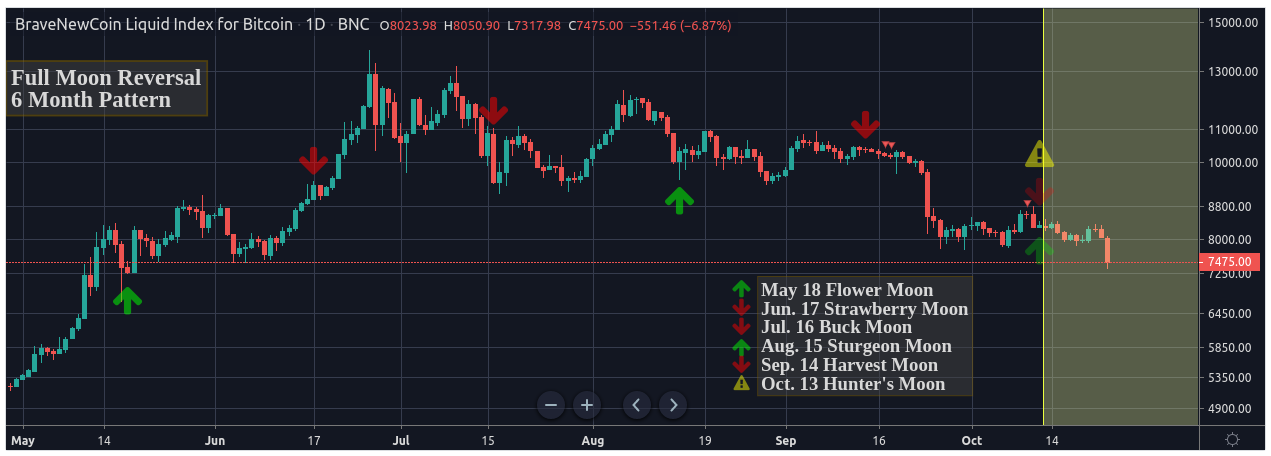
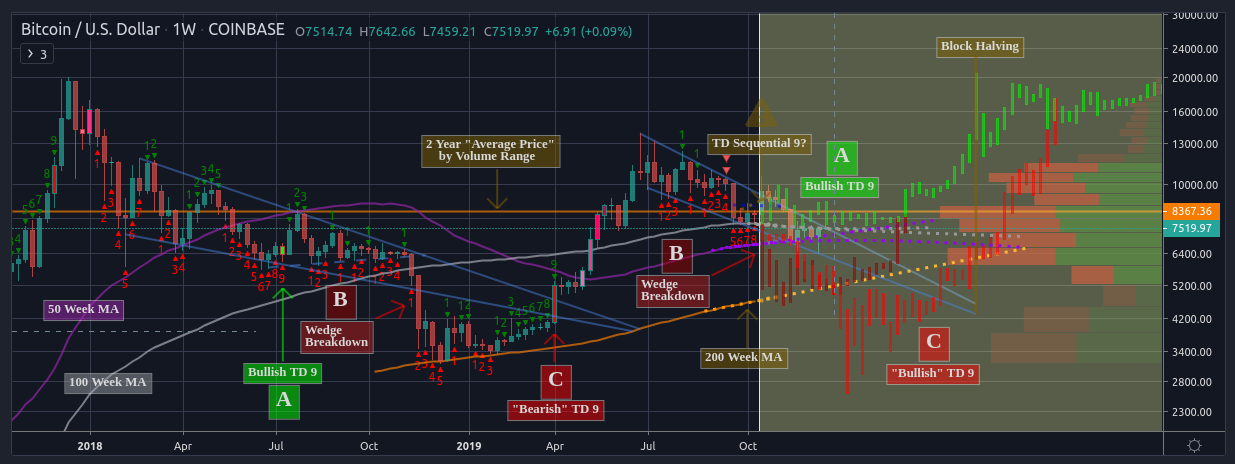
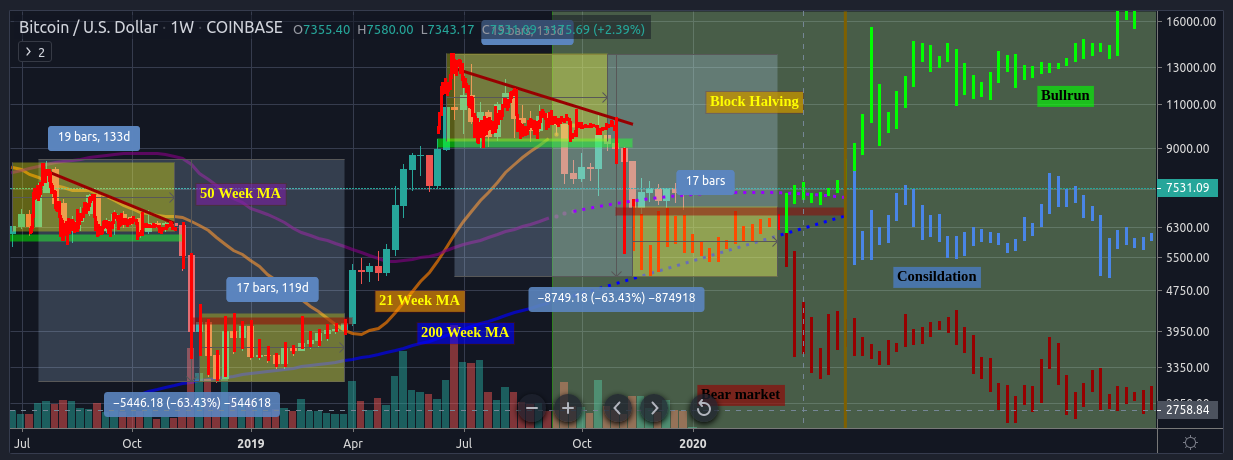
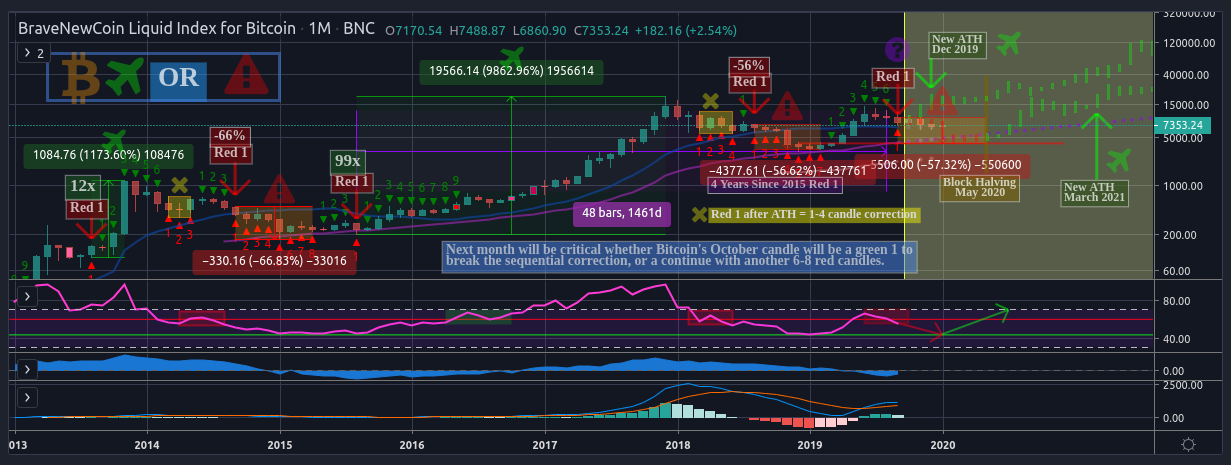
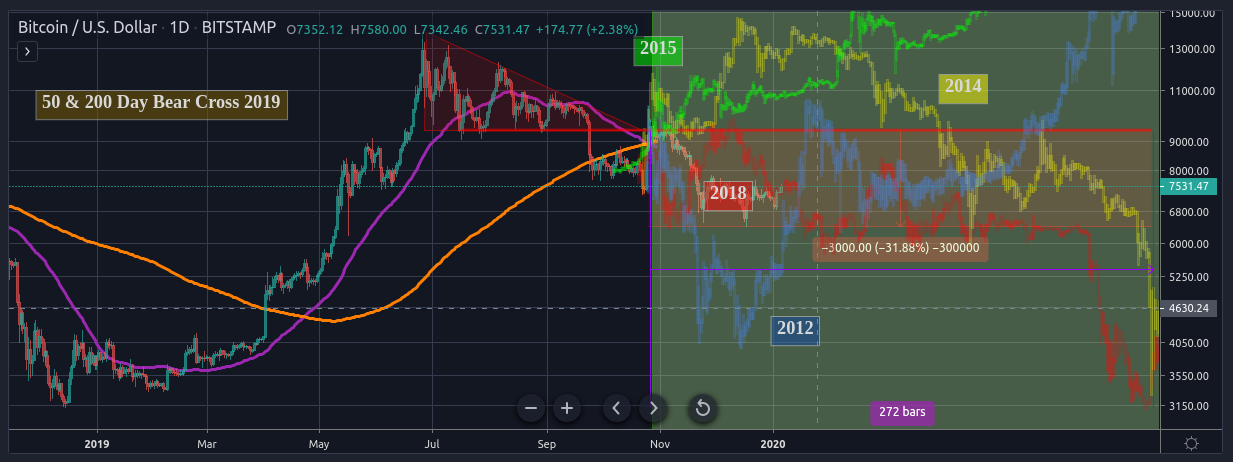
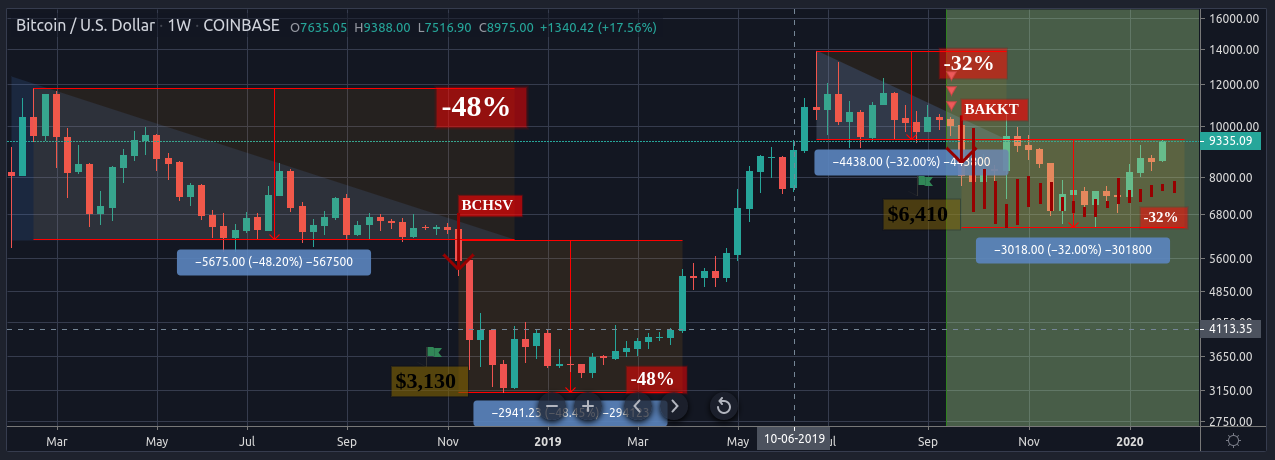
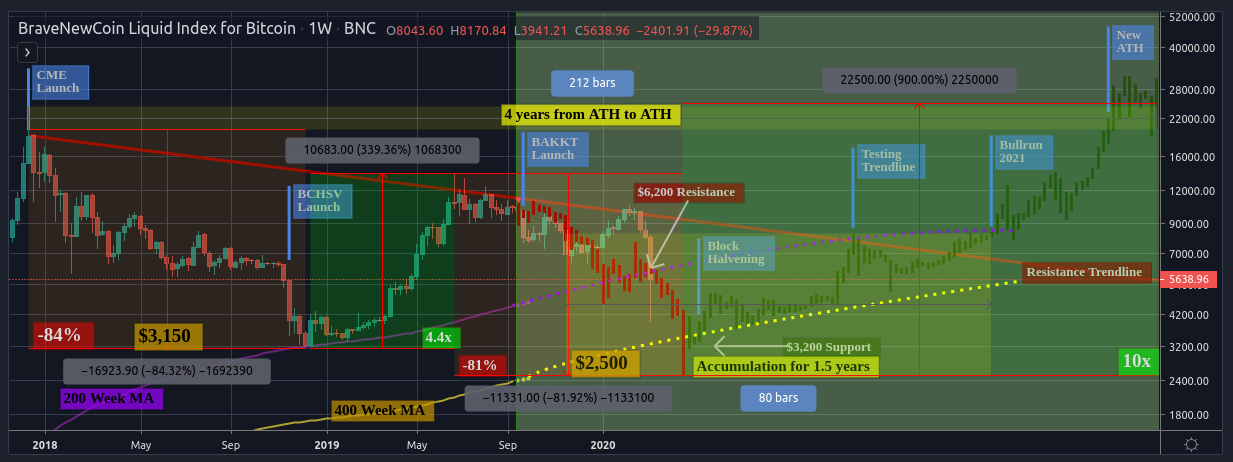