|
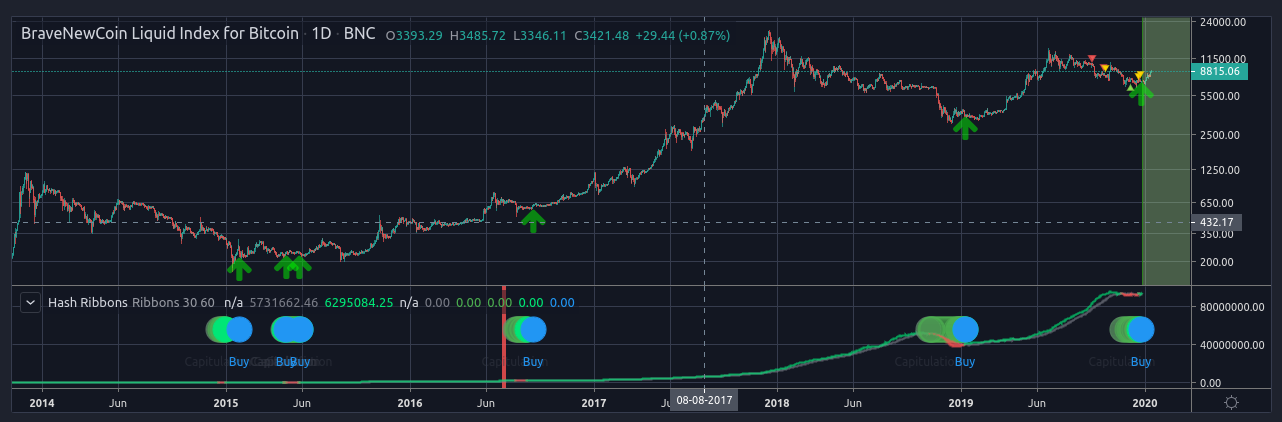
Title: Hash Ribbons Indicator confirms 10th buy signal in 9 years @ $7245 Post by: dragonvslinux on November 28, 2019, 11:20:21 AM Quote from: Charles Edwards - Hash Ribbons & Bitcoin Bottoms https://miro.medium.com/max/975/1*RbOHezG6zFJAC8H83k-9Ww.jpeg (https://medium.com/capriole/hash-ribbons-bitcoin-bottoms-60da13095836) Updated December 26th 2019 with relevant back-testing and bullish setup, original post can be seen below: Daily chart 2011-2015 - Reliably signaled bullish price movement following recovery of miner capitulation with price follow through: Signals (2011-2013): $4.08, December 27th 2011 (1) $5.09, May 20th 2012 (2) $6.46, June 22nd 2012 (3) $20.55, February 2nd 2013 (4) https://www.tradingview.com/x/QE7G3Rzw/ (https://www.tradingview.com/x/QE7G3Rzw/) Daily chart 2015-2019 - recently signaled second buy of the year as highlighted in green: Signals (2015-2019): $234, January 28th 2015 (5) $234, May 2nd 2015 (6) $238 May 28th 2015 (7) $612, September 4th 2016 (8) $3652, January 11th 2019 (9) $7245, December 27th 2019 (10) https://talkimg.com/images/2023/09/10/m8UDf.png (https://www.tradingview.com/x/UF4PNFCh/) Average of 1 buy signal per year in the past 9 years. 2 buy signals have occurred in the past 3 years. Weekly chart - recently signaled second buy of the year as highlighted in green: Signals (2011-2019): $5.28, December 26th 2011 (1) $6.35, June 18th 2012 (2) $23.80, February 4th 2013 (3) $227, January 26th 2015 (4) $231, May 25th 2015 (5) $3533, January 7th 2019 (6) $7385, December 30th 2019 (7) https://www.tradingview.com/x/N6WEjNI7/ (https://www.tradingview.com/x/kxbyoRez/) Average of 1 buy signal every 18 months in the past 9 years. 2 signals have occurred in the past 3 years. Regarding the indicator, it is by default based on the 30 and 60 SMA's of hash rate. Therefore, as far as I understand with the coding:
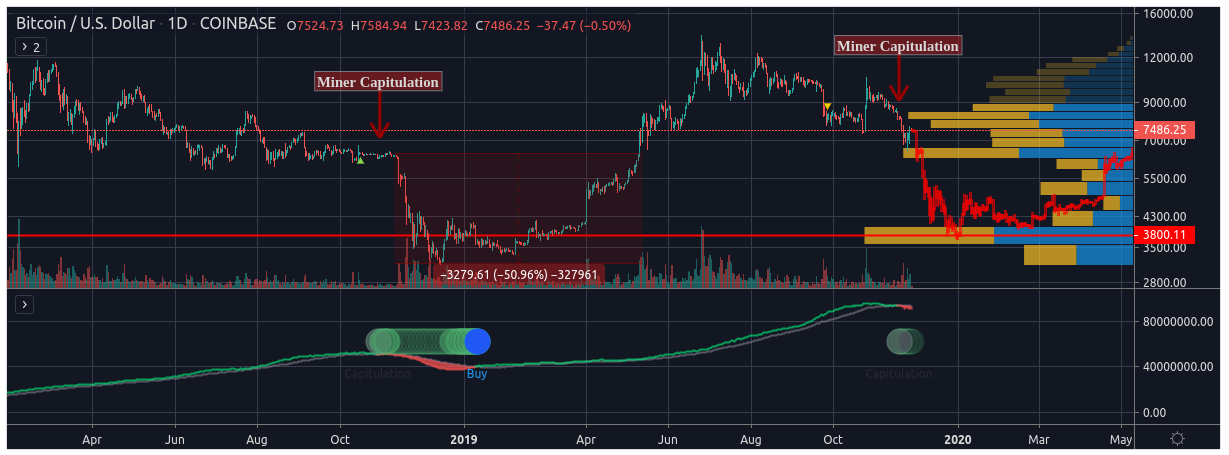
after studying the source code of the indicator, it's clear that one requirement of the buy signal is bullish price movement, hence no buy signal from this indicator yet. Just noticed the Monthly chart is now signalling a buy, although obviously the month would have to close at current prices for this to hold: This would be the first buy signal since October 2016 at $709, as well as 7th buy signal in 9 years 8) https://www.tradingview.com/x/28ByKw6h/ Original post: Disclaimer: Don't shoot the messenger or indicator ;) I'm posting this not necessarily because I believe it will happen, but for educational purposes. See related education: Bitcoin repeating history with descending triangle & other indicators TA series (https://bitcointalk.org/index.php?topic=5188537.0). https://talkimg.com/images/2023/09/10/m8XnZ.png (https://www.tradingview.com/chart/BTCUSD/4NYu7BX6-BTCUSD-Miner-Capitulation-Is-Here-Back-Down-To-3-200/) Source: Trading View, November 28th 2019 (https://bitcointalk.org/index.php?topic=5188537.0). The chart speaks for itself. The extrapolated price comes from the "2018 miner capitulation" that caused the price to drop 50%. Will we go back to $3,800? Unlikely, but clearly this is possible if the capitulation is as aggressive as 2018. Notably the VPVR is supporting the price target of $3,800, as is the extrapolation, with forecasted price for the block halving in May 2020 above $6K followed by another swift recovery and subsequent bull-run. This isn't the first theory regarding price forming a higher low double bottom instead of holding the $5-6K area. As published last month, the 50 & 200 Day death cross (https://bitcointalk.org/index.php?topic=5188537.0) [Part 10] also resulted in a 50% drop in price in 2014 and 2018, implying a 50% probability of such an outcome (using 4 sets of available data). Credit to Willy Woo for the Bitcoin Difficulty Ribbon (http://charts.woobull.com/bitcoin-difficulty-ribbon/) chart and the Hash Ribbons (https://www.tradingview.com/script/kT7jIvqv-Hash-Ribbons/) indicator by capriole_charles. Quote from: capriole_charles Buying during Miner Capitulation yields wonderful returns. Top quotes: Yup, you nailed it again... Anyone who uses mining for price predictions turns into an instant prick in my book. I can hardly find a worse indicator other than the number of horses that have taken a dump on the track at Kempton. Honestly, it was a good call and the price kept on increasing, if you bought bitcoin one week ago and now sold you would have made 10% profit. Disclosure: The author of this TA holds approximately 60% of wealth in cryptocurrency, 92% allocated to Bitcoin, and will continue to heavily accumulate between the $4.8K to $6.8K range, as well as for 6 months DCA leading up to the block reward halving until May 14th 2019. Related/Recent TA: When to buy the dip? The next swing low: February 6th-11th 2020 (https://bitcointalk.org/index.php?topic=5223076.0) - February 2019 VPVR Volume Point of Control $8,188 Now Turned Support (https://bitcointalk.org/index.php?topic=5221059.0) - January 2019 Extrapolating 2014 Correction: Could $6,500 Be The Low For Bitcoin? (https://bitcointalk.org/index.php?topic=5209110.0), December 2019 Two & Four Year MA's Claim It's Time To Accumulate Bitcoin (https://bitcointalk.org/index.php?topic=5206530.0), December 2019 Bitcoin Is Repeating History? TA Series On Repeating Past Patterns (https://bitcointalk.org/index.php?topic=5188537.0), September-October 2019 Dragonvslinux Technical Analysis: 3 Month Graphical Review (https://bitcointalk.org/index.php?topic=5209327.0) Own work (https://bitcointalk.org/index.php?topic=1159946.msg51280905#msg51280905): dragononcrypto (https://www.tradingview.com/u/dragononcrypto/) Title: Re: Bitcoin Miner Capitulation Is Here... Back Down To $3,800? Post by: BigBos on November 28, 2019, 01:59:12 PM To see whether this prediction is true or not, we need to wait until December. If this December the price of bitcoin drops, it is very likely that this prediction will occur. but there is a difference between this year and 2018, namely halving that happened. I am pretty sure that current prices will last. it was proven when the price of bitcoin fell to the level of $ 6k, and then rose again. it made me think positively about this development.
Title: Re: Bitcoin Miner Capitulation Is Here... Back Down To $3,800? Post by: aardvark15 on November 28, 2019, 02:19:32 PM A price of $3800 seems unlikely, but we should be prepared for the unexpected. It could happen but I try to see that as a buying opportunity. And I believe that we will see another big bull run starting next year.
Title: Re: Bitcoin Miner Capitulation Is Here... Back Down To $3,800? Post by: gentlemand on November 28, 2019, 02:26:05 PM What 2018 miner capitulation? Why should anyone other than miners give a fuck what it costs them?
Anyone who uses mining for price predictions turns into an instant prick in my book. Why does it not work the the other way? Hash rates have been making constant all time highs while the price action has been largely dead. Title: Re: Bitcoin Miner Capitulation Is Here... Back Down To $3,800? Post by: Tytanowy Janusz on November 28, 2019, 02:37:03 PM Bare in mind that in 2018 we broke 6000 support that was holding price for 9 months and we saw prices last seen one year ago. That was major reason for 50% price drop. Not "Miner Capitulation" what is an effect and not a reason for falling prices.
It is hardly unlikely to see the same output (50% price drop) with different market condition, price, volume, adoption, global situation with the only one constant (some miners quit mining). Title: Re: Bitcoin Miner Capitulation Is Here... Back Down To $3,800? Post by: The Sceptical Chymist on November 28, 2019, 02:39:35 PM What 2018 miner capitulation? Glad you asked, because I don't even know what that phrase means--not to mention what significance it has or why it might lead bitcoin to plummet to $3800. That would be one hell of a drop, nearly 50% lower than where it currently is. And if that were to happen, altcoins would probably get hammered even worse. It could happen but I try to see that as a buying opportunity. You might see it that way and I might, too, but if bitcoin were to drop that much the market and a lot of investors and traders would be fleeing in droves. It might be quite a while before we saw $7500 again and much, much longer before bitcoin sees its previous ATH of $20k or whatever it was. I like buying opportunities but I'd prefer not to have as good an opportunity as that. And I'm sure I'm not alone.All that said, I don't think the market is headed back to the $3k range. It's possible, true. Probable? I don't think so. Title: Re: Bitcoin Miner Capitulation Is Here... Back Down To $3,800? Post by: danherbias07 on November 28, 2019, 03:02:34 PM Just how many charts have you seen in this forum?
That is just one out of 100. Some tells it could go to 50k and this is just the start which is being manipulated. Maybe you could provide more proof next time. Those who speculate at $100k have more proof that what you are posting right now. Stop being an analyst and just take it that the market of bitcoin is far from being in command. Title: Re: Bitcoin Miner Capitulation Is Here... Back Down To $3,800? Post by: boltz on November 28, 2019, 03:16:20 PM I think we should have hit 3k$ some days ago when the hash rate was at ATH. Now its seems that West hash power is trying to control the asian power which I doubt it could happen even if some asian mining farms are going for a pause. Remember that some miners are in long term as they can afford to pay for bills for the previous bull run as they're prepared for situation like this so if we go to 3k$ prepare for 2k$.
The worst scenario for all this is altcoins going down a lot and we could see big project announce collapse and I don't want to see a scenario like this so lets hope for better times ahead. Title: Re: Bitcoin Miner Capitulation Is Here... Back Down To $3,800? Post by: Silberman on November 28, 2019, 04:21:56 PM A price of $3800 seems unlikely, but we should be prepared for the unexpected. It could happen but I try to see that as a buying opportunity. And I believe that we will see another big bull run starting next year. A price that low will surely be unexpected and very improbable as well, as we know from watching the charts bitcoin has a very clear tendency to generate new higher lows, this basically means that after the bull market and the crash that inevitably follows the lowest point that bitcoin reaches is always higher than the previous one, the previous low was around 3000 and while a price of 3800 is higher than that it doesn't seem as high as what we have seen in the past.Title: Re: Bitcoin Miner Capitulation Is Here... Back Down To $3,800? Post by: barota on November 28, 2019, 06:04:22 PM low prices already passed ; every time you wait for buying at cheap prices you will never buying before halving ; and after halving prices can rise a lot and market can have a ; big change like 2017 as all remember
i advice you buying at current prices because smart investors alreday starting for buying now Title: Re: Bitcoin Miner Capitulation Is Here... Back Down To $3,800? Post by: exstasie on November 28, 2019, 06:30:19 PM What 2018 miner capitulation? Why should anyone other than miners give a fuck what it costs them? Anyone who uses mining for price predictions turns into an instant prick in my book. Some miners obviously capitulated. The drop in hash rate supports that theory. It's obvious why though: price dropped and their operations become unprofitable so they shut down. Miners shutting down certainly didn't predict anything. The extrapolation in the OP is pretty bizarre too. In 2018, we had a clear triangle breakdown that broke 8 months of horizontal support. There is no parallel on the 2019 chart. The OP just copied the 2018 bar pattern and randomly added it to the current chart. Title: Re: Bitcoin Miner Capitulation Is Here... Back Down To $3,800? Post by: Febo on November 28, 2019, 07:31:03 PM Will we go back to $3,800? Unlikely, but clearly this is possible if the capitulation is as aggressive as 2018. Why price of Bitcoin would act similar as in 2018 that come after monster bull year of 2017? Was 2019 same as 2017? I see this year price of Bitcoin will maybe double while in 2017 it went up more then 10 times. Wake up man! Title: Re: Bitcoin Miner Capitulation Is Here... Back Down To $3,800? Post by: figmentofmyass on November 28, 2019, 11:13:52 PM What 2018 miner capitulation? Glad you asked, because I don't even know what that phrase means--not to mention what significance it has or why it might lead bitcoin to plummet to $3800.this is what investopedia has to say: (https://www.investopedia.com/terms/c/capitulation.asp) Quote What Is Capitulation? Capitulation is when investors give up any previous gains in any security or market by selling their positions during periods of declines. Capitulation can happen at any time, but typically happens during high volume trading and extended declines for securities. A market correction or bear market often leads investors to capitulate or panic sell. The term is a derived from a military term which refers to surrender. miners are fundamentally investors too---originally it was the only form of bitcoin investment, before there were liquid markets. when a mining operation is loss-making and the outlook is dire enough, the operator cuts their losses and capitulates just like any other investor. the OP is suggesting that the 11/7 difficulty drop is the beginning of a trend. All that said, I don't think the market is headed back to the $3k range. It's possible, true. Probable? I don't think so. the 200wma---which served as the bottom in 2015 and again in 2018---is around $5000 now. going back to the $3000s at this point would suggest that bitcoin's long term bull trend is dead. Title: Re: Bitcoin Miner Capitulation Is Here... Back Down To $3,800? Post by: dragonvslinux on December 03, 2019, 10:58:48 AM Break-even stop loss* now in play, represented by the green line at $7486.25. Check OP for entry confirmation. Too easy ::)
I wasn't going to take this trade until I saw how bullish people's replies were in this thread, so thanks for that metric ;D https://www.tradingview.com/x/i8L1DMOI/ Topic highlights: Stop being an analyst and just take it that the market of bitcoin is far from being in command. i advice you buying at current prices because smart investors alreday starting for buying now The OP just copied the 2018 bar pattern and randomly added it to the current chart. Wake up man! See related bullish analysis: Two & Four Year MA's Claim It's Time To Accumulate Bitcoin (https://bitcointalk.org/index.php?topic=5206530) (03/12/19) Title: Re: Bitcoin Miner Capitulation Is Here... Back Down To $3,800? Post by: dragonvslinux on December 05, 2019, 02:53:47 PM Got stopped out for break-even.
Break-even stop loss* now in play, represented by the green line at $7486.25. https://www.tradingview.com/x/gJmlrDUc/ Onto the next setup, probably this one with a new 3 Day candle opening tomorrow: https://www.tradingview.com/x/vKrr1RWh/ A move above $7800 would be very bullish for this chart, especially if it's a green 2 moving above a green 1. Title: Re: Bitcoin Miner Capitulation Is Here... Back Down To $3,800? Post by: fabiorem on December 05, 2019, 04:21:23 PM Yes. Like I posted two days ago, we are going back to 3k levels.
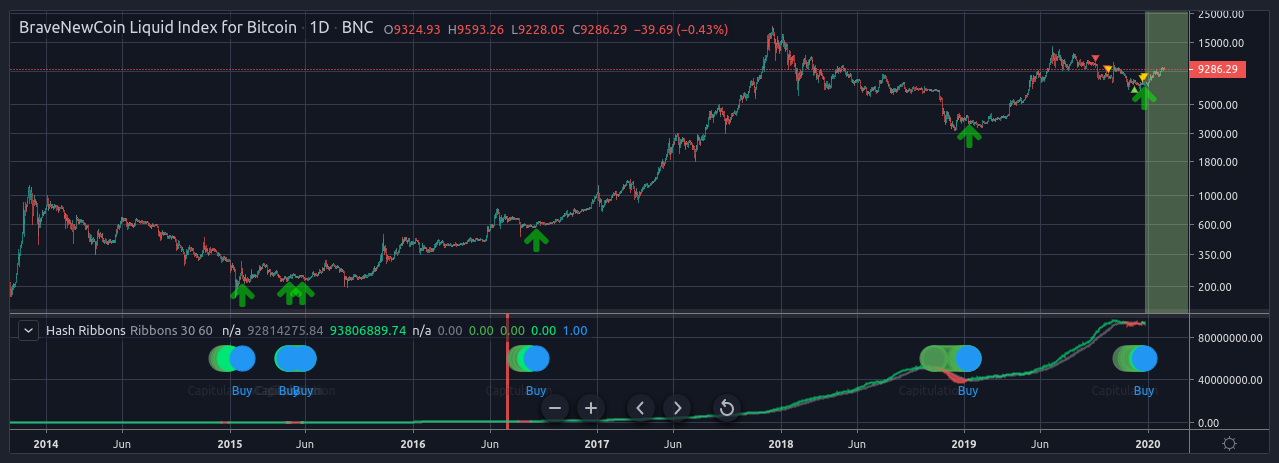
Earlier on I believed the price would never return there, but after several weeks of lower highs, its evident the price will dump to that level again. Actually I believe the manipulators who are dumping bitcoin want the price to go to $1000. They didnt succeed the last time, so they will try it again. Title: Re: Bitcoin Miner Capitulation Is Here... Back Down To $3,800? Post by: Naficopa on December 05, 2019, 05:02:05 PM Yes. Like I posted two days ago, we are going back to 3k levels. Earlier on I believed the price would never return there, but after several weeks of lower highs, its evident the price will dump to that level again. Actually I believe the manipulators who are dumping bitcoin want the price to go to $1000. They didnt succeed the last time, so they will try it again. Right now, it's not just about manipulators and whales. At this point, a lot depends on how the miners behave. If miners decide to sell BTC stocks (and among them there are certainly a few whales) this can cause big drops which will be a great time for price manipulators to lower the price even more. It looks like we might have one more big dump before halving. Title: Re: Bitcoin Miner Capitulation Is Here... Back Down To $3,800? Post by: fabiorem on December 05, 2019, 05:21:18 PM Yes. Like I posted two days ago, we are going back to 3k levels. Earlier on I believed the price would never return there, but after several weeks of lower highs, its evident the price will dump to that level again. Actually I believe the manipulators who are dumping bitcoin want the price to go to $1000. They didnt succeed the last time, so they will try it again. Right now, it's not just about manipulators and whales. At this point, a lot depends on how the miners behave. If miners decide to sell BTC stocks (and among them there are certainly a few whales) this can cause big drops which will be a great time for price manipulators to lower the price even more. It looks like we might have one more big dump before halving. They will have to sell, to pay mining costs. The exchanges are to blame for this. If they had a consensus in putting limits to the price, such dumps would not happen. The worst it can happen now its governments stepping in to stop the manipulation, and putting several regulations which would cripple the market even more. People love to go to extremes, so its wild west on one side, and a statist dystopia on the other. By the looks of it, we will have a replay of the "despair" phase on the classical cycle chart. This will confirm the theory of the four-year cycle is not valid at all, and each cycle would need to be stretched. Title: Re: Bitcoin Miner Capitulation Is Here... Back Down To $3,800? Post by: Naficopa on December 05, 2019, 05:25:28 PM Yes. Like I posted two days ago, we are going back to 3k levels. Earlier on I believed the price would never return there, but after several weeks of lower highs, its evident the price will dump to that level again. Actually I believe the manipulators who are dumping bitcoin want the price to go to $1000. They didnt succeed the last time, so they will try it again. Right now, it's not just about manipulators and whales. At this point, a lot depends on how the miners behave. If miners decide to sell BTC stocks (and among them there are certainly a few whales) this can cause big drops which will be a great time for price manipulators to lower the price even more. It looks like we might have one more big dump before halving. They will have to sell, to pay mining costs. The exchanges are to blame for this. If they had a consensus in putting limits to the price, such dumps would not happen. The worst it can happen now its governments stepping in to stop the manipulation, and putting several regulations which would cripple the market even more. People love to go to extremes, so its wild west on one side, and a statist dystopia on the other. By the looks of it, we will have a replay of the "despair" phase on the classical cycle chart, where the "takeoff" phase was the 3k in August 2017. This will confirm the theory of the four-year cycle is not valid at all, and each cycle would need to be stretched. I also think that this period will extend. I think the 2020 period will be something like "no mans land" and proper price increases will not start until 2021. Title: Re: Bitcoin Miner Capitulation Is Here... Back Down To $3,800? Post by: figmentofmyass on December 05, 2019, 05:48:11 PM At this point, a lot depends on how the miners behave. If miners decide to sell BTC stocks (and among them there are certainly a few whales) this can cause big drops which will be a great time for price manipulators to lower the price even more. It looks like we might have one more big dump before halving. isn't that always the case? miners are just bitcoin investors/holders. you're basically just saying that you expect whales to dump. the negative sentiment around here is tangible! They will have to sell, to pay mining costs. we actually don't know the extent to which this is true. we know that bitmain stockpiles their mining rewards for very long periods of time. poorly capitalized and/or leveraged mining operations need to sell to cover overheads, but the industry is becoming increasingly well-capitalized and industrial. so i don't know how useful these assumptions are. The exchanges are to blame for this. If they had a consensus in putting limits to the price, such dumps would not happen. i prefer free markets to collusion among exchanges. Title: Re: Bitcoin Miner Capitulation Is Here... Back Down To $3,800? Post by: gentlemand on December 06, 2019, 12:37:24 AM Actually I believe the manipulators who are dumping bitcoin want the price to go to $1000. They didnt succeed the last time, so they will try it again. If that causes them to thicken and engorge then more power to them. Sounds jolly expensive to me. This latest difficulty change has levelled out at just over 5% below the ATH hash rate that's despite the price being over 20% lower than it was at that time. Looks like they've taken it in their stride not that anyone should care in the slightest. Title: Re: Bitcoin Miner Capitulation Is Here... Back Down To $3,800? Post by: stompix on December 06, 2019, 01:21:38 AM What 2018 miner capitulation? Glad you asked, because I don't even know what that phrase means--not to mention what significance it has or why it might lead bitcoin to plummet to $3800. That would be one hell of a drop, nearly 50% lower than where it currently is. And if that were to happen, altcoins would probably get hammered even worse. As usually people trying to find a connection out of nothing when the reality was totally different! Quote The extrapolated price comes from the "2018 miner capitulation" that caused the price to drop 50%. First, miners follow the price, not the price of the miners. What OP forgets to add in his prediction or in his analysis is that the price was going down since June, when the hash rate reached the 30exa to which it will drop during November. Also, he has chosen to ignore the fact that hashate jumped again to pre "crisis" levels in March while the price was still hovering around 4000$ and that was not triggered because miners dictate the price but the fact that second batch of s17 and m20 started to be delivered. That drop could be blamed on the bulk of s9's reaching the limits of profitability while at the same time farms were refitting their gear (the first batch of s17 was delivered in late October) and right now just doubling numbers is stupid, at side by side electricity costs and thinking that 3500 was some sort of "capitulation" for the older gear the next "capitulation" can't happen until we go below 6000 at the current hash rate. This latest difficulty change has levelled out at just over 5% below the ATH hash rate that's despite the price being over 20% lower than it was at that time. Looks like they've taken it in their stride not that anyone should care in the slightest. And we're still up 20% on a 90 days time frame while the price is down 25% :P I can hardly find a worse indicator other than the number of horses that have taken a dump on the track at Kempton. Title: Re: Bitcoin Miner Capitulation Is Here... Back Down To $3,800? Post by: dragonvslinux on December 06, 2019, 12:20:41 PM What 2018 miner capitulation? Glad you asked, because I don't even know what that phrase means--not to mention what significance it has or why it might lead bitcoin to plummet to $3800. That would be one hell of a drop, nearly 50% lower than where it currently is. And if that were to happen, altcoins would probably get hammered even worse. As usually people trying to find a connection out of nothing when the reality was totally different! Quote The extrapolated price comes from the "2018 miner capitulation" that caused the price to drop 50%. First, miners follow the price, not the price of the miners. What OP forgets to add in his prediction or in his analysis is that the price was going down since June, when the hash rate reached the 30exa to which it will drop during November. Also, he has chosen to ignore the fact that hashate jumped again to pre "crisis" levels in March while the price was still hovering around 4000$ and that was not triggered because miners dictate the price but the fact that second batch of s17 and m20 started to be delivered. That drop could be blamed on the bulk of s9's reaching the limits of profitability while at the same time farms were refitting their gear (the first batch of s17 was delivered in late October) and right now just doubling numbers is stupid, at side by side electricity costs and thinking that 3500 was some sort of "capitulation" for the older gear the next "capitulation" can't happen until we go below 6000 at the current hash rate. This latest difficulty change has levelled out at just over 5% below the ATH hash rate that's despite the price being over 20% lower than it was at that time. Looks like they've taken it in their stride not that anyone should care in the slightest. And we're still up 20% on a 90 days time frame while the price is down 25% :P I can hardly find a worse indicator other than the number of horses that have taken a dump on the track at Kempton. In order to provide some historic context to this Hash Ribbons indicator, as well as to highlight this isn't just relevant to 2018, here is a zoomed out view of it's relevance from 2015 to present. Call it repeated coincidence, or alternatively a consistent and relevant pattern that has formed. https://www.tradingview.com/x/s9jt5DfS/ Additionally, below is the Weekly view to confirm it's relevance in accurately anticipating price movements. As you can tell, it has been backtested in order to be as useful as possible in determining price movements based on decreasing difficulty levels and their relevant MAs. https://www.tradingview.com/x/fCu4Vdi1/ I do find your analysis of s17 and s20 releases very relevant, but instead believe it contextualizes how and why mining capitulation occurs, as oppose to disproves it. Title: Re: Bitcoin Miner Capitulation Is Here... Back Down To $3,800? Post by: dragonvslinux on December 12, 2019, 05:47:47 PM Currently back to capitulating regarding miner hash rate, for anyone who cares or understands how this indicator functions:
https://www.tradingview.com/x/ICVqEaVC/ Title: Re: Bitcoin Miner Capitulation Is Here... Back Down To $3,800? Post by: exstasie on December 12, 2019, 06:20:13 PM How do you distinguish between a dip and a crash here?
Last week's difficulty drop was only -0.74%. Prior to that, difficulty actually rose by +1.99%. That doesn't seem indicative of "capitulation" to me. We need an actual crash like Q4 last year for miners to start shutting down en masse. Title: Re: Bitcoin Miner Capitulation Is Here... Back Down To $3,800? Post by: dragonvslinux on December 12, 2019, 06:30:19 PM How do you distinguish between a dip and a crash here? Last week's difficulty drop was only -0.74%. Prior to that, difficulty actually rose by +1.99%. That doesn't seem indicative of "capitulation" to me. We need an actual crash like Q4 last year for miners to start shutting down en masse. I think you may be confusing the start of the capitulation with the end of the capitulation cycle. Minder shut off en masse usually at the end of the such a cycle. Regarding the indicator, it is by default based on the 30 and 60 SMA's of hash rate. Therefore, as far as I understand with the coding:
Hope that helps things for you sufficiently. Consequently this indicator measure mining difficulty decreasing, but is still based on hash rate nonetheless. Bare in mind this is only one indicator, that I wouldn't rely on to trade on exclusively. But it appears to be a well back-tested indicator none the less. Title: Re: Bitcoin Miner Capitulation Is Here... Back Down To $3,800? Post by: exstasie on December 12, 2019, 07:09:13 PM How do you distinguish between a dip and a crash here? Last week's difficulty drop was only -0.74%. Prior to that, difficulty actually rose by +1.99%. That doesn't seem indicative of "capitulation" to me. We need an actual crash like Q4 last year for miners to start shutting down en masse. I think you may be confusing the start of the capitulation with the end of the capitulation cycle. Minder shut off en masse usually at the end of the such a cycle. You're removing all meaning from the word "capitulation" and making it interchangeable with "bear market." There is no such thing as a capitulation cycle. It refers to a specific part of a bearish market cycle, where massive losses on high volumes are observed. Miners capitulating at the end of a bear market is exactly what would be expected: (https://www.investopedia.com/terms/c/capitulation.asp) Quote After capitulation selling, many traders think there are bargain buying opportunities. The belief is that everyone who wants to sell a stock for any reason, including forced selling due to margin calls, has already sold. The price should then, theoretically, reverse or bounce off the lows. In other words, some investors believe that capitulation is the sign of a bottom. While traders often attempt to anticipate capitulation selling or buying, the reality is that capitulations are after-the-fact outcomes that result from the maximum psychological and financial pain that can be endured by investors before liquidating their positions. However, a 0.74% drop in difficulty does not indicate capitulation. Maybe it indicates something but I would find a different name for it. Regarding the indicator, it is by default based on the 30 and 60 SMA's of hash rate. Therefore, as far as I understand with the coding:
That's like calling a bearish cross a "capitulation." A bearish cross will always precede capitulation, but capitulation does not always follow from a bearish cross. Hash rate follows price (though it doesn't correlate perfectly) so watching miners instead of price just seems to further blur the issue. Title: Re: Bitcoin Miner Capitulation Is Here... Back Down To $3,800? Post by: dragonvslinux on December 12, 2019, 07:38:17 PM How do you distinguish between a dip and a crash here? Last week's difficulty drop was only -0.74%. Prior to that, difficulty actually rose by +1.99%. That doesn't seem indicative of "capitulation" to me. We need an actual crash like Q4 last year for miners to start shutting down en masse. I think you may be confusing the start of the capitulation with the end of the capitulation cycle. Minder shut off en masse usually at the end of the such a cycle. You're removing all meaning from the word "capitulation" and making it interchangeable with "bear market." There is no such thing as a capitulation cycle. It refers to a specific part of a bearish market cycle, where massive losses on high volumes are observed. There is nothing interchangeable about miner capitulation and bear markets, there is only a relative correlation between the two. For example as previously referenced (https://bitcointalk.org/index.php?topic=5205261.msg53274114#msg53274114), there was miner capitulation in 2012 and 2013 that arrived during price consolidation periods, without any bearish price movements. Fundamentally, the hash ribbons indicator is based on hash rate, not price that relates to bear markets. Acknowledging certain relationships between the two - miner capitulation and bear markets - might be a good start in order to understand this technical analysis. Title: Re: Bitcoin Miner Capitulation Is Here... Back Down To $3,800? Post by: dragonvslinux on December 24, 2019, 08:52:05 PM Capitulation is over? I am not 100% sure on the conditions for the buy signal (blue dot), but the sold green dot indicating the bullish MA crossover is very close to this. Will update when it occurs. Here would be the equivalent "point in hash rate" to January 2019 price buy signal (blue dot) based on the Hash Ribbons indicator:
https://www.tradingview.com/x/FOllqB9L/ Title: Re: Bitcoin Miner Capitulation & Hash Ribbons Indicator Post by: dragonvslinux on December 25, 2019, 02:53:38 PM Literally flashing green in front of my eyes :o the Weekly is also bull-crossing:
https://www.tradingview.com/x/RTd1XYA2/ Title: Re: Bitcoin Miner Capitulation & Hash Ribbons Indicator Post by: Naficopa on December 26, 2019, 01:02:20 PM I am not an expert on reading charts, but on the chart in the opening post it looks like the market collapse is yet to come. I think the risk is still in the air and rising up hashrate does not calm me down at all. I think I won't be calm until about mid-February.
Title: Re: Bitcoin Miner Capitulation & Hash Ribbons Indicator Post by: dragonvslinux on December 26, 2019, 01:21:18 PM I am not an expert on reading charts, but on the chart in the opening post it looks like the market collapse is yet to come. I think the risk is still in the air and rising up hashrate does not calm me down at all. I think I won't be calm until about mid-February. To be fair, for now, the miner capitulation appears to of been averted, instead it seems there was only minor capitulation :P FYI, after studying the source code of the indicator, it's clear that one requirement of the buy signal is bullish price movement, hence no buy signal from this indicator yet. I tested this by using the indicator on a Gold chart (on the Daily (https://www.tradingview.com/x/To2Lm6Kb/) and Weekly (https://www.tradingview.com/x/AeGqZaSX/) as an experiment), that has had a recent upwards move in price, which signaled a buy on both charts. Hence if Bitcoin's price were to break upwards, it's confirmed that there would be a buy signal (as long as hash rate holds up as well). Obviously this could come from lower lows, but it's worth paying attention to imo, as this would be the first buy signal since $3,635 on January 11th 2019. Hence, OP updated from bearish scenario to bullish setup. Title: Re: Hash Ribbons Indicator is now close to a Buy Signal Post by: dragonvslinux on December 28, 2019, 10:12:46 AM Hash Ribbons confirmed it's 10th buy signal in 9 years yesterday on the Daily chart, make of it what you will:
https://www.tradingview.com/x/XjPQ8pVA/ Here's the zoomed out / back-tested look of 2015-2019 buy signals from this indicator: https://www.tradingview.com/x/Ba5Sn4Wk/ The 3 Day chart is also signalling a buy, confirmation would arrive tomorrow with the close of the current candle: https://www.tradingview.com/x/uYKzptNM/ The Weekly chart however, that has been signalling "hash recovery" has been unable to maintain this MA bull-cross: https://www.tradingview.com/x/TToOpT9i/ And for reference sake, the Monthly chart is still signalling capitulation (but is much less reliable indicator on this time-frame it seems): https://www.tradingview.com/x/gMXbsOBr/ Longer-term time-frames are yet to confirm this hash recovery, as well as price follow through, but already seeing buy signals on lower times-frames. Title: Re: Hash Ribbons Indicator confirms 10th buy signal in 9 years Post by: dragonvslinux on December 28, 2019, 12:05:56 PM 5 Day Chart:
Just noticed this is also the first buy since 2016 approx $575 BTC, given there was no buy signal earlier this year: https://www.tradingview.com/x/U6t6KFFg/ This is therefore the 8th buy signal in 9 years on this time-frame, average of 1 signal every 13.5 months. There is notable confluence with the TD Sequential as the 5 Day chart also printing a TD 9 Buy signal: https://www.tradingview.com/x/bpF3xqrZ/ Last time we had a TD 9 Buy on the 5 chart was in January 2019 at $3,222 during miner capitulation :o Title: Re: Hash Ribbons Indicator confirms 10th buy signal in 9 years Post by: davinchi on December 28, 2019, 06:18:19 PM I really adore people who look at charts all day and try to figure out when bitcoin will go up or will go down. Haven't you already learnt your lesson from the past 10 years when bitcoin has always been under control of whales? I mean honestly charts could say that bitcoin has to go above 20 thousand dollars tomorrow and you can see bitcoin at 2000 dollars or maybe charts could say price will go down a lot but it reaches a new all time high.
Why would that happen? Simply because there are people with BILLIONS of dollars in bitcoin and those are the people who are in control of the price, when you leave an unregulated market to folks who first created it, they will do whatever they can to run it because they know there is no law that says they can't manipulate in bitcoin. Title: Re: Hash Ribbons Indicator confirms 10th buy signal in 9 years Post by: exstasie on December 28, 2019, 07:39:07 PM I really adore people who look at charts all day and try to figure out when bitcoin will go up or will go down. Haven't you already learnt your lesson from the past 10 years when bitcoin has always been under control of whales? Whales don't control the market. The stupid ones who fight the market, and try to "force" it up or down, don't stay whales for long. Case in point: the Bitstamp bear whale. (https://www.cnbc.com/2014/10/09/bitcoins-bearwhale-and-the-future-of-a-cryptocurrency.html) BTC was trading in the mid-$300s at the time, then this guy single handedly dumped Bitstamp down to $300. Then he placed a 30,000 BTC sell wall there. The market ate through his wall then rallied 50% to the mid-$400s. He lost his "whale" status after that. ;) Title: Re: Hash Ribbons Indicator confirms 10th buy signal in 9 years Post by: yefi on December 28, 2019, 08:53:25 PM Why would that happen? Simply because there are people with BILLIONS of dollars in bitcoin and those are the people who are in control of the price, when you leave an unregulated market to folks who first created it, they will do whatever they can to run it because they know there is no law that says they can't manipulate in bitcoin. If we were to give you billions of dollars in bitcoin and told you to manipulate price, what are the chances you'd screw up and end with nothing? Pretty high I'd say. Nobody has manipulated the ledger for over nine years, so your only options are to try outsmarting the market by trading and/or faking numbers on exchanges. As Mark found out with Willy, this quickly leads to an untenable position. Title: Re: Hash Ribbons Indicator confirms 10th buy signal in 9 years Post by: dragonvslinux on December 28, 2019, 11:01:06 PM I really adore people who look at charts all day and try to figure out when bitcoin will go up or will go down. Haven't you already learnt your lesson from the past 10 years when bitcoin has always been under control of whales? I mean honestly charts could say that bitcoin has to go above 20 thousand dollars tomorrow and you can see bitcoin at 2000 dollars or maybe charts could say price will go down a lot but it reaches a new all time high. Why would that happen? Simply because there are people with BILLIONS of dollars in bitcoin and those are the people who are in control of the price, when you leave an unregulated market to folks who first created it, they will do whatever they can to run it because they know there is no law that says they can't manipulate in bitcoin. As exstasie said, I don't find this to be particularly true, but assuming it is... When do you think these people with BILLION OF DOLLARS will pump or dump the price of Bitcoin? Do you think they do this randomly at bad times, or more likely to do it knowing they can manipulate the technical picture of the charts? There are enough examples of this, bouncing back from oversold RSI, closing above or below the 200 Day MA in a single day, a lot of these days bot driven to remove the human emotions from the trades. My point is, if whales are going to make big moves, I assure you it's based on probabilities rather than a "hunch" they can move the price higher or lower. Otherwise they won't remain a whale of market long that's for sure. Of course many whales do get it wrong, never to be whales again, but the whales play into the technical as much (if not more) than the average trader. Most relevantly, anyone can get it wrong, probability only gives you so much of a chance to get things right. I'm glad you adore people like me, I did enjoy successfully predicting many aspects of the breakdown from $10k down to current prices. What you're mainly forgetting is there can be a 99% chance that we go up, and the market can still go down 1 out of 100 times. This is the entire basis of basic mathematics that it seems so many overlook. Not to mention all technical analysis is subjective, as it should be. Title: Re: Hash Ribbons Indicator confirms 10th buy signal in 9 years Post by: dragonvslinux on December 30, 2019, 10:23:52 AM And now you have the Weekly confirming the 7th buy signal in 9 years as well:
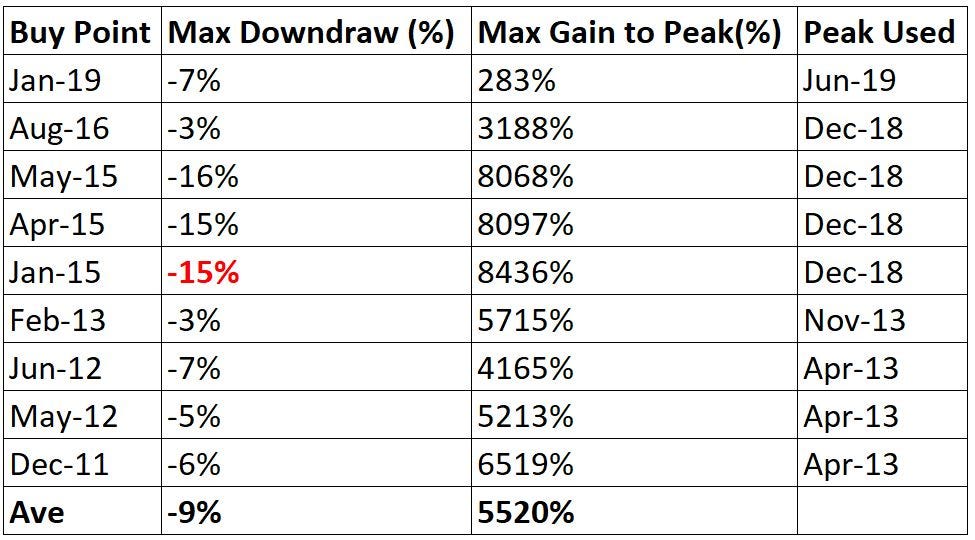
Weekly chart - has been flirting with recovery stage of miner capitulation, similar to August 2016: Signals (2011-2019): $5.28, December 26th 2011 (1) $6.35, June 18th 2012 (2) $23.80, February 4th 2013 (3) $227, January 26th 2015 (4) $231, May 25th 2015 (5) $3533, January 7th 2019 (6) $7385, December 30th 2019 (7) https://www.tradingview.com/x/N6WEjNI7/ (https://www.tradingview.com/x/kxbyoRez/) Average of 1 buy signal every 18 months in the past 9 years. 2 signals have occurred in the past 3 years. Notably on certain exchanges (such as Bitstamp), the indicator is again signalling a buy on this weeks current opening candle: https://www.tradingview.com/x/Ic3ypt0u/ If the candle closes with the buy signal, this would be the first time two consecutive weeks have received buy signals :o If these buy signals come through, I will become an uber bull ;D And there you have it. Title: Re: Hash Ribbons Indicator confirms 10th buy signal in 9 years Post by: dragonvslinux on December 31, 2019, 08:58:52 AM Just found the medium thread about this indicator (after sometime I know ::)), so have added in the Risk/Reward Returns table (based on Daily buy signals):
Quote from: Charles Edwards - Hash Ribbons & Bitcoin Bottoms https://miro.medium.com/max/975/1*RbOHezG6zFJAC8H83k-9Ww.jpeg (https://medium.com/capriole/hash-ribbons-bitcoin-bottoms-60da13095836) If I find the time, I will try and make a table & chart that represents the min-max & average time after the buy signal that the low arrives, as I realise in 2015 this was nearly a year... Title: Re: Bitcoin Miner Capitulation & Hash Ribbons Indicator Post by: stompix on January 02, 2020, 11:15:14 PM To be fair, for now, the miner capitulation appears to of been averted, instead it seems there was only minor capitulation :P What the hell is a "minor" capitulation? You were saying capitulation we have 6 exahash in hash rate growth. Even if we assume the best gear in efficiency that's 100k s17+ worth 170 mllion$ or 80 million if we go with cheap TH but power-hungry options. You're arguing about miners capitulation with this amount of hashrate being added? Seriously why do you try to see things and trends and relations when there this one? Hash Ribbons confirmed it's 10th buy signal in 9 years yesterday on the Daily chart, Yup, you nailed it again..../s Title: Re: Bitcoin Miner Capitulation & Hash Ribbons Indicator Post by: dragonvslinux on January 03, 2020, 09:32:41 AM To be fair, for now, the miner capitulation appears to of been averted, instead it seems there was only minor capitulation :P What the hell is a "minor" capitulation? Minor: lesser in importance, seriousness, or significance. (note pun). You were saying capitulation we have 6 exahash in hash rate growth. Even if we assume the best gear in efficiency that's 100k s17+ worth 170 mllion$ or 80 million if we go with cheap TH but power-hungry options. You're arguing about miners capitulation with this amount of hashrate being added? To correct you, the indicator claimed there was capitulation (which I agree with), given the historical relevance of this indicator for 9 years. Bare in mind there was also 'minor' "miner capitulation" three times in 2015. Arguably, you could say if it's minor capitulation it's merely a correction, and you'd be right, however I am referencing the indicator here rather than my own personal bias or perspective, that isn't relevant. The importance right now is that the recent correction/capitulation was very limited and short-lived, and therefore has reflected the 2015 corrections that occurred during accumulation. Seriously why do you try to see things and trends and relations when there this one? Hash Ribbons confirmed it's 10th buy signal in 9 years yesterday on the Daily chart, Yup, you nailed it again..../s Don't credit me, credit the indicator. I am just publishing what the mathematics have calculated :-* Title: Re: Hash Ribbons Indicator confirms 10th buy signal in 9 years Post by: El duderino_ on January 03, 2020, 11:10:32 AM https://bitcointalk.org/index.php?topic=5214437.0
sorry for OFF TOPIC, but unleash your TA's there as well :D ^ Title: Re: Hash Ribbons Indicator confirms 10th buy signal in 9 years Post by: dragonvslinux on January 03, 2020, 01:25:45 PM https://bitcointalk.org/index.php?topic=5214437.0 sorry for OFF TOPIC, but unleash your TA's there as well :D ^ You are more than welcome with the off topic. No local rules here, just speculation ;D Also if it weren't for your post, I would of likely missed the $50 box that I wanted :P So thanks for notifying me as it were ;) Title: Re: Bitcoin Miner Capitulation & Hash Ribbons Indicator Post by: stompix on January 03, 2020, 01:27:24 PM You said pun....and then you start using again the word capitulation 3 times.... >:(
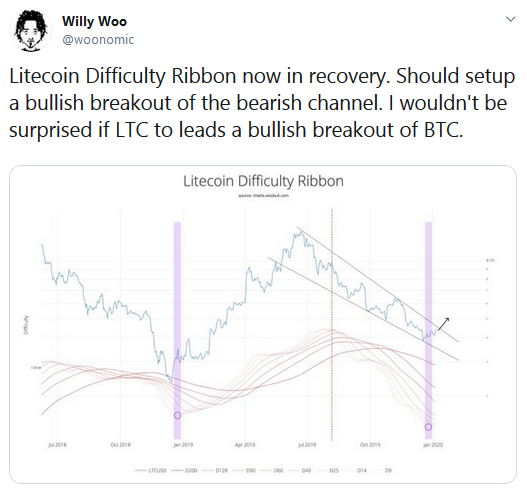
To correct you, the indicator claimed there was capitulation (which I agree with), given the historical relevance of this indicator for 9 years. Bare in mind there was also 'minor' "miner capitulation" three times in 2015. Arguably, you could say if it's minor capitulation it's merely a correction, and you'd be right, however I am referencing the indicator here rather than my own personal bias or perspective, that isn't relevant. The importance right now is that the recent correction/capitulation was very limited and short-lived, and therefore has reflected the 2015 corrections that occurred during accumulation. Don't credit me, credit the indicator. I am just publishing what the mathematics have calculated :-* No, it was not what math calculated, don't bring math into this. It was what you got from forcing math formulas with no basis. If you pick your timesets as you see fit you can come up with really amazing facts, let's have an example... Bitcoin will NEVER REACH 100K /BTC. And I can prove it with hashrate, furthermore, I will avoid the first years with the dramatic price increase and the years with no asic mining. On the 1st of January 2015, we had a price of 750$ and a hashrate of 11PH. On the 1st January 2020, we're sitting at 7000$ and a hashrate of 90 EH. That's a growth of 10x in price and 9000x in hash rate. So, using math to reach 100k we need an increase of ~15k times in hahrate... That's math!!!! Again, using math... Assuming the new generation That is going to be 72kwh x 365 x 1 300 000 000, or 34,164,000,000,000 kwh or 34,164 Twh or 1.5 times what the world is consuming at a cost of 2.6 trillion in equipment but....with a remaining reward of only 300 billion coins (at 100k value) You see....math! Just how you chose arbitrarily points for your TA I did the same and I've proved with math, that it won't be possible for BTC to reach 100k. So, hash and price...nope!!! Just like brand new car sales don't drive wages up but are an effect of them. Stop trying to see things where there is nothing to see, you might end up with a pink Rolls Royce ;D and that's not a good thing, trust me! Title: Re: Hash Ribbons Indicator confirms 10th buy signal in 9 years Post by: dragonvslinux on January 05, 2020, 08:03:41 AM No, it was not what math calculated, don't bring math into this. It was what you got from forcing math formulas with no basis. Source code mathematics referenced below. I haven't forced anything, I didn't write the code ::) If you pick your timesets as you see fit you can come up with really amazing facts, let's have an example... Bitcoin will NEVER REACH 100K /BTC. And I can prove it with hashrate, furthermore, I will avoid the first years with the dramatic price increase and the years with no asic mining. On the 1st of January 2015, we had a price of 750$ and a hashrate of 11PH. On the 1st January 2020, we're sitting at 7000$ and a hashrate of 90 EH. That's a growth of 10x in price and 9000x in hash rate. So, using math to reach 100k we need an increase of ~15k times in hahrate... That's math!!!! Congrats on your mathematics! Price is also -60% since ATH while hash rate is up around 700% (8x) I guess this also means by standard of simple mathematics that 16x hash rate would mean the price would be -120%? So that's anything between a price of -$1,500 and +$100K. I think you need to work on your indicator, it's lacking utility :P As you'll see below, the code uses "variables" and more than one equation ;) You see....math! https://ip.bitcointalk.org/?u=https%3A%2F%2Fi.imgflip.com%2F1wg0hg.jpg Code: (Hash Ribbons indicator) //@version=4 Reference: https://www.tradingview.com/script/kT7jIvqv-Hash-Ribbons/ Title: Re: Hash Ribbons Indicator confirms 10th buy signal in 9 years Post by: exstasie on January 07, 2020, 10:41:38 AM Willy Woo is pointing at a bullish pattern on Litecoin's hash ribbon indicator. He thinks LTC might lead BTC: (https://twitter.com/woonomic/status/1214314262744551424)
https://i.imgur.com/fGE05t7.png What do you think? What's his track record like anyway? I've never followed his analysis much. I'm more of a straight up TA guy. Title: Re: Hash Ribbons Indicator confirms 10th buy signal in 9 years Post by: dragonvslinux on January 07, 2020, 11:43:28 AM Willy Woo is pointing at a bullish pattern on Litecoin's hash ribbon indicator. He thinks LTC might lead BTC: (https://twitter.com/woonomic/status/1214314262744551424) https://talkimg.com/images/2023/09/10/mBx4q.png What do you think? What's his track record like anyway? I've never followed his analysis much. I'm more of a straight up TA guy. That's interesting, I haven't looked at LTC's hash ribbons, didn't even know it existed. Would need to back-test to form an opinion, as the example only shows 1 time previously when it was relevant - so this could obviously be an anomaly as opposed to a pattern like it has been with BTC. My gut feeling is that it's irrelevant, it's nothing like BTC's hash, but I'll let the mathematics speak for themselves instead of my own prejudice, when I get a chance to look at it and get back to you :P Thanks for giving me something to look into! Willy Woo's track record isn't bad in my opinion. If I'm not mistaken, he was wrong about $5-6K holding in 2018, or some similar level, but he was right about the bottom of BTC around $3.2K or something like that - basically at the same time as the hash ribbons indicated, prior to the source code being written. Hence that indicator existing basically. With this in mind, I don't doubt that Willy is right again about LTC, I wouldn't like to counter-trade this theory personally. I don't know anyone better who can analyze on-chain data as well as he can, put it that way. Not to mention his charts are incredibly useful I find: http://charts.woobull.com/ Title: Re: Hash Ribbons Indicator confirms 10th buy signal in 9 years Post by: dragonvslinux on January 07, 2020, 11:51:55 AM Just noticed the Monthly chart is now signalling a buy, although obviously the month would have to close at current prices for this to hold:
This would be the first buy signal since October 2016 at $709, as well as 7th buy signal in 9 years 8) https://www.tradingview.com/x/28ByKw6h/ Notice how it signaled recovery in 2019 but no buy signal (price follow through, at the time), suggesting the network growth & price is stronger than it was in January 2019. Title: Re: Hash Ribbons Indicator confirms 10th buy signal in 9 years @ $7245 Post by: fullhdpixel on January 07, 2020, 05:30:43 PM Honestly, it was a good call and the price kept on increasing, if you bought bitcoin one week ago and now sold you would have made 10% profit. People love to talk about how they missed out on bitcoin and how they could have profited while ignoring the fact that you could have made 10% in just one week if you purchased bitcoin, that is not something you see very often neither in anything people invest in except maybe some few stocks.
Let's hope that it will continue to grow and this signal wasn't just for this 10% but for something much larger, I want to see bitcoin at over 8 thousand in the next day or two which would mean that it wasn't just a one time increase but a bull run, we are going to rock the boat if we continue like this for couple more days in the following aftermath. Title: Re: Hash Ribbons Indicator confirms 10th buy signal in 9 years @ $7245 Post by: dragonvslinux on January 07, 2020, 08:28:54 PM I want to see bitcoin at over 8 thousand in the next day or two which would mean that it wasn't just a one time increase but a bull run, we are going to rock the boat if we continue like this for couple more days in the following aftermath. Done ;D https://www.tradingview.com/x/QYWtfOJ8/ Title: Re: Hash Ribbons Indicator confirms 10th buy signal in 9 years @ $7245 Post by: dragonvslinux on January 08, 2020, 12:17:58 PM Courtesy of the indicators skeptics, top quotes now added to OP. Thanks again for input folks, always appreciated.
$7245, December 27th 2019 (10) Yup, you nailed it again... Anyone who uses mining for price predictions turns into an instant prick in my book. I can hardly find a worse indicator other than the number of horses that have taken a dump on the track at Kempton. https://res.cloudinary.com/teepublic/image/private/s--NmCyd-Hm--/t_Preview/b_rgb:ffffff,c_limit,f_jpg,h_630,q_90,w_630/v1566925742/production/designs/5757633_0.jpg Title: Re: Hash Ribbons Indicator confirms 10th buy signal in 9 years @ $7245 Post by: dragonvslinux on January 16, 2020, 11:24:06 PM Not much to say, the buy signal occured, price and hash followed suit:
https://www.tradingview.com/x/aWs317bl/ https://talkimg.com/images/2023/09/10/mBYiw.png |