..
ATH in 2023?  |
|
|
|
Does anyone know anything about the Upcoming liquidity event? If it is Upcoming, it means that it is already safe and that it is a matter of time. But no one knows any details. In the article he talks about new features for the wallet. Naturally, in our official promotional brochures at the time, we did not think it appropriate to make such marginal statements. So our investors could only read a small part of our plans. In particular, we talked about changing the user interface and turning the app into a personal finance combine. EDIT: error in incoming--->correct is upcoming |
|
|
|
Can't believe this shitshow continues.. everybody should check their spam folders.. Mar 4, 2022
Even though it's been over a month now, that spam has most likely been deleted. They should contact Mycelium token@mycelium.comThe information about the "possible Liquidity Event" appeared in the wallet, in the Mediaflow section. Everyone who uses Mycellium wallet will have seen it. I would like to have more information about this "potential liquidity event", but these Mycellium people do not have social networks, not even here on Bitcointalk. Now I see that the message is dated March 4, have you received it after consulting them or without consulting them? It is rare that they are sending these emails when it has been 40 days since they sent a mass transfer. It may be people who are finding out now. |
|
|
|
which Elliot's theory allows this? I have always thought that the origin of a correction was necessarily the highest of all.  |
|
|
|
Considering the flat pattern, I was referring to this, a new low, accompanied by a large volume of capitulation, probably below $30k. The idea is that we could then go looking for a new ATH, after we've cleared out a few longs. 3. If wave-C exceeds the wave-A low, then either
i. a bullish Expanded Flat; or,
ii. a bullish Expanding Triangle.  |
|
|
|
 didn't think it was right that (b) could be above MINOR B In other words, it seems clear that the maximum was point (b) and from there the corrective wave would begin. Is it totally ruled out that this rise in recent days is a wave D and there is still a last wave E to end the correction? The low of January 24 was not accompanied by a large volume of capitulation, which could indicate that either it is not the definitive low, or we are in that great triangle that we have commented on. It's been almost a month since we've seen you update, we already missed you. 
That's right, thanks for reminding me. Since wave-B exceeded the high of wave-A (i.e. an Irregular B-wave), albeit very trivially; here are the potential wave-4 pullback scenarios to consider, in order of elimination... 1. If wave-C fails to decline to the wave-A low, then either i. a bullish Running Flat; or, ii. a bullish Ascending Triangle. 2. If wave-C declines to the wave-A low, then a bullish Regular Flat. 3. If wave-C exceeds the wave-A low, then either i. a bullish Expanded Flat; or, ii. a bullish Expanding Triangle. Flat: https://i.ibb.co/C0NFQPD/EW-Flat.pngTriangle: https://i.ibb.co/0y0ZZff/EW-Triangle.jpgScenario 2 is the median of all scenarios, and hence is depicted on the charts for now. |
|
|
|
I imagine that we will not know that this [c] is over until the market rebounds and exceeds a certain level, which confirms that this wave is over. Or do you see any new signs of where this [c] might end? >30000 30000 <30000 As for time, the end of PRIMARY [5] could be May-June/22?  On the other hand, what are the chances of seeing this triangle?  |
|
|
|
What if the November high was the beginning of the bear cycle? It is not impossible.
If we see a new maximum in the coming months, this cycle would have been significantly longer than the previous ones, also leaving much less time for the subsequent bearish cycle before the next halving of 2024.
That is, if we expect a PRIMARY [5] to culminate CYCLE I, the subsequent CYCLE II would have a very short duration relative to the impulse it corrects.
CYCLE I ---> 11 years
CYCLE II ---> <2 years
It's not what anyone wants to read, not even me. I'm not short, far from it. It is that the times would not fit.
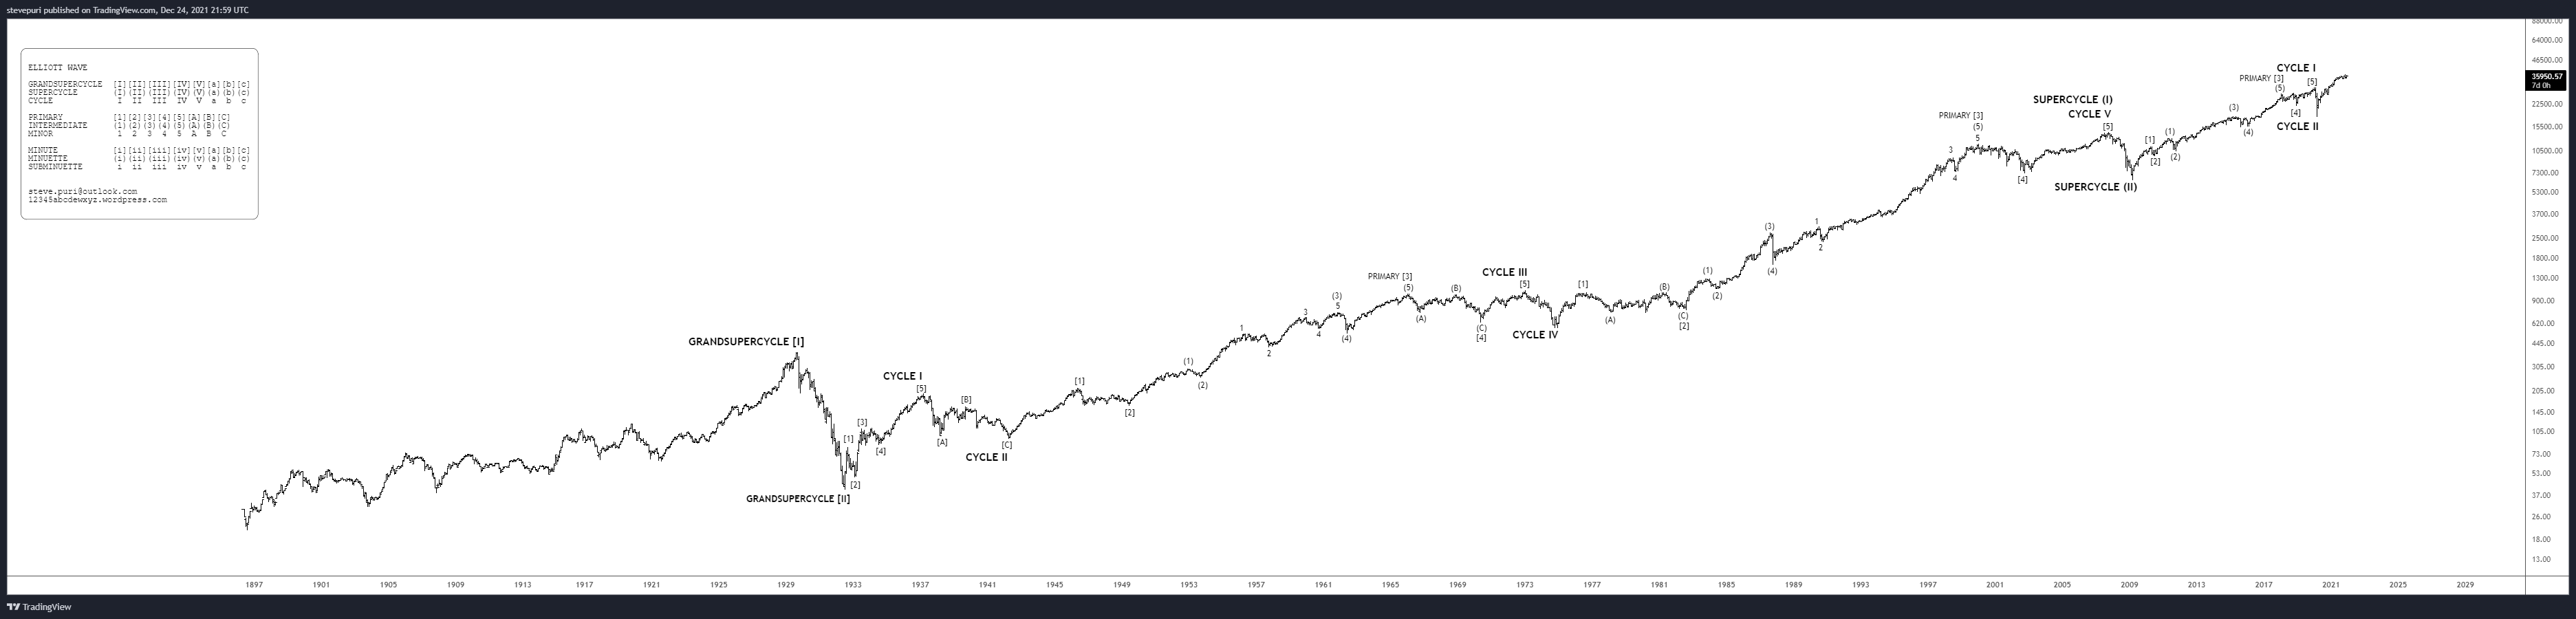
If the price of BTC drops to the 21-SEP-2021 low of 40K, it would imply an ongoing wave-(4) pullback is still underway and heading back to the JUN-2021 low of 28K. Market cycles don't necessarily have to equal a balance of time; e.g. see DJIA30 chart here: https://12345abcdewxyz.files.wordpress.com/2021/12/20211224-m-djia30.pngFrom the 1932 low to the 2007 high, the DJIA30 index had a 75 year SUPERCYCLE-(I) bull market, consisting of five CYCLE degree waves. From the 2007 high to 2009 low, a SUPERCYCLE-(II) bear market halved the bull market (i.e. a -55% decline, approx equal to other historical declines). A 75 year SUPERCYCLE bull market, corrected by a 2 year SUPERCYCLE bear market. After BTC completes its first bull market CYCLE, a bear market CYCLE shall follow (i.e. up to a -90% decline, approx equal to other historical declines). Afterwards, whether a new bull market CYCLE starts again, is anybody's guess..? Okay, I try to fit the different forecasts out there. -If BTC makes a new high in 2022, it could equate to the end of CYCLE I -If after the halving of 2024 we see a new ATH, it could occur in 2025-2026 -between the maximum assumption of 2022 and the halving of 2024 should be the minimum of CYCLE II, then it would have a duration of less than 2 years. in your opinion: - the duration of CYCLE II could perfectly fit Elliot's Wave Theory and be followed by a CYCLE III (which would be mind-blowing) |
|
|
|
|
What if the November high was the beginning of the bear cycle? It is not impossible.
If we see a new maximum in the coming months, this cycle would have been significantly longer than the previous ones, also leaving much less time for the subsequent bearish cycle before the next halving of 2024.
That is, if we expect a PRIMARY [5] to culminate CYCLE I, the subsequent CYCLE II would have a very short duration relative to the impulse it corrects.
CYCLE I ---> 11 years
CYCLE II ---> <2 years
It's not what anyone wants to read, not even me. I'm not short, far from it. It is that the times would not fit.
|
|
|
|
ETH/USD
why is ETH an ABC? shouldn't it start with a 12345 impulse? |
|
|
|
..
if so, the MINOR-2 wave MINUTE [iii] is going to be spectacular, I could probably do a x2 or more |
|
|
|
@ josegines,
thank you for your questions,
and
@ xxxx123abcxxxx
many thanks for your answers
it is very instructive
I have to say that @xxxx123abcxxxx has a lot of patience to answer so many questions. I even asked him long ago what the subsequent bear market would be like, how long and at what price level it could go. It will be good to take it into account in a few months, when it is clear that we have already made the top. |
|
|
|
Your suggestion would look like the following chart... https://i.ibb.co/NpDV6QV/btcusd.pngUnlikely for the following reasons... It is rare for MINOR 1 wave to be the largest. It would mean MINOR 3 and MINOR 5 would have to be successively smaller since the third wave in a sequence cannot be the shortest. The proposed MINOR 2 pullback is almost equivalent in magnitude to the INTERMEDIATE(2) pullback. Therefore, the proposed MINOR 2 pullback is better suited to be considered as INTERMEDIATE(4) pullback. The most conservative and simplest counts are considered first until eliminated. Okay, I had not understood that you were talking about Easter, so it coincides with what I am saying, that right now you see the end of this bullish cycle on Dec/21 or on Easter/22 (April/22) But the count you have drawn ends on Dec/21, if it were delayed it would be because there would be some corrective wave that lasts longer than expected right now. Or maybe because some impulsive wave extended. We will have to see the evolution week by week, to try to clear the doubt of whether the end will be in December or later. Or maybe we won't know when December arrives, but weeks later. If it is true that if in December we see an explosive wave that rises too vertical, it would be a sign of the end. |
|
|
|
It seems that if we are doing (5), it will end in December(only 2 months), it does not seem to last any longer. But would there be chances that we are doing (3) instead of (5), and thus the top of this bull cycle will be delayed to March-April / 2022? I understand that as you have the count no, but I imagine that there could be possibilities to redo the count. I am thinking that we may be close to a very important moment, nothing less than we could have the new ATH in just 2 months. It is too close!!!  Thanks for your explanation! Current estimation is for the PRIMARY[5] bull market to end either by around Christmas 2021 or around Easter 2022, with initial expectations of around 136K or 220K as a top. Your suggestion of (5) actually being a (3) would look like the following chart... https://i.ibb.co/LYmSQSD/BTCUSD.pngSuch an extended count would take the PRIMARY[5] bull market well beyond the Halving in 2024. Historically, there has never been a Halving at all-time highs during a core bull market. Is it possible? Sure. However, best to eliminate the more conservative counts first before jumping ahead. I was referring to this other (3), but I am not an expert on Elliot, I was only thinking about the possibilities that the climb would last until spring. I suppose that a possibility that we have a little more than 2 months of rise, is that the waves that remain, are extended. I suppose that the count that I have put in the image could be confirmed, if after reaching the predicted (5) and correcting, the price again exceeds the level of that predicted (5)  |
|
|
|
The count is always subject to review. For example, if a wave subdivides and extends, then a wave-4 pullback could actually be a wave-2 pullback. Hence, the degree of a wave is always uncertain until a substantial countermove occurs in the trend.
MINOR 2 pullback was -25% in size. Therefore, the expectation is that MINOR 3 uptrend ought to have pullbacks limited to sub -25% in size. If there is a pullback of around -25% within MINOR 3 wave, then it either means MINOR 3 is subdividing, or MINOR 4 is underway, or the entire structure is revised to one degree lower. In terms of size, there is an initial expectation that MINOR 3 is going to extend MINOR 1 by 1.618% in size i.e. at least $100K in price. Given the aforementioned points, an estimation of the wave count can be attempted, subject to revision.
Start with the 'bigger picture' and identify the notable countertrend moves these will be either wave-2 or wave-4 pullbacks. And then you can start filling-in the gaps to identify and label the other waves...
It seems that if we are doing (5), it will end in December(only 2 months), it does not seem to last any longer. But would there be chances that we are doing (3) instead of (5), and thus the top of this bull cycle will be delayed to March-April / 2022? I understand that as you have the count no, but I imagine that there could be possibilities to redo the count. I am thinking that we may be close to a very important moment, nothing less than we could have the new ATH in just 2 months. It is too close!!! Thanks for your explanation! |
|
|
|
Do you think we are still in the first wave of MINOR 3 or do we have to wait for a correction to find out more?
When the rise stops, if we are still in the first wave, how much would be the minimum correction of the second wave? 23.6%?
Thanks!
 I am impressed that you can already do a count when there has barely been a major correction, I suppose you make a reviewable approximation if we see that a major correction starts. That is, now the price could do fundamentally 2 things, it can break the previous ATH with little correction or it can correct something, for example looking for the 7 / Sep high at $ 52,700 (MINOR 1 Top), and then break the ATH I mean that now you can be reasonably clear that we would be in MINOR 3, but to know the development of that MINOR 3, I thought you would need a boost and its correction to be seen more clearly. Of course I don't have your skill to see those waves in MINOR 3. That is, it could be the case that yesterday a maximum was made and a correction of several days began, and it would continue to be valid for the MINOR 3 |
|
|
|
It's funny, with Binance BTCUSDT prices, it turns out to be 91k, if I haven't miscalculated it. It's too much difference.
At 106k, what I get is x2:
MINOR 3 = 2 x MINOR 1 ---> 106k$
MINOR 3 = 1.618 x MINOR 1 ---> 91k$
Do you think we are still in the first wave of MINOR 3 or do we have to wait for a correction to find out more? When the rise stops, if we are still in the first wave, how much would be the minimum correction of the second wave? 23.6%? Thanks! |
|
|
|
|
I will have done something wrong, I will review it.
|
|
|
|
|


