 Show Posts Show Posts
|
|
Pages: [1] 2 »
|
Chart patterns, when used with technical indicators, help traders understand the market better. These patterns are like important tools for traders. I've summarized another article about a pattern called Cup and Handle Pattern. You can read it here to learn about this pattern and other types too. What is a Cup and Handle Chart Pattern?The Cup and Handle pattern takes shape as the price of an asset forms a gradual U-shaped structure resembling a cup. Following the cup's apex, there's a sideways or slightly downward movement, forming the handle. While exact symmetry in the highs of both sides is rare, closer alignment enhances the pattern's desirability. After the cup's peak, a pullback shapes the handle, creating a consolidation phase before a potential breakout. Successful completion of the pattern involves the price surpassing the handle's trendline, leading to new highs. 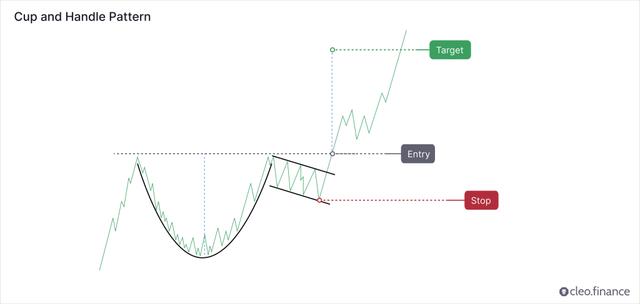 Cup and Handle Pattern: Continuation or Reversal? Cup and Handle Pattern: Continuation or Reversal?Primarily manifesting during uptrends, the Cup and Handle pattern signifies a consolidation phase before price resumption, categorizing it as a continuation pattern. A breakout from the handle's trading range signifies a continuation of the previous trend. However, reversals are rare instances, and they exhibit lower performance compared to continuation scenarios. Thomas Bulkowski's research ranks the Cup and Handle pattern 3rd out of 39 chart patterns based on overall performance.  Identifying a Solid Cup and Handle Chart Pattern Identifying a Solid Cup and Handle Chart PatternEffectively identifying the Cup and Handle pattern necessitates understanding its defining characteristics. It begins with a downward price movement followed by a period of stability. An upward price trend matching the initial decline forms the cup, while the handle emerges as the price moves sideways and slightly downward. If the handle's decline extends beyond half of the U-shaped cup, the pattern loses validity. U-shaped cups are ideal, as opposed to V-shaped formations. A well-rounded cup bottom enhances the pattern's strength. Entry signals occur when the price breaks out on the cup's right side with substantial volume. 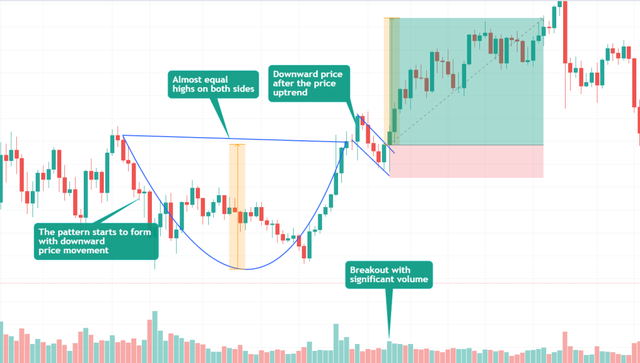 Target and Stop Loss Placement Target and Stop Loss PlacementDetermining target and stop loss levels involves measuring the cup's bottom height and placing the target above the breakout point. The stop loss can be positioned below the handle's low. 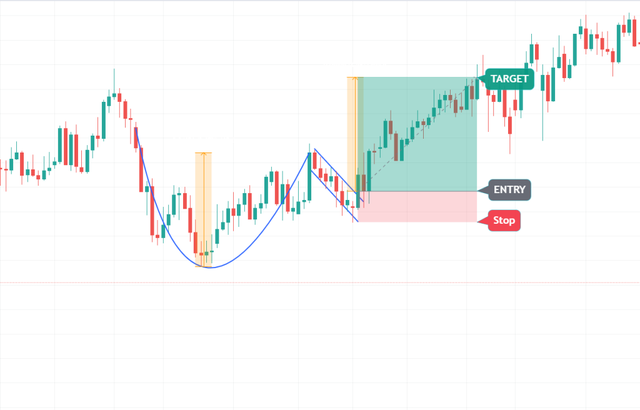 Cup and Handle Pattern's Pullback/Throwback Rate Cup and Handle Pattern's Pullback/Throwback RateThomas Bulkowski's research indicates that the Cup and Handle pattern often experiences a significant pullback or throwback rate. Roughly 6 out of 10 times, the price retraces to either the breakout point or the pattern's apex. In conclusion, the Cup and Handle Chart Pattern offers traders a valuable tool for identifying potential continuation trends within a larger price movement. Recognizing its formation, understanding its characteristics, and applying appropriate strategies can contribute to successful trading outcomes. How to Trade a Cup and Handle Pattern Automatically?To use Cup and Handle Pattern in your automated trading strategy, you can identify the pattern on the cleo.finance chart and use the pattern's lines as your automated entry and exit conditions, along with your stop losses and take profits. Then automate it. You also have the option to backtest the strategy using a manual backtester on the chart equipped with drawing tools. This allows you to simulate the Cup and Handle Pattern on the chart and assess its effectiveness.  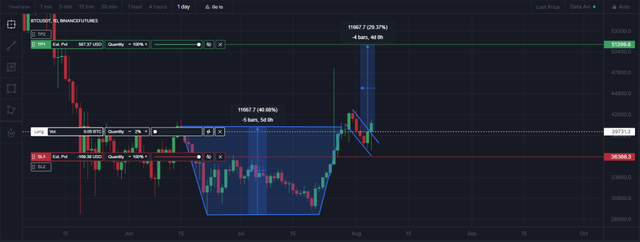 |
|
|
|
Chart patterns, when combined with technical indicators, offer crucial insights to traders, enhancing their market analysis capabilities. These patterns serve as invaluable tools within a trader's toolkit. I made a short summary of another article for you, about the bump and reversal bottom (BARR) pattern. Thet the source is here, where you can also learn about other chart patterns. What is a Bump and Run Reversal Bottom (BARR) Pattern?The Bump and Run Reversal Bottom (BARR) pattern is characterized by three distinct phases: the lead-in phase, the bump phase, and the run phase. The lead-in phase is a period of gradual price decline, followed by a sudden and sharp price increase during the bump phase. The run phase is a gradual price decline that follows the bump phase. Is the Bump and Run Reversal Bottom (BARR) pattern a Continuation or Reversal Pattern?The BARR pattern indicates a possible shift from a falling to a rising trend, as it is a reversal pattern. Although continuations sometimes occur, reversal is more likely and effective than continuations. Bump and Run Reversal Bottom Pattern (BARR) Thomas Bulkowski conducted extensive research on chart patterns. He examined daily data of US stocks and found over 1099 trades based on the breakout Bump and Run Reversal Bottom pattern. The pattern had the best overall performance rank among 39 chart patterns. (EURUSDT D1 Bump and Run Reversal Bottom Pattern (BARR)) How to Identify a Bump and Run Reversal Bottom (BARR) Pattern?The bump and Run Reversal Bottom (BARR) pattern has three phases: the lead-in phase, the bump phase, and the run phase. The lead-in phase involves a gradual price decline, while the bump phase is a sudden and sharp price increase. Finally, the run phase is a gradual price decline that follows the bump phase. The trendline of the BARR pattern connects the lows of the lead-in phase and the bump phase. Once the price breaks through this trendline, it signals a potential trend reversal from a downward to an upward trend. 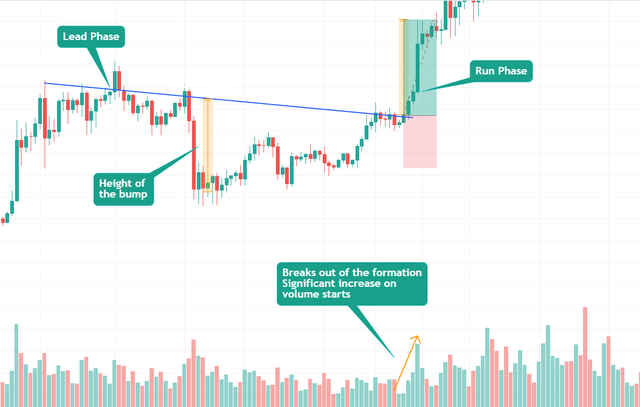 (BTCUSDT D1 Bump and Run Reversal Bottom Pattern (BARR)) The volume trend during formation has no effect on the performance. But as prices break out of the formation and start moving higher, there is a significant increase in trading volume. Rising prices characterize the uphill run phase. 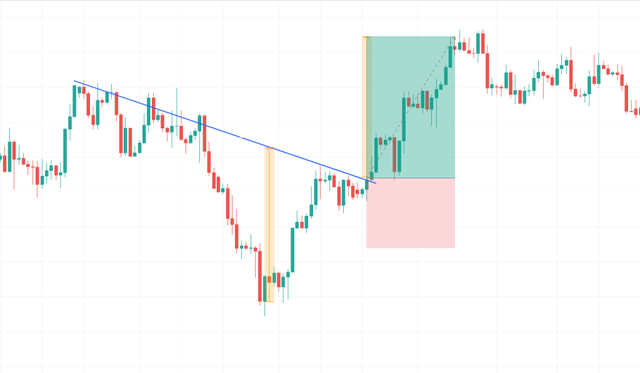 (GBPUSDT H4 Bump and Run Reversal Bottom Pattern (BARR)) Where to Place Target and Stop Loss?Target: Measure the height of the bump and add it to the breakout point. Stop-loss: Typically placed at the midpoint of the bump phase, aiming for a risk-to-reward ratio of at least 2R. 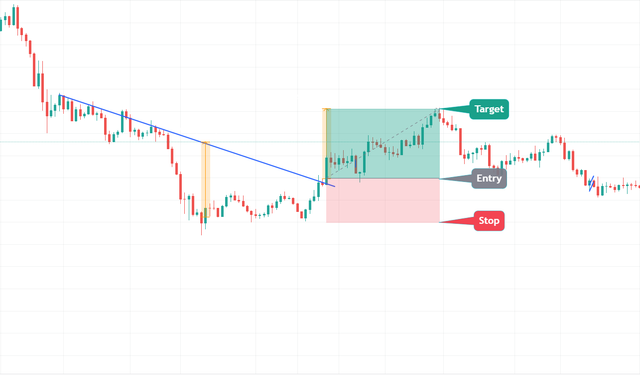 (ETHUSDT D1 Bump and Run Reversal Bottom Pattern (BARR)) How to Trade a Bump and Run Reversal Bottom (BARR) Pattern Automatically?To use the BARR Pattern in your automated trading strategy, you can identify the pattern on the cleo.finance chart and use the pattern's lines as your automated entry and exit conditions, along with your stop losses and take profits. Then automate it. You also have the option to backtest the strategy using a manual backtester on the chart equipped with drawing tools. This allows you to simulate the BARR pattern on the chart and assess its effectiveness.  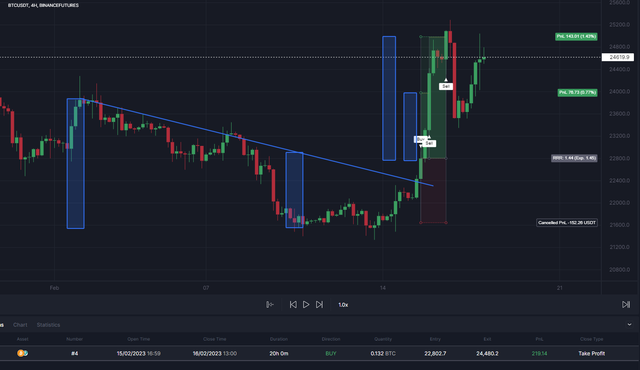 |
|
|
|
Chart patterns can be valuable tools for traders to understand market behavior and predict future price movements accurately. They can enhance your strategies, profitability and allow you to make more informed trading decisions. I summarized another article here, this time for the bear flag pattern - one of the most common and used one by traders. Here is the source, where you can find also other chart patterns. What is the Bear Flag Pattern:The bear flag pattern is a technical analysis pattern that occurs during a downtrend. It involves two sharp price drops separated by a brief consolidation phase. The pattern suggests that a further bearish move is likely, and it is confirmed when the lower support trendline is broken. This leads to another downtrend with prices falling towards the low of the formation. 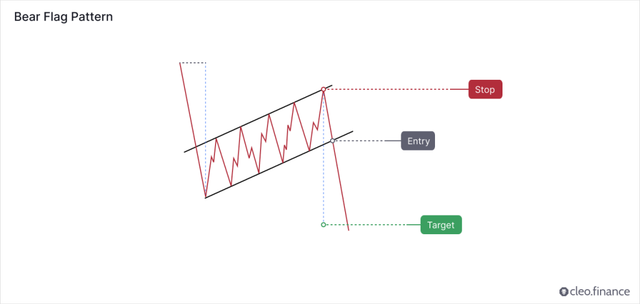 Is the Bear Flag Pattern a Continuation or Reversal Pattern? Is the Bear Flag Pattern a Continuation or Reversal Pattern?Bear flag occurs often in the market and it is generally considered to be a continuation pattern. It signals a pause or consolidation within a downtrend, where the bears take a brief break, and prices move slightly upward in a rectangular shape before continuing the downtrend. The breakout often occurs with a significant trading volume. Traders should look for either a break of important support or a pullback.  How to Identify a Bear Flag Pattern? How to Identify a Bear Flag Pattern?The bear flag pattern is a chart pattern that occurs during a downtrend. Traders should look for a fast and sharp decline in price (called a flagpole). This is followed by a brief period of consolidation (known as a flag), which is surrounded by two parallel upward-trending lines. In bear flag formation, the volume is often in a downward trend. The breakout from the flag pattern typically occurs with a significant volume and confirms the continuation of the downtrend. Although this is not always the case, flag patterns with a diminishing volume or light breakout volume usually perform better.  During the consolidation phase, traders watch out for the price breakdown through the lower trendline and make a new low since it shows the bears are in control again to push another decline. 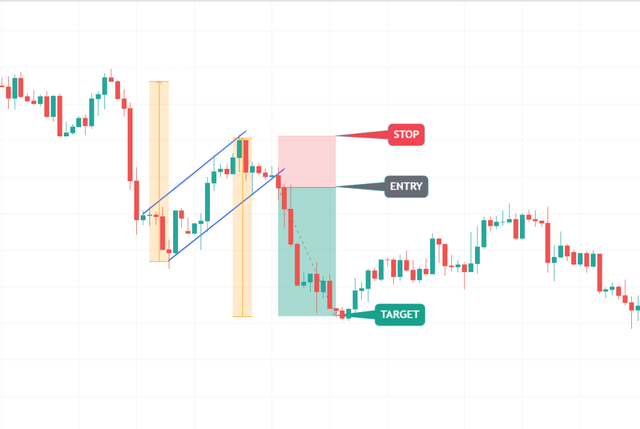 Where to Place Target and Stop Loss? Where to Place Target and Stop Loss? The target can be placed by measuring the distance from the start of the sharp price movement (the pole of the bear flag) to the point where the patterns upper trend line ends. The stop loss can be placed above the upper trend line of the pattern. And you should aim for a risk-to-reward ratio of at least 2R. (for every 1 unit of risk you expect 2 units of reward).  How to incorporate the Bear Flag Pattern into your automated trading strategy? How to incorporate the Bear Flag Pattern into your automated trading strategy? To include the Bear Flag Pattern in your automated trading strategy, you can identify the pattern on the cleo.finance chart and use the pattern's lines as your automated entry and exit conditions, along with your stop losses and take profits. Then automate it.   |
|
|
|
Hello everyone, it has been quite a while developing the Manual Backtester tool, aiming make backtesting more efficient. I would really appreciate your feedback, especially from fellow traders within the community. Feel free to explore the project on cleo.finance, and let me know your thoughts. EDIT: It is already finished, you can try it now.  Here are the features: - Replay assets in real-time, enabling you to analyze historical data as if you were trading live.
- Automatically calculate statistics for more informed decision-making.
- Pause and save you backtests, enabling you to come back and continue at any time.
- Place positions, simulate candle movements and set multiple stop-loss and take-profit levels.
- Create custom drawings such as trendlines or rectangles.
- View past positions' take-profit and stop-loss levels.
- Adjust playback speed, navigate through timeframes, and jump to specific times.
- Set targets and stops by dragging them on the chart using the Drag & Drop feature.
 Access an expandable detailed position table with information on position details, order list, take profit, and stop loss. You can also track the transaction costs associated with your positions when backtesting, allowing for more realistic results.  Funding fees, commissions, and slippage are visualized on the chart, as well as in the full breakdown of statistics. The spread, commissions, and slippage that you set will appear as a yellow line and will impact all profit and loss (PnL) calculations. You can set these fees at the beginning of the backtest in the second step of the backtest settings. The tool is built to make backtesting a fast and painless process. For further improvement, it would be great to have your suggestions and feedback so that it can get better for traders. |
|
|
|
Chart patterns are one of the key tools for traders to understand market behavior and predict future price movements accurately. Whether you're a newbie or an experienced trader, they can enhance your strategies and boost profits. So, I thought it will be useful to summarize the article for the people here. Here is the source, where you can find also other chart patterns. The rising wedge pattern is a triangle pattern characterized by both trendlines heading in an upward direction. It often occurs during consolidation phases in an uptrend and can indicate a potential reversal in the previous upward trend. This forum post will provide a summary of the key points discussed in the article and shed light on how to identify and trade this pattern effectively. What is Rising Wedge Pattern:A wedge pattern is a triangle pattern with both trendlines heading in the same direction. A rising wedge has both lines heading upward, with the lower bound rising more quickly than the upper bound. Rising Wedge patterns are more common during consolidation periods, but they can provide more significant signal after a peak has already been established. The price usually stays within the trendlines (with no intraday or fake breakouts) until the final breakout occurs. Rising Wedge patterns can play different roles, serving as consolidation patterns against or with the prevailing trend or as topping patterns, particularly when accompanying a liquidity run peak. 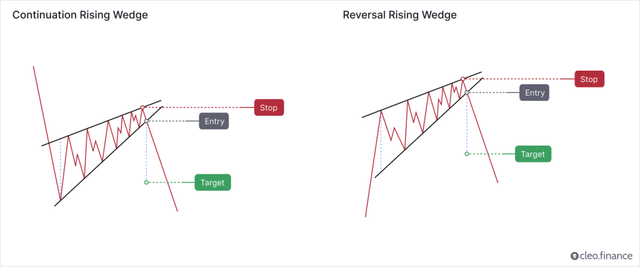
Continuation or Reversal Pattern?The rising wedge pattern is commonly considered a bearish reversal pattern. However, its important to note that each subsequent peak and trough is getting shorter than the last, indicating that bearish momentum is building. On the other hand, there are cases where the rising wedge pattern can act as a continuation pattern. If the pattern forms in an uptrend and the price breaks above the upper trendline, it may indicate that the bulls are still in control and the price is likely to continue higher. However, this is less common than the bearish reversal scenario. According to Thomas Bulkowski's findings, the rising wedge tends to perform better in upward breakouts, compared to downward breakouts. The pattern ranked 32nd out of 39 chart patterns for upward breakouts and ranked last out of 36 chart patterns for downward breakouts.  Identifying a Good Rising Wedge Pattern: Identifying a Good Rising Wedge Pattern:The rising wedge pattern can be challenging to identify accurately, but there are guidelines to simplify the process. Look for price movements that form higher highs and higher lows within the two trendlines, which contain the price most of the time. Diminishing volume during the pattern formation is typical. According to Bulkowski, to be classified as a wedge, the pattern needs to touch at least five reversal points in total three on one trendline and a minimum of two on the other trendline. Rising wedges can form during a long downward price trend or after an upward peak, resembling small rallies against the overall trend. When a rising wedge pattern reaches a peak, the chances are high that the break out will be downward. This is because the emotions and commitments have been exhausted during the peak and that leaves little room for a comeback during the test phase. 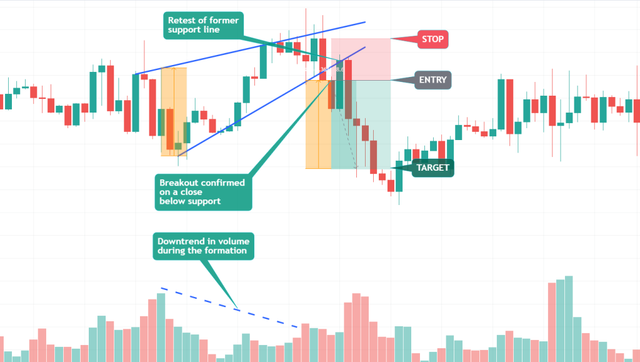 Target and Stop Loss Placement: Target and Stop Loss Placement:For target placement, measure the height of the wedge at its widest point and extend that distance up from the trendline breakout.  Stops are commonly placed above the top side of the rising wedge. Aim for a risk-to-reward ratio of at least 2R (two units of potential reward for every unit of risk). How to incorporate Rising Wedge Pattern into your automated trading strategy? To include the Rising Wedge Pattern in your automated trading strategy, you can identify the pattern on the cleo.finance chart and use the pattern's lines as your automated entry and exit conditions, along with your stop losses and take profits. Then automate it. 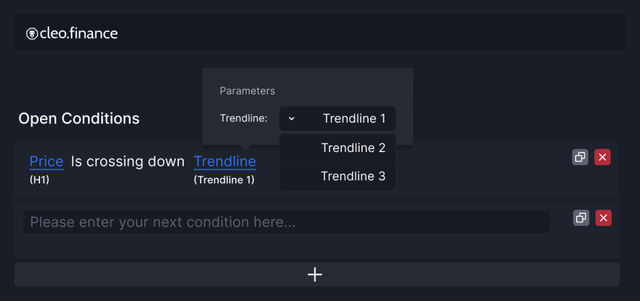 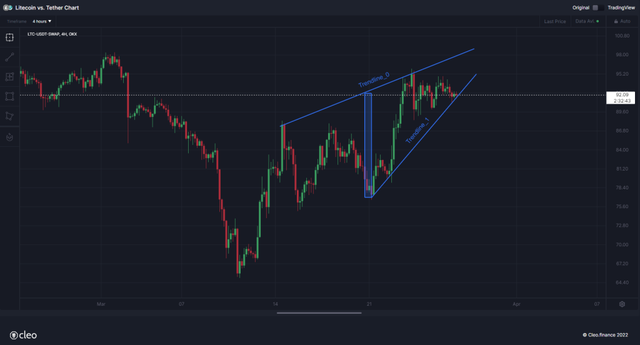 |
|
|
|
Technical chart patterns are a popular analytical tool used by traders to identify potential trading opportunities. Analyzing chart patterns can provide valuable insights into market dynamics and the behavior of buyers and sellers. I wanted to share one of the articles about the bull flag pattern and how to use them effectively. Here is the source where also you can find other chart patterns. What is the Bull Flag Pattern?The bull flag is a bullish pattern that forms when the two upward price movements are separated by a short period of consolidation. The initial spike in the price is vertical, catching bears off-guard as buyers take over. This rise is represented by the flagpole. After the flagpole, usually, theres a retracement that forms a rectangular shape, with two parallel trendlines connecting the highs and lows which called as Flag Pattern. 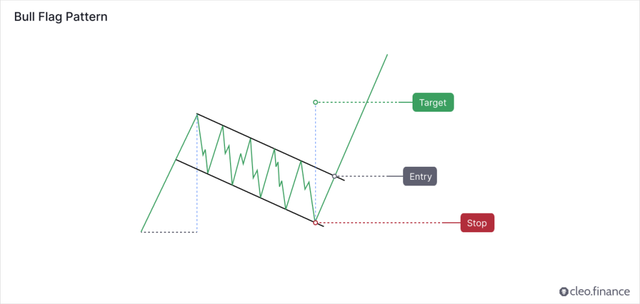 The breakout occurs when the upper resistance trendline is broken. This often leads to another uptrend move with prices surging toward the high of the formation. Is the Bull Flag Pattern a Continuation or Reversal Pattern?Bull flag is generally considered to be a continuation pattern. It signals a pause or consolidation in a bullish trend before the price continues to move higher. When the price breaks out of the bull flag, it often continues its upward trend, usually with high trading volumes. It is generally not recommended to enter a trade at a random price in hopes of an extension to the upside. Instead, traders should look for either a break of an important resistance or a pullback. 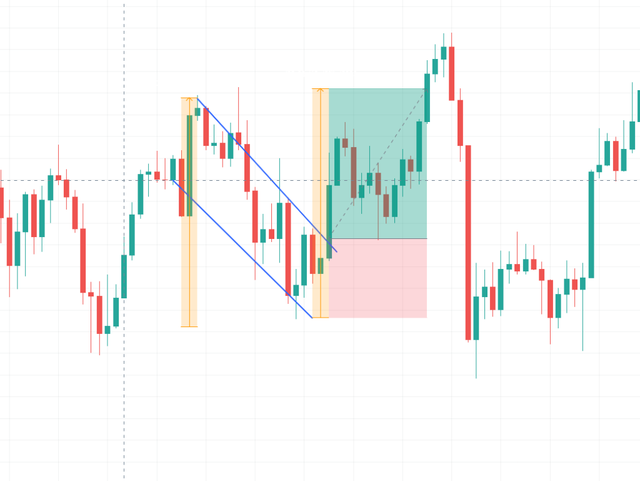 ETHUSDT H4 - Bull Flag Pattern How to Identify a Good Bull Flag Pattern?In order the identify a good bull flag pattern there are some guidelines traders can follow. The bull flag pattern is a chart pattern that occurs during an uptrend. Traders should look for a sharp and quick price rise (flagpole) followed by a period of consolidation (flag) that is bounded by two parallel down-trending trend lines. 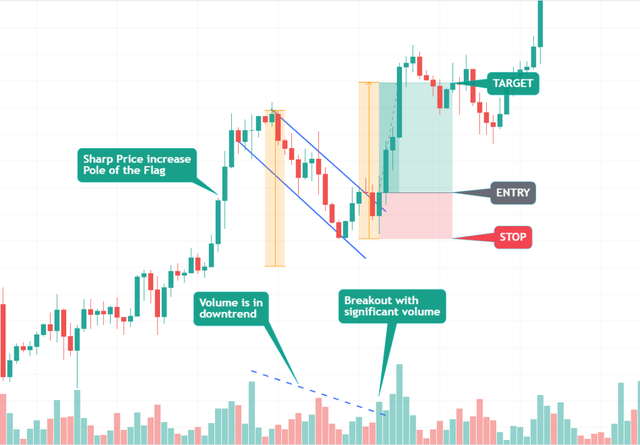 EURUSD H2 Bull Flag Pattern Another characteristic to watch out for is the downward volume trend during the formation, however, diminishing volume is not an absolute rule. The breakout from the flag pattern should occur on high volume and confirm the continuation of the uptrend. The strength of the bull flag depends on how sharp the initial price spike was in the flagpole. During the consolidation phase, traders watch out for the price break up through the upper trendline and make a new high since it shows the bulls are in control again to push another rally. Where to Place Target and Stop Loss?The target can be placed by measuring the distance from the start of the sharp price movement (the pole of the bull flag) to the point where the patterns lower trend line ends. The stop loss can be placed below the lower trend line of the pattern. And you should aim for a risk-to-reward ratio of at least 2R. (for every 1 unit of risk you expect 2 units of reward). 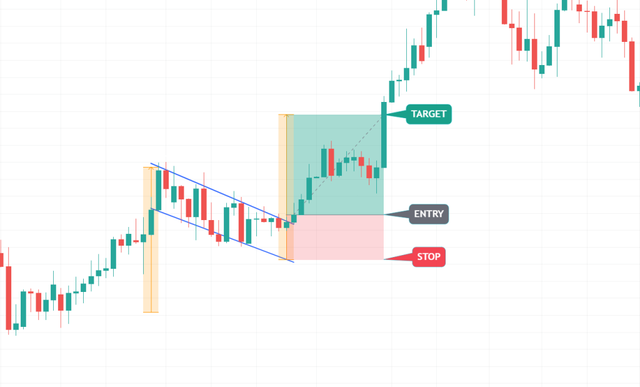 GBPUSD M30 Bull Flag Pattern ConclusionThe bull flag typically occurs in an uptrend, characterized by a sharp and rapid increase in price (known as the flagpole), followed by a period of consolidation forming a flag shape. The volume is often in a downtrend during the consolidation phase, although this is not always the case. Traders should keep an eye on the price action during this period, looking for signs of a breakout above the upper trendline and a new high, which would signal that the bulls are regaining control and could push the price higher. Traders can achieve better results by using the pattern in conjunction with other technical indicators. |
|
|
|
Hey guys, I have summarized an article that talks about 5 red flags that signal its time to change your trading strategy which can be a crucial indicator to stay ahead of the game. Hope it helps in your trading journey. Source: blog.cleo.financeTrading is a constant balancing act between risk and reward. Developing a successful trading strategy is a significant accomplishment in its own right, but it is equally important to know when it is time to adjust your approach or when to abandon it altogether. To help you stay ahead of the curve, I've identified the 5 telltale red flags that signal it could be time to change your strategy. Whether it's a shift in market conditions or a decline in performance, these red flags are crucial indicators that something needs to change. Why can live trading results deviate from backtest?It is not uncommon for live trading results to differ from the results obtained during backtesting. The main reasons for it are:
1. Improper Backtesting Methodology
This is kind of an "umbrella term" for everything that can go wrong while backtesting, but the facts remain: Backtesting requires a robust methodology to provide reliable results. If the methodology is flawed, the results of the backtest may not accurately reflect the strategy's performance. Common issues include overfitting to past data, using insufficient data (or cherry-picking your data - talk about introducing a bias into your results!), or not accounting for transaction costs.
2. Overfitting to Past DataThe most common culprit for live trading performance not achieving backtesting expectations is overfitting to past data. Overfitting occurs when a strategy is designed to fit the past performance of a market too closely, leading to a false representation of its potential future performance. Overfitted strategies have beautiful backtesting results but live trading performance fails to deliver even a resemblance of such results. A typical example would be using an overly specific period of any indicator - such as EMA (103).
3. Strategy Not as Robust as ThoughtBacktesting can provide a false sense of security, and traders may not fully appreciate the limitations of their strategy until they begin live trading. For example, a strategy that performs well in a trending market environment may not perform well in ranging conditions, or a strategy may be vulnerable to certain market events that were not accounted for during backtesting. 4. Execution IssuesLive trading often involves executing trades in real-time, which can be subject to various challenges that were not present during backtesting. For example, slippage, latency, or data inaccuracies can all affect the performance of a strategy. 5. Market Conditions Have ChangedI almost don't want to add this one to the list, because I worry most people will use this as a scapegoat, and not examine in detail all the previously mentioned reasons, that they actually can influence. But the fact is, the market is dynamic, and conditions can change rapidly. Changes in central bank policy, the introduction of new market participants, shifts in investor sentiment, or changes in economic conditions can all impact a strategy's performance. You must be aware of these potential issues and take steps to address them. This includes ensuring a robust backtesting methodology, regularly monitoring and adjusting the strategies, and being prepared to adapt to changing market conditions. What to do if your strategy shows any of these red flagsWhen you encounter red flags in your trading strategy, it's crucial to take prompt and decisive action. Personally, if my strategy deviates beyond the backtested results in any of the five metrics mentioned below, I immediately stop live trading and switch to paper trading to monitor its performance. A robust backtesting methodology should provide a reliable indicator of the strategy's performance, and any deviation from the backtested results should be taken as a sign that further examination is needed. I cannot recommend any leniency in this matter (translation: Every time I did, it was a painful lesson). If you're getting to this position often, it suggests that your backtesting methodology is not robust enough. My guess is: you are either overfitting to past data, or introducing any of the dozens of biases that come with backtesting.
The red flagsI picked these red flags because of their importance or ability to provide a signal early on. It's important to note that the following list is possibly subjective. Not everyone will agree with me on this list. Everyone will agree, however, that it is a good reason to stop a strategy from live trading if it has significantly deviated from its backtested results. Many traders mistakenly believe that an automated strategy is a "set-and-forget" system. It's not. It is crucial to monitor its performance and be prepared to make adjustments or even stop the strategy if necessary. You might monitor different parameters than me, but you need to monitor something. Make sure your hard work of testing and developing a strategy with a positive expectancy doesn't go to waste. 1. Max drawdownThe first and most critical red flag to watch out for is the difference in maximum drawdown between the live trading strategy and its backtested version. Maximum drawdown is a measure of the largest decrease from a peak to a trough in the value of your portfolio balance, expressed as a percentage of the drop from the peak value. Say you started with 100, traded the account up to 150 with a handful of wins, and now you are at 135 after two losses. Your current drawdown is 10%, and as long as your drop from the current peak was not higher until now, this is also your max drawdown. The drawdown curve as a whole is a crucial indicator to monitor. Its other secondary parameters can provide further insight into the performance of your trading strategy. These include: The steepness of the drawdown curve - a steep curve indicates a rapid decrease in value caused by a handful of big losses, while a more gradual curve indicates a slower decline - a longer streak of smaller losses. The number of trades it took to reach the maximum drawdown - a high number of trades indicates a long period of poor performance, while a low number indicates a short period of sizeable losses. Total recovery time - the length of time it takes to recover from the maximum drawdown can provide insight into the resilience of your strategy. Generally, you want a more resilient strategy with quick recovery. By monitoring these parameters in addition to the maximum drawdown, you can gain a more comprehensive understanding of the performance of your trading strategy and make informed decisions about any necessary changes. Side note: To help you gauge the downside risk, calculate your strategy's Ulcer Index 2. The losing streak length and frequencyA losing streak is a consecutive sequence of trades that result in losses. If the maximum length of the losing streak in live trading exceeds the results obtained during backtesting, it could indicate that the strategy may not be as consistent or reliable as originally believed. Try to examine how you would feel in these streaks. If, for example, your strategy regularly alternates between wins and losses, you'll probably feel fine. But if you have periods of long winning streaks and then periods of long losing streaks, it could be emotionally hard to handle. You could get an "itchy hand" and try to fiddle with your strategy even if the losing streak should have been expected since it occurred in the backtest. 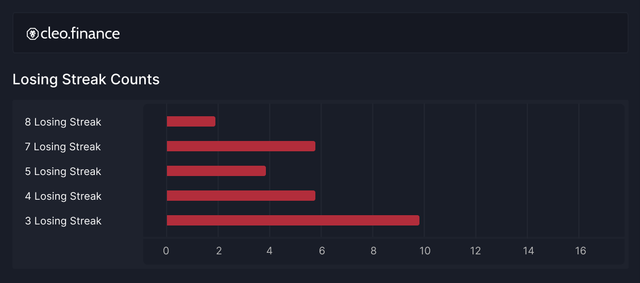 3. The Recovery time 3. The Recovery timeThe total drawdown time can be oversimplified as follows: Total Drawdown Time = Drawdown Time + Recovery Time We looked at the Drawdown time already - in the first red flag, so let's examine the recovery time. The recovery time is the time it takes for the strategy to return to a profitable state from the point of max drawdown. 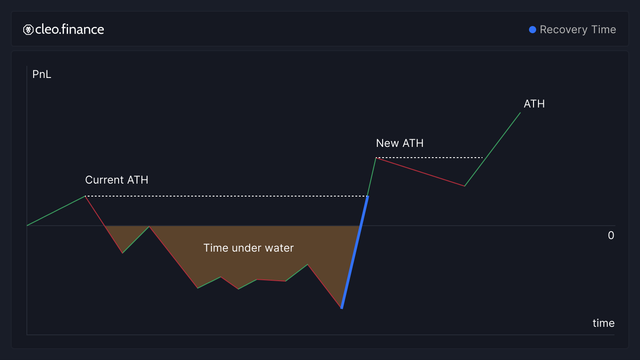 For the recovery time, I have basically only one rule: It has to be more aggressive, than the drawdown time. I want to see a faster recovery than the drawdown time. This happens when your average win is larger than your average loss. Such behavior I consider healthy, and it only motivates me to look at the drawdown period more closely (Is there a pattern in the drawdown occurrences? Can I identify them and filter them out somehow?)
4. Win rateThis red flag is self-explanatory. The win rate of your live traded strategy should not be significantly different from the backtested version. However, you need to make sure you have enough data before you make any decisions. And therefore it is not the first actionable indicator that something might have gone awry. 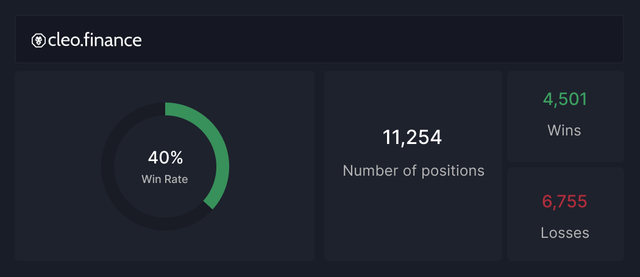 5. The trade duration 5. The trade durationThe trade duration difference between your strategy's backtested and live traded versions is another vital red flag to look out for. Trade duration refers to the time a trade is kept open, from entry to exit. If, for example, the trade duration in your backtest was anywhere between 30 min and 4 hours, but in live trading conditions, you observe a handful of trades with a duration of 20 hours. Is that a cause for concern? Does it warrant stopping the strategy? Consider the reasons behind such deviations, as it could be an early example of changing market conditions, mismatches in trade execution, or other factors. In the above example, if you opened a trade at the end of the New York session and closed in the London session, maybe the Asian countries had a national holiday and therefore left markets completely illiquid, but the strategy did what was expected. It is also a good idea to look at the distribution of trades in time. For example, if your backtesting was calibrated to trade during the London and New York sessions, but the live trading strategy generates the majority of trades during the Asian session, this could be a sign of discrepancies that might need to be addressed.
ConclusionKnowing when to stop a strategy from live trading is integral to the day trading process. By closely monitoring key metrics and values, and comparing them to the results of your backtesting, you can make an informed decision about whether to continue using a strategy, invest time in improving it, or stop it altogether and look for a better one. And whether you monitor the same indicators or develop your own, as long as you regularly check in on your strategy's results, you are on your way to improving your chances of achieving long-term profitability. I wish you all the best in your trading journey! |
|
|
|
Hey guys, I have summarized an article about the 4 main fears and how to overcome those fears. Source to full article: blog.cleo.finance - Source to Tradingview: We all face those fears as traders and it can cloud our judgment and hinder our success in the market. Hope you find it useful. Trading in the financial markets, whether it be forex or cryptocurrency, can be a thrilling yet challenging experience. As traders, we are often faced with fears that can cloud our judgment and hinder our success in the market. The 4 fears of every traders:
1.Fear of being wrong:The fear of being wrong is a common obstacle for traders who aim to be right all the time. However, this fear can prevent traders from making bold decisions necessary for success and lead to avoidance of risks, missed opportunities, or impulsive decisions based on emotions. Traders should embrace the possibility of being wrong, use it as an opportunity to learn, and turn it into a strength. Every misstep is a chance to analyze what went wrong and improve our strategy for the next trade. Embrace the possibility of being wrong and use it as fuel to become a better trader. Remember, even the most successful traders make mistakes and face losses all the time. The key is to learn from those mistakes and come back stronger. 2. Fear of losing money:The fear of losing money is natural for traders, but it can control their decisions, leading to hesitancy in taking risks, missing opportunities, or premature exit of positions. So instead of letting the fear of losing money paralyze you, turn it into a strength. Use it as motivation to develop a comprehensive trading plan that incorporates effective risk management strategies. Accepting that losses are a natural part of trading, and using them to improve strategies and approach. 3. Fear of leaving money on the table:The fear of leaving money on the table is a tricky one, as it often arises when were in a winning trade. Its tempting to hold on, hoping to squeeze out even more profits. But this can be a dangerous mindset that can lead to ignoring stop-losses and exposing to unnecessary risk. After all, you dont have a crystal ball (and arent an FOMC member), so you should not expect to buy the exact bottom and sell the exact top. By having a predetermined exit plan, we can lock in profits, manage risk, and avoid emotional decision-making. Embrace discipline by having a clear exit strategy that balances the desire for profits with the need for risk management. Trust your strategy and stick to your plan to be in a better position to capitalize on future opportunities. 4. Fear of missing out (FOMO):The fear of missing out (FOMO) is a feeling that all traders have faced at some point especially prevalent in a volatile market. It can be tempting to jump in without fully analyzing the situation. But succumbing to FOMO can lead to hasty decisions based on emotions, rather than logic, which can result in costly mistakes (emotions causing mistakes
do you see a pattern?). Traders should resist the temptation of FOMO by sticking to their trading plan, making informed decisions based on logic and analysis, and taking time to thoroughly analyze each opportunity. Trust in your strategy and stick to your plan, even when it feels like the market is passing you by.  How to overcome our fears?1. Develop a solid trading plan How to overcome our fears?1. Develop a solid trading planHaving a well-defined trading plan can help manage risks and make informed decisions. The plan should include goals, risk management rules, and entry/exit strategies. Following the plan can ensure discipline and avoid emotional decisions. 2. Practice risk managementBy setting clear stop-loss levels and position sizes, we can minimize our losses and protect our capital. This can give us the confidence to take on appropriate levels of risk and pursue potential trading opportunities. 3. Realize that your ego is the enemyHow many times have you held a losing position past your stop loss and literally prayed for the break-even? Did anything fundamentally change about your position? No, you just didnt want to take the loss, am I right? See, even though we know that losses are part of the process it is still very hard for us to accept that any trade can go against us. And sometimes you do everything right, and still lose. Every trading system works with probabilities. Losses are normal. Let your ego go and stop trying to force a win out of every single position you take. (Add this to your daily affirmation ritual if you must) 4. Stay focused on the long termTrading is a long-term game, so focus on long-term goals to stay disciplined. Every losing day can be a step closer to the long-term goal if analysed and learned from. 5. Take regular breaksTrading can be mentally and emotionally draining, so it's important to take breaks to recharge and refocus. This helps avoid rash decisions.
6. Learn from mistakesThis is the big one. Nobody is perfect, and everyone makes mistakes in their trading careers. Analyze past mistakes and use them as growth opportunities. 7. Automate your trading process:Leveraging technology in your favor can yield a tremendous difference in your trading results and keeping your emotions out of trading. Cleo.finance lets you do this with minimal effort. You can set multiple take profits and stop losses, understand your risk-to-reward ratio, the trades impact on your portfolio and much more before you even place the trade. You can backtest your strategies, trade them live automatically, and more. ConclusionThe four main fears that traders face can have a significant impact on our success in the markets. However, with the right approach and mindset, these fears can be overcome and transformed into positive drivers for our trading. By managing risks, having a clear exit strategy, and avoiding the temptation of FOMO, traders can overcome their fears and become successful. By embracing these fears, traders can make informed decisions, capitalize on opportunities and achieve their trading goals. |
|
|
|
Automated crypto trading, also known as algorithmic trading, has become increasingly popular in recent years as a way to maximize profits and minimize losses in the volatile crypto market. By using computer programs to execute trades based on a set of predetermined rules, traders can take emotion out of the equation and make more informed decisions. One of the main advantages of automated trading is that it allows traders to quickly and efficiently execute trades based on real-time market conditions. This can be especially useful in the crypto market, which is known for its volatility and rapid price fluctuations. Automated trading can also help traders to identify patterns and trends in the market that may be difficult for a human trader to spot. When approaching automated crypto trading, it is important to take into account a number of factors. One of the most important is risk management. Automated trading can be a powerful tool, but it is not without risk. It is important to have a solid risk management strategy in place to minimize the potential for loss. This may include setting stop-loss orders, which automatically sell a position at a certain price in order to minimize losses. Another important factor to consider is the trading platform being used. A good automated trading platform should be user-friendly, reliable, and offer a wide range of features. Some features to look for include the ability to backtest strategies, real-time market data, and the ability to integrate with other tools, such as charting software. One of the key features of a good automated trading platform is the ability to backtest strategies. This allows traders to test their strategies against historical market data and see how they would have performed in the past. This can be a valuable tool for identifying patterns and trends in the market and fine-tuning strategies. It's also important to look for a platform that offers real-time market data. This can be critical in fast-moving markets like crypto where prices can change rapidly. A platform that offers real-time market data can help traders make informed decisions by providing them with up-to-date information on price movements. A good automated trading platform should be able to integrate with other tools, such as charting software. This can help traders to analyze market data and make more informed decisions. In conclusion, automated crypto trading can be a powerful tool for maximizing profits and minimizing losses in the volatile crypto market. By approaching automated trading with a solid risk management strategy, considering the features offered by the trading platform, and utilizing tools such as backtesting and real-time market data, traders can make more informed decisions and achieve greater success in the market. On cleo.finance, You can create your automated trading, customize them in any way you want, set multiple stop loss and take profits with charting experience, and backtest them by adding transaction costs, fees, slippage costs for more realistic results. Short Summary
Automated crypto trading: - Allows traders to quickly and efficiently execute trades based on real-time market conditions
- Helps to identify patterns and trends in the market that may be difficult for a human trader to spot
- Takes emotion out of the equation and make more informed decisions
When approaching automated crypto trading: - Risk management is important to minimize the potential for loss
- Setting stop-loss orders can be helpful
- A good trading platform should be user-friendly, reliable, and offer a wide range of features
Features to look for in a trading platform: - Ability to backtest strategies
- Real-time market data
- Ability to integrate with other tools, such as charting software
- Backtesting allows traders to test their strategies against historical market data
- Real-time market data provides traders with up-to-date information on price movements
- Integrating with other tools can help traders analyze market data and make more informed decisions
|
|
|
|
Hey everyone, today I wanted to check what is the most important goal of a trading strategy. The source: blog.cleo.financeWhy do I need a trading strategy?Creating a trading strategy is like plotting a course on a map before setting sail. A trader needs a well-defined trading strategy because it provides a roadmap for decision-making and helps to navigate the complexities of the market. Without a clear plan or direction, traders may make impulsive or emotional decisions that put their capital at risk. A well-defined trading strategy allows traders to approach the market with a structured and disciplined approach. This makes it easier to make informed and consistent decisions based on the strategy's rules and guidelines. This helps traders to: - Navigate the market effectively
- Increasing their chances of success
- Maximizing their potential profits
Most traders dont fail at trading because it is hard. They fail because they are not willing to put in the work to create a detailed plan, test the plan, and then follow the plan. The most important goal is to develop a strategy with positive expectancy. In other words, a trading strategy should have a higher probability of making a profit than a loss. Without a well-researched and tested strategy, trading can feel like gambling, with unpredictable and potentially costly results (looking at you WSB!). In other words: You should not enter the competitive world of financial markets unless you have a trading strategy that produces positive expectancy! You need to know 3 things to determine if your strategy has a chance to be profitable: - Win rate the percentage of trades that are profitable
- Risk-reward ratio (RRR) the ratio of the average potential profit to the average potential loss on a trade
- Transaction costs commissions, fees, and other expenses associated with executing a trade
EXAMPLE:Trades: 100 Win rate: 50% RRR: 1:2 Transaction costs in total: 5% of balance for the 100 trades Expectancy = (Win rate x Win Size) (Loss rate x Loss size) TC = Expectancy per trade
Expectancy = (0,5 x 2) (0,5 x 1) 0,05 = 0,45 R per trade
Over the course of hundred trades, you would win half of them (50). But because you can win twice as much as youre risking (1:2 RRR), throughout the 100 trades you would on average win half of what youre risking (avg. profit of 0,5R). If you deduct the transaction costs, this comes down to 0,45R of profit for every open position*.* If you risked 100 USD per trade (R = 100 USD), on average you could expect to win 45 USD for every trade you open. The more data you have in hand the better the prediction can be, but these three data points should be enough to tell if the trading strategy is likely to be profitable over the long term or not. The confidence gained from knowing your trading strategy has a positive expectancy is why youre spending hours building and testing it. You dont have to decide on the spot, you just mechanically execute what your system tells you. |
|
|
|
Hey guys, I summarized an article about the divergencies. What is divergenceies, what are the major types of divergiences and how should we use it along with our trading strategy: SOURCEWhat is Divergence?Divergence occurs when the direction of an assets price and the direction of a technical indicator move in opposite directions. Finding divergence between price and momentum indicators, such as the RSI and MACD, is a useful tool for identifying potential changes in the direction of an assets price and is therefore a cornerstone of many trading strategies.  Types of Divergencies?- Bullish Divergence Types of Divergencies?- Bullish DivergencePrice is printing lower low while the technical indicator shows higher lows. This signalizes a weakening momentum of a downtrend and a reversal to the upside can be expected to follow. Quick Notes: watching troughs in a downtrend, the indicator moves up first - Hidden Bullish DivergencePrice is making higher lows while the oscillator makes lower lows. A hidden bullish divergence can signalize that uptrend will continue and can be found at the tail end of a price throwback (retracement down). Quick Notes: watching troughs in an uptrend drawback, price moves up first - Bearish DivergencePrice is creating higher highs while the technical indicator shows lower highs. This signalizes that momentum to the upside is weakening and a reversal to the downside can be expected to follow. Quick Notes: watching peaks in an uptrend, the indicator moves down first - Hidden Bearish DivergencePrice is making lower highs while the oscillator makes higher highs. A hidden bearish divergence can signalize that downtrend will continue and can be found at the tail end of a price pullback (retracement up). Quick Notes: watching peaks in a downtrend drawback, price moves down first Regular divergencies Provides a reversal signal.They indicate that the trend is strong but its momentum has weakened, providing an early warning of a potential change in direction. Hidden divergencies Signals trend continuationThey indicate that the current trend is likely to continue after a pullback, and can be powerful entry triggers when confluence is present. You can find these all 4 divergencies on cleo.finance and compare those divergencies Price with an oscillator indicator An oscillator indicator with another oscillator indicator Price of any asset with the price of any other asset. And customise the divergencies in terms of 4 different parameters: time frame, lookback range, min. distance between peaks/troughs, and confirmation bars. 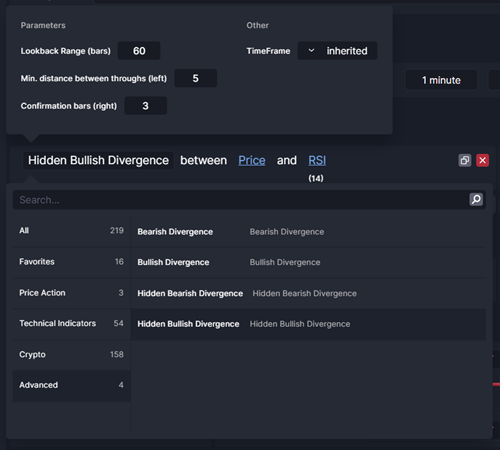
ConclusionDivergences can be an important tool for traders to add to their arsenal, but they should be used in a careful and strategic manner. By keeping these things in mind, traders can potentially use divergences to their advantage in making more informed trading decisions. It is always important to use divergences in conjunction with other forms of technical and fundamental analysis and to approach them with a disciplined and strategic mindset. |
|
|
|
Hey guys, here is an article summary about the security of API keys and how should a trading platform handle the API key security. You can find the source of the article here. One important aspect of a trading platform is how it handles your API keys, which are used to connect your trading platform to your exchange account. Is it safer to install the trading software on your PC or have it run in the cloud?Installing software on your PC at home and whitelisting the IP, is only as secure as your home network. Those, mind you, are being breached orders of magnitude more often than cloud servers networks. Not to mention the potential of downloading and installing malicious software right off the bat. So, the real question is how many and how strong barriers are between your API Key/Secret and a potential party with bad intentions?Cloud servers are typically more secure than home networks, as they are subject to regular security audits and updates. Additionally, cloud-based software is generally easier to keep up-to-date and secure, as updates are managed by the cloud provider. However, its still important to choose a reputable cloud provider and to use best practices for securing your API keys, regardless of whether the software is running on your home PC or in the cloud. How does cleo.finance(A trading platform) store API and Secret keys? Main servers manipulating any sensitive data are not visible to the outside network at all Your API key/secret is not stored in a single database but is stored in 3 different places, each with separate hardware and software security protections o The attacker would have to breach all 3 to get access to the Encrypted version of API key/secret which wouldnt help them all Those sensitive data are encrypted with arguably the most modern and secure 256-bit encryption protocol o Brute-force decrypting of the data from a single database with current technology would take longer than the age of our universe. cleo.finance cloud hardware is distributed and the software is up-to-date with the most recent security updates What can I do to increase the security of my funds if I want to use third-party software?1. Watch out for phishing schemesTo prevent and identify phishing scams, you should be cautious when clicking on links or opening attachments in emails, even if the email appears to be from a legitimate source. You should also be wary of providing personal information, such as passwords or credit card numbers, on unfamiliar websites. 2. Whitelisting IP addresses can help to increase the security of your funds when using any third-party software.
By limiting access to your exchange account only to known IP addresses, you can prevent a significant amount of unauthorized access attempts. However, for trading platforms serving thousands of users, such as cleo.finance, exposing the IP addresses of trading servers is a security and scalability issue on its own. 3. Allow only necessary access to your exchange account in the API key permission settingsYou can grant read + trading access, which allows the platform to view your account information and execute trades but not withdraw funds. Its important to never allow withdrawals, as this can leave your funds vulnerable to unauthorized access.  4. Limit the number of third-party services you use and use a different API key for each of them. 4. Limit the number of third-party services you use and use a different API key for each of them.The more services you connect to your exchange account, the more potential vulnerabilities there are. By limiting the number of services you use, you can reduce the potential for unauthorized access to your account. Using different API keys for each of them can help figure out where the breach is coming from.
5. Regularly update your API keysBy deleting old API keys and creating new ones, you can ensure that your exchange account remains secure. This is particularly important if you suspect that one of your API keys has been compromised. By regularly updating your keys, you can prevent unauthorized access to your account and keep your funds safe. |
|
|
|
Hey Guys, for people who wonder about where to set the stop losses and stop loss types, here is an article summary. SOURCEIn the pursuit of long-term profitability, you need to become proactive in protecting your funds. Entering a position from the perspective of what you are risking, rather than what you stand to gain is the differentiator between the traders that make it and the rest. - Determining where to set a stop loss:
You are looking for an area, where your trade will be invalidated = where your trading idea is wrong. Popular options are:Price invalidation based on Support or Resistance levels Identifying a price invalidation based on Support or Resistance levels Stop Loss based on ATR or another volatility indicator It shows the average volatility for the past 14 bars. The idea behind using it: I better put my Stop Loss outside the zone of normal volatility to avoid getting stopped by normal market moves. Stop Loss based on the trend - There are many ways traders try to identify a trend and its strength. The easiest way to analyze them using Technical Analysis would be through moving averages (MAs). Whether you are looking at the slope of the moving average, its relationship to the price (being above or below the MA), price, or another moving average with different settings crossing it (fast and slow MA cross combinations) all of these options can help you determine the trend direction. Fixed PnL Stop Loss - This is generally not a very efficient way to place a Stop Loss, because the market doesnt care what % of your account you are willing to lose. If youre for example always opening a position with the same size and using the same, say 2% stop loss, it will get placed on price levels with no regard to the previous market movements, volatility, or anything else but your balance. This can lead to you getting stopped out a lot, even though the underlying signal might be good. Trailing Stop Loss - This dynamic way of setting stop losses follows price. If you set a 5% trailing stop loss and the price keeps going up, the stop loss moves up with the price. It can be useful in trending markets or when the asset enters price discovery and traders dont have known price levels to work with. Limit orders - set a specific price and can be executed only at that price.
PROS:In crypto: Limit orders tend to cost less than market orders as they are considered market-making (Maker Fee) It guarantees the execution price CONS:This stop loss can be set off only if theres an equal or bigger buyer at that price. You risk not getting your full position closed. Market orders: set to trigger when a certain price is reached, but will execute until full position is closed even if it means slippage (eating through the order book).
PROS:It will close your full position CONS:The actual execution price may vary (due to slippage = defined by volume and how thin is the order book). In crypto: Tend to cost more (Taker Fees) Stop Limit orders - There can be even more niche categorization of limit orders. |
|
|
|
Herkese Merhaba, Ben ve arkadaslarim, kodlamaya gerek duymadan kendi krip botunuzu ileri seyive risk yonetimi araclari ile olusturup, geriye donuk test edip(backtesting), gecmis pozisyonlarini chart uzerinde izleyebileyeceginiz bir platform gelistirdik. Buradaki yatiricimlarinda fikir ve dusuncelerini merak ediyoruz. Simdiden tesekkurler. Cleo.finance, kripto yatirimcilarinin ticaret süreçlerini otomatikleştirebilecekleri yenilikçi bir kripto yatirim platformudur. Platform, kripto yatirimcilarina genis veri setleri, gelişmiş risk yönetimi, kodsuz anında otomasyon, geriye dönük test, kapsamlı istatistikler ve kripto yatirimcilarinin her pozisyonlarını tekrar tekrar chart uzerinde izleyebildikleri benzersiz bir analiz aracı ile kendi özel pozisyon acma ve kapama kurallari oluşturmalarını sağlar. Kullanicilar, OKX veya Binance hesaplarını API aracılığıyla bağlayarak kolayca başlayabilir. Onemli not: Cleo.finance'in fonlarınıza erişimi yoktur ve fonlarınızı çekemez. API bağlantısı yalnızca pozisyon acma ve kapama için kullanılabilir ve istediğiniz zaman iptal edebilirsiniz. Zaten platformda para çekme izinleriyle API bağlantısını kabul edilmemektedir. 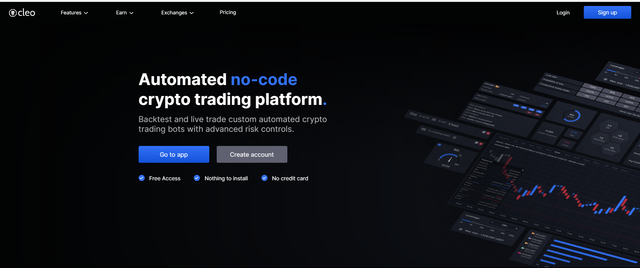 - Her kullanici kendine ozel kripto yatirim botlarini sadece yazarak, kodlamaya gerek duymadan olusturabilirler. BTCUSDT fiyati EMA(200) uzun uzerine ciktiginda al gibi.
- Hizli ve kapsamli geri donuk test araci(Backtesting) - Daha gercekci test sonuclari icin borsa komisyon ve islem ucretlerini de ekleyebilirsiniz
- Typing your entry and exit conditions with up to 55 technical indicators, including VWAP, MACD, RSI, candlestick patterns or price action.
- Her bir indicator kendi icinde ozellestirebilir. Ornegin RSI indikatoru icin parametre ayarlarini, kripto para cifllerini, yada zaman ayarini degistirebilirsiniz./size]
- 7 period secme 1 dakikaliktan 1 gune kadar
- Hazir ve ucretsiz trading sablonlari
- 4 Stop Loss ve 4 Take Profit emirleri
- and ve cok daha fazlasi.
 Automated Loop Strategy istatistikleri Automated Loop Strategy istatistikleri Position Replayer araci Position Replayer araci  Asset Management Araci - Asset Management Araci -  |
|
|
|
Create your trading plan, work on it and stick to your plan - Achieving consistency and disciplineIt is fascinating to see it start to pay off once you patiently work on it! And I wanted to share some of the rules I strictly followed here. It might help other traders and might add some value to the community here: - Systemizing the learning process
- Thinking on effective ways of learning.
- Build through small wins, not the biggest, but where's the easiest money for me to test and implement what I have learned
- I learned that I mostly lost profits and even ended up with losses for being too greedy for more profits and deviating from my trading plan.
- Set your take profit, and stop loss along with the right position sizing. Have a clear plan for what you want to achieve. (To learn how to set up your stop losses and effective position sizing, you can find it here.)
- Don't let emotional elements affect your trading decision and harm your long-term profitability. (Automated trading helped me greatly with this and also with my trading discipline)
- Set a risk limit for each trade, but also for a day/week/month.
- Determine the right position size and start small
- Increase the size of trades slowly if your account grows
- Lower size or switch back to paper trading if your account doesnt.
|
|
|
|
Hey Guys, I have an article about how to set your stop losses. Here is a quick summary: Full Article is here:- What is a Stop Loss (SL)?
Stop Loss is an order designed to limit an investors loss on a trading position. Every time you enter a trade, you expose yourself to the risk of losing your capital. If you dont use a stop loss order, you are exposing your entire portfolio to a loss every time you trade. Stop loss defines the risk you are taking for that particular trading opportunity. - Determining where to set a stop loss:
You are looking for an area, where your trade will be invalidated = where your trading idea is wrong. Popular options are:Price invalidation based on Support or Resistance levels Identifying a price invalidation based on Support or Resistance levels Stop Loss based on ATR or another volatility indicator It shows the average volatility for the past 14 bars. The idea behind using it: I better put my Stop Loss outside the zone of normal volatility to avoid getting stopped by normal market moves. Stop Loss based on the trend - There are many ways traders try to identify a trend and its strength. The easiest way to analyze them using Technical Analysis would be through moving averages (MAs). Whether you are looking at the slope of the moving average, its relationship to the price (being above or below the MA), price, or another moving average with different settings crossing it (fast and slow MA cross combinations) all of these options can help you determine the trend direction. Fixed PnL Stop Loss - This is generally not a very efficient way to place a Stop Loss, because the market doesnt care what % of your account you are willing to lose. If youre for example always opening a position with the same size and using the same, say 2% stop loss, it will get placed on price levels with no regard to the previous market movements, volatility, or anything else but your balance. This can lead to you getting stopped out a lot, even though the underlying signal might be good. Trailing Stop Loss - This dynamic way of setting stop losses follows price. If you set a 5% trailing stop loss and the price keeps going up, the stop loss moves up with the price. It can be useful in trending markets or when the asset enters price discovery and traders dont have known price levels to work with. Limit orders - set a specific price and can be executed only at that price.
PROS:In crypto: Limit orders tend to cost less than market orders as they are considered market-making (Maker Fee) It guarantees the execution price CONS:This stop loss can be set off only if theres an equal or bigger buyer at that price. You risk not getting your full position closed. Market orders: set to trigger when a certain price is reached, but will execute until full position is closed even if it means slippage (eating through the order book).
PROS:It will close your full position CONS:The actual execution price may vary (due to slippage = defined by volume and how thin is the order book). In crypto: Tend to cost more (Taker Fees) Stop Limit orders - There can be even more niche categorization of limit orders.Manually: Watching the price and manually clicking when the level is reached. Good if you are an intraday trader, and dont leave open positions overnight. It is not good when price moves violently, especially in crypto, often you will not have time to react. Automatic stop loss:This is the more conventional way these safeties are implemented. In trading platforms cleo.finance you can set several simultaneous take profit orders and stop loss orders, close positions based on indicators or price movements, and set position sizes with a lot of flexibility. Closing thoughtsStop Loss defines your risk. The use of stop loss will ensure their longevity in the markets. Hope you find this helpful. |
|
|
|
Hey everyone,
Cleo.finance - an automated no-code trading platform - have some new updates. I wonder about the opinions and thoughts of this community about the platform. Any feedback and opinons are most welcome. Here is the site for more info
Cleo.finance is an innovative crypto trading platform where crypto traders can automate their trading process. The trading platform offers crypto traders to create their own custom trading conditions with ever-expanding data sets, advanced risk management, instant automation with no-code, backtesting, comprehensive statistics, and a unique analysis tool where crypto traders can replay their every position in detail right in the chart candle by candle.
Traders can get started easily by connecting their OKX or Binance exchange account via API. And for the records: Cleo.finance does not have access to your funds and cannot withdraw your funds. The API connection can only be used for trading, and you can revoke it at any time. The platform does not accept the API connection with withdrawal permissions.
- Custom crypto bot creation in minutes. No coding is required.
- Fast and extensive backtesting tools with fees and transaction costs are included
- Typing your entry and exit conditions with up to 55 technical indicators, including VWAP, MACD, RSI, candlestick patterns or price action.
- Each indicator is fully customizable and independent. You can change parameters, assets or the timeframe it evaluates.
- 7 execution timeframes from 1 minute to 1 day
- Fast execution speed with avg. execution delay is less than 300ms
- Trading templates
- Up to 4 Stop Loss and 4 Take Profit orders with full flexibility
- and more features.
Create your own crypto trading bot through simple typing Automated Loop Strategy StatisticsPosition Replayer Tool - Traders can replay their position history and position progress candle by candleAsset Management Tool - Where traders can set multiple stop losses and take profit and they can also preview their trading setups on the integrated tradingview chart before placing their trades. There are also programs where traders can earn additional cash while trading on cleo.finance! With the affiliate program: Traders can earn 30% revenue from each purchase (forever) of their referees plus $100 for every Qualified user. With the Cashback Program, traders can get paid up to $6,000 per month for trading with cleo.finance. Looking forward for your feedback, thank you all!
|
|
|
|
Hey guys, here is an article about 10 trading templates using technical analysis. I will put the summary here. If you like to read the full review, you can find it here: and you can find those templates for free on cleo.finance and you can also modify them further according to your own trading needs.
The way to achieve long-term profitability is through putting a bit of work upfront, understanding the markets, and honing your trading plan accordingly. Nevertheless, most traders tend to avoid constructing a trading strategy until the market turns on them.
Trading setups aka picking the spot where you enter and exit the market tend to get all the focus online, while proper risk management is overlooked and understudied. So, these are trading setups but without the proper risk management and position sizing, it won't take us anywhere but to constant losses.
Important note: Each of these templates is meant to be a starting point in your trading journey and together are the most used basic setups involving technical indicators. Those templates should not be used on their own in a vacuum. In general, trading using technical indicators as a sole entry or exit signal is not the best approach. You should observe the current market structure before using these setups! But, they can be a good starting point for developing your own trading setup.
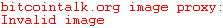
1. Lower Bollinger Band® cross LONG
This setup opens a long (buy) position when the price closes below the lower band of the Bollinger Band® and exits when the price closes above the upper band. Bollinger Bands® is set at 2 standard deviations from the 20-day SMA.
This setup does not work well in trending markets, but profits in ranging markets. Therefore, you should implement a trend filter before you consider using this template. For higher hit rate substitute the exit conditions of an Upper Bollinger band® cross for SMA(20) the middle line.

2. Upper Bollinger Band® cross SHORT

This setup is the reversed setup of the previous Long template. It opens a short (sell) position when the price closes above the upper band of the Bollinger Band® and exits when the price closes below the lower band. Bollinger Bands® is set at 2 standard deviations from the 20-day SMA.

Just like the previous setup, this also does not work well in trending markets, but profits in ranging markets.
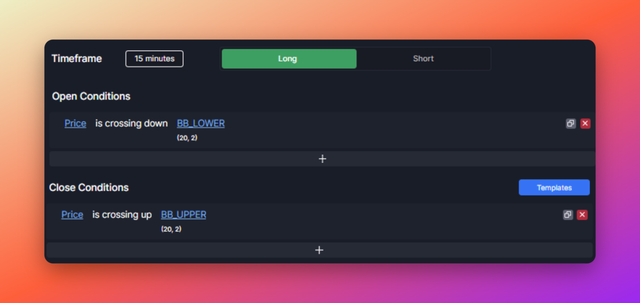
3. Uptrend with EMA, PSAR, MACD LONG
This setup opens a long (buy) position when the price is above EMA(21), Parabolic SAR, and when the MACD line is above the Signal line all on a 1-hour timeframe. Parabolic SAR and MACD indicators both have default settings.
This setup tends to profit in uptrending market conditions and should be avoided in ranging markets. You can change the timeframe to fit your preferences.

4. Downtrend with EMA, PSAR, MACD SHORT

This setup opens a short (sell) position when the price is below EMA(21), Parabolic SAR, and when the MACD line is below the Signal line all on a 1-hour timeframe. Parabolic SAR and MACD indicators both have default settings.
This setup tends to profit in downtrending market conditions and should be avoided in ranging markets. You can change the timeframe to fit your preferences.

You can find the rest of the review of the article on blog.cleo.finance.
5. Moving average Golden Cross LONG
6. Moving average Death Cross SHORT
7. Upturn in momentum with RSI, SMA LONG
8. Downturn in momentum with RSI, SMA SHORT
9. Upward Momentum LONG
10. Downward Momentum SHORT
Dont forget You can find all these conditions on cleo.finance and they are all free to use. You can modify the conditions, periods of the indicators, their timeframe or even the asset they are evaluated on, add other conditions, and generally play around within the platform to find out something you want to use in your trading.
|
|
|
|
Hello everybody, here is an article about position sizing, and here is its quick summary( Full Article on cleo.finance blog): Position sizing is determining the correct size of the position based on the amount of money you risk on the particular trade.Before you can do that, you need to figure out what is the maximum acceptable risk of the trade. That risk is usually expressed as a % of your balance, that you are willing to lose. To make sure you dont lose more than this amount traders set a Stop Loss order which are the real maximum exposure of your position. If you dont use a stop loss, you are exposing your entire portfolio! Where to put a stop loss?- Thats where Technical Analysis can be handy. Majority of retail traders would look at the chart to find out usually behind some support/resistance level or based on some volatility indicator, such as ATR
Rule of thumb:Risk between 1-3% of your portfolio balance on each position. This way any single individual loss wont wipe your account and break your spirit. And more importantly, even a string of losses will leave you with enough ammunition to recoup the losses. Have a clear approach to risk:- Set a risk limit for each trade, asset in general, day, week and month (you wont risk more than X account)
- Determine the right position size and start small
- Increase the position size of trades slowly if your account grows
- Lower size or switch back to paper trading if your account doesnt
Two types of position sizing methods: Fixed and flexible Fixed position size- Using the same position size for every trade
- Good for finding out if your strategy has an edge
- Make sure you come back and reevaluate position size periodically.
Flexible position size- Using a percentage of current balance
- Cluster of wins makes every following win larger
- Cluster of losses makes every following loss smaller
How to calculate the correct position size:
You need to know - Trading account size
- Acceptable risk (in % per each trade)
- Invalidation point (in form of a distance from the open price)
The formula:Position size = Trading account size x Acceptable risk / Invalidation Example: - Trading account size = $10,000
- Acceptable risk = 1%
- Invalidation point = 4% drop in market price
Position size = $10,000 * 0,01 / 0,04 = $2,500This way you will always risk losing $100 no matter where your Stop Loss goes! If Stop Loss must be wider, say 8%, the calculation is: Position size = $10,000 * 0,01 / 0,08 = $1,250 Doubling the distance to our stop loss has us reducing our position size by half to maintain the same possible loss.How to set position size in the trading platform
- Pick a leverage
- Add a Stop Loss
- Input the market price or the distance in % of the stop loss
- Whichever value you enter first, that becomes the constant element that wont change when you edit other variables. You can select different constant by clicking the target icon
- Input the Position Size or Margin size while watching the PnL of the Stop Loss
- Increase or decrease the size of the position, until the PnL of the Stop Loss is at the level you want it to be
 This way you can control exactly what your exposure is, while understanding all the variables involved. You can even add multiple Stop Loss orders, which can help you limit the exposure in lower conviction plays, such as new set-ups. The next article will be about Stop Losses. |
|
|
|
Hello guys, I have been working on this set up lately. This setup profits in uptrending market conditions, and It seems like it fails to filter out the ranging markets. I am thinking of adding ADX indicator to filter out the ranging markets may be? I briefly checked it in TradingView and it seems to have merit. Examples of results on several assets and several timeframes. I looked at the ETHUSDT and BTCUSDT on 1 hour, 4 hour, and 1-day timeframes. It opens a long position when the price is above EMA(21), Parabolic SAR, and when the MACD line is above the Signal line. Parabolic SAR and MACD indicators both have default settings. I would like to improve this further. Here is the settings:  |
|
|
|
|

