 Show Posts Show Posts
|
|
Pages: [1] 2 3 »
|
Arepo's Weekly Newsletter, running through 23 June 2014. New Pricing Tiers! (as of 30 March) 0.025 BTC -- 1 issue 0.085 BTC -- 4 issues 0.25 BTC -- 12 issues I am opening this thread as a center of discussion for my weekly publication. Please feel free to post any questions, comments, and other feedback here. Non-subscribers are welcome and encouraged. Subscribers, try to refrain from posting newsletter content in this thread. If you have a content-specific question, feel free to PM or email me. General commentary, supplementary analysis, and alerts in the event of a mid-week update will be posted here. I am always accepting new subscriptions, so PM me if you are interested!  Current Subscriber List: oda.krell -- 16 issues (expires week of 23 June) docile -- 16 issues (expires week of 23 June) John999 -- 8 issues (expires week of 28 April) kramerc -- 8 issues (expires week of 28 April) iron77 -- 8 issues (expires week of 28 April) kwest -- 4 issues (expires week of 31 March) jlin -- 16 issues (expires week of 23 June) CoinBurner -- 4 issues (expires week of 31 March) Aquatic -- 16 issues (expires week of 23 June) Blue -- 16 issues (expires week of 23 June) Ultros -- 4 issues (expires week of 14 April) Roger_Murdock -- 16 issues (expires week of 23 June) rushthatspeaks -- 4 issues (expires week of 14 April) Vectra -- 1 issue (week of 24 March) castle -- 12 issues (expires week of 23 June) damdam -- 4 issues (expires week of 21 April) windjc -- 4 issues (expires week of 21 April) CoolStoryBro -- 4 issues (expires week of 28 April) whiz1003 -- 12 issues (expires week of 23 June)
|
|
|
|
Hello fellow speculators! after a brief hiatus during the month of February, i am once again back in bitcoin business To kick off this trading season, i'd like to launch a weekly newsletter featuring the same kind of analysis i periodically posted to the forums in January. for those of you unfamiliar with my work, you can get a feel for my techniques here and here. i have been active on this subforum for about two and a half years now, and during that time i have tested and honed various methods for anticipating bitcoin price behavior. my academic background is in Physics and Mathematics, both fields which have influenced my work. I make extensive use of technical indicators, the complete list of those which i have found particularly useful behavior being: -Accumulation/Distribution and Chaikin Oscillator
-Aroon and Aroon Oscillator
-Chaikin Money Flow
-MACD
-Price Volume Transform
-Average Directional Index
-RSI
-Money Flow Index
-William's Oscillator
-Stochastic RSI
-Commodity Channel Index
-Detrended Price Oscillator
-TRIX
-Ultimate Oscillator
-Bollinger Band Width
-Mass Index
-Rate of Change
-Slow Stochastic Oscillator
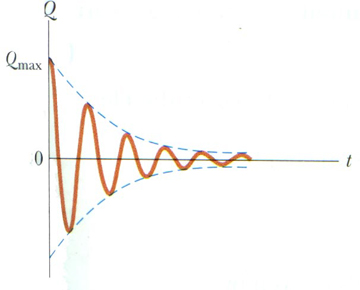
For short-term predictions, i also largely focus on direct price analysis, using a fractal model similar to Elliot Waves to make weighted predictions about price behavior based upon consistent patterns in historical price data. my trading is also generally informed by a number of concepts and equations from the realm of classical physics, like the damped oscillator behavior that occurs in the price function after large movements. The newsletter will be mainly directed towards new speculators who may not fully understand how to interpret the various indicators available at resources like bitcoincharts.com, with full explanations of my own interpretations accompanied by specific price targets and signals which will help you make more informed trading decisions in the future, as well as profit from my own observations in the meantime! For more experienced traders, the newsletter will hopefully provide an alternate perspective to corroborate or challenge your own models and predictions, as stress-testing and second-guessing is the only empirical way to improve your techniques! To address the wide range of users in this subforum, I am offering three pricing tiers: 0.025 BTC for 1 week (1 issue) ideal for casual traders and anyone unfamiliar with my work, for a one-time report to get a feel for the publication0.085 BTC for 1 month (4 issues discounted) 0.3 BTC for 4 months (16 issues, 4 issues free) The newsletter will be sent out on Mondays, between 9 am and 12 pm EST. any future changes to this schedule will be posted. Please feel free to post questions, comments, or requests for clarification in this thread. for those interested, you may send payment to the address in my signature [ 18N9md2G1oA89kdBuiyJFrtJShuL5iDWDz] in the following format: 0.30000012 where the last two digits serves as an ID. then PM me with your email address and your ID to confirm payment. i will add your username and your subscription to a list that i will update at the end of this post to complete the subscription confirmation process. the report will be sent out via email in pdf format each Monday, and a separate thread which i will open on this forum will serve as a platform for discussion, feedback, other general commentary, and alerts. I look forward to sharing my work with you all in this format! in the past, i have only published individual reports so i am excited to be starting a newsletter and look forward to working with you all during what i anticipate will be a very exciting bitcoin spring! --arepo P.S. I have two other projects in the works which i will pursue if there is interest. for longer-term traders for whom the above arrangement may not be what you're looking for, i can prepare a single-issue report outlining my general expectations for the 4-month period. obviously my weekly updates will have the advantage of precision, but for traders who mostly hold, longer-term signals might be preferred. if you are interested in this kind of report, let me know in this thread as well as what you would consider a fair price. with this feedback, i can determine if i will be able to pursue this project in tandem, and publish it in the following weeks. The other project i have considered is a daily newsletter for daytraders. this would follow the same format as the weekly newsletter i am launching, but focus on much shorter-term daily signals to help traders anticipate daily price action. i am not sure if there is enough interest to make a daily newsletter worthwhile, but if there is significant demand, i may be able to run this as well. again, let me know in this thread, and i will determine if i can provide this service. ----- Subscriber List: (last updated 09/03 14:29 EST) oda.krell -- 16 issues (expires week of 23 June) docile -- 16 issues (expires week of 23 June) John999 -- 4 issues (expires week of 31 March) kramerc -- 4 issues (expires week of 31 March) iron77 -- 4 issues (expires week of 31 March) kwest -- 4 issues (expires week of 31 March) jlin -- 16 issues (expires week of 23 June) CoinBurner -- 4 issues (expires week of 31 March) |
|
|
|
|
I am seeking a loan for hedging purposes. I have been an active trader and general bitcoin enthusiast for a little more than 2 years now.
The funds will be used to hedge against a position that I currently am holding at Bitfinex. They will not be spent, or otherwise transferred, for any other purposes. Either my position makes profit, and the loan and interest can be repaid in full, or my position makes losses and the hedge will profit to cover the interest.
I do not currently own altcoin for collateral, but I can provide proof of ownership of a vehicle worth approximately $3500 as well as various household electronics (flat screen HDTV, gaming consoles, and desktop and laptop computers) worth approximately $4000.
Again, the funds will not be spent or transferred from the Bitfinex account, only used to hedge, therefore the risk of loss is very small.
I am open to negotiate both the interest and the repayment period. It is likely I will be able to repay this loan within a shorter timeframe.
I am very active on the speculation subforum and have done business with the following users, in which they paid in advance for price analysis reports and other market observations around the sum of 3 BTC without issue:
dandirk
hubbabubbabaker
PYaEe
bitly
karmic
wobber
ruski
TheRenix
bitrider
iron77
hybrid
Frozenlock
michaelGedi
I am willing to comply with any requests for personal documentation.
Since times of high price volatility are also times of large profitability for traders, I hope there is an investor who will help me reduce the risk in my position in return for mutual profits.
Also, I have not attempted to procure a loan from this subforum before, so please let me know what steps I can take to further adhere to the various precedents regarding this practice. I believe that the agreement I have outlined above is a fair offer that provides mutual benefit for both parties.
--Arepo
|
|
|
|
hey everyone, you may know me from the speculation subforum where I spend most of my time, but today I am posting on behalf of a college friend who has been running a local tutoring business and would like to extend his service to the bitcoin community! he is knowledgeable on a wide range of topics and i am confident there are some forumites who could benefit from his tutoring abilities. Hello bitcoiners. My name is Harrison Katzz and I am a graduate student of Physics. I earned my undergraduate degrees in Physics and Computer Science with a minor in Mathematics during my time at university. I have extensive experience tutoring, and am offering tutoring over webcam for 0.05 BTC/hour for the following subjects:
Mathematics (high school up to single-variable calculus)
Physics (all levels)
Computer Science (intro courses and low-level C++, Java, and Python)
Spanish (all levels)
French (intro courses)
German (intro courses)
Swedish (intro courses)
Chemistry (high school levels)
Biology (high school levels)
Other science and math courses not listed above may also be covered. I am also offering to complete individual assignments and papers for pay, on a case-by-case basis.
If you have any questions or are interested please email me at Harrison.Senegal.Kazz@gmail.com!
I thank you in advance for your patronage, and I am looking forward to acquiring my first bitcoins by providing this service. I am very intrigued by the architecture of the Bitcoin Protocol, and hearing about it in the news more and more each month has encouraged me to make an account on these forums. Due to posting restrictions, I asked Arepo to post this advert for me. I hope it is received well.
feel free to contact Harrison directly via email, or if you have any quick questions or comments you may post them here and i will forward them. --arepo |
|
|
|
this is a continuation of a free series that i will be posting from time to time. last issue: Decision Point! -or- A Page From Arepo's NotesSO! Let's take a quick look at the present moment on Gox (for all you bitstampers out there, the prices are largely correlated so this analysis applies equally!)  http://s28.postimg.org/fg67oje7h/trendornotrend.png http://s28.postimg.org/fg67oje7h/trendornotrend.pngwe've got two possible patterns, one a bearish flag the other a rising wedge (usually bearish), depending on which parts of the data can be considered outliers. for the flag, breakout is in 0.5 - 3 hours, for the wedge, breakout in 1-5 hours. however, there is a case to be made for both bearish and bullish scenarios. this is intended to be an overview and a brief tutorial on how to interpret the various indicators available over at bitcoincharts.com. as always, questions and clarifications are welcome and encouraged! The Bull Case=== 10-day 2-hour scale @ GOX http://postimg.org/image/yfzanaxz1/ http://postimg.org/image/yfzanaxz1/=== MFI: an oscillator that incorporates volumewe've touched down onto a strong moving support, marking the third point of contact that describes a robust trendline*, which is very bullish. this suggests that we've reached the bottom of a correction to the trend, and we will break up out of this pattern. *a line can be drawn through any 2 points so 3 points is the minimum for a robust linear model for channels, trendlines, and bounds for various other patterns.StochRSI: a very light oscillatorupwards movement after an overbought period (blue) on this oscillator is bullish. if it continues, we should break up. a reversal in this indicator would be bearish. CMF: an price-volume transformation that acts as an oscillatornot only is the CMF strongly positive, a small but robust upwards trend is visible. as long as this trend continues we will stay on track for the mid-term trend. PVT: another price-volume transformsame interpretation as the MFI -- trendline intact, also very robust with 4 points of contact. The Bear Case=== 10-day 2-hour scale @ GOX http://postimg.org/image/dht4p7y4d/ http://postimg.org/image/dht4p7y4d/=== UO: an oscillator based on moving averagesthese data show a retest of an important support, as well as a lower high correlated with the recent peak. very bearish. if the support holds we may see sideways consolidation, but a break under this support would be very bearish. Mass Index: volume trackerthis indicator is calibrated to peak during reversals, which are usually periods of high volatility and high volume. the red and blue bounds are critical, intended to show periods during which volume and volatility are significantly higher than during normal trending and consolidating behavior. a short-term peak above this threshold threatens a reversal. William's: another light oscillatorin these data we see a broken support, and a consolidation underneath perhaps forming a bearish triangle. if we cannot break above this support, the mid-term trend is likely over. SlowStoch:measures the momentum of price movementsimilar story here, with a broken support and an even more bearish consolidation. if we cannot break above the 50-line, the trend is over. if we break above the 50-line but consolidate under the old support, we may see sideways consolidation. a break above the old support would be a confirmation of the mid-term trend. i hope i have given some of you the tools to trade this exciting moment dynamically. here's a great resource that has the actual formulas as well as in-depth explanations/interpretations of the various indicators. keep in mind that the linked site is intended for other markets, and that my own personal interpretations have been tested and calibrated specifically for the bitcoin price function, but the basic interpretational intuitions still apply. good luck!
--arepo
I work diligently in my analysis, and share it with you as I can. If you learn from me, help keep it free!
18N9md2G1oA89kdBuiyJFrtJShuL5iDWDz
|
|
|
|
anyone know any good price tickers like clark moody's with an interactive graph that shows price points and such when you scroll over it, that has a candlestick view? this resource was invaluable to me in the past and i can't find a good one for bitstamp... sorry, Blitz, i know this probably doesn't belong here but i'm asking fellow speculators because that is what i intend to use this resource for  --arepo |
|
|
|
 http://s30.postimg.org/cs0v68alt/bearflag.png http://s30.postimg.org/cs0v68alt/bearflag.pngright now we're seeing a beautiful triangle consolidation pattern after the small slide, and the big question is... what's coming next? gox data shows a symmetrical triangle, and bitstamp is forming into a descending triangle. well when's coming next is always an easier question to answer, so by some rough geometrical calculations (white rectangles) we can expect a breakout in less than 65 minutes of 10:20 EST. === 1-month 2-hour scale @ MTGOX http://s21.postimg.org/btryd8693/triangle06jan.png http://s21.postimg.org/btryd8693/triangle06jan.png=== unfortunately for the bull case, a moving support visible in both the Slow Stochastic Oscillator, and, to a lesser extent, the William's Oscillator shows a bull run that is running out of space. this moving support is quite robust in the Slow Stochastic with 5 - 6 points of contact! what this means is that either the triangle will break downwards, ending the mid-term trend that started after the last capitulation, or we may break upwards and test the $1100 resistance again. however, the oscillator data suggests that we may not have the momentum to break through and would likely form a double top, thereby ending the uptrend as well. in short: scenario bear: break downwards, capitulation event or downtrend to no lower than $600. scenario bull: break upwards, retest $1100, likely rebound. there is a possible cusp top scenario because of all you irrational bulls where we break through the $1100 resistance and retest the ATH, but this is not likely and we will almost definitely not see another ATH before a capitulation event. --arepo I work diligently in my analysis, and share it with you as I can. If you learn from me, help keep it free!
18N9md2G1oA89kdBuiyJFrtJShuL5iDWDz |
|
|
|
arepo - Is this our bear signal crossing the RSI support? https://www.tradingview.com/x/hg02ySmu/Seems we got MACD cross hitting on the same timeframe as well. I'm still on the fence as to how things will work out, but watching closely. that flash crash was strange. sort of like a long squeeze. heavy volume over a very short period and then a rapid recovery. it is true that it caused the RSI to break below the moving support. however, this alone is still not necessarily bearish. on the other hand, the bullish picture is gone. we seem to have a strong moving support but low weekend volume butting the price against a significant resistance. i would expect sideways consolidation until we can get enough volume for the market to make a decision either way.  i like to use technical indicators to help locate the underlying trends in the noisy price data, so i'd like to share with you some of my notes... warning: some of the following may not be familiar to newer traders. if at any point you are confused as to what i am trying to say, feel free to ask below and i will clarify as best i can. THE slide we just witnessed was anticipated most clearly by a rather cheesily-named indicator called the "Ultimate Oscillator", an oscillator calculated with moving averages, and another oscillator called the Slow Stochastic Oscillator: === 10-day 2-hour scale @ BITSTAMP http://s8.postimg.org/l3yz1tx6d/10day2hour30dec2115.png http://s8.postimg.org/l3yz1tx6d/10day2hour30dec2115.png http://s30.postimg.org/rkwylu0k1/10day2hour30dec.png10-day bitstamp price data for reference http://s30.postimg.org/rkwylu0k1/10day2hour30dec.png10-day bitstamp price data for reference=== this is a markup i made immediately after the first leg down, showing how the failing of one moving support portended a movement down to the next level of support. black marks the primary moving support, grey marks the secondary. we have since broken through this as well, violating the trend. however, the 10-day scale is "micro-term" and doesn't give us much insight into the larger picture. ON the 1-month scale, the Aroon Oscillator, an oscillator based on the Aroon Up/Down indicator system, shows a clear uptrend since the high-volume bottom around $400: === 1-month 2-hour scale @ BITSTAMP http://s30.postimg.org/pr2hn272p/1month2hour30dec2315.png1-month bitstamp price data for reference http://s30.postimg.org/pr2hn272p/1month2hour30dec2315.png1-month bitstamp price data for reference=== while this data is much noisier than the previous two indicators, a robust moving support with 4 points of contact can be discerned. the best aspect of this markup is that this moving support actually predicted the price support we're seeing the price interact with as we speak. that being said, the picture is not yet bearish, but we'll have to see a strong recovery in the micro-term in order to keep the data from violating this trend. ANOTHER view from the slow stochastic oscillator: === 1-month 6-hour scale @ BITSTAMP http://s22.postimg.org/z2gp3aapt/momentoftruth.png1-month bitstamp price data for reference http://s22.postimg.org/z2gp3aapt/momentoftruth.png1-month bitstamp price data for reference=== this is the most interesting view of the data, i believe, but it requires a little bit of interpretation of oscillator data: the slightly lower low on the oscillator corresponding with a higher low in the price data is a bullish sign, because the oscillator moving downwards indicates a consolidation or contrarian movement in the price, and when we see upwards consolidation allowing the relief of so much selling pressure while maintaining trend, it is a very bullish sign. however, we also see a head-and-shoulders formation. impressively, here we see an independent set of oscillator data that predicted the serious resistance we faced as we approached $740/$810 (bitstamp/mtgox). this it corresponds with a decision point where the market either breaks up out of the pattern or fails to overcome the resistance and reverses. AS it stands, we need a high-volume, rapid recovery to maintain this trend from $600. if this occurs, we will break through the resistance at $740/$820 (bitstamp/mtgox). if we see no such thing, the major 1-month moving support will be violated and the picture will turn bearish. the incredible volume at the previous 1-month low is enough to cement it in the mid-term, so we should see mid-term prices no lower than $600 even in the bearish scenario.--arepo I work diligently in my analysis, and share it with you as I can. If you learn from me, help keep it free!
18N9md2G1oA89kdBuiyJFrtJShuL5iDWDz
*post edited for clarity |
|
|
|
hello all, i have returned after some time away. it is nice to be back in the swing of things, though anyway, i fired up the ol' bitfinex account and i noticed that they no longer offer 4:1 leverage -- the highest option is 2.5:1. anyone know the reason for this change, or when it occurred? does anyone know if there is a way to obtain more leverage on this platform? also, general comments and criticism on bitfinex is welcome. anyone have any issues? anyone have no issues at all? any tips, caveats, or points of discussion? thank you for your time. --arepo |
|
|
|
SPLIT FROM LUCIF's ANALYSIS THREAD: All this TA reminds me of voo doo and hocus pocus BS.
If you are here on the forum you ultimately are bullish on bitcoins unless you are working for the FED or other central bank.
I agree- true- the sentiments and psychology of people is the same as in any investment area BUT in this very small and not very wide spread market we can have a swing of 50% in one day due to a whim of a big investor ( or an early adopter ). So all the sophisticated TA is out the window. No one person can predict crazy. And I know some of those early coin holders are probably not all right in the head. this is a common misconception that has a game theory explanation. take one assumption: barring 'crazy' actors, TA can accurately account for underlying trends in price data. hypothesis: while some traders can be considered 'eccentric', direct manipulation is risky and can often incur loss, and a rational actor with a large sum will make 'TA-appropriate' moves (following from our assumption) to maximize gain. tl;dr -- following a trend has a better profit/risk ratio than manipulating a trend, on average. --arepo |
|
|
|
last chance come out of hibernation, bears! toot-toot.and the FUD keeps rolling in. here's a list:
This is just the beginning of the crash.
WHY BITCOIN IS JUST A BUBBLE, HUGE FUNDAMENTAL FLAW
are we in a bear market now??
Real crash/correction coming.
Its not bottom yet. It will crash under 100 just wait for it.
There is not option for 140$ by bitcon
Google Trends and Main Client Downloads Are At Month Lows
CoinLab News = Price collapse
And..... CRASH!
Looks like a dying patient
How low we can go on this boubble ?
-===-
this is what a market bottom sounds like.
there is way too much FUD on this subforum for us to do anything but go right back up...
stay one step ahead pretty soon these panicky hands will realize that people actually want the bitcoins they're dumping on the market... 
|
|
|
|
stay one step ahead pretty soon these panicky hands will realize that people actually want the bitcoins they're dumping on the market... |
|
|
|
 crazy bot battle? |
|
|
|
EDIT: FIRST BOUNTY FILLED. SECOND BOUNTY FILLED. DO NOT SEND MORE COINS UNTIL ANOTHER BOUNTY IS OPEN. PM me if you are interested. It is finally complete! The report I have been working on this past week will be my first such report that I am making available on these forums. If you are a fan of my Technical Analysis, it is in much the same style. In it, you will understand the mechanics behind the price movement since the large crash, as well as the feasible bounds for the next two months. I have outlined two likely scenarios, with targets included, so you'll know when to enter or exit, and best of all it's presented in a way that requires little to no background in TA at all! (I apologize for those of you who have more than this knowledge, as it may be simplistic but that is the tradeoff for accessibility). It features 15 annotated diagrams, explicit price targets, and tips and resources for newbies. Since this is the first such report I am presenting in this way, I'd like to tell you a little about myself: I have a BS in Physics with a minor in mathematics, and a BA in Linguistics. Ever since I discovered bitcoin two years ago, I have quickly applied my mathematical prowess to the task of making sense of the enormous amount of data available to bitcoin speculators. I have found that many of the 'tried and true' methods of technical analysis are somewhat weak in the way of scientific rigor, and have done my own tests to determine which methods I can demonstrate to hold water. Since those early days, I have settled on such things as standard indicator analysis, fractal analysis (but not Elliot Waves ) and direct price/volume analysis. This is the basis for my report. I recently sold some of my price targets for 1 BTC to user Wobber, which was a great success. This is really the only business I've done with forum users, but at least I have some reputation. Here is the table of contents, to give you a sense of the layout: -===-  -===- I will be offering this report for a small bounty of 0.6 BTC. If you wish to receive a copy, please send a contribution to the following address, and PM me the amount you have sent as well as the email address where you would like to receive the report (pdf). 1Lget6VpCC4zGuzSykfh4YRe2mc9PQzfXT Minimum contribution is 0.15 BTC. Please send contributions in the form 0.150000xx, and PM me your unique amount simultaneously to affirm identity. Once the bounty reaches 0.6 BTC I will release the report to everyone who has signed up. If there is still demand thereafter, I may announce another bounty. ================ EDIT: BOUNTY STATUS: FILLED0.63/0.6 BTC subscribers: 4 -bitrider -electricmucus -iron77 -hybrid -===- updated: 18:47 EST SECOND BOUNTY STATUS: FILLED0.85/0.8 BTC subscribers: 4 -dandirk -frozenlock -michaelGedi -===- *** General Disclaimer ***
Arepo's Detailed Price Analysis and Projections does not constitute, in any way, 'financial advice'. It is simply a projection of the bitcoin price according to my own notes, methods, and model. |
|
|
|
the price seems to be holding its breath as every technical indicator known to man approaches 'neutral'... something's coming. good luck bolls and bars. it's up to you to decide what happens next... maybe i should add a poll? UP or DOWN? -===- it's quiet. toooo quiet. -===-   EDIT: added to the OP |
|
|
|
while we definitely are still in a medium-term downtrend, it seems like the volatility left in the wake of the monster knife is enough stage for a mini-rally. from a zoomed-out view it looks like a bulltrap, BUT, on the 30-min scale we are incredibly oversold. based on the PVT: -===-  -===- ... it seems we are on the verge of a very important breakout. the bid side looks deep, obviously encouraged by mr M's fat $70 wall, and the indicators are temporarily bullish. i think we're going up in a big way, at least to $100. |
|
|
|
|
my bet, which included the 5 mbtc fee, has 12 confirmations now and still no response. this is the longest i've ever had to wait. has any else had similar problems recently?
what worries me is that i can find the tx on blockchain.info, but it doesn't show up on sdice's own 'lookup' page. what can i do?
|
|
|
|
so it seems many bulls still have their fingers in their ears, but -- as long as you know we're just playing musical chairs, and you are comfortable with that, let's take a look at the picture:  just a small correction to the new trend. the bullish wedge formation forms as a consolidation pattern in a bull run, where the market drops slowly on low volume to find the support. how high are we going, everyone? |
|
|
|
breaking the support at $50 is imminent. 1-MONTH 6-HOUR SCALE: 1 and 3 are simple oscillators2 is a moving-average based oscillator4 is a directional index plus a momentum oscillator-===-  -===-
1. RSI is no longer overbought, and is resting comfortably in the lower (bearish) zone, but i highly suspect the market will over-correct for all that red, red exuberance with at least a little more blue. until we spend significant time in the oversold region, i would not be comfortable holding coins.
2. remember when the daily MACD (blue) bounced off the EXP (purple) on the way up from $100? that was very bullish. the inflection here is just the opposite.
3. Money Flow Index has not even yet dipped into oversold territory to compensate for its own red, red exuberance. the mid-line ("50") bounce corresponding to the failure of the $100 support is an extremely bearish indicator here.
4. accelerating momentum line (blue) on the ADX, is paired for the first time in over a month with a red-above-green bear market indicator. (the two other times this month we had red-above-green, the momentum line was decreasing. these events correspond with corrections, not market reversals).thank you for your time. -arepo
if you profit from me, help keep it free!
18N9md2G1oA89kdBuiyJFrtJShuL5iDWDz |
|
|
|
 who's there? BULL bull who? bullTRAP. |
|
|
|
|

