Zangelbert Bingledack (OP)
Legendary

 Offline Offline
Activity: 1036
Merit: 1000

|
 |
February 17, 2013, 03:01:55 AM |
|
Anyone have a technical view on this tight trading range since the big announcements (reddit+Mega)?
|
|
|
|
|
|
|
|
|
|
|
|
|
|
"The nature of Bitcoin is such that once version 0.1 was released, the
core design was set in stone for the rest of its lifetime." -- Satoshi
|
|
|
Advertised sites are not endorsed by the Bitcoin Forum. They may be unsafe, untrustworthy, or illegal in your jurisdiction.
|
arepo
Sr. Member
 Offline
Activity: 448
Merit: 250
this statement is false
|
|
February 17, 2013, 03:04:40 AM |
|
i've been saying reversal since before the knife. the knife was the signal. ice seems pretty thin to me... on the 6-HR scale: -- bearish MACD crossover -- Mass Index falling rapidly, meaning we're in reversal territory -- double top in the upper range of the DPO, ripe for a downside correction.  -=====- as for the tight trading range, it's just the market consolidating after the last big move, trying to make up its mind if it's 'ready' to correct yet. |
this sentence has fifteen words, seventy-four letters, four commas, one hyphen, and a period.
18N9md2G1oA89kdBuiyJFrtJShuL5iDWDz
|
|
|
piramida
Legendary
Offline
Activity: 1176
Merit: 1010
Borsche
|
|
February 17, 2013, 08:11:15 AM |
|
to me it looks like bulls gathering breath before breaking an all time high. but it may not happen immediately, won't be surprised if we correct to ~$21 first (you can see strong support there).
|
i am satoshi
|
|
|
arepo
Sr. Member
Offline
Activity: 448
Merit: 250
this statement is false
|
|
February 17, 2013, 08:13:33 AM |
|
to me it looks like bulls gathering breath before breaking an all time high. but it may not happen immediately, won't be surprised if we correct to ~$21 first (you can see strong support there).
this is a healthy and realistic target. |
this sentence has fifteen words, seventy-four letters, four commas, one hyphen, and a period.
18N9md2G1oA89kdBuiyJFrtJShuL5iDWDz
|
|
|
|
damnek
|
|
February 17, 2013, 08:44:17 AM |
|
All you people have been staring at the charts way too much the last couple of years. Everybody here seems to think that a "healthy" correction is due. And I bet that $27 sounds expensive to most of you who have a base price of say $5. You guys need to cut off that linear thinking. Everything right now is pointing at bitcoin becoming widely adopted on the internet and when that happens, $27 for a bitcoin is NOTHING. Real bitcoin adoption is not going to adhere to some silly indicator saying that we're overbought. I'm fully convinced that this is the last stop for everybody who wanted to make a quick buck to get out.
|
|
|
|
|
|
Luno
|
|
February 17, 2013, 08:56:23 AM
Last edit: February 17, 2013, 09:11:20 AM by Luno |
|
Looks like a top to me too, and it would have been, if not for the 4500 wall at 27. The peaks have rounded tops!! 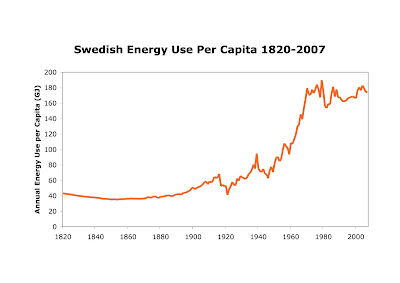 Demand will fall and price hold or dip. The swedes know that price can't go up forever without a decline in demand. This graph is not a joke. It shows an adoptation cycle from the start until prices catch up and demand levels stop their exponential growth and levels off. Technology advances in energy production end the downturns in the exponential curve along the way, much like Bitcoin. If you have a webshop accepting Bitcoin, I bet you have to sell at a 50% discount in Bitcoin. Too fast a rising price is really a business killer. If you want to buy a Porshe for Bitcoins, you could also wait a month and buy a Ferrari instead! |
|
|
|
|
TraderTimm
Legendary
Offline
Activity: 2408
Merit: 1121
|
|
February 17, 2013, 09:11:28 AM |
|
The problem with most indicators is they're usually normalized price fluctuations - and therefore, complete crap.
Look at the MACD, and the rest of it. Hey, it goes up when price goes up, and goes down when price goes down. Seems like trying to trade off an echo, eh?
Ridiculous.
|
fortitudinem multis - catenum regit omnia
|
|
|
smoothie
Legendary
Offline
Activity: 2492
Merit: 1473
LEALANA Bitcoin Grim Reaper
|
|
February 17, 2013, 09:14:59 AM |
|
I would not be surprised if this "reversal" call is wrong...again...
|
███████████████████████████████████████
,╓p@@███████@╗╖,
,p████████████████████N,
d█████████████████████████b
d██████████████████████████████æ
,████²█████████████████████████████,
,█████ ╙████████████████████╨ █████y
██████ `████████████████` ██████
║██████ Ñ███████████` ███████
███████ ╩██████Ñ ███████
███████ ▐▄ ²██╩ a▌ ███████
╢██████ ▐▓█▄ ▄█▓▌ ███████
██████ ▐▓▓▓▓▌, ▄█▓▓▓▌ ██████─
▐▓▓▓▓▓▓█,,▄▓▓▓▓▓▓▌
▐▓▓▓▓▓▓▓▓▓▓▓▓▓▓▓▓▌
▓▓▓▓▓▓▓▓▓▓▓▓▓▓▓▓▓▓▓▓▓▓▓▓▓▓▓▓▓▓▓▓─
²▓▓▓▓▓▓▓▓▓▓▓▓▓▓▓▓▓▓▓▓▓▓▓▓▓▓▓▓╩
▀▓▓▓▓▓▓▓▓▓▓▓▓▓▓▓▓▓▓▓▓▓▓▀
²▀▀▓▓▓▓▓▓▓▓▓▓▓▓▀▀`
²²²
███████████████████████████████████████
| . ★☆ WWW.LEALANA.COM My PGP fingerprint is A764D833. History of Monero development Visualization ★☆ .
LEALANA BITCOIN GRIM REAPER SILVER COINS.
|
|
|
|
|
Herodes
|
|
February 17, 2013, 09:15:48 AM |
|
Yesterday the price was about to decline a bit, then some really solid support, a wall of about 4.1K was placed at 27.0 to keep the price up. Usually there's more activity in the markets coming the week, compared to the weekend. So, is this a move to just keep the price up over the weekend, so that people will not lose confidence ? Without this support, I'm pretty sure we might've seen prices under 26 during the weekend.
|
|
|
|
|
arepo
Sr. Member
Offline
Activity: 448
Merit: 250
this statement is false
|
|
February 17, 2013, 11:06:29 AM |
|
All you people have been staring at the charts way too much the last couple of years. Everybody here seems to think that a "healthy" correction is due. And I bet that $27 sounds expensive to most of you who have a base price of say $5. You guys need to cut off that linear thinking. Everything right now is pointing at bitcoin becoming widely adopted on the internet and when that happens, $27 for a bitcoin is NOTHING. Real bitcoin adoption is not going to adhere to some silly indicator saying that we're overbought. I'm fully convinced that this is the last stop for everybody who wanted to make a quick buck to get out.
it's not charting, the charts reflect knowledge that traders should have. you joined these forums when prices were already on their way towards $10. i first started following bitcoin at around $2.50 / btc. i'm sure there are some people who are still holding onto these cheap coins. at some price-point or another, they're going to figure the risk of someone else selling first is too great for the profit opportunity and sell themselves. this is what drives corrections. we haven't had a green weekly candle in almost two months. take the bulls out of your ears. The problem with most indicators is they're usually normalized price fluctuations - and therefore, complete crap.
Look at the MACD, and the rest of it. Hey, it goes up when price goes up, and goes down when price goes down. Seems like trying to trade off an echo, eh?
Ridiculous.
the MACD tracks moving averages. the fact that these averages have peaked recently, and that the shorter-term moving average is now BELOW the longer term moving average are both really important pieces of information about the rate of change in price compared to its historical rate of change. right now, we're underperforming the growth that we've seen the the past month. how isn't this important? seriously, just because you're a bull and i'm showing you bear tracks on the charts doesn't mean that charts are worthless... sometimes charts give false signals, you know. you should probably argue for that instead. |
this sentence has fifteen words, seventy-four letters, four commas, one hyphen, and a period.
18N9md2G1oA89kdBuiyJFrtJShuL5iDWDz
|
|
|
|
damnek
|
|
February 17, 2013, 11:16:40 AM |
|
...
it's not charting, the charts reflect knowledge that traders should have. you joined these forums when prices were already on their way towards $10. i first started following bitcoin at around $2.50 / btc. i'm sure there are some people who are still holding onto these cheap coins. at some price-point or another, they're going to figure the risk of someone else selling first is too great for the profit opportunity and sell themselves. this is what drives corrections. we haven't had a green weekly candle in almost two months. take the bulls out of your ears. ... seriously, just because you're a bull and i'm showing you bear tracks on the charts doesn't mean that charts are worthless... sometimes charts give false signals, you know. you should probably argue for that instead. And just because I made my account here at that time doesn't mean I've not been around longer.. I'm annoyed with your flood of posts indicating that you've sold off and asking the rest of us here to follow the same old boring price pattern bitcoin has always been making. Anyway, let's give it some time and see what happens.. edit: typo |
|
|
|
|
Technomage
Legendary
Offline
Activity: 2184
Merit: 1056
Affordable Physical Bitcoins - Denarium.com

|
|
February 17, 2013, 12:18:16 PM |
|
With the newest Mega announcement I'd say that we are on a launchpad to the all time high. A lot of new money will come in next week. On the technicals I have no say, I put little faith in them anyway.
|
Denarium closing sale discounts now up to 43%! Check out our products from here! |
|
|
Transisto
Donator
Legendary
 Offline
Activity: 1731
Merit: 1008
|
|
February 17, 2013, 03:32:26 PM |
|
All you people have been staring at the charts way too much the last couple of years. Everybody here seems to think that a "healthy" correction is due. And I bet that $27 sounds expensive to most of you who have a base price of say $5. You guys need to cut off that linear thinking. Everything right now is pointing at bitcoin becoming widely adopted on the internet and when that happens, $27 for a bitcoin is NOTHING. Real bitcoin adoption is not going to adhere to some silly indicator saying that we're overbought. I'm fully convinced that this is the last stop for everybody who wanted to make a quick buck to get out.
+1 What I would like them to do to estimate future Bitcoin price, The safe 1% (no explanation) MarketASize(yearly) divided by 21m divided by 100 + MarketBSize(yearly) divided by 21m divided by 100 + MarketCSize(yearly) divided by 21m divided by 100 (we all know 21m is not real availability, 15m is more accurate) For example drugTrade 2003 : 350b$ / 21 000 000 / 100 = 166$ per btc A UN report said "the global drug trade generated an estimated US$321.6 billion in 2003." |
|
|
|
|
jl2012
Legendary
Offline
Activity: 1792
Merit: 1092
|
|
February 17, 2013, 03:40:20 PM |
|
All you people have been staring at the charts way too much the last couple of years. Everybody here seems to think that a "healthy" correction is due. And I bet that $27 sounds expensive to most of you who have a base price of say $5. You guys need to cut off that linear thinking. Everything right now is pointing at bitcoin becoming widely adopted on the internet and when that happens, $27 for a bitcoin is NOTHING. Real bitcoin adoption is not going to adhere to some silly indicator saying that we're overbought. I'm fully convinced that this is the last stop for everybody who wanted to make a quick buck to get out.
+1 What I would like them to do to estimate future Bitcoin price, The safe 1% (no explanation) MarketASize(yearly) divided by 21m divided by 100 + MarketBSize(yearly) divided by 21m divided by 100 + MarketCSize(yearly) divided by 21m divided by 100 (we all know 21m is not real availability, 15m is more accurate) For example drugTrade 2003 : 350b$ / 21 000 000 / 100 = 166$ per btc A UN report said "the global drug trade generated an estimated US$321.6 billion in 2003." There is some problem in your assumption: why yearly, not daily or monthly? There is no magic in the Earth's orbital period |
Donation address: 374iXxS4BuqFHsEwwxUuH3nvJ69Y7Hqur3 (Bitcoin ONLY)
LRDGENPLYrcTRssGoZrsCT1hngaH3BVkM4 (LTC)
PGP: D3CC 1772 8600 5BB8 FF67 3294 C524 2A1A B393 6517
|
|
|
TraderTimm
Legendary
Offline
Activity: 2408
Merit: 1121
|
|
February 17, 2013, 04:03:18 PM |
|
The problem with most indicators is they're usually normalized price fluctuations - and therefore, complete crap.
Look at the MACD, and the rest of it. Hey, it goes up when price goes up, and goes down when price goes down. Seems like trying to trade off an echo, eh?
Ridiculous.
the MACD tracks moving averages. the fact that these averages have peaked recently, and that the shorter-term moving average is now BELOW the longer term moving average are both really important pieces of information about the rate of change in price compared to its historical rate of change. right now, we're underperforming the growth that we've seen the the past month. how isn't this important? seriously, just because you're a bull and i'm showing you bear tracks on the charts doesn't mean that charts are worthless... sometimes charts give false signals, you know. you should probably argue for that instead. I've said over and over if price violates my trendlines then I switch my tack. But lets move past the "screw you bull/bear" part of the conversation. I know what moving averages are. They lag price. I also know what MACD is, and being composed of lagging inputs, also lags price. They also normalize price action and "smooth" it, to make things a bit more comprehensible to the trader. This still doesn't remove the fact that they are - LAGGING indicators that do little else but mimic price movement. This, among other reasons, is why they are completely decorative and shouldn't be used to prognosticate about anything. |
fortitudinem multis - catenum regit omnia
|
|
|
arepo
Sr. Member
Offline
Activity: 448
Merit: 250
this statement is false
|
|
February 17, 2013, 04:10:38 PM |
|
And just because I made my account here at that time doesn't mean I've not been around longer..
I'm annoyed with your flood of posts indicating that you've sold off and asking the rest of us here to follow the same old boring price pattern bitcoin has always been making.
Anyway, let's give it some time and see what happens..
edit: typo
i'm not saying anything about how long you've 'been around'. there is inherent risk in purchasing or even holding an asset that has made 500% gains in under a year. you seem adamant in ignoring this fact. the incentive to take profit grows with the price. also, i'm annoyed that you assume i'm just some troll who's sold off and is trying to herd some lemmings. if that were the case i'd have a subscription service so that i could literally control a bloc of speculators. i post my analysis publicly for everyone's benefit. i called the knife and i hope at least one other person also profited off of it. and i'm seeing what's happening right now. i'm not trying to be standoffish here, i'm just responding to the dismissive attitude i've been faced with since i started seeing divergences. like i said, if nobody wants a bearish perspective ever, fine. i'll stop wasting my time. i post publicly to try to help newer investors hear something other than moon-trajectories, so maybe they'd be able to respond properly to the correction that i've been forecasting that is happening as we speak. |
this sentence has fifteen words, seventy-four letters, four commas, one hyphen, and a period.
18N9md2G1oA89kdBuiyJFrtJShuL5iDWDz
|
|
|
|
|
|
n8rwJeTt8TrrLKPa55eU
|
|
February 17, 2013, 04:19:51 PM |
|
The problem with most indicators is they're usually normalized price fluctuations - and therefore, complete crap.
Look at the MACD, and the rest of it. Hey, it goes up when price goes up, and goes down when price goes down. Seems like trying to trade off an echo, eh?
Ridiculous.
This is exactly right. Coincident indicators, particularly in small, volatile, illiquid markets are pretty much useless. In mature slow-moving markets, one can sometimes build useful models or discover leading indicators and correlations that might indicate future price movements. But in Bitcoin, no useful leading indicator, technical or otherwise, has been discovered that I'm aware of. This is a tiny immature market where price movements will be driven for the foreseeable future by totally unpredictable newsflow. You could have MACD or RSI overbought to the max...and then a 10x rise in price when some island country in the South Pacific announces they'll start using BTC as their national currency. BTC could drop by 75% tomorrow, that's not impossible in a fickle small cap market. But personally, I only intend to sell if and when the newsflow indicates that Bitcoin has hit a wall of insurmountable problems. I don't think that charts patterns are an optimal guidance mechanism at this stage of Bitcoin's adoption curve. |
|
|
|
|
byronbb
Legendary
Offline
Activity: 1414
Merit: 1000
HODL OR DIE
|
|
February 17, 2013, 04:23:19 PM |
|
All you people have been staring at the charts way too much the last couple of years. Everybody here seems to think that a "healthy" correction is due. And I bet that $27 sounds expensive to most of you who have a base price of say $5. You guys need to cut off that linear thinking. Everything right now is pointing at bitcoin becoming widely adopted on the internet and when that happens, $27 for a bitcoin is NOTHING. Real bitcoin adoption is not going to adhere to some silly indicator saying that we're overbought. I'm fully convinced that this is the last stop for everybody who wanted to make a quick buck to get out.
Agree. Charts rely on a past that is relevant to the present. I have sincere doubts the price mechanism of bitcoin 6 months ago is the same as it is today. I think the fundamentals changed with the Avalon release. |
|
|
|
arepo
Sr. Member
Offline
Activity: 448
Merit: 250
this statement is false
|
|
February 17, 2013, 04:25:42 PM |
|
I've said over and over if price violates my trendlines then I switch my tack. But lets move past the "screw you bull/bear" part of the conversation.
I know what moving averages are. They lag price. I also know what MACD is, and being composed of lagging inputs, also lags price. They also normalize price action and "smooth" it, to make things a bit more comprehensible to the trader.
This still doesn't remove the fact that they are - LAGGING indicators that do little else but mimic price movement. This, among other reasons, is why they are completely decorative and shouldn't be used to prognosticate about anything.
trendlines are subjective and are not superior to charting but should be taken on equal footing for a more complete picture. by your definition, all indicators are lagging indicators. the MACD goes 'up and down' as an echo to price but there's more to it. sometimes the price makes new highs but the MACD fails to. other times, the opposite happens. the crossovers of the slower and faster moving averages also represent information about the rate of change in price compared to its historical rate of change. these are all very important observations. indicators do much, much more than mimic price movement. have you checked out chart school? i don't mean to be condescending, but you don't seem to know much about the MACD. |
this sentence has fifteen words, seventy-four letters, four commas, one hyphen, and a period.
18N9md2G1oA89kdBuiyJFrtJShuL5iDWDz
|
|
|
|


