FXOpen Trader (OP)
Jr. Member

 Offline Offline
Activity: 741
Merit: 5

|
 |
May 02, 2022, 07:04:42 AM |
|
GBP/USD Struggle Continues, GBP/JPY Eyes More Gains GBP/USD started another decline from well above the 1.2900 level. GBP/JPY is rising and might gain pace above the 164.20 resistance zone.Important Takeaways for GBP/USD and GBP/JPY GBP/USD started another decline from well above the 1.2900 level. GBP/JPY is rising and might gain pace above the 164.20 resistance zone.Important Takeaways for GBP/USD and GBP/JPY- The British Pound started a fresh decline after it failed near 1.2950 against the US Dollar.
- Recently, there was a break above a key bearish trend line with resistance near 1.2500 on the hourly chart of GBP/USD.
- GBP/JPY started a fresh increase after it formed a base above the 159.50 level.
- There is a major bullish trend line forming with support near 163.25 on the hourly chart.
GBP/USD Technical AnalysisThis past week, the British Pound started a major decline from the 1.3090 zone against the US Dollar. The GBP/USD pair broke the 1.3000 support zone to enter a bearish zone. There was a clear move below the 1.2900 support and the 50 hourly simple moving average. It even traded below the 1.2750 and 1.2620 support levels. Finally, there was a move below the 1.2450 level and the pair traded as low as 1.2411 on FXOpen. GBP/USD Hourly Chart It is currently attempting an upside correction above 1.2500. There was a move above the 23.6% Fib retracement level of the key decline from the 1.3090 swing high to 1.2411 low. There was also a break above a key bearish trend line with resistance near 1.2500 on the hourly chart of GBP/USD. However, the pair is facing a major resistance near the 1.3600 and 1.3620 levels. The next major hurdle is near the 1.2750 level. The 50% Fib retracement level of the key decline from the 1.3090 swing high to 1.2411 low is also near the 1.2750 level. If there is no upside break above 1.2620, the pair could start a fresh decline. An immediate support is near the 1.2525 level and the 50 hourly simple moving average. The next major support is near the 1.2500 level. If there is a break below the 1.2500 support, the pair could test the 1.2420 support. Read Full on FXOpen Company Blog...
|
FXOpen - True Regulated ECN Broker
|
|
|
|
|
|
|
|
|
|
Even in the event that an attacker gains more than 50% of the network's
computational power, only transactions sent by the attacker could be
reversed or double-spent. The network would not be destroyed.
|
|
|
Advertised sites are not endorsed by the Bitcoin Forum. They may be unsafe, untrustworthy, or illegal in your jurisdiction.
|
|
|
FXOpen Trader (OP)
Jr. Member
Offline
Activity: 741
Merit: 5
|
|
May 06, 2022, 05:08:08 AM |
|
ETHUSD and LTCUSD Technical Analysis 05th MAY, 2022 ETHUSD: Bullish Engulfing Pattern above $2,750 ETHUSD: Bullish Engulfing Pattern above $2,750Ethereum was moving in a bearish phase last week and touched a low of 2,725 on May 1st, after which it entered into a consolidation channel above the $2,750 handle. This week, ETHUSD started moving in a bullish channel, and managed to cross the $2,900 handle in the European trading session today. We can clearly see a bullish engulfing pattern above $2,750 which signifies the end of a bearish trend and the start of a bullish trend. We can see that the price of Ethereum has retracted from its highs due to some profit taking, but the bullish channel continues, and we are aiming for the upsides of $3,100 and $3,300 this week. ETH is now trading just below its pivot level of 2,936 and moving in a mild bullish momentum. The price of ETHUSD is now facing its classic resistance level of 2,944, Fibonacci resistance level of 2,960, and is now aiming towards the $3,000 handle in the US trading session. Most of the moving averages are giving a BUY signal. ETH is now trading below both its 100 hourly and 200 hourly simple MAs. - Ethereum is in a mildly bullish channel
- Short-term trend reversal seen above $2,750
- All the major technical indicators are giving a NEUTRAL to BUY signal
- The average true range is indicating LESSER market volatility
Ether: Bullish Channel Above $2900 Confirmed ETHUSD has consolidated its gains above $2,900 in the European trading session, and we can clearly see that the bullish channel is back. We are now aiming for the upsides of $3,000 to $3,100 in todays US trading session. The retracement from $2,721 was very strong which suggests that there is more room for the upsides in Ethereum this month, and a level of $3,500 is the next target. We can see the MA crossover pattern above the level of 2,850 which means that in the immediate short term we will see the continuation of the bullish channel. ETH has gained 2.86% with a price change of 81.25$ in the past 24hrs, and has a trading volume of 17.890 billion USD. We can see an increase of 36% in the trading volume as compared to yesterday which means that new buyers are entering the markets and waiting for further correction in the levels of Ethereum. The Week AheadEther is printing above $2,980 today, and we can see levels of $3,000 to $3,200 this week. The medium-to-long term outlook for Ether remains bullish with targets of above 3,500 in May. With the US Federal Reserve increasing its benchmark interest rate by half a percentage point, the price of Ethereum continues rising along with other top cryptocurrencies. Ether has already broken its major resistance level of $2,800 and is now facing the next resistance level of $3,000. Technical Indicators:The commodity channel index (14-day): at 135.24 indicating a BUY The moving averages convergence divergence (14-day): at 14.80 indicating a BUY The ultimate oscillator: at 61.44 indicating a BUY The rate of price change: at 3.39 indicating a BUY Read Full on FXOpen Company Blog...
|
FXOpen - True Regulated ECN Broker
|
|
|
FXOpen Trader (OP)
Jr. Member
Offline
Activity: 741
Merit: 5
|
|
May 10, 2022, 03:47:30 PM |
|
BTCUSD and XRPUSD Technical Analysis 10th MAY 2022 BTCUSD: Rounding Bottom Pattern Above $29,700 BTCUSD: Rounding Bottom Pattern Above $29,700Bitcoin was not able to sustain its bullish momentum last week, and after touching a high of $40,000 on May 4th, started to decline heavily against the US dollar. The short-selling continued pushing the price of BTC below the $30,000 handle, after which we can observe some consolidation. We can see a pullback in the market at levels above $30,000, which is expected to continue towards $35,000. We can clearly see a rounding bottom pattern above the $29,700 handle which is a bullish reversal pattern signifying the end of a downtrend and a shift towards an uptrend. The Stoch and Williams percent range are indicating an overbought level which means that in the immediate short term, a decline in the prices is expected. The relative strength index is at 44 indicating a WEAK demand for bitcoin at the current market level. Bitcoin is now moving below its 100 hourly simple and 200 hourly exponential MAs. Some of the major technical indicators are giving a BUYsSignal, which means that in the immediate short term, we are expecting targets of $32,000 and $34,000. The average true range is indicating LESSER market volatility with a mildly bullish momentum. - Bitcoin: bullish reversal seen above $29,700
- The StochRSI is indicating an OVERBOUGHT level
- The price is now trading just below its pivot level of $31,810
- Some of the moving averages are giving a BUY market signal
Bitcoin: Bullish Reversal Seen Above $29,700 Bitcoin has moved out of the falling trend seen last week and now continues to consolidate its gains above the $30,000 handle in the European trading session. The bounce that we have seen above $30,000 is expected to continue this week, and we are now looking at targets of $32,000 and $35,000 in the medium-term range. The immediate short-term outlook for bitcoin is mildly bullish; the medium-term outlook has turned neutral; the long-term outlook remains neutral under present market conditions. We are now looking at possible reversal and short selling at 32,946 and 34,350 as indicated by the MA50 and MA100 crossover patterns. This is further validated by an overbought level seen in the Stoch and Williams percent range. The price of BTCUSD is now facing its classic resistance level of $32,009, Fibonacci resistance level of $32,240 after which the path towards $34,000 will get cleared. In the last 24hrs, BTCUSD has declined by -5.59% with a price change of 1872$, and has a 24hr trading volume of USD 81.634 billion. We can see an increase of 111% in the trading volume as compared to yesterday, which is due to the heavy selling seen across global cryptocurrency markets. The Week AheadThe price of bitcoin touched an intraday low of $29,829 in the Asian trading session, and an intraday high of $32561 in todays European trading session. The daily RSI is printing at 30 which means that the medium range demand continues to be weak. This is also an opportunity for long-term investors to enter into the markets at lower levels. The current market condition is suitable for entering into a BUY position with targets of $33,000 and $35,000 next week. The price of BTCUSD will need to remain above the important support level of $30,000 this week. The weekly outlook is projected at $33,000 with a consolidation zone of $32,500. Bitcoin Down by 50%The price of bitcoin touched an all-time high of $67,566 in November, 2021, and with the current market price of $31,570 marks a drop of 50% in its value. The ongoing global economic crisis, rise in the interest rates, the Russia-Ukraine war and its effects on the global investor sentiments are driving bitcoin to historic lows, which has led to a decline in the total market capitalization of bitcoin to $600 billion USD. Technical IndicatorsThe StochRSI (14-day): at 74.78 indicating a BUY The average directional change(14-day): at 28.58 indicating a NEUTRAL level The rate of price change: at 1.349 indicating a BUY The moving averages 20: indicating a BUY Read Full on FXOpen Company Blog...
|
FXOpen - True Regulated ECN Broker
|
|
|
FXOpen Trader (OP)
Jr. Member
Offline
Activity: 741
Merit: 5
|
|
May 11, 2022, 06:55:49 AM |
|
Cryptocurrencies Under Pressure as Bitcoins Slide Continues Bitcoin is the most important cryptocurrency, and its price fluctuations influence the entire cryptocurrency market. When the price of bitcoin advances or declines, all other coins do the same. In other words, the thousands of other coins literally depend on what bitcoin does. So far this year, bitcoin has been under pressure: it opened the year around $50,000, and now threatens to drop through the $30,000 level. Only this time around, the decline in bitcoins price is more relevant than in the past. Nowadays, bitcoin has been adopted by market players other than retail traders. For years, retail traders and believers in the cryptocurrency space have hoped that institutional investors would adopt bitcoin. They have, but with increased adoption came increased risks. For example, now that bitcoin is part of numerous portfolios, it acts like the general market does. As such, the dollars strength in 2022 is seen in the price of bitcoin too.  Head-and-Shoulders Pattern Points To $20,000 Head-and-Shoulders Pattern Points To $20,000One of the most powerful reversal patterns is called head-and-shoulders. It is formed by two shoulders and one head, resembling the human body, and it has a measured move, calculated by measuring the distance from the highest point in the pattern to the neckline, and projecting it to the downside. This is the minimum distance that the market needs to travel in order to confirm the reversal. In bitcoins case, the measured move points to a decline towards $20,000. Such a move alone is enough to put further pressure on bitcoin hodlers, but also on the financial system. Last week, MicroStrategy, a US-based publicly listed company that had invested heavily in bitcoin, revealed that it would receive a margin call should the price of bitcoin drop to $21,000. To buy its bitcoins, the company borrowed money, and now it needs to serve $2.5 billion in debt with $500 million in revenues. As such, a decline in the price of bitcoin is not a risk only for retail hodlers, but also for other financial market participants. To sum up, the price of bitcoin remains bearish while trading below the head-and-shoulders neckline. With every day that passes, the pressure mounts, and retail hodlers may be forced to liquidate just as big players are too. It would also be interesting to see what other big investors, such as Tesla, would do with their bitcoin holdings when the price declines below their buying price. A move below $30,000 would put pressure on Tesla, and when and if big investors flee, it might be the end of the cryptocurrency market as we know it. FXOpen Blog
|
FXOpen - True Regulated ECN Broker
|
|
|
FXOpen Trader (OP)
Jr. Member
Offline
Activity: 741
Merit: 5
|
|
May 13, 2022, 02:23:35 AM |
|
ETHUSD and LTCUSD Technical Analysis 12th MAY, 2022 ETHUSD: Double Top Pattern Below $2,450 ETHUSD: Double Top Pattern Below $2,450Ethereum was unable to sustain its bullish momentum last week, and after touching a high of 2,960 on May 4, started to decline heavily against the US dollar. We can see the continuation of the bearish momentum this week, and the decline continues pulling down the prices of Ethereum below the 1,900 handle in the European trading session today. The global investor sentiment is very weak, which is the cause of the massive slide in the cryptocurrency markets, including Ethereum. After touching an intraday low of $1,780, we can see some pullback action and a move towards the consolidation channel above the $1,800 handle. We can clearly see a double top pattern below the $2,450 handle, which is a bearish pattern; it signifies the end of a bullish phase and the start of a bearish phase in the markets. ETH is now trading just below its pivot level of 1,908 and moving into a consolidation channel. The price of ETHUSD is now testing its classic support level of 1,820 and Fibonacci support level of 1,884, after which the path towards 1,800 will get cleared. The relative strength index is at 35, indicating a WEAK demand for Ethereum and the continuation of the bearish trend. The StochRSI is indicating a neutral level which means that the prices are due to remain into a consolidation phase in the short term. All of the technical indicators are giving a STRONG SELL market signal. All of the moving averages are giving a STRONG SELL signal, and we are now looking at the levels of $1,850 to $1,800 in the short-term range. ETH is now trading Below both the 100 hourly and exponential MAs. - Ether: a bearish reversal is seen below the $2,450 mark
- The short-term range appears to be mildly BEARISH
- The daily RSI is below 50 at 24, indicating an OVERSOLD market
- The average true range is indicating HIGH market volatility
Ether: Bearish Reversal Seen Below $2,450 ETHUSD is now moving in a mildly bearish channel with the prices trading below the $2,000 handle in the European trading session today. We can see an MA5 crossover pattern located at 1,884, which means that a potential bullish reversal is possible after touching these levels. ETHUSD is now facing its immediate support level of $1,861 and $1,841 after which we will see a linear progression towards the level of $1,800. The key resistance levels to watch are $1,931 and $1,976, and the prices of ETHUSD need to cross these levels for a potential bullish reversal. ETH has declined by 19.67% with a price change of 468.56$ in the past 24hrs and has a trading volume of 54.488 Billion USD. We can see an Increase of 53.79% in the total trading volume in the last 24 hrs. which is due to the heavy selling by long-term investors. The Week AheadThe global economic factors and the increase in the interest rate announced by the Fed have made the US dollar stronger, which has led to a massive decline in the prices of Ethereum. The delay in the implementation of the ETH 2.0 upgrade is also keeping the investors away from the markets. The immediate short-term outlook for Ether has turned mildly BEARISH; the medium-term outlook has turned neutral; the long-term outlook for Ether is NEUTRAL in present market conditions. This week, Ether is expected to move in a range between $1,800 and $2,000, and next week, Ether is expected to enter into a consolidation phase above the level of $2,000. Technical Indicators:The Stoch (9,6): at 22.35 indicating a SELL The moving averages convergence divergence (12,26): at -104.87 indicating a SELL The ultimate oscillator: at 40.75 indicating a SELL The rate of price change: at -9.43 indicating a SELL Read Full on FXOpen Company Blog...
|
FXOpen - True Regulated ECN Broker
|
|
|
FXOpen Trader (OP)
Jr. Member
Offline
Activity: 741
Merit: 5
|
|
May 13, 2022, 07:32:07 AM |
|
Gold Price Faces Resistance While Oil Price Aims Higher Gold price started a fresh decline from the $1,920 resistance. Crude oil price is rising and might gain pace above the $107 resistance.Important Takeaways for Gold and Oil Gold price started a fresh decline from the $1,920 resistance. Crude oil price is rising and might gain pace above the $107 resistance.Important Takeaways for Gold and Oil- Gold price started a fresh decline from well above the $1,900 zone against the US Dollar.
- There is a key bearish trend line forming with resistance near $1,840 on the hourly chart of gold.
- Crude oil price gained pace after it broke the $102 and $104 resistance levels.
- There was a break above a major bearish trend line with resistance near $104.05 on the hourly chart of XTI/USD.
Gold Price Technical Analysis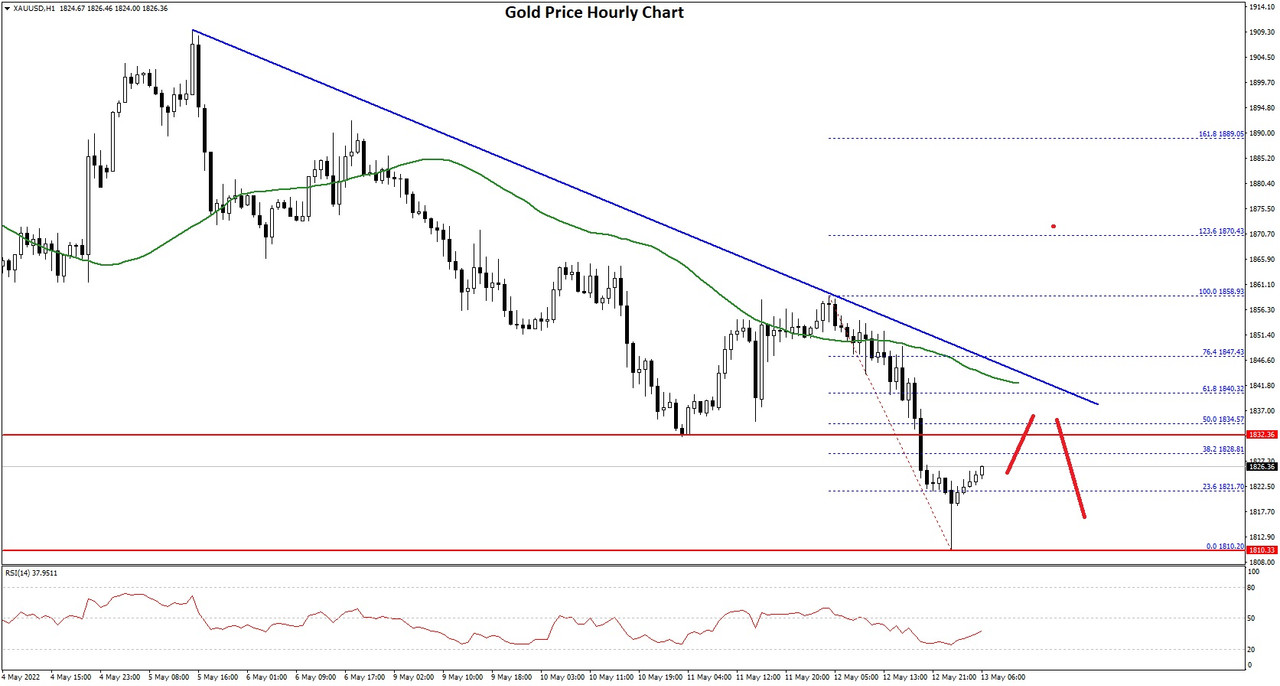 Gold price struggled to gain pace for a move above the $1,920 resistance against the US Dollar. The price started a fresh decline below the $1,900 support zone. There was a clear move below the $1,880 level and the 50 hourly simple moving average. The price even declined below the $1,850 support to move into a bearish zone. It traded as low as $1,810 on FXOpen and now correcting losses. Gold Price Hourly ChartThere was a move above the $1,820 resistance. The price broke the 23.6% Fib retracement level of the downward move from the $1,858 swing high to $1,810 low. On the upside, the price is facing resistance near the $1,835 level. It is near the 50% Fib retracement level of the downward move from the $1,858 swing high to $1,810 low. Besides, there is a key bearish trend line forming with resistance near $1,840 on the hourly chart of gold. The main resistance is now forming near the $1,840 level. A close above the $1,840 level could open the doors for a steady increase towards $1,880. The next major resistance sits near the $1,900 level. On the downside, an initial support is near the $1,820 level. The next major support is near the $1,810 level, below which there is a risk of a larger decline and the price might even struggle to stay above $1,800. Read Full on FXOpen Company Blog...
|
FXOpen - True Regulated ECN Broker
|
|
|
FXOpen Trader (OP)
Jr. Member
Offline
Activity: 741
Merit: 5
|
|
May 17, 2022, 03:50:02 PM |
|
BTCUSD and XRPUSD Technical Analysis 17th MAY 2022 BTCUSD: Bullish Harami Pattern Above $28,600 BTCUSD: Bullish Harami Pattern Above $28,600Bitcoin was not able to sustain its bullish momentum last week, and after touching a high of $31,437 on 16th May, started to decline heavily against the US dollar. The short selling continued pushing down the price of BTC below the $30,000 handle, touching a low of $29,169 after which we can see some consolidation. We can see a pullback in the markets at a level above $30,000, which is expected to continue towards $33,000. We can clearly see a bullish harami pattern above the $28,600 handle which is a bullish reversal pattern because it signifies the end of a downtrend and a shift towards an uptrend. Both the Stoch and StochRSI are indicating an overbought level which means that in the immediate short term, a decline in the prices is expected. The relative strength index is at 57 indicating a STRONG demand for bitcoin at the current market level. Bitcoin is now moving above its 100 hourly simple and 200 hourly simple MAs. Most of the major technical indicators are giving a STRONG BUY signal, which means that in the immediate short term, we are expecting targets of 32,000 and 33,500. The average true range is indicating LESSER market volatility with a mildly bullish momentum. - Bitcoin: bullish reversal seen above $28,600
- The Williams percent range is indicating an OVERBOUGHT level
- The price is now trading just above its pivot level of $30,443
- All of the moving averages are giving a STRONG BUY market signal
Bitcoin: Bullish Reversal Seen Above $28,600 Bitcoin continues to move into a consolidation channel above the $30,000 handle in the European trading session today. The bounce that we have seen above the $30,000 handle is expected to continue this week, and we are now looking at the targets of $32,000 and $33,500 in the medium-term range. The immediate short-term outlook for bitcoin is mildly bullish; the medium-term outlook has turned neutral; and the long-term outlook remains neutral under present market conditions. Bitcoin continues to consolidate above its important support level of $30,000, and with increasing demand zone formation the immediate target is $31,500 The price of BTCUSD is now facing its classic resistance level of 30,533 and Fibonacci resistance level of 30,653, after which the path towards 32,000 will get cleared. In the last 24hrs, BTCUSD has increased by 3.17% by 939$, and has a 24hr trading volume of USD 31.059 billion. We can see an increase of 1.58% in the trading volume as compared to yesterday, which appears to be normal. The Week AheadThe price of bitcoin is moving in a mildly bullish momentum, and the immediate targets are $31,000 and $31,500 The daily RSI is printing at 35 which means that the medium-range demand continues to be weak. The current market condition is suitable for entering into a BUY position with targets of $32,000 and $33,500 next week. The price of BTCUSD will need to remain above the important support level of $30,000 this week. The weekly outlook is projected at $32,000 with a consolidation zone of $31,500. Technical Indicators:The moving averages convergence divergence (12,26): at 121.40 indicating a BUY THe average directional change (14-day): at 43.83 indicating a BUY The rate of price change: at 3.529 indicating a BUY The ultimate oscillator: at 65.16 indicating a BUY Read Full on FXOpen Company Blog...
|
FXOpen - True Regulated ECN Broker
|
|
|
FXOpen Trader (OP)
Jr. Member
Offline
Activity: 741
Merit: 5
|
|
May 19, 2022, 06:42:24 PM |
|
ETHUSD and LTCUSD Technical Analysis 19th MAY, 2022 ETHUSD: Double Top Pattern Below $2,121 ETHUSD: Double Top Pattern Below $2,121Ethereum was unable to sustain its bullish momentum last week, and after touching a high of 2,151 on 16th May started to decline heavily against the US dollar. We can see the continuation of the bearish momentum this week, and the decline continues pulling down the prices of Ethereum below the 2,000 handle in the European trading session today. With the increase in the market liquidity many of the medium-term investors are selling their stakes amid the ongoing proposed Ethereum 2.0 network upgrade. The prices touched an intraday low of $1,902 in the Asian trading session, and an intraday high of $1,971 in the European trading session today. We can clearly see a double-top pattern below $2,121 which is a bearish pattern and signifies the end of a bullish phase and the start of a bearish phase in the markets. ETH is now trading just below its pivot level of 1,954 and moving into a consolidation channel. The price of ETHUSD is now testing its classic support level of 1,917, and Fibonacci support level of 1,945 after which the path towards 1,800 will get cleared. The relative strength index is at 43 indicating a WEAK demand for Ethereum and the continuation of the bearish trend. The StochRSI is indicating an overbought level which means that the price is due to decline further in the short term. Most of the technical indicators are giving a STRONG SELL market signal. All of the moving averages are giving a STRONG SELL signal, and we are now looking at the levels of $1,900 to $1,800 in the short-term range. ETH is now trading below its 100 hourly and exponential MAs. - Ether: a bearish reversal seen below the mark of $2,121
- Short-term range appears to be mildly BEARISH
- The daily RSI is below 50 at 32 indicating a bearish market
- The average true range is indicating LESS market volatility
Ether: Bearish Reversal Seen Below $2,121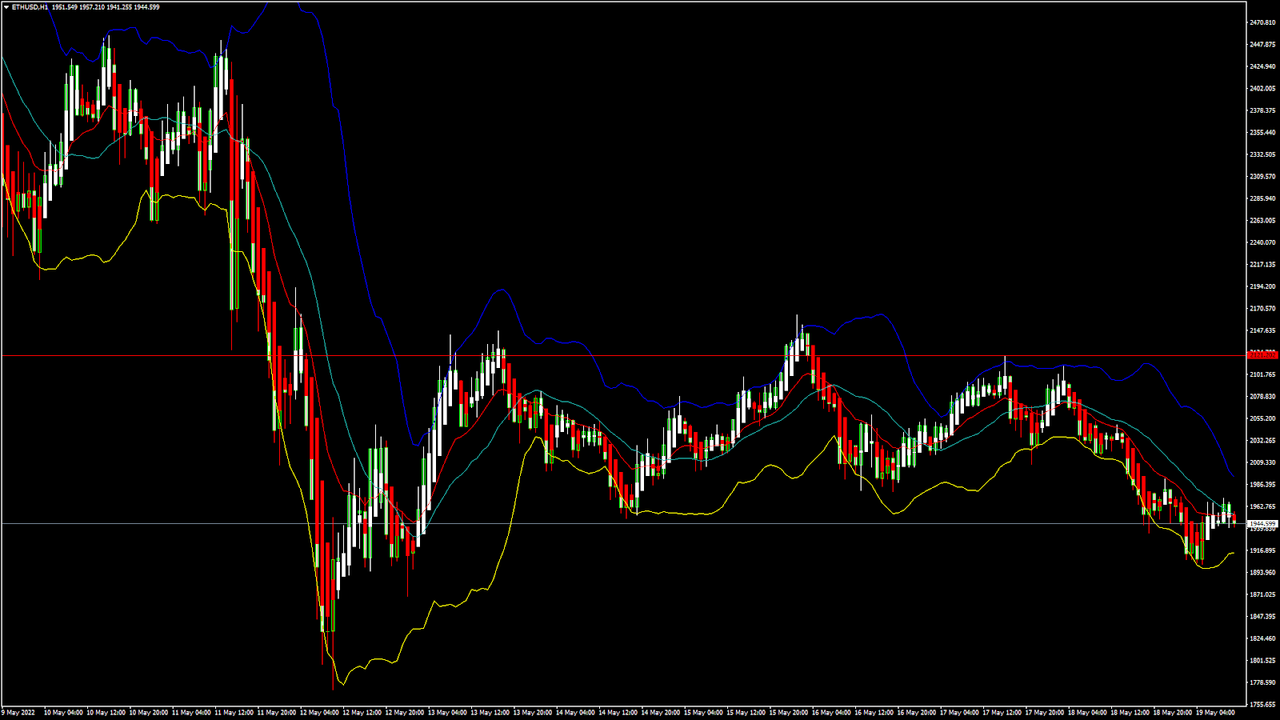 ETHUSD is now moving in a mildly bearish channel with the prices trading below the $2,000 handle in the European trading session today. We can see an SMA10 crossover pattern located at 1,940, which means that a potential bullish reversal is possible after touching these levels. We have detected a bearish harami crossover pattern in the M15 chart which further validates the ongoing trends in the markets. The key resistance levels to watch are $1,966 and $1,990, and the prices of ETHUSD need to cross these levels for a potential bullish reversal. ETH has declined by 4.41% with a price change of 89.48$ in the past 24hrs, and has a trading volume of 18.320 billion USD. We can see an Increase of 5.27% in the total trading volume in the last 24 hrs which appears to be normal. The Week AheadThe ongoing correction in the prices of Ethereum is also because of the pending ETH 2.0 network upgrade which is delayed from its original schedule. Many of the Ethereum investors are willing to wait till the new upgrade is launched before investing their funds. The immediate short-term outlook for Ether has turned mildly BEARISH; the medium-term outlook has turned neutral; and the long-term outlook for Ether is NEUTRAL in present market conditions. This week, Ether is expected to move in a range between $1,800 and $2,000, and next week, it is expected to enter into a consolidation phase above the level of $2,000. Technical Indicators:The Williams percent range: at -55.74 indicating a SELL The moving averages convergence divergence (12,26): at -20.99 indicating a SELL The ultimate oscillator: at 47.46 indicating a SELL The rate of price change: at -1.364 indicating a SELL Read Full on FXOpen Company Blog...
|
FXOpen - True Regulated ECN Broker
|
|
|
FXOpen Trader (OP)
Jr. Member
Offline
Activity: 741
Merit: 5
|
|
May 24, 2022, 06:32:34 PM |
|
BTCUSD and XRPUSD Technical Analysis 24th MAY 2022 BTCUSD: Triple-Top Pattern Below $30,775 BTCUSD: Triple-Top Pattern Below $30,775Bitcoin was not able to sustain its bullish momentum this week, and after touching a high of 30,652 on 23rd May, started to decline heavily against the US dollar; it touched a low of 28,860 today in the Asian trading session. The drop that we saw continues, and now the prices have entered a consolidation channel above the $29,000 handle in the European trading session. If we see some buying at these levels, the prices will continue to remain above them in the short-term range. But in the medium-term range, we are expecting a further drop due to weak global demand cues. We can clearly see a triple-top pattern below the $30б775 handle which is a bearish reversal pattern because it signifies the end of an uptrend and a shift towards a downtrend. Both the STOCH and STOCHRSI are indicating overbought levels which means that in the immediate short term, a decline in the prices is expected. The relative strength index is at 40 indicating a WEAK demand for bitcoin at the current market levels. Bitcoin is now moving below its 100 and 200 hourly simple MAs. Most of the major technical indicators are giving a SELL signal, which means that in the immediate short term, we are expecting targets of 28,000 and 27,500. The average true range is indicating LESS market volatility with a mild bearish momentum. - Bitcoin: bearish reversal seen below $30,775
- The Williams percent range is indicating an OVERBOUGHT level
- The price is now trading just above its pivot level of $29,229
- All of the MAs are giving a STRONG SELL market signal
Bitcoin: Bearish Reversal Seen Below $30,775 Bitcoin continues to move in a consolidation channel above the $29,000 handle in the European trading session today. We can see the formation of a demand zone above it, but the global risk scenarios may enable further decline in the prices this week. The immediate short-term outlook for bitcoin is mildly bearish; the medium-term outlook has turned neutral; and the long-term outlook remains neutral under present market conditions. Bitcoin continues to consolidate above its important support level of $29,000, and with increasing demand zone formation the immediate target is $30,500. The price of BTCUSD is now facing its classic support level of 28,819 and Fibonacci support level of 29,135, after which the path towards 28,000 will get cleared. In the last 24hrs, BTCUSD has decreased by 3.97% with a price change of 1,210$, and has a 24hr trading volume of USD 31.034 billion. We can see an Increase of 1.58% in the trading volume as compared to yesterday, which appears to be normal. The Week AheadThe prices of bitcoin are moving in a mildly bearish momentum, and the immediate targets are $28,000 and $27,500. The daily RSI is printing at 37 which means that the medium range demand continues to be weak. We are now expecting a range-bound movement between $28,000 and $32,000 next week. The price of BTCUSD will need to remain above the important support level of $29,000 this week. The weekly outlook is projected at $31,500 with a consolidation zone of $30,000. Technical Indicators:The moving averages convergence divergence (12,26): at -161 indicating a SELL The average directional change (14-day): at 34.90 indicating a NEUTRAL level The rate of price change: at -0.006 indicating a SELL The commodity channel index (14-day): at 42.96 indicating a NEUTRAL level Read Full on FXOpen Company Blog...
|
FXOpen - True Regulated ECN Broker
|
|
|
FXOpen Trader (OP)
Jr. Member
Offline
Activity: 741
Merit: 5
|
|
May 26, 2022, 05:44:30 PM |
|
ETHUSD and LTCUSD Technical Analysis 26th MAY, 2022 ETHUSD: Bearish Engulfing Pattern Below $2,087 ETHUSD: Bearish Engulfing Pattern Below $2,087Ethereum was unable to sustain its bullish momentum last week, and after touching a high of 2,084 on 23rd May started to decline heavily against the US dollar. We can see a strong bearish momentum this week and this is putting downward pressure on the prices of Ethereum below the 1,850 handle in the European trading session today. We can see the formation of a major bearish trend line today on the hourly chart, and the pair is poised to decline further given the weak investor sentiments. The prices touched an intraday low of $1,817 in the Asian trading session and an intraday high of $1,970 in the European trading session today. We can clearly see a bearish engulfing pattern below the $2,087 handle which is a bearish pattern and signifies the end of a bullish phase and the start of a bearish phase in the markets. ETH is now trading just below its pivot level of 1,860 and moving into a strong bearish channel. The price of ETHUSD is now testing its classic support level of 1,686 and Fibonacci support level of 1,819 after which the path towards 1,700 will get cleared. The relative strength index is at 21 indicating an OVERSOLD market, and the possibility of a pullback action. The StochRSI and Williams percent range are indicating an oversold level which means that the prices are due to correct upwards in the short-term range. ALL of the technical indicators are giving a STRONG SELL market signal. All of the MAs are giving a STRONG SELL signal, and we are now looking at the levels of $1,700 to $1,650 in the short-term range. ETH is now trading below both the 100 hourly and exponential MAs. - A bearish reversal seen below the $2,087 mark
- The short-term range appears to be strongly BEARISH
- The daily RSI is below 50 at 21 indicating a bearish market
- The average true range is indicating HIGH market volatility
Ether: Bearish Continuation Seen Below $2,087 ETHUSD is now moving into a strong bearish channel with the prices trading below the $1,850 handle in the European trading session today. We can see that the commodity channel index is at an oversold level now, which means that a potential bullish reversal is possible anytime in the markets. The price of Ethereum may continue to decline further against the US dollar due to the global risk scenario and the flight towards the safe haven assets like the US Dollar and GOLD. The key resistance levels to watch are $1,941 and $2,260, and the price of ETHUSD needs to cross these levels for a potential Bullish reversal. ETH has declined by 6.91% with a price change of 136$ in the past 24hrs, and has a trading volume of 15.808 Billion USD. We can see an Increase of 13.21% in the total trading volume in the last 24 hrs which appears to be normal. The Week AheadGlobal investors are now looking to liquidate their holdings in the cryptocurrencies, which is the main reason for the continuous fall in the price of Ethereum. The ETH 2.0 planned upgrade has also not been activated, leading to concerns about the future of Ethereum and its market value. The immediate short-term outlook for Ether has turned strongly BEARISH; the medium-term outlook has turned BEARISH; and the long-term outlook for Ether is NEUTRAL in present market conditions. This week, Ether is expected to move in a range between $1,600 and $1,800, and next week, it is expected to enter into a consolidation phase above the $1,800 level. Technical Indicators:The Williams percent range: at -96.16 indicating an OVERSOLD level The moving averages convergence divergence (12,26): at -25.11 indicating a SELL The ultimate oscillator: at 33.56 indicating a SELL The rate of price change: at -6.37 indicating a SELL Read Full on FXOpen Company Blog...
|
FXOpen - True Regulated ECN Broker
|
|
|
FXOpen Trader (OP)
Jr. Member
Offline
Activity: 741
Merit: 5
|
|
May 27, 2022, 04:59:23 AM |
|
Gold Price and Oil Price Eye More Upsides Gold price started a fresh increase from the $1,810 level. Crude oil price is rising and might gain pace above the $113.75 resistance.Important Takeaways for Gold and Oil Gold price started a fresh increase from the $1,810 level. Crude oil price is rising and might gain pace above the $113.75 resistance.Important Takeaways for Gold and Oil- Gold price started a decent increase after it formed a base above $1,810 against the US Dollar.
- There is a key bullish trend line forming with support near $1,845 on the hourly chart of gold.
- Crude oil price gained pace after it broke the $108 and $110 resistance levels.
- There is a major bullish trend line forming with support near $111.10 on the hourly chart of XTI/USD.
Gold Price Technical AnalysisGold price formed a base above the $1,800 and $1,810 levels against the US Dollar. The price started a fresh increase after it broke the $1,825 resistance zone. There was a clear move above the $1,840 level and the 50 hourly simple moving average. The price even cleared the $1,850 level and traded as high as $1,869 on FXOpen. Recently, there was a downside correction below $1,850, but the bulls protected $1,840. Gold Price Hourly Chart A low is formed near $1,840 and the price is now rising. There was a move above the 50% Fib retracement level of the downward move from the $1,869 swing high to $1,840 low. On the upside, the price is facing resistance near the $1,858 level. It is near the 61.8% Fib retracement level of the downward move from the $1,869 swing high to $1,840 low. The main resistance is now forming near the $1,870 level. A close above the $1,870 level could open the doors for a steady increase towards $1,880. The next major resistance sits near the $1,900 level. On the downside, an initial support is near the $1,850 level. The next major support is near the $1,845 level. There is also a key bullish trend line forming with support near $1,845 on the hourly chart of gold, below which there is a risk of a larger decline. Read Full on FXOpen Company Blog...
|
FXOpen - True Regulated ECN Broker
|
|
|
FXOpen Trader (OP)
Jr. Member
Offline
Activity: 741
Merit: 5
|
|
May 31, 2022, 11:58:12 PM |
|
BTCUSD and XRPUSD Technical Analysis 31st MAY 2022 BTCUSD: Bullish Pennant Pattern Above $28,000 BTCUSD: Bullish Pennant Pattern Above $28,000Bitcoin was not able to sustain its bearish momentum this week, and after touching a low of 28,009 on 26th May, started to move upwards due to the formation of demand zones above these levels. Bitcoin entered into a consolidation channel above the $28,000 handle and then corrected upwards touching a high of 32,192 in the European trading session today. The global investor sentiment has improved from last week, leading to fresh buying by the long-term investors and now we are looking at levels of $32,500 and $35,000. We can clearly see a bullish pennant pattern above the $28,000 handle which is a bullish reversal pattern because it signifies the end of a downtrend and a shift towards an uptrend. Both the STOCH and Williams percent range are indicating an overbought level which means that in the immediate short term, a decline in the prices is expected. The relative strength index is at 68 indicating a STRONG demand for bitcoin at the current market levels. Bitcoin is now moving above its 100 hourly simple and 200 hourly simple MAs. ALL of the major technical indicators are giving a STRONG BUY signal, which means that in the immediate short term, we are expecting targets of 32,000 and 33,500. The average true range is indicating LESS market volatility with a strongly bullish momentum. - Bitcoin: bullish reversal seen above $28,000.
- The StochRSI is indicating an OVERSOLD level.
- The price is now trading just above its pivot level of $31,545.
- All of the moving averages are giving a STRONG BUY market signal.
Bitcoin: Bullish Reversal Seen Above $28,000 Bitcoin continues to move into a consolidation channel above the $31,500 handle in the European trading session today. We can see the formation of a rising trend channel above the $28,000 handle, and now we are looking at the projected levels of $33,000 and $35,000. The immediate short-term outlook for bitcoin is strongly bullish; the medium-term outlook has turned bullish; and the long-term outlook remains neutral under present market conditions. Bitcoin continues to consolidate above its important support level of $31,000 and with increasing demand zone formation the immediate target is $32,500 The price of BTCUSD is now facing its classic resistance level of 31,614 and Fibonacci resistance level of 31,653, after which the path towards 32,000 will get cleared. In the last 24hrs, BTCUSD has increased by 3.05% with a price change of $937, and has a 24hr trading volume of USD 37.468 billion. We can see an Increase of 39.80% in the trading volume as compared to yesterday, which is due to the fresh buying seen at lower levels. The Week AheadThe price of bitcoin is moving in a strongly bullish momentum, and the immediate targets are $32,000 and $33,500. The daily RSI is printing at 50 which means that the medium range demand continues to be NEUTRAL. We are now looking at a fresh rally into the markets with targets of $33,500 and $35,000 next week. The prices of BTCUSD will need to remain above the important support levels of $31,000 this week. The weekly outlook is projected at $33,500 with a consolidation zone of $32,000. Technical Indicators:The moving averages convergence divergence (12,26): at 390 indicating a BUY The average directional change (14 days): at 45.56 indicating a BUY The rate of price change: at 3.12 indicating a BUY The commodity channel index (14 days): at 45.18 indicating a NEUTRAL level Read Full on FXOpen Company Blog...
|
FXOpen - True Regulated ECN Broker
|
|
|
FXOpen Trader (OP)
Jr. Member
Offline
Activity: 741
Merit: 5
|
|
June 02, 2022, 03:26:31 PM |
|
ETHUSD AND LTCUSD Technical Analysis 02nd JUNE, 2022 ETHUSD: Bearish Engulfing Pattern Below $2015 ETHUSD: Bearish Engulfing Pattern Below $2015Ethereum was unable to sustain its bullish momentum last week and after touching a high of 2011 on 31st May started to decline heavily against the US Dollar. We can see a strong bearish momentum this week and this is putting downwards pressure on the prices of Ethereum below the 1850 handle in the European Trading session today. We can see the formation of a Major bearish trend line today on the hourly chart and the pair is poised to decline further given the weak investor sentiments. The prices touched an Intraday Low of $1794 in the Asian trading session and an Intraday High of $1843 in the European Trading session today. We can clearly see a Bearish Engulfing Pattern Below the $2015 handle which is a Bearish pattern and signifies the end of a Bullish phase and the start of a Bearish phase in the markets. ETH is now trading just above its Pivot levels of 1817 and is moving into a Strong bearish channel. The price of ETHUSD is now testing its Classic support levels of 1767 and Fibonacci support levels of 1805 after which the path towards 1700 will get cleared. Relative Strength Index is at 40 indicating a WEAK market and the continuation of the decline after the consolidation phase gets over. The STOCHRSI is indicating Oversold levels which means that the prices are due to correct upwards in the short-term range. ALL of the of the Technical indicators are giving a STRONG SELL market Signal. All of the Moving Averages are giving a STRONG SELL Signal and we are now looking at the levels of $1700 to $1600 in the short-term range. ETH is now trading Below its both the 100 Hourly and Exponential Moving Averages. - Ether Bearish Reversal seen below the $2015 mark.
- Short-term range appears to be Strongly BEARISH.
- Daily RSI is Below 50 at 38 indicating a Bearish market.
- Average True Range is indicating HIGH Market Volatility.
Ether Bearish Continuation Seen Below $2015 ETHUSD is now moving into a Strong Bearish channel with the prices trading below the $1850 handle in the European Trading session today. We can see the formation of a Major Bearish trend line in the hourly chart which suggests that further decline in the prices of Ethereum are expected. The prices of Ethereum are moving into a consolidation channel now and after the consolidation phase is over a further decline in its levels is expected. The key resistance levels to watch are $1919 and $2046 and the prices of ETHUSD need to cross these levels for a potential Bullish reversal. ETH has declined by 5.80% with a price change of 112$ in the past 24hrs and has a trading volume of 21.678 Billion USD. We can see an Increase of 22.75% in the total trading volume in last 24 hrs. which is due to the continuation of the selling pressure across the global markets. The Week AheadThe global investor sentiments are weak and they are not willing to enter into the markets now, which is the main reason for the continuous fall in the prices of the Ethereum. The delay in the implementation of the ETH 2.0 upgrade continues to affect the prices of Ethereum in the short-term range. The immediate short-term outlook for the Ether has turned as Strongly BEARISH, the medium-term outlook has turned BEARISH, and the long-term outlook for Ether is NEUTRAL in present market conditions. In this week Ether is expected to move in a range between the $1600 and $1800 and in the next week Ether is expected to enter into a Consolidation phase above the $1800 levels. Technical Indicators:Williams Percent Range: It is at -78.90 indicating a SELL. Moving Averages Convergence Divergence (12,26): It is at -16.00 indicating a SELL. Ultimate Oscillator: It is at 40.51 indicating a SELL. Rate of Price Change: It is at -4.16 indicating a SELL. Read Full on FXOpen Company Blog...
|
FXOpen - True Regulated ECN Broker
|
|
|
FXOpen Trader (OP)
Jr. Member
Offline
Activity: 741
Merit: 5
|
|
June 08, 2022, 02:03:22 AM |
|
BTCUSD and XRPUSD Technical Analysis 07th JUNE 2022 BTCUSD: Bearish Doji Star Pattern Below $31,750 BTCUSD: Bearish Doji Star Pattern Below $31,750Bitcoin was not able to sustain its bullish momentum this week and after touching a high of 31,730 on 06th June, started to decline against the US dollar. Bitcoin entered into a bearish trend channel below the $31,750 handle and continues to decline touching a low of 29,217 in the European trading session today. We can see a weak demand for bitcoin in the medium-term range, and the prices are expected to fall further towards the $25,000 level. We can clearly see a bearish doji star pattern below the $31,750 handle which is a bearish reversal pattern because it signifies the end of an uptrend and a shift towards a downtrend. Both the Stoch and Williams percent range are indicating an overbought level which means that in the immediate short term a decline in the prices is expected. The relative strength index is at 29 indicating a WEAK demand for Bitcoin at the current market levels. Bitcoin is now moving below its 100 hourly and 200 hourly simple MAs. All of the major technical Indicators are giving a STRONG SELL signal, which means that in the immediate short term we are expecting targets of 28,000 and 27,500. The average true range is indicating LESS market volatility with a strong bearish momentum. - Bitcoin: bearish reversal seen below $31,750
- The StochRSI is indicating an OVERSOLD level
- The price is now trading just below its pivot level of $29,643
- All of the moving averages are giving a STRONG SELL market signal
Bitcoin: Bearish Reversal Seen Below $31,750 Bitcoin continues to move into a consolidation channel above the $29,500 handle in the European trading session today. We can see the formation of a falling trend channel below the $30,000 handle and now we are looking at the projected levels of $28,000 and $25,000. The immediate short-term outlook for bitcoin is strongly bearish; the medium-term outlook has turned bearish; and the long-term outlook remains neutral under present market conditions. Bitcoin continues to consolidate above its important support level of $29,000 and further decline in its price is expected in the US trading session. The price of BTCUSD is now facing its classic support level of 29,361 and Fibonacci support level of 29,571 after which the path towards 28,000 will get cleared. In the last 24hrs, BTCUSD has declined by 5.64% with a price change of 17,71$ and has a 24hr trading volume of USD 35.441 billion. We can see an Increase of 31.14 % in the trading volume as compared to yesterday, which is due to selling by the medium-term investors. The Week AheadThe price of bitcoin is moving in a strongly bearish momentum, and the immediate targets are $28,000 and $27,500. The daily RSI is printing at 44 which means that the medium-range demand continues to be NEUTRAL. The price of bitcoin is moving in an uncertain range-bound movement between the $28,000 and $32,000 over the past few weeks. We will have to wait till a clear trend is visible in the medium-term range. The prices of BTCUSD will need to remain above the important support level of $29,000 this week. The weekly outlook is projected at $29,500 with a consolidation zone of $28,000. Technical Indicators:Moving averages convergence divergence (12,26): at -344 indicating a SELL The ultimate oscillator: at 44.88 indicating a SELL The rate of price change: at -5.92 indicating a SELL The commodity channel index (14 days): at -52.34 indicating a SELL Read Full on FXOpen Company Blog...
|
FXOpen - True Regulated ECN Broker
|
|
|
FXOpen Trader (OP)
Jr. Member
Offline
Activity: 741
Merit: 5
|
|
June 09, 2022, 01:35:24 PM |
|
ETHUSD and LTCUSD Technical Analysis 09th JUNE, 2022 ETHUSD: Double Bottom Pattern Above $1,725 ETHUSD: Double Bottom Pattern Above $1,725Ethereum was unable to sustain its bearish momentum this week and after touching a low of 1,725 on 07th June started to correct upwards against the US dollar. We can see a strong pullback action in the markets which is keeping the prices of Ethereum above the $1,800 handle in the European trading session today. We can see the formation of a bullish ascending channel above the $1,800 handle, and now we are looking at $1,900 and $2,050 as the immediate targets. The prices touched an intraday low of $1,777 in the Asian trading session, and an intraday high of $1,821 in the European trading session today. We can clearly see a double bottom pattern above the $1,725 handle which is a bullish pattern and signifies the end of a bearish phase and the start of a bullish phase in the markets. ETH is now trading just above its pivot level of 1,814 and moving in a strongly bullish channel. The price of ETHUSD is now testing its classic resistance level of 1,820 and Fibonacci resistance level of 1,825, after which the path towards 1,900 will get cleared. The relative strength index is at 58 indicating a strong market and the continuation of the uptrend this week. The StochRSI and Williams percent range are indicating an oversold level which means that the price is due to correct upwards in the short-term range. All of the technical indicators are giving a strong buy market signal. All of the moving averages are giving a strong buy signal, and we are now looking at the levels of $1,900 to $2,000 in the short-term range. ETH is now trading above the 100 hourly and exponential MAs. - A bullish reversal seen above the $1,725 mark
- The short-term range appears to be strongly bullish
- The parabolic SAR is indicating a bullish reversal in the hourly time frame
- The average true range is indicating less market volatility
Ether: Bullish Reversal Seen Above $1,725 ETHUSD is moving in a strongly bullish channel with the prices trading above the $1,800 handle in the European trading session today. We can see the formation of a bullish harami cross pattern in the 15-minute time frame indicating the potential bullish nature of the present markets. The prices of Ethereum may continue to move upwards against the US dollar, as the medium-term investors are coming back into the markets. The key resistance levels to watch are $1,907 and $2,077, and the price of ETHUSD needs to cross these levels for the continuation of the bullish reversal. ETH has declined by 0.90% with a price change of 16$ in the past 24hrs and has a trading volume of 13.881 billion USD. We can see a decrease of 37.41% in the total trading volume in the last 24 hrs which is due to the uncertain nature of the global markets. The Week AheadThe global investor sentiments have improved leading to a pullback action in the markets, and now we are looking at $1,900 and $2,050 as the immediate targets. The immediate short-term outlook for Ether has turned strongly bullish, the medium-term outlook has turned NEUTRAL, and the long-term outlook for Ether is neutral in present market conditions. This week, Ether is expected to move in a range between $1,800 and $2,000, and next week, it is expected to enter into a consolidation phase above $2,000. Technical Indicators:STOCH (9,6): at 65.83 indicating a BUY The moving averages convergence divergence (12,26): at 3.66 indicating a BUY The ultimate oscillator: at 68.27 indicating a BUY The rate of price change: at 1.82 indicating a BUY Read Full on FXOpen Company Blog...
|
FXOpen - True Regulated ECN Broker
|
|
|
FXOpen Trader (OP)
Jr. Member
Offline
Activity: 741
Merit: 5
|
|
June 10, 2022, 05:31:36 AM |
|
Gold Price Remains At Risk and Oil Price Aims More Gains Gold price is struggling to clear the $1,855 resistance zone. Crude oil price is rising and might continue to gain pace above the $120.00 resistance.Important Takeaways for Gold and Oil Gold price is struggling to clear the $1,855 resistance zone. Crude oil price is rising and might continue to gain pace above the $120.00 resistance.Important Takeaways for Gold and Oil- Gold price struggled above $1,860 and corrected lower against the US Dollar.
- There was a break below a key bullish trend line with support near $1,850 on the hourly chart of gold.
- Crude oil price gained pace after it broke the $118 and $120 resistance levels.
- There is a major bullish trend line forming with support near $118.50 on the hourly chart of XTI/USD.
Gold Price Technical AnalysisGold price formed a base above the $1,830 and $1,835 levels against the US Dollar. The price started a fresh increase after it broke the $1,840 resistance zone. There was a clear move above the $1,850 level and the 50 hourly simple moving average. The price even cleared the $1,855 level and traded as high as $1,859 on FXOpen. Recently, there was a downside correction below $1,855. Gold Price Hourly Chart The price declined below the 50% Fib retracement level of the upward move from the $1,837 swing low to $1,859 high. There was also a break below a key bullish trend line with support near $1,850 on the hourly chart of gold. The price also tested the 76.4% Fib retracement level of the upward move from the $1,837 swing low to $1,859 high. On the downside, an initial support is near the $1,840 level. The next major support is near the $1,835 level, below which there is a risk of a larger decline. In the stated case, the price could decline sharply towards the $1,810 support zone. On the upside, the price is facing resistance near the $1,850 level. The main resistance is now forming near the $1,860 level. A close above the $1,860 level could open the doors for a steady increase towards $1,875. The next major resistance sits near the $1,888 level. Read Full on FXOpen Company Blog...
|
FXOpen - True Regulated ECN Broker
|
|
|
FXOpen Trader (OP)
Jr. Member
Offline
Activity: 741
Merit: 5
|
|
June 14, 2022, 02:46:15 PM |
|
BTCUSD and XRPUSD Technical Analysis 14th JUNE 2022 BTCUSD Bearish Harami Pattern Below $28300 BTCUSD Bearish Harami Pattern Below $28300Bitcoin continues its bearish momentum from last week and plunged below the $21000 handle touching a low of 20850 in the European Trading session today. The global investor sentiments are weak and the continuation of the selling pressure across the global cryptocurrency exchanges is causing the massive slide in Bitcoin. Bitcoin entered into a Major Bearish trend channel below the $28300 handle and continued to decline below the $21000 handle today, the lowest level seen in 2 years. We can see a very weak demand for the Bitcoin in the medium-term range and the prices are expected to fall further towards the $20000 levels. We can clearly see a Bearish Harami Pattern Below the $28300 handle which is a Bearish reversal pattern because it signifies the end of an Uptrend and a shift towards a Downtrend. Both the STOCH and Williams Percent Range are indicating Overbought levels which means that in the immediate short term a decline in the prices is expected. Relative Strength Index is at 40 indicating a WEAK demand for the Bitcoin at the current market levels. Bitcoin is now moving Below its 100 hourly Simple Moving average and its 200 hourly Simple Moving averages. All of the Major Technical Indicators are giving a SELL Signal, which means that in the immediate short term we are expecting targets of 21000 and 20500. Average True Range is indicating LESS Market Volatility with a Strong Bearish Momentum. - Bitcoin Bearish Continuation seen Below $28300.
- STOCHRSI is Indicating OVERSOLD Levels.
- The price is now trading just Below its Pivot Levels of $22739.
- All of the Moving Averages are giving a STRONG SELL market signal.
Bitcoin Bearish Continuation Seen Below $28300 The prices of Bitcoin nosedived below the $21000 handle today, after which we can see a move towards the consolidation channel above the $22000 handle in the European Trading session today. We can see the formation of a Falling Trend channel below the $27900 handle and now we are looking at the projected levels of $21000 and $20000. The immediate short-term outlook for Bitcoin is Strong Bearish, Medium-term outlook has turned as Bearish, and the long-term outlook remains Neutral under present market conditions. Bitcoin continues to consolidate above its important support levels of $22000 and further decline in its prices is expected in the US Trading session. The price of BTCUSD is now facing its Classic support levels of 21775 and Fibonacci support levels of 22293 after which the path towards 21000 will get cleared. In the last 24hrs BTCUSD has declined by 7.49% by 1808$ and has a 24hr trading volume of USD 67.482 Billion. We can see an Increase of 18.28% in the Trading volume as compared to yesterday, which is due to the selling by the medium-term investors. The Week AheadThe prices of Bitcoin are moving in a Strong Bearish momentum and the immediate targets are $21000 and $20500 The Daily RSI is printing at 23 which means that the medium range demand continues to be WEAK. We can see that the prices of Bitcoin have stabilized above the $22000 handle and now we are looking at the important support levels of $21000 and $21775. The prices of BTCUSD will need to remain above the important support levels of $21000 this week. Weekly outlook is projected at $21500 with a consolidation zone of $20500. Technical Indicators:Moving Averages Convergence Divergence (12,26): It is at -694 indicating a SELL. Ultimate Oscillator: It is at 44.05 indicating a SELL. Rate of Price Change: It is at -4.05 indicating a SELL. Commodity Channel Index(14days): It is at -10.55 indicating a NEUTRAL level. Read Full on FXOpen Company Blog...
|
FXOpen - True Regulated ECN Broker
|
|
|
FXOpen Trader (OP)
Jr. Member
Offline
Activity: 741
Merit: 5
|
|
June 16, 2022, 05:12:18 PM |
|
ETHUSD and LTCUSD Technical Analysis 16th JUNE, 2022 ETHUSD Bearish Doji Star Pattern Below $1834 ETHUSD Bearish Doji Star Pattern Below $1834Ethereum was unable to sustain its bullish momentum and after touching a high of 1834 on 16th June started to decline heavily against the US Dollar. We can see a continued selloff in the markets which is keeping the prices of Ethereum below the $1200 handle in the European Trading session today. We can see the formation of a Bearish Descending channel below the $1800 handle and now we are looking at $1100 and $1050 as the immediate targets. The prices touched an Intraday Low of $1144 in the European Trading session and an Intraday High of $1254 in the Asian Trading session today. We can clearly see a Bearish Doji Star Pattern Below the $1834 handle which is a Bearish pattern and signifies the end of a Bullish phase and the start of a Bearish phase in the markets. ETH is now trading below its Pivot levels of 1168 and is moving into a Strong Bearish channel. The price of ETHUSD is now testing its Classic support levels of 1126 and Fibonacci support levels of 1158 after which the path towards 1100 will get cleared. Relative Strength Index is at 50 indicating a NEUTRAL market and the shift towards the consolidation phase in the markets. The STOCHRSI is indicating Oversold levels, which means that the prices are due to correct upwards in the short-term range. ALL of the of the Technical indicators are giving a STRONG SELL market Signal. Some of the Moving Averages are giving a SELL Signal and we are now looking at the levels of $1100 to $1050 in the short-term range. ETH is now trading Below its both the 100 Hourly Simple and Exponential Moving Averages. - Ether Bearish Reversal seen Below the $1834 mark.
- Short-term range appears to be Strongly BEARISH.
- Bearish Harami Pattern seen in the 15minutes timeframe.
- Average True Range is indicating LESS Market Volatility.
Ether Bearish Reversal Seen Below $1834 ETHUSD is now moving into a Strong Bearish Channel with the prices trading below the $1200 handle in the European Trading session today. We can see the formation of a Bullish crossover pattern of Adaptive Moving Average AMA 100 in the 30 minutes timeframe indicating the potential Bullish reversal. After the recent decline in the prices of Ethereum some of the analysts have predicted that the bottom levels are reached and now the prices are due to correct upwards in the medium to long term range. The key resistance levels to watch are $1208 and $1275 and the prices of ETHUSD need to cross these levels for the start of the Bullish reversal. ETH has increased by 9.56% with a price change of 98$ in the past 24hrs and has a trading volume of 30.529 Billion USD. We can see an Increase of 13.59% in the total trading volume in last 24 hrs. which is due to the heavy selling seen across the global markets. The Week AheadThe global investor sentiments continue to be weak leading to the massive slide in the prices of Ethereum this week. The crash that we have seen is also due to the heavy selling by the Hedge Funds in the wake of the US Fed Rate Hike decision. The immediate short-term outlook for the Ether has turned as Strongly BEARISH, the medium-term outlook has turned NEUTRAL, and the long-term outlook for Ether is NEUTRAL in present market conditions. In this week Ether is expected to move in a range between the $100 and $1200 and in the next week Ether is expected to enter into a Consolidation phase above the $1200 levels. Technical Indicators:Average Directional Change(14days): It is at 39.83 indicating a SELL. Williams Percent Range: It is at -74.96 indicating a SELL. Ultimate Oscillator: It is at 39.15 indicating a SELL. Commodity Channel Index(14days): It is at -91.04 indicating a SELL. Read Full on FXOpen Company Blog...
|
FXOpen - True Regulated ECN Broker
|
|
|
FXOpen Trader (OP)
Jr. Member
Offline
Activity: 741
Merit: 5
|
|
June 21, 2022, 01:17:42 PM |
|
BTCUSD and XRPUSD Technical Analysis 21st JUNE 2022 BTCUSD Rounding Bottom Pattern Above $17600 BTCUSD Rounding Bottom Pattern Above $17600Bitcoin was unable to sustain its bearish momentum and after touching a low of 17678 on 18th June started to correct upwards and is now trading above $21000 handle in the European Trading session. We can see that after touching an 18-month low the prices of Bitcoin have pulled back due to the buying seen at lower levels from the long-term investors. Bitcoin entered into a Consolidation channel above the $18000 handle and continues to rise above these levels. The Global demands for Bitcoin have improved now and the prices are expected to cross $22000 levels. We can clearly see a Rounding Bottom Pattern Above the $17600 handle which is a Bullish reversal pattern because it signifies the end of a Downtrend and a shift towards an Uptrend. Both the STOCH and STOCHRSI are indicating Overbought levels which means that in the immediate short term a decline in the prices is expected. Relative Strength Index is at 66 indicating a STRONGER demand for the Bitcoin at the current market levels. Bitcoin is now moving Above its 100 hourly Simple Moving average and its 200 hourly Simple Moving averages. All of the Major Technical Indicators are giving a STRONG BUY Signal, which means that in the immediate short term we are expecting targets of 22000 and 23500. Average True Range is indicating LESS Market Volatility with a Strong Bullish Momentum. - Bitcoin Bullish Reversal seen Above $17600.
- Williams Percent Range is Indicating OVERBOUGHT Levels.
- The price is now trading just Above its Pivot Levels of $21263.
- All of the Moving Averages are giving a STRONG BUY market signal.
Bitcoin Bullish Reversal Seen Above $17600 The prices of Bitcoin have entered into a consolidation channel above the $18000 handle and the pullback seen is expected to continue touching levels of $22000. We can see the formation of a Rising Trend channel above the $18000 handle and now we are looking at the projected levels of $22000 and $24000. The immediate short-term outlook for Bitcoin is Strong Bullish, Medium-term outlook has turned as Bullish, and the long-term outlook remains Neutral under present market conditions. Bitcoin continues to consolidate above its important support levels of $21000 and further appreciation in its prices is expected in the US Trading session. The price of BTCUSD is now facing its Classic resistance levels of 21486 and Fibonacci resistance levels of 21633 after which the path towards 22000 will get cleared. In the last 24hrs BTCUSD has increased by 3.43% by 705$ and has a 24hr trading volume of USD 32.005 Billion. We can see a Decrease of 12.38% in the Trading volume as compared to yesterday, which is due to the buying by the long-term investors. The Week AheadThe prices of Bitcoin are moving in a Strong Bullish momentum and the immediate targets are $22000 and $23500 The Daily RSI is printing at 31 which means that the medium range demand continues to be WEAK. We can see that the prices of Bitcoin have stabilized above the $21000 handle and now we are looking at the important support levels of $21237 and $21305. The prices of BTCUSD will need to remain above the important support levels of $21000 this week. Weekly outlook is projected at $22500 with a consolidation zone of $21000. Technical Indicators:Moving Averages Convergence Divergence (12,26): It is at 279 indicating a BUY. Ultimate Oscillator: It is at 64.37 indicating a BUY. Rate of Price Change: It is at 5.69 indicating a BUY. Commodity Channel Index(14days): It is at 171.10 indicating a BUY. Read Full on FXOpen Company Blog...
|
FXOpen - True Regulated ECN Broker
|
|
|
FXOpen Trader (OP)
Jr. Member
Offline
Activity: 741
Merit: 5
|
|
June 23, 2022, 01:15:01 PM |
|
ETHUSD and LTCUSD Technical Analysis 23rd JUNE, 2022 ETHUSD Bullish Harami Pattern Above $936 ETHUSD Bullish Harami Pattern Above $936Ethereum was unable to sustain its bearish momentum and after touching a low 893 on 18th June started to correct upwards against the US Dollar. We can see that the prices have recovered from its lows and a pullback action is seen at levels below $1000. We can see the formation of a Bullish Ascending channel below the $1000 handle and now we are looking at $1100 and $1250 as the immediate targets. The prices touched an Intraday Low of $1046 in the Asian Trading session and an Intraday High of $1107 in the European Trading session today. We can clearly see a Bullish Harami Pattern Above the $936 handle which is a Bullish pattern and signifies the end of a Bearish phase and the start of a Bullish phase in the markets. ETH is now trading above its Pivot levels of 1096 and is moving into a Strong Bullish channel. The price of ETHUSD is now testing its Classic resistance levels of 1101 and Fibonacci resistance levels of 1110 after which the path towards 1200 will get cleared. Relative Strength Index is at 52 indicating a NEUTRAL market and the shift towards the consolidation phase in the markets. Both the STOCHRSI and Williams Percent Range are indicating Overbought levels, which means that the prices are due to correct downwards in the short-term range. ALL of the of the Technical indicators are giving a STRONG BUY market Signal. Most of the Moving Averages are giving a BUY Signal and we are now looking at the levels of $1100 to $1250 in the short-term range. ETH is now trading Above its both the 100 Hourly Simple and Exponential Moving Averages. - Ether Bullish Reversal seen Above the $936 mark.
- Short-term range appears to be Strongly BULLISH.
- ETH is poised for an upwards Rally against the US Dollar.
- Average True Range is indicating LESS Market Volatility.
Ether Bullish Reversal Seen Above $936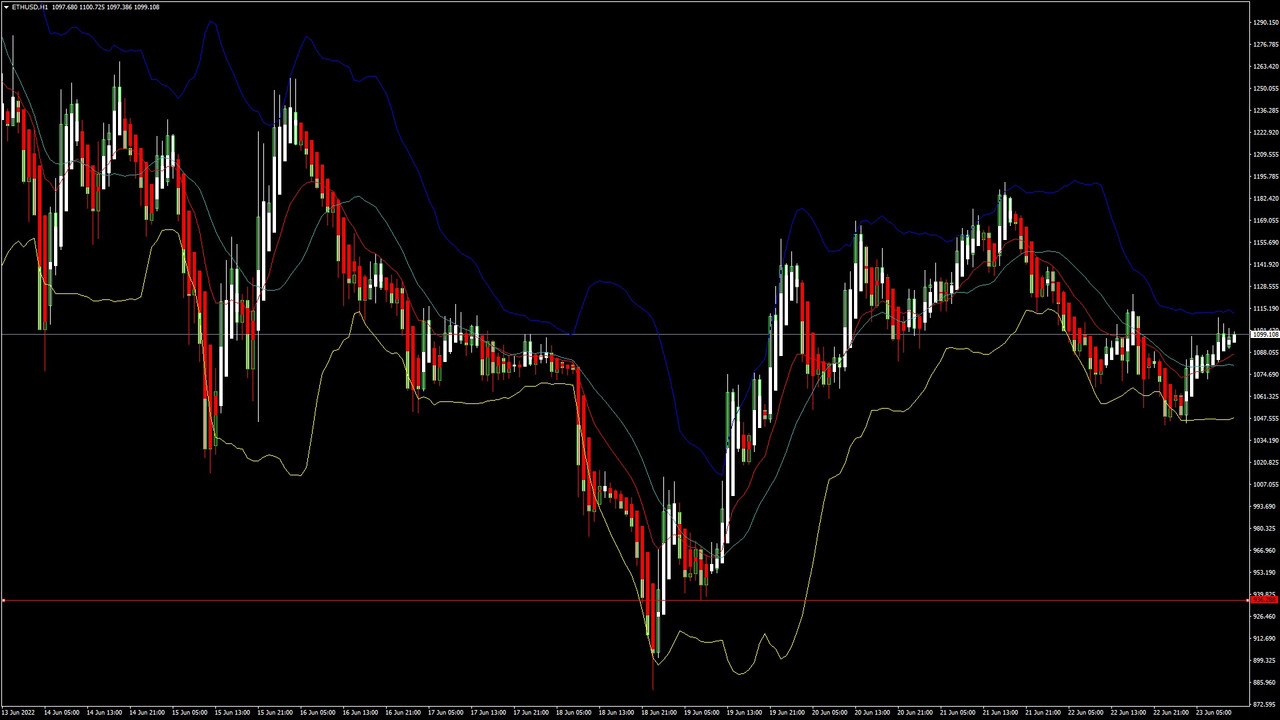 ETHUSD is now moving into a Strong Bullish Channel with the prices trading above the $1100 handle in the European Trading session today. The On Balance Volume is indicating that the demand from the buyers and sellers is in equilibrium, meaning that the present prices of Ether are moving into a consolidation phase. Now we are looking at the possibility of a Rally into the markets which could push the prices of Ether above the $1500 levels soon. The key resistance levels to watch are $1275 and $1300 and the prices of ETHUSD need to cross these levels for the continuation of the Bullish reversal. ETH has increased by 1.50% with a price change of 16$ in the past 24hrs and has a trading volume of 14.913 Billion USD. We can see an Increase of 3.86% in the total trading volume in last 24 hrs. which appears to be Normal. The Week AheadThe global investor sentiments have improved as we can see a recovery of almost 30% from a low of $893 to a high of $1189 reached yesterday. The prices of Ethereum continue to remain above the important psychological support levels of $1000 and we can witness an upwards Rally into the markets in the next week. The immediate short-term outlook for the Ether has turned as Strongly BULLISH, the medium-term outlook has turned NEUTRAL, and the long-term outlook for Ether is NEUTRAL in present market conditions. In this week Ether is expected to move in a range between the $1100 and $1250 and in the next week Ether is expected to enter into a Consolidation phase above the $1250 levels. Technical Indicators:STOCH (9,6): It is at 76.59 indicating a BUY. Average Directional Change(14days): It is at 23.69 indicating a BUY. Rate of Price Change: It is at 3.61 indicating a BUY. Commodity Channel Index(14days): It is at 129.70 indicating a BUY. Read Full on FXOpen Company Blog...
|
FXOpen - True Regulated ECN Broker
|
|
|
|


