dragonvslinux (OP)
Legendary

 Offline Offline
Activity: 1666
Merit: 2204
Crypto Swap Exchange

|
 |
August 04, 2022, 03:33:55 PM |
|
I'm remaining relatively neutral short-term here as $24K has yet to breached for a third time while $23K has yet to be convincingly broken to the downside. Not much has changed today with price continuing to re-test around the 200 WMA ($22,875) this week. After 6 days of red candles on the daily time-frame price could otherwise be due a turn-around with yesterday price printing a gravestone doji reversal candle, that although shows buying pressure is being rejected at higher levels, a reversal of the short-term downtrend could come next. With the 50 Day MA now priced at $21.3K and flattened out, after initially acting as resistance, price could return to this level to confirm it as support, which in turn would further confirm a trend reversal, similar to the 2019 rounding bottom.  Price is now back above all it's MAs so it's difficult to be bearish at this level, but additionally without reclaiming $24K it's also difficult to be fully bullish that price will continue to the upside. After continued rejection from the weekly open at $23.3K, price is struggling to bounce from current support levels after failing to hold the 50 MA as support. Despite the daily chart indicating there could be a reversal back to the upside, the 4hr chart is starting to look bearish as the 200 WMA support level begins to weaken. Hence the need to remain neutral at current levels as price chooses a direction to take. Either way the 200 MA continues to rise and will soon be priced around the $22K level in order to act as strong support if necessary. 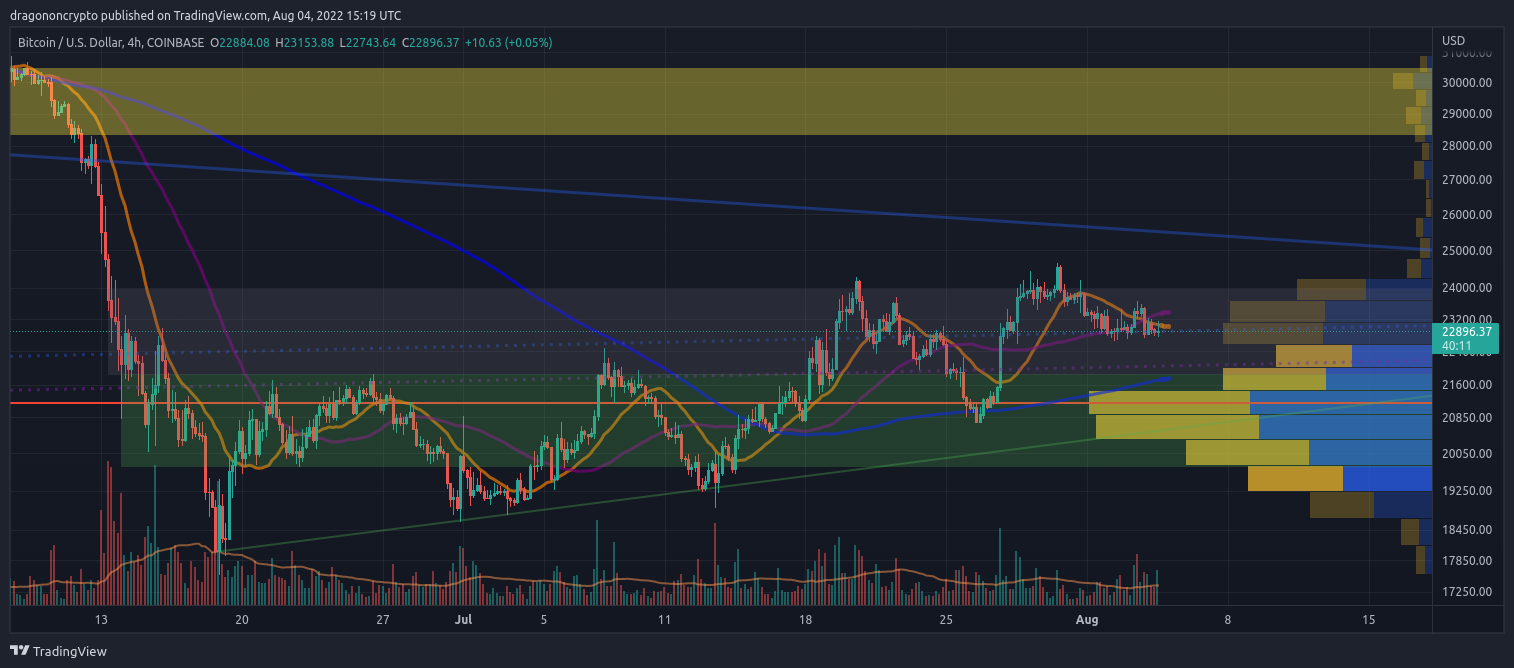 Whether price corrects further towards $22K or breaks through $24K again remains to be seen, but otherwise I remain bullish for the week as the bearish momentum has passed for now.
With the 50 Day MA ($21.3K) now beginning to rise, price action above this level remains bullish in the mid-term, even if the 200 WMA is lost as support this week. As a reminder this daily MA is generally considered a trend momentum indicator, therefore after flattening out and losing it's bearish bias (trending downwards), this indicator now favours the bulls as price remains above it. |
|
|
|
|
|
|
The forum was founded in 2009 by Satoshi and Sirius. It replaced a
SourceForge forum.
|
|
|
Advertised sites are not endorsed by the Bitcoin Forum. They may be unsafe, untrustworthy, or illegal in your jurisdiction.
|
|
|
|
|
|
|
dragonvslinux (OP)
Legendary
Offline
Activity: 1666
Merit: 2204
Crypto Swap Exchange
|
|
August 05, 2022, 04:34:07 PM |
|
After 6 days of red candles on the daily time-frame price could otherwise be due a turn-around with yesterday price printing a gravestone doji reversal candle After printing a 7th red candle in a row, price rallied back to it's support level but is still struggling to reclaim the weekly open around $23.3K, while the consolidation remains bullish due to the rising 50 Day MA. I'm remaining relatively neutral short-term here as $24K has yet to breached for a third time while $23K has yet to be convincingly broken to the downside. Despite a more convincing break below $23K support level, price has since rallied back to it after finding support around last weeks opening price around $22.5K, hence not much has changed. 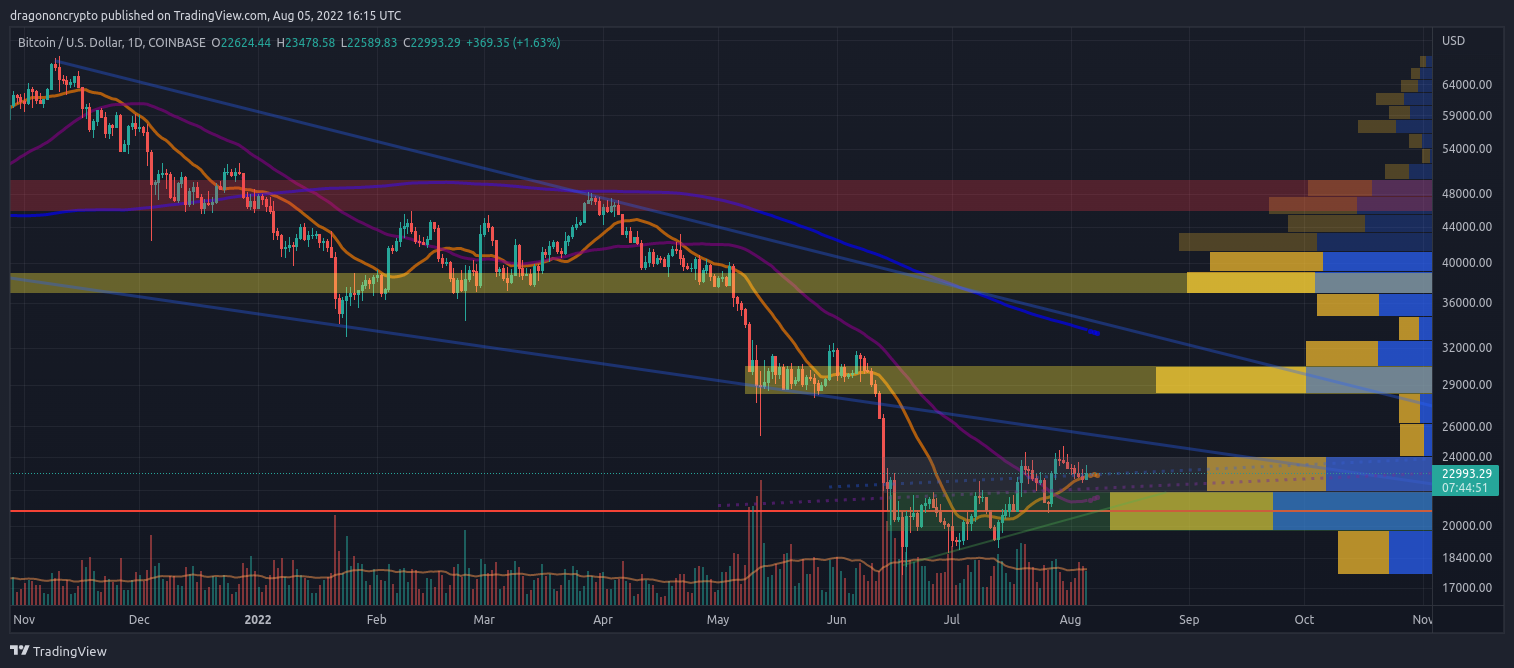 After continued rejection from the weekly open at $23.3K, price is struggling to bounce from current support levels after failing to hold the 50 MA as support. On the 4hr chart, price has since re-tested both of these levels on the 4hr chart but is failing to reclaim them due to significant selling pressure as trading volume builds in the $23K range. With the 200 MA now priced close to $21.9K and continuing to rise, similar to the daily chart the correction remains bullish even if re-testing $22K support is becoming more likely in the short-term. 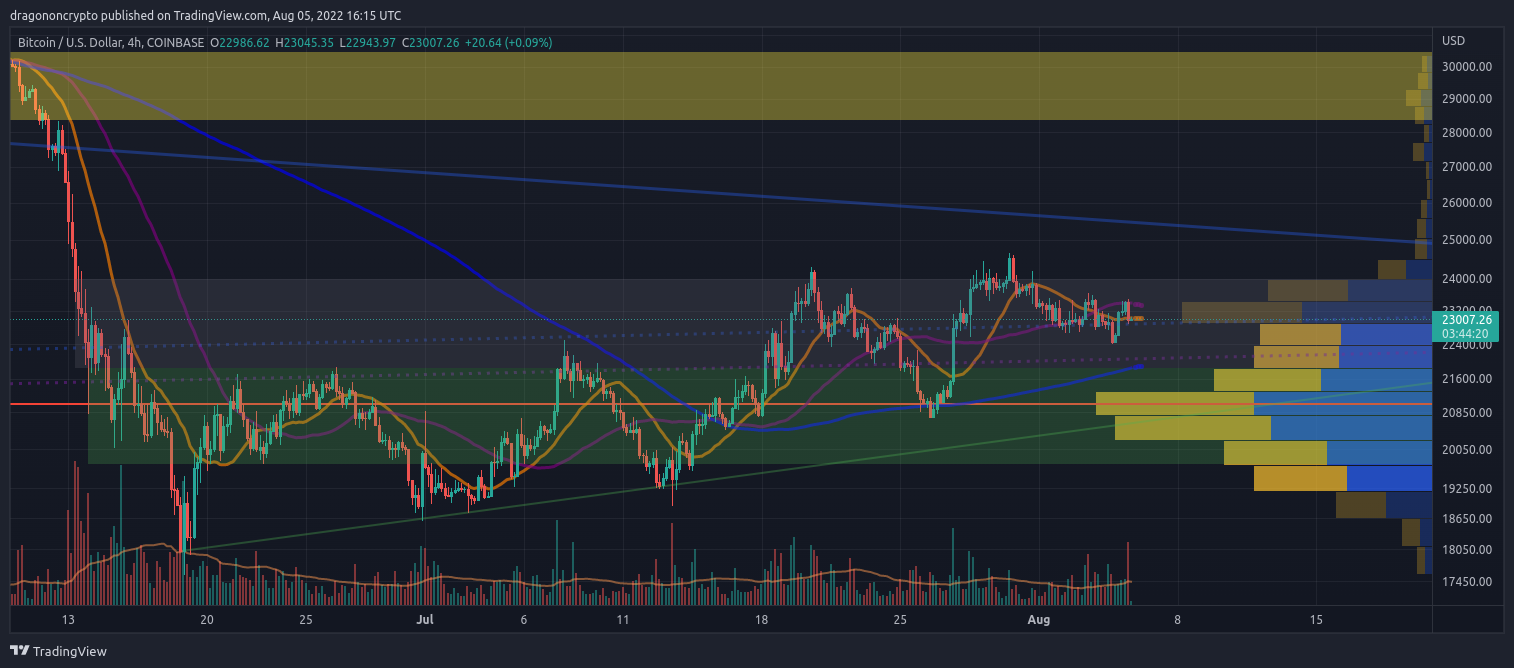 On the weekly scale, price has re-tested it's first two support levels finding buyers at both these prices which is a promising sign, even if resistance remains relatively strong at higher prices. 200 Week MA @ $22,880 (+$85) ✅
Weekly open @ $22,580 ✅
50 Month MA @ $21,990 (+$350)
While initially anticipating bullish continuation this week, it's starting to look like a week for bullish consolidation instead, as buyers attempt to defend the 200 WMA instead. |
|
|
|
dragonvslinux (OP)
Legendary
Offline
Activity: 1666
Merit: 2204
Crypto Swap Exchange
|
|
August 06, 2022, 03:56:37 PM |
|
I'm remaining relatively neutral short-term here as $24K has yet to breached for a third time while $23K has yet to be convincingly broken to the downside. Despite a more convincing break below $23K support level, price has since rallied back to it after finding support around last weeks opening price around $22.5K Again, not much as changed in the past few days as price continues to consolidate. Hence remaining neutral at $23K level in the short-term, while the consolidation remains bullish as the 50 Day MA continues to rise. Finding further support from the 21 Day MA at $23K could otherwise help provide further upside momentum, but that's all I see right now (not a lot). The weekly close should provide better insight. 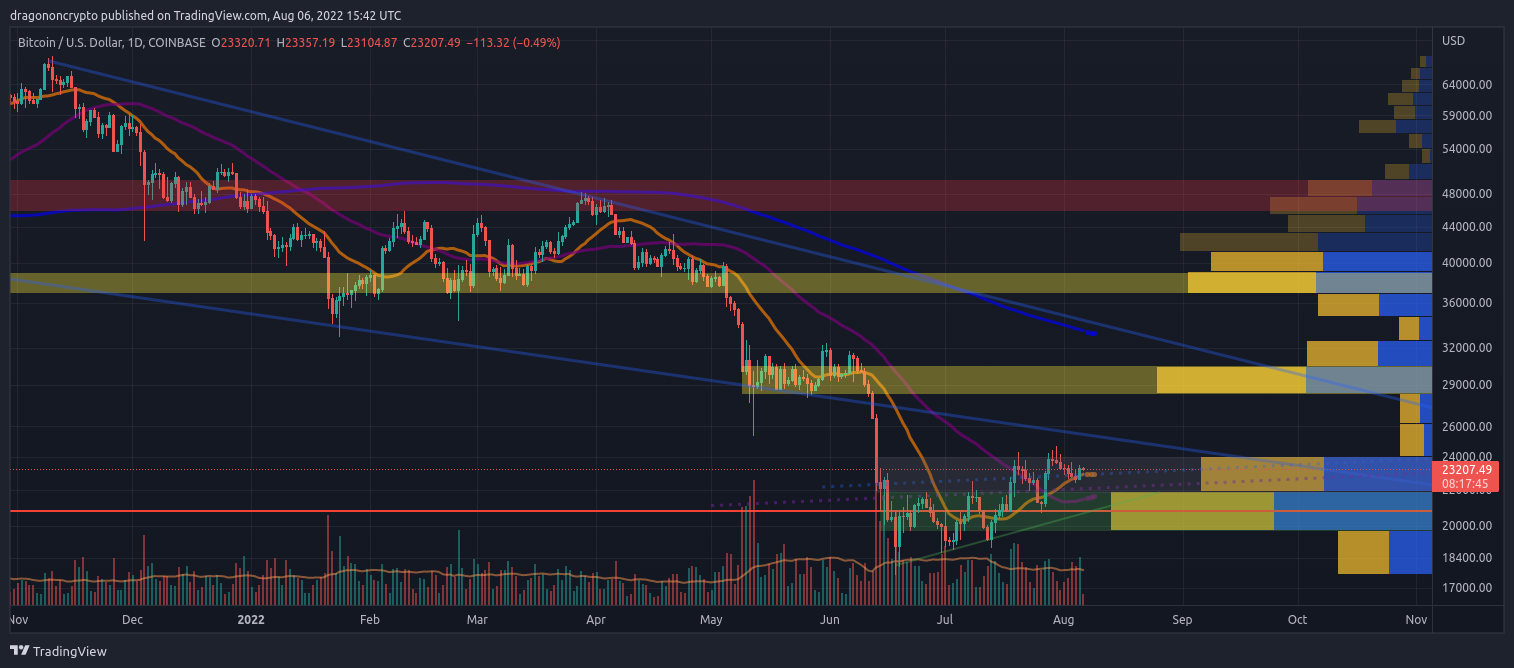 With the 200 MA now priced close to $21.9K and continuing to rise, similar to the daily chart the correction remains bullish even if re-testing $22K support is becoming more likely in the short-term. With the 200 MA now priced at $21,950, this makes the $22K support level stronger after the recent re-test of this MA at $21.1K. It seems likely that a break above $23.5K will generate a re-test of $24K, since the former has already been tested twice already so this resistance is weakening. Likewise, a break below $22.5K will likely create a re-test of $22K support, hence price remains range bound between $22K to $24K. 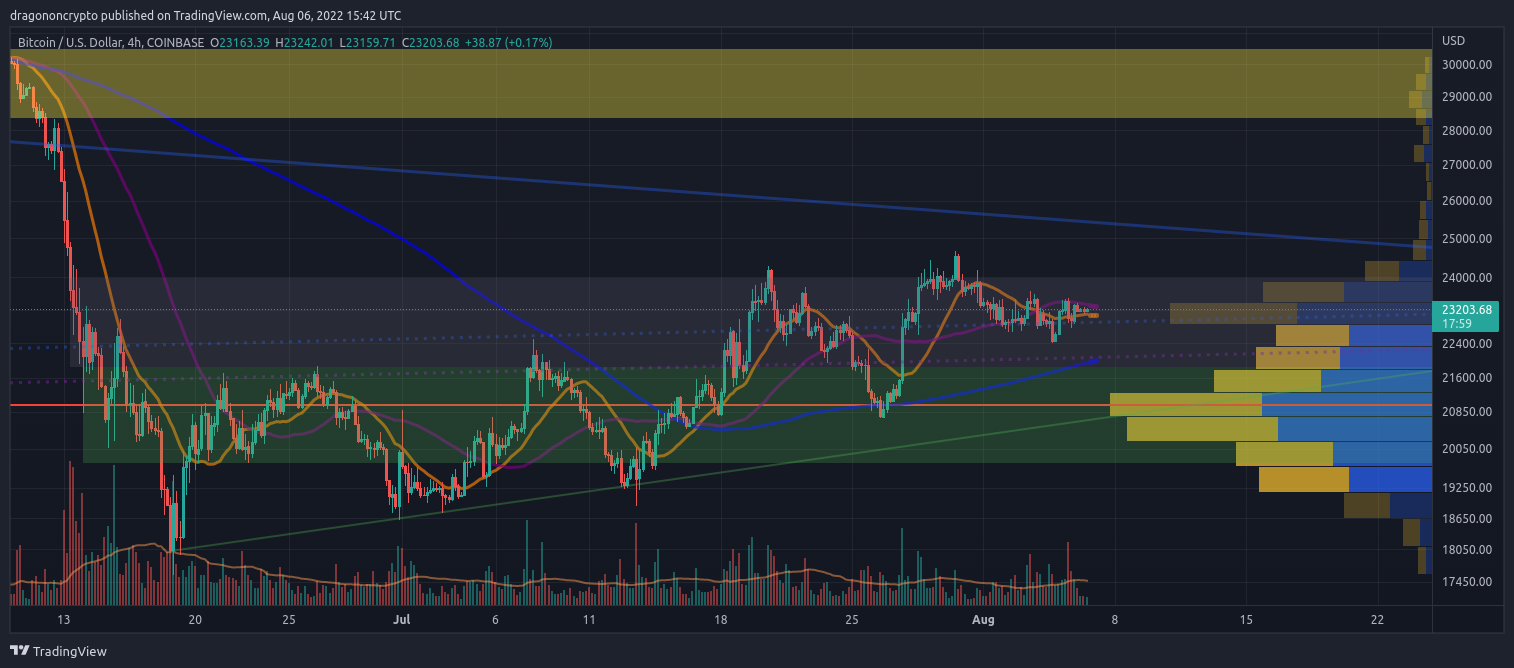 While initially anticipating bullish continuation this week, it's starting to look like a week for bullish consolidation instead, as buyers attempt to defend the 200 WMA instead.
The following levels are the ones I'm continuing to watch for confirmation of support: Key support levels to watch for a pull-back next week will be the following:
200 Week MA @ $22,880 (+$85) ✅
Weekly open @ $22,580 ✅
50 Month MA @ $21,990 (+$350)
|
|
|
|
dragonvslinux (OP)
Legendary
Offline
Activity: 1666
Merit: 2204
Crypto Swap Exchange
|
|
August 06, 2022, 08:11:05 PM |
|
Usually don't bother with an update more than once per day, but one thing I noticed is this correction is considerably different from the previous 3 so far. The following are the three previous corrections over-layed to the current correction from $24.6K. Note how the previous 3 were all very similar at approximately -14% taking between 6 to 9 days. It's now been more than 10 days and bears have failed to take prices more than 10% lower. 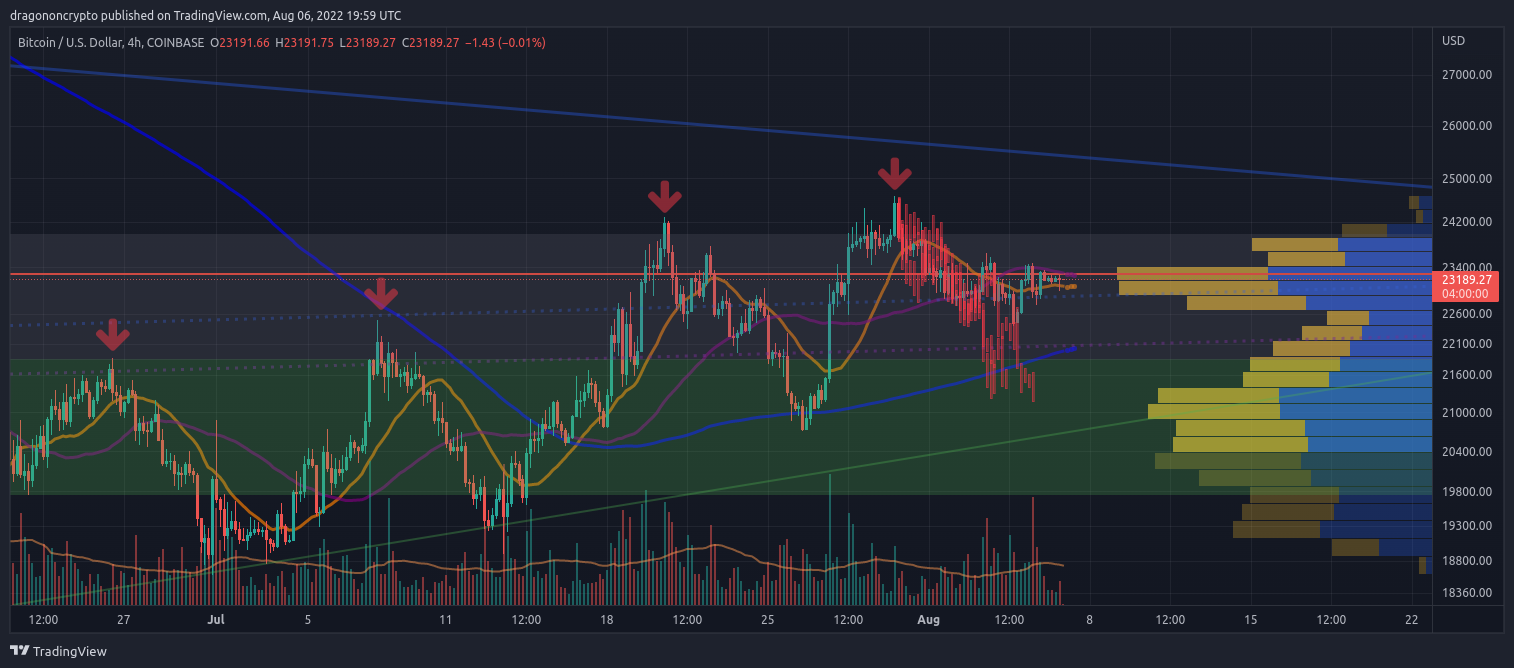 I also usually wouldn't consider comparing this as that relevant, but based on how similar the previous 3 corrections were and how this one is considerably different, it does appear quite relevant. It's also possible that this correction will take longer, as the most recent one was 9 days, and prior to that 7.5 and 6, so there is an argument for corrections taking longer and reaching similar targets of -14%, but I'm not convinced. As notable, the break to $22.5K should have meant that price went lower, to $22K support, but instead after a new 4hr low close, price swiftly rallied back above the 200 WMA. This is why despite remaining neutral in the short-term during this bullish consolidation period, I am none the less leaning bullish, especially if the week can close above the 200 WMA again for a second consecutive week. Here is otherwise why sentiment outlook for anyone interested. Not intended to be accurate, but more reflective of past and future market sentiment for July/August: |
|
|
|
dragonvslinux (OP)
Legendary
Offline
Activity: 1666
Merit: 2204
Crypto Swap Exchange
|
|
August 07, 2022, 04:33:35 PM |
|
Again, not much as changed in the past few days as price continues to consolidate. Hence remaining neutral at $23K level in the short-term, while the consolidation remains bullish as the 50 Day MA continues to rise. As price continue to consolidate today currently above the 20 Day MA, this moving average has since flattened out indicating that bullish momentum in the short-term has subsided, more or less confirming the consolidation in recent days. While many wait for a weekly close above or below the 200 WMA, the trend remains bullish as bears fail to push prices below $23K towards the rising 50 Day MA at $21.5K. 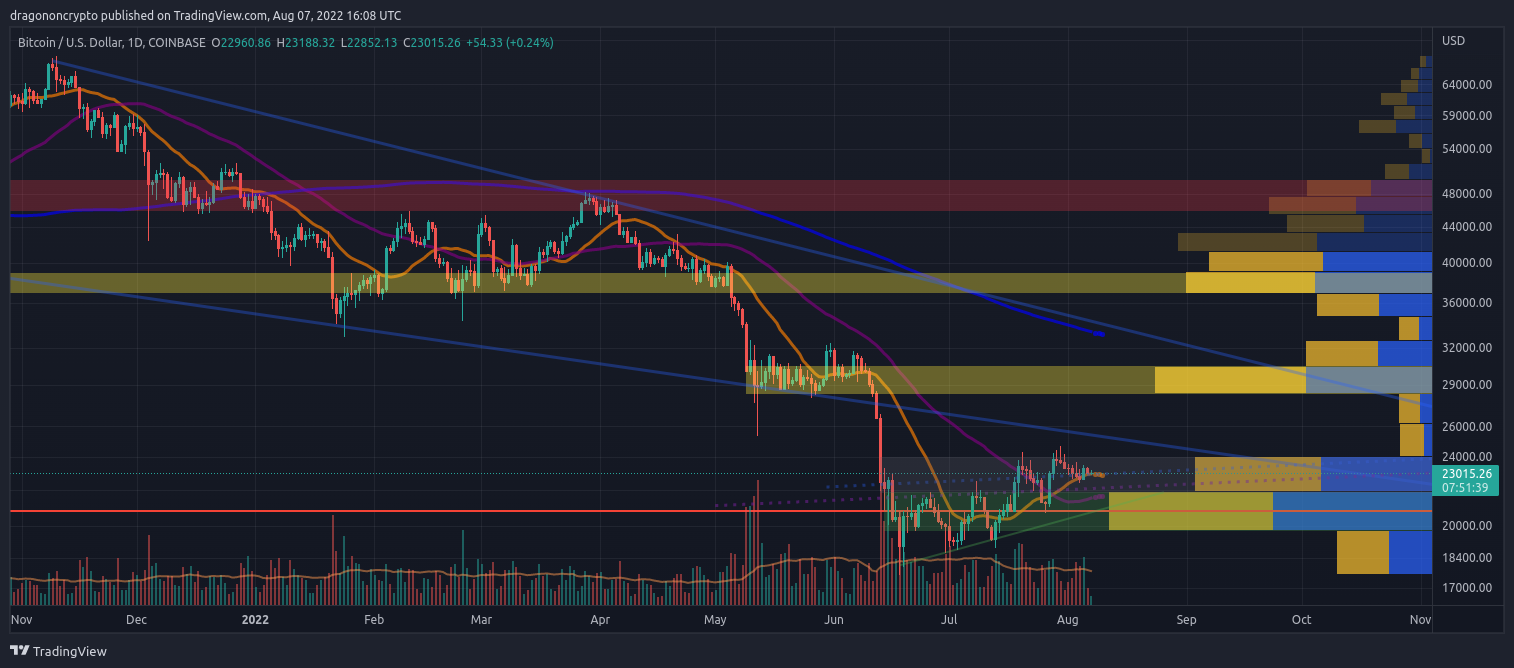 With the 200 MA now priced at $21,950, this makes the $22K support level stronger after the recent re-test of this MA at $21.1K. Support from the 200 MA is now above $22K, so any quick dips to this level will likely be bought up quickly after confirming the accumulation range of $20K to $22K. For example if price closes just below the 200 WMA and bears attempt to push prices lower. Another close above the 200 WMA this week would likely see further upside, or at least a re-test of $24K, after a week of bullish consolidation. 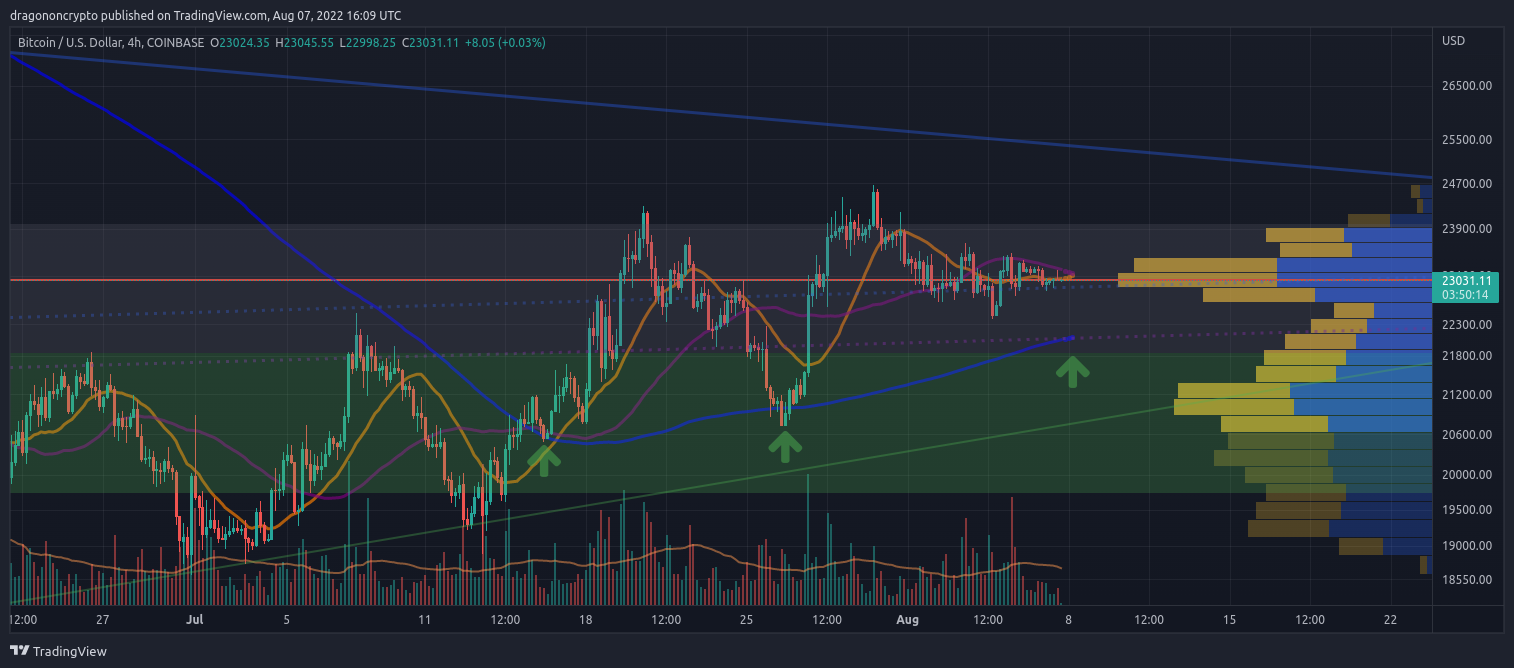 While initially anticipating bullish continuation this week, it's starting to look like a week for bullish consolidation instead, as buyers attempt to defend the 200 WMA instead.
As a reminder, there remains a big volume gap between $24K and $28.4K, while the 20 Week MA will be priced at $29.1K next week. Another bullish close above the 200 WMA could certainly see this gap filled quickly as price retraces the capitulation from $30K levels down to $20K. This would therefore return price to a denser trading range between $30K and $40K, that realistically remains a distribution level.  It's also possible price continues to consolidate between $22K and $24K in the coming weeks before testing the 20 WMA at lower prices, similar to the 2019 rounding bottom, that would be just as bullish for price, if not more bullish in order to build more bullish momentum. Based on this MAs current trajectory it would take around a month before reaching $24K levels. |
|
|
|
dragonvslinux (OP)
Legendary
Offline
Activity: 1666
Merit: 2204
Crypto Swap Exchange
|
|
August 07, 2022, 04:50:42 PM |
|
It seems likely that a break above $23.5K will generate a re-test of $24K, since the former has already been tested twice already so this resistance is weakening.
Likewise, a break below $22.5K will likely create a re-test of $22K support, hence price remains range bound between $22K to $24K. Quick 1hr view for the day, price has been consolidating in form of symmetrical triangle (neutral/continuation) for the past few days that looks like it's due to break already, also can be seen as a diamond pattern. 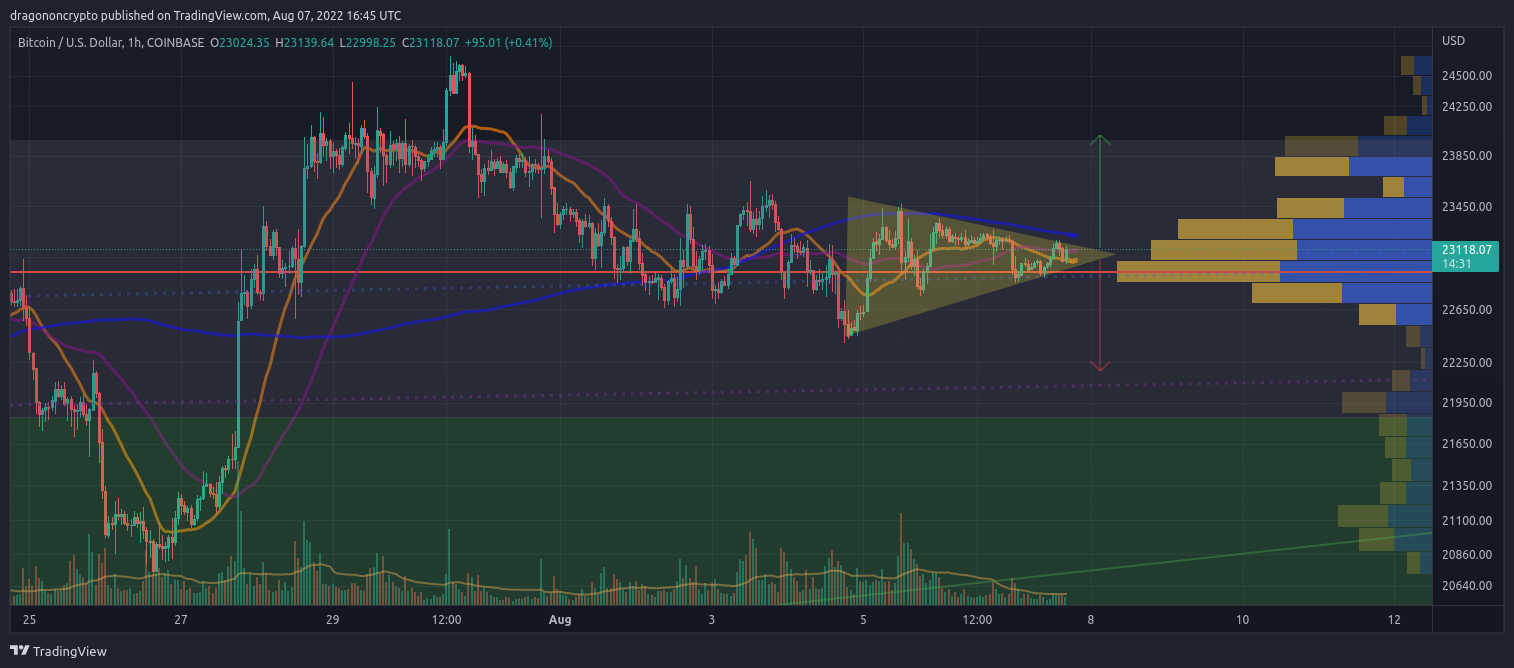 The measured move target is roughly $22K or $24K depending on the direction. With price currently above the volume point of control around $23K, as well as 200 WMA at $22.9K, it looks to favour the bulls, though the continuation looks to favour the bears (continued correction). With price in a tight trading range of $22.5K to $23.5K for the past week, a break of this range would likely see price continue in the direction it breaks. |
|
|
|
dragonvslinux (OP)
Legendary
Offline
Activity: 1666
Merit: 2204
Crypto Swap Exchange
|
|
August 08, 2022, 05:50:20 PM |
|
Quick 1hr view for the day, price has been consolidating in form of symmetrical triangle (neutral/continuation) for the past few days that looks like it's due to break already, also can be seen as a diamond pattern. The measured move target is roughly $22K or $24K depending on the direction. With price currently above the volume point of control around $23K, as well as 200 WMA at $22.9K, it looks to favour the bulls In order to cover this 1hr symmetrical triangle, price met the bullish target of $24K relatively quickly after the weekly close, confirming that the bulls are still in control in short to mid-term time-frames. 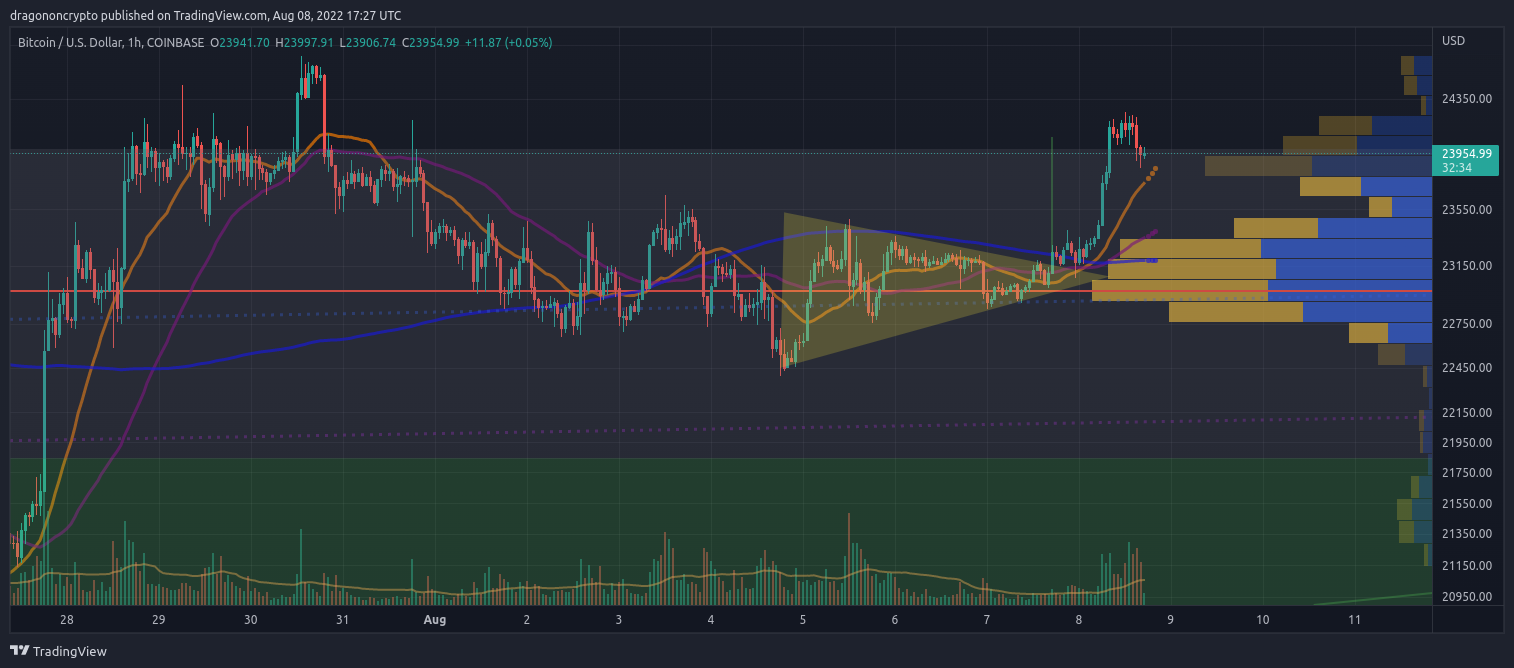 While many wait for a weekly close above or below the 200 WMA, the trend remains bullish as bears fail to push prices below $23K towards the rising 50 Day MA at $21.5K. With another bullish close above the 200 WMA for the second consecutive week, the 4hr chart has now returned to fully bullish (MAs in bullish formation and rising). Key support has been moved up from $22K to $23K where the 50 MA lies as well as new dense volume trading area, now considered accumulation as price remains above it. As price re-tests $24K for the third time, this will either be the moment for a break-out to higher prices or otherwise a pull-back to support at $23K. Given recent early week price movements recently, a pull-back to re-confirm as support is far from out the question, as has been the norm.  On the daily chart, price found support from the 20 Day MA ($23K) after a pull-back, for the first time since March. The 50 Day MA continues to rise, now priced at $21.6K. The more $24K resistance level is tested, the weaker this resistance becomes, therefore a break-out to higher levels is becoming imminent, even if a correction back to the 20 Day MA comes first, as in the mid-term price remains bullish.  there remains a big volume gap between $24K and $28.4K, while the 20 Week MA will be priced at $29.1K next week. Another bullish close above the 200 WMA could certainly see this gap filled quickly For the 6th consecutive week now, price has printed a bullish weekly close, of continuation or consolidation. Despite the 0.5% move to the downside, last week was one of bullish consolidation as price rallied 3.5% from the lows, confirming $23K levels as support (as well as the 200 WMA). With the RSI at 36.5, still in bearish territory, there remains a lot of room to the upside, especially given the large volume gap overhead.  In summary, there is a good reason for bullish sentiment in the market right now, as the 4hr returns to fully bullish, the daily chart is bullish in the mid-term (above short and mid-term MAs that are rising) and the weekly chart is shedding it's bearish bias since the 200 Week MA has been reclaimed, with a lot of room to the upside. This is why there has been good reason to be bullish in the short to mid-term in recent weeks as price continues to move higher, hence I'm remaining bullish until significant resistance levels are reached such as $30K to $40K prices. Until then, the trend is your friend. |
|
|
|
dragonvslinux (OP)
Legendary
Offline
Activity: 1666
Merit: 2204
Crypto Swap Exchange
|
|
August 09, 2022, 11:13:35 AM |
|
Having touchpad trouble so no charts for a while  I otherwise remain bullish above $22K and otherwise think $23K levels is likely to hold as support this week, even if temporarily lost in the coming days. Some selling again from $24K resistance level that's unsurprising and not really that concerning with price make higher highs, even though it'd be more bullish to be consolidating around these prices. With the current horizontal resistance being confirmed, it'd be a great time to form a bullish ascending triangle with a third support point around current prices, this would then have a nice 4-5% measured move target to aim for. Price otherwise made a lower high yesterday which is bearish, but as resistance weakens I'm not putting too much thought into short-term bearish outcomes. |
|
|
|
dragonvslinux (OP)
Legendary
Offline
Activity: 1666
Merit: 2204
Crypto Swap Exchange
|
|
August 10, 2022, 04:11:41 AM |
|
I otherwise remain bullish above $22K and otherwise think $23K levels is likely to hold as support this week, even if temporarily lost in the coming days. Price on the 4hr has returned to $23K short-term accumulation-distribution level, so remaining neutral in the short-term in order to see what direction price takes and whether this support holds while keep an eye on the rising 200 MA around $22.3K. The structure looks very similar to last weeks consolidation, that of being in a trading range of $22K to $24K, suggesting further consolidation to come. 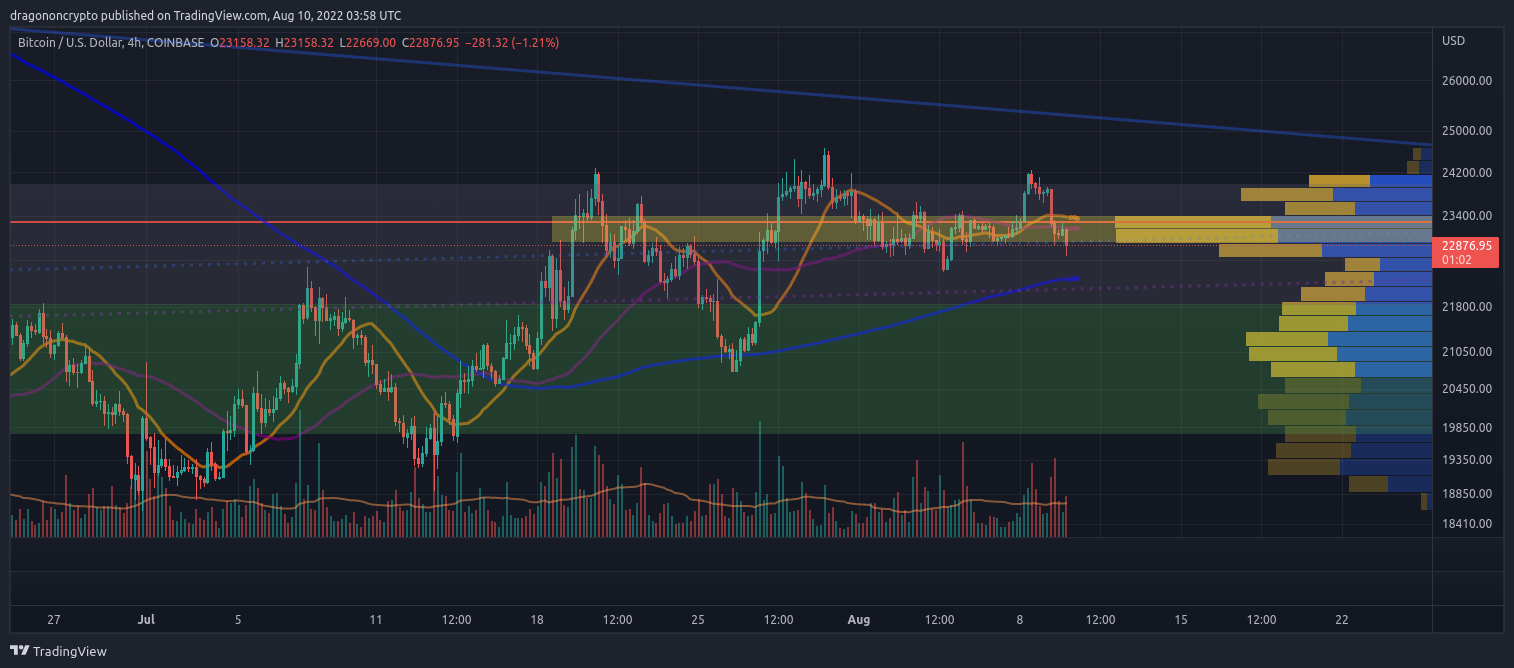 Price otherwise made a lower high yesterday which is bearish, but as resistance weakens I'm not putting too much thought into short-term bearish outcomes.
With short-term and mid-term MAs (20 & 50) beginning to flatten out but in bullish formation, the daily chart remains relatively neutral in the immediate term with a bullish bias as price remains above the 50 Day MA at $21.7K. After failed continuation of bullish momentum early in the week, this week may well be another (boring) week of consolidation, rather than continued upside or re-tests of $24K. 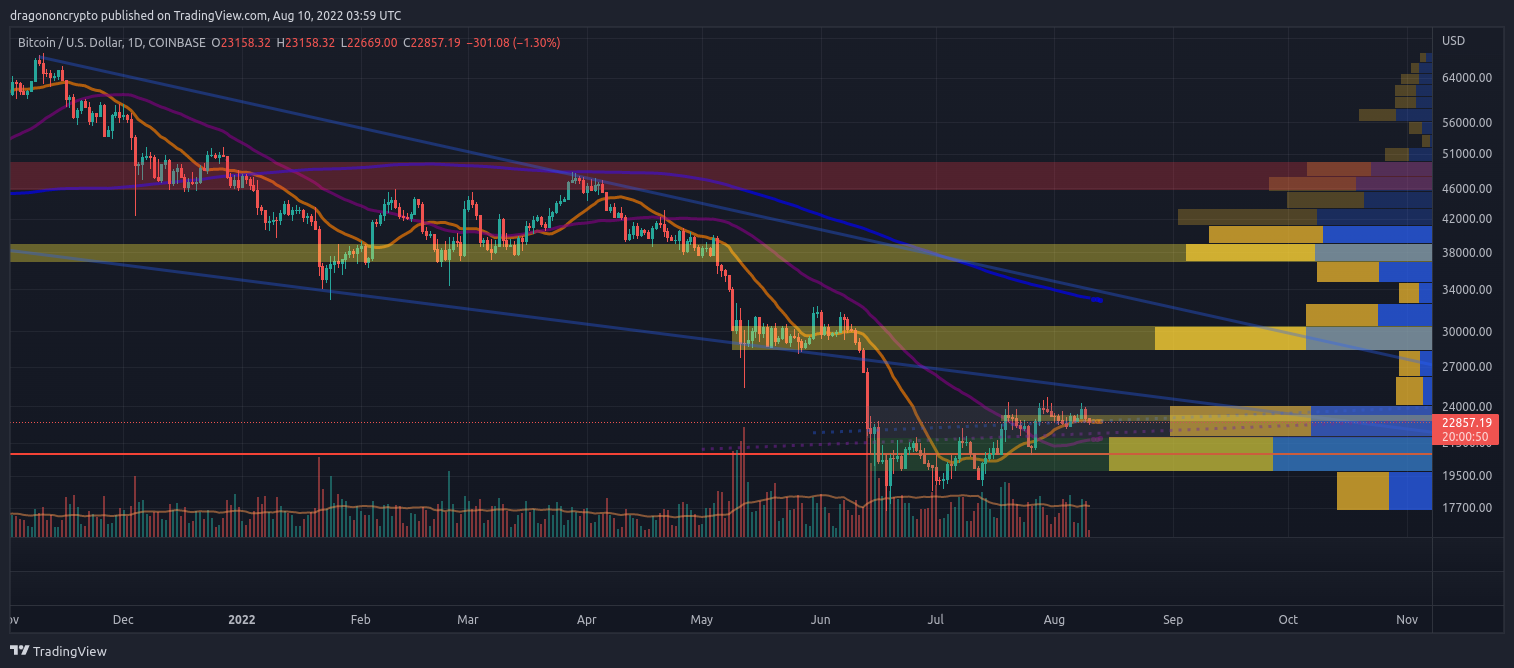 As stated before, I'm not seeing any bearish signs with price above $22K given the support that has been built in the $20K to $22K accumulation zone, but otherwise not ruling out a fake-out below $22K towards $21K (even $20K) that would likely be swiftly bought up. I'm not seeing any immediate price trajectory in the short to mid-term apart from consolidation and testing support levels. |
|
|
|
dragonvslinux (OP)
Legendary
Offline
Activity: 1666
Merit: 2204
Crypto Swap Exchange
|
|
August 11, 2022, 03:19:11 AM |
|
I otherwise remain bullish above $22K and otherwise think $23K levels is likely to hold as support this week, even if temporarily lost in the coming days. Big bounce on the 4hr today with decent volume. Despite anticipating some further consolidation in the short-term, price bounced back to the upside swiftly from the 200 WMA continuing to act as support. MAs have returned to fully bullish formation on this time-frame as price now tests $24K resistance for the 4th time. If it doesn't break this time around, the support remains the same around $23K.  The daily chart looks just as bullish as the 4hr in the mid-term. Price again found support from the 20 Day MA that is rising again, while the 50 Day MA continues to rise now priced at $21.8K. Failing to hold $23K as support would likely see the eventual re-test of $22K, but otherwise the volume gap between $24K and $28K remains the same and looks like it will soon be filled, while $20K to $22K remains strong support. 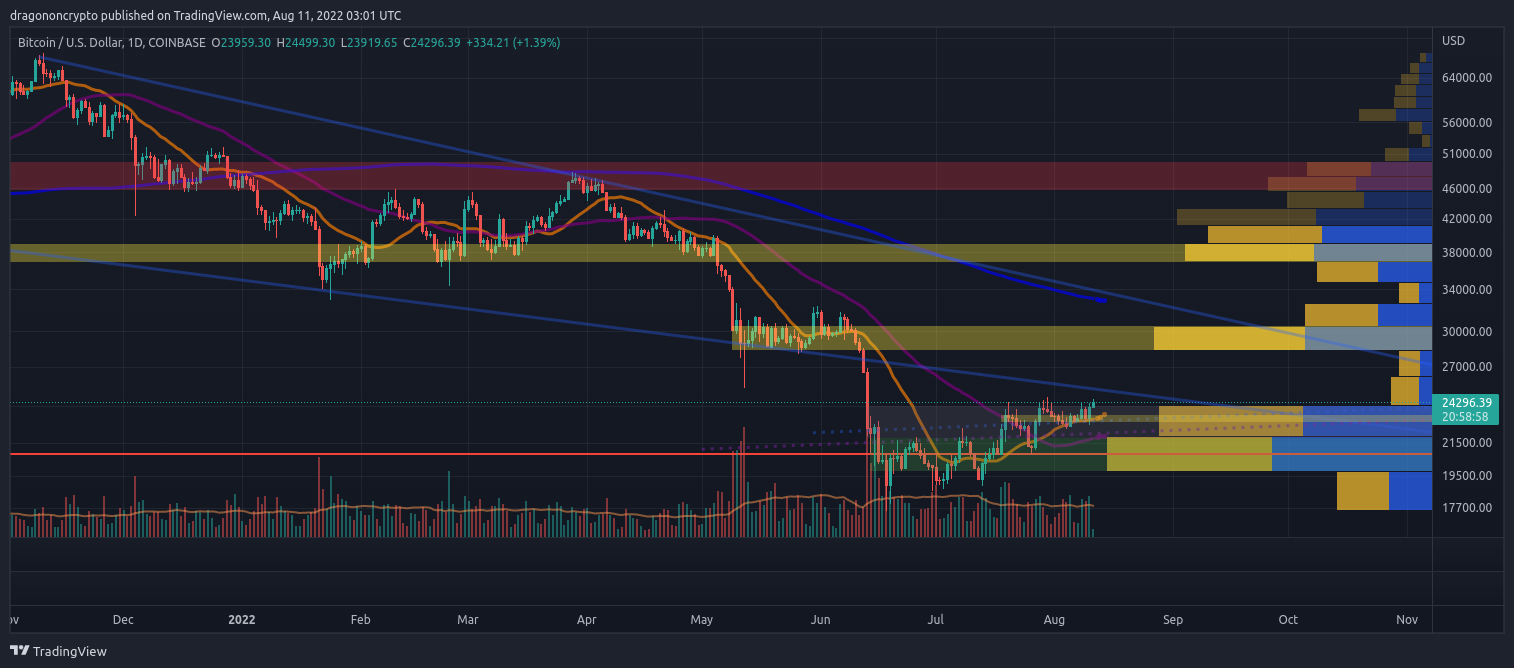 While many are still waiting for rejection from $25K and much lower prices to buy the dip, it's becoming apparent that a significant correction may not occur until $30K resistance level is tested if $25K is broken to the upside. With price finding support for the 3rd week in a row from the 200 WMA, it seems longer-term investors aren't willing to wait around for a dip that may or may not occur. |
|
|
|
dragonvslinux (OP)
Legendary
Offline
Activity: 1666
Merit: 2204
Crypto Swap Exchange
|
|
August 11, 2022, 10:50:15 AM |
|
Quick heads up on the 4hr. The volume point of control (local accumulation zone) has now shifted from around $21K (where price previously found support) to $23K (more recent support) after bulls spent the past two weeks defending the 200 WMA around this level. While there has still been more volume between $20K and $22K (long-term accumulation zone) than $22K to $24K trading range, any quick dips will very likely continue to be defended around this level. If this support is tested again, this would additionally continue to confirm the bullish ascending triangle with a 20% measured move to the upside with the target of approximately $30K.  There's therefore a good reason why bulls in the short to mid-term are feeling bulish, even if remain bearish long-term, due to still being in a bear market. As price continues to knock at the $24K door and wicks above the previous high, the bulls remain fully in control on this time-frame as the dead cat bounce to higher levels looks imminent. My gut feeling is telling me there will be a bit more consolidation before the break-out around $23K, but this is simply based on the amount of consolidation that price has already seen for the past 2 months, and isn't really based on any logic or reason other than what we've become accustomed to seeing. At some point soon enough the consolidation will be over and the break-out towards $30K will eventually take place. Might be fast, or might be similar to the stepping stones price has taken so far. |
|
|
|
dragonvslinux (OP)
Legendary
Offline
Activity: 1666
Merit: 2204
Crypto Swap Exchange
|
|
August 12, 2022, 07:19:24 AM |
|
My gut feeling is telling me there will be a bit more consolidation before the break-out around $23K, but this is simply based on the amount of consolidation that price has already seen for the past 2 months Looking at the daily chart first, as appears more relevant, price was again rejected by $24K with a doji reversal candle and has returned to the $22K to $24K trading range. As can be seen by previous doji reversal candles, this suggests continued correction on this time-frame to support. At the moment this is around $23K where the volume point of control lies, the 21 Day MA as well as a support trend-line. While previous corrections have been significantly deeper (-14%), there has additionally been a trend in recent weeks of these corrections becoming shallower and more sideways rather than downwards.  Zooming out on this time-frame, the bullish argument is far from lost if $23K fails to continue to hold as support. The 50 Day MA continues to rise, now at $21,840, while significant volume support remains in the $20K to $22K range with long-term volume point of control at $20,850. While not yet expecting these lower levels to be tested, failure to hold $23K would merely mean a pause of immediate bullish momentum, rather than continued bearish momentum. The measured move target for a break-out to the upside of this bullish ascending triangle remains +20% to around $30K, despite not many believing this is possible. 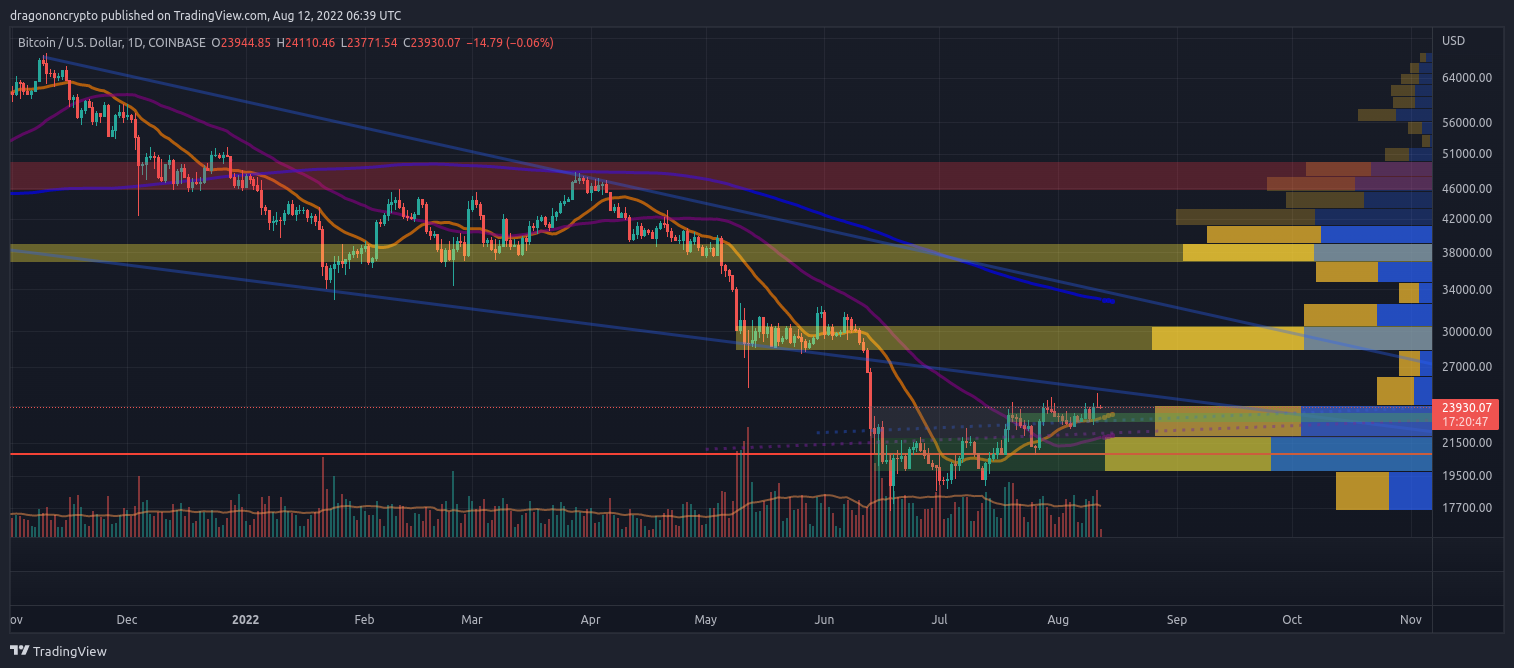 MAs have returned to fully bullish formation on this time-frame as price now tests $24K resistance for the 4th time. If it doesn't break this time around, the support remains the same around $23K. On the 4hr chart, things looks similar but slightly more bullish as price remains above all it's short and long-term MAs (20/50/200) as they continue to rise in bullish formation. However based on the doji reversal candle yesterday, I think price will struggle to hold the immediate bullish momentum and a continued correction to support is much more likely. Holding $24K as new support would be very bullish however. 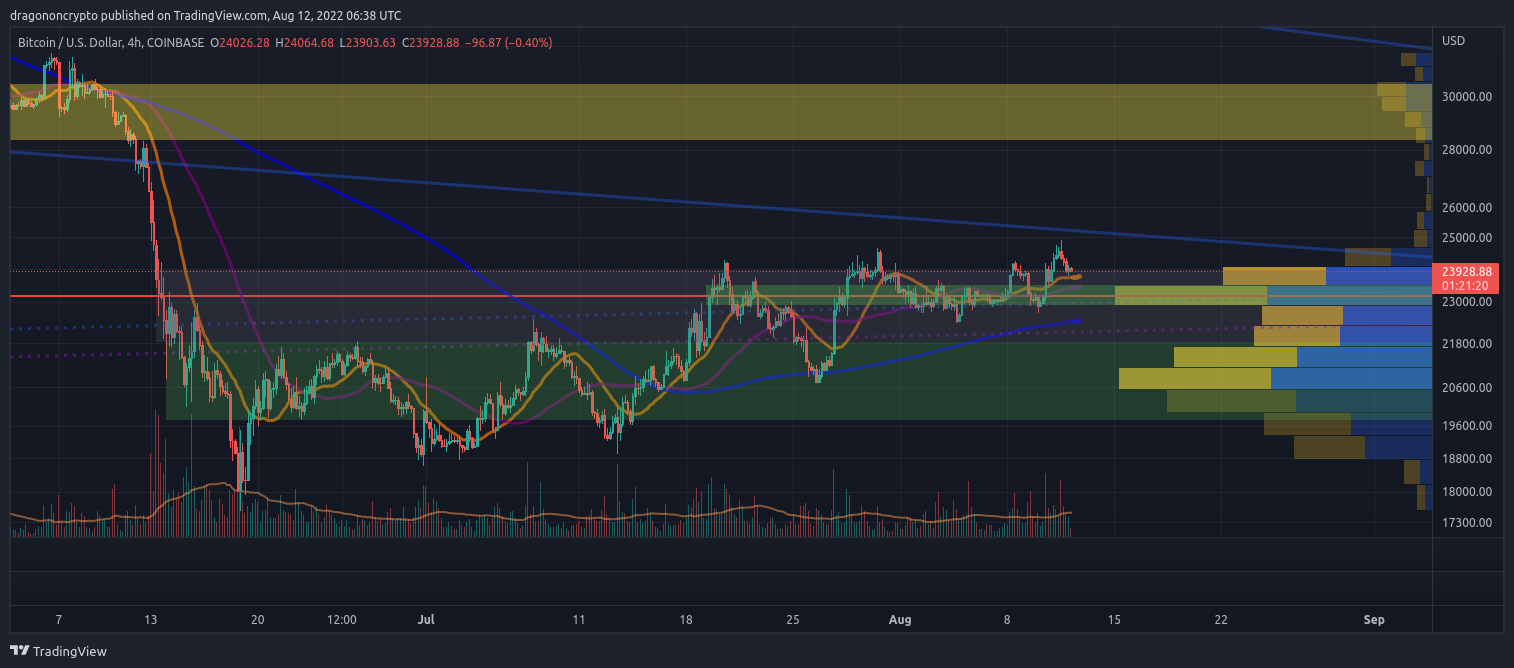 As price continues to knock at the $24K door and wicks above the previous high, the bulls remain fully in control on this time-frame as the dead cat bounce to higher levels looks imminent.
|
|
|
|
dragonvslinux (OP)
Legendary
Offline
Activity: 1666
Merit: 2204
Crypto Swap Exchange
|
|
August 13, 2022, 10:09:34 AM |
|
While previous corrections have been significantly deeper (-14%), there has additionally been a trend in recent weeks of these corrections becoming shallower and more sideways rather than downwards. Despite the doji reversal candle on Thursday with price following through to the downside, yesterday closed at the highest price in 2 months, most notably above $24K, after finding support from just above the local accumulation zone. While this has yet to confirm a break-out to higher levels, price is looking bullish again short-term even without much volume during the weekend period.  With price finding support from the 20 MA on the 4hr, and all it's MAs rising in bullish formation, the short-term time-frame is equally as bullish as the daily chart. Support remains the same around $23K accumulation zone (volume point of control) where the current support trend-line lies, as price is now attempting to confirm a break-out of the ascending triangle with a +20% target to the upside to around $29K. 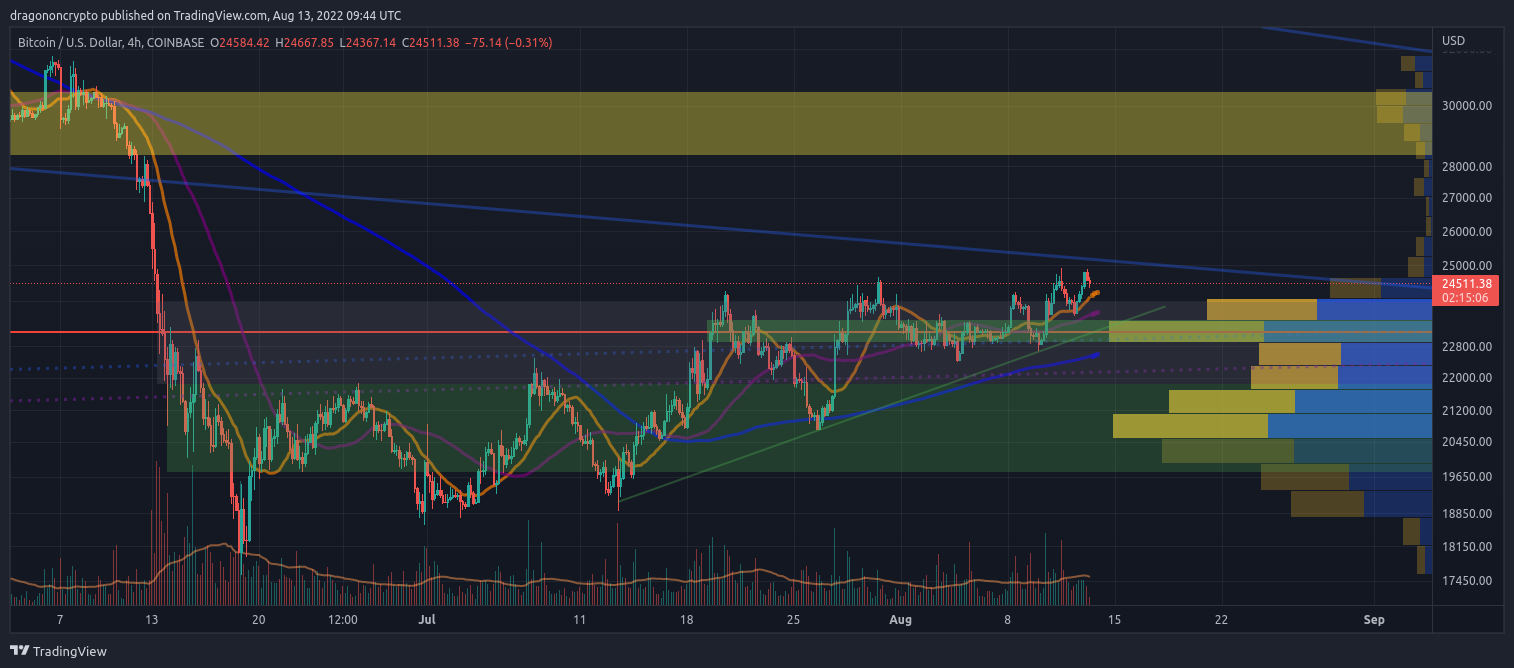 With the weekly chart due to close it's third consecutive week above the 200 WMA (~$23K), the immediate target next week would be the 20 Week MA that is fast declining and will be priced around $28K, though based on previous bear market comparisons, I'm not expecting this to act as strong resistance, but more so slow down the price from immediately moving higher with some consolidation. 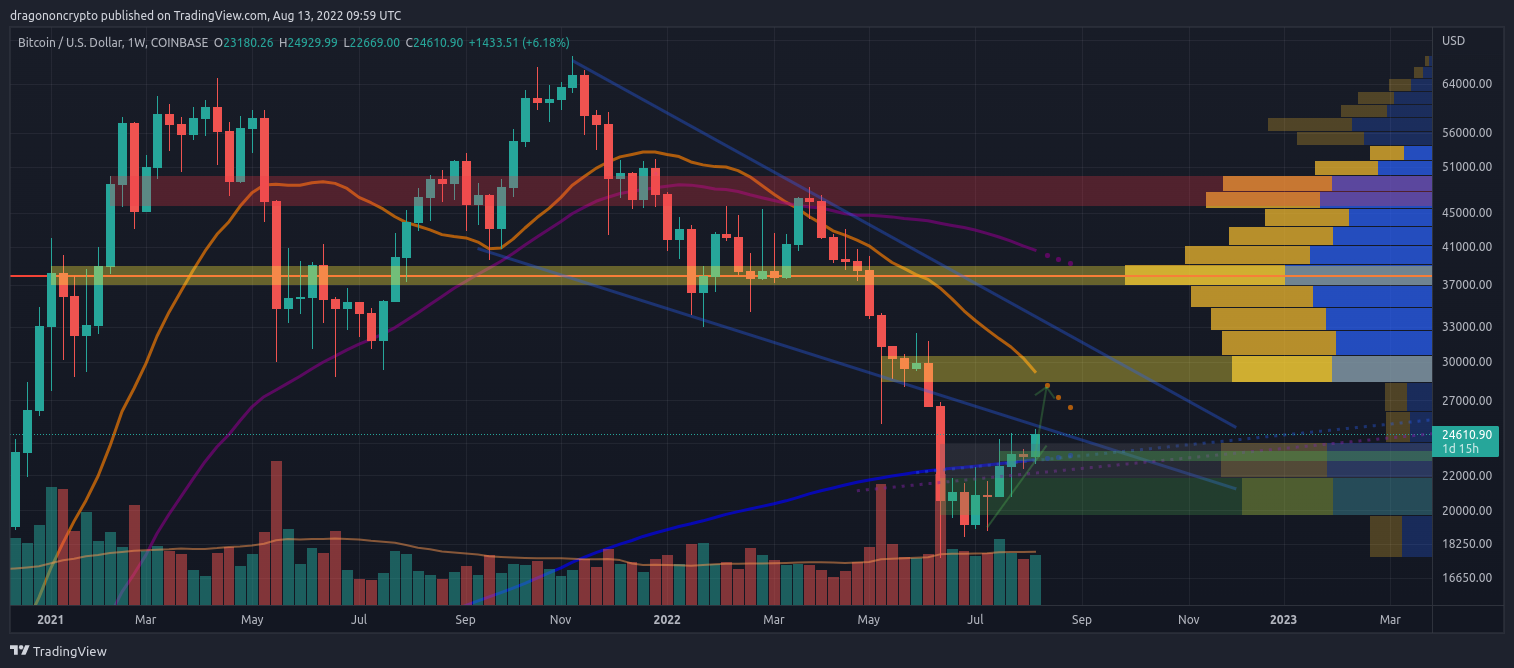 Many saw continued rejection from $24K levels as bearish for some strange reason, but after 4 rejections, it seems price has finally broken through this resistance level as it became weaker over the past few weeks. While in the short-term price has formed a double top around $24.9K, as sellers front-run $25K, this simply (at best) gives another dip buying opportunity before further upside it seems. |
|
|
|
dragonvslinux (OP)
Legendary
Offline
Activity: 1666
Merit: 2204
Crypto Swap Exchange
|
|
August 14, 2022, 09:21:25 AM
Last edit: August 14, 2022, 09:32:24 AM by dragonvslinux |
|
Support remains the same around $23K accumulation zone (volume point of control) where the current support trend-line lies On the 4hr price remains bullish, however there is an argument forming for a bearish rising wedge, given price has broken through the $24K resistance level but failed to move higher and formed bearish divergence. While this could just be weekend price action and lack of momentum, the target for a break-down would be around $20.8K long-term volume point of control if $23K local accumulation level and support trend-line is lost as support. It's worth noting the support trend-line can be easily modified to still include three touch-points at candle closes as low as $23K if necessary, excluding the most recent wick. 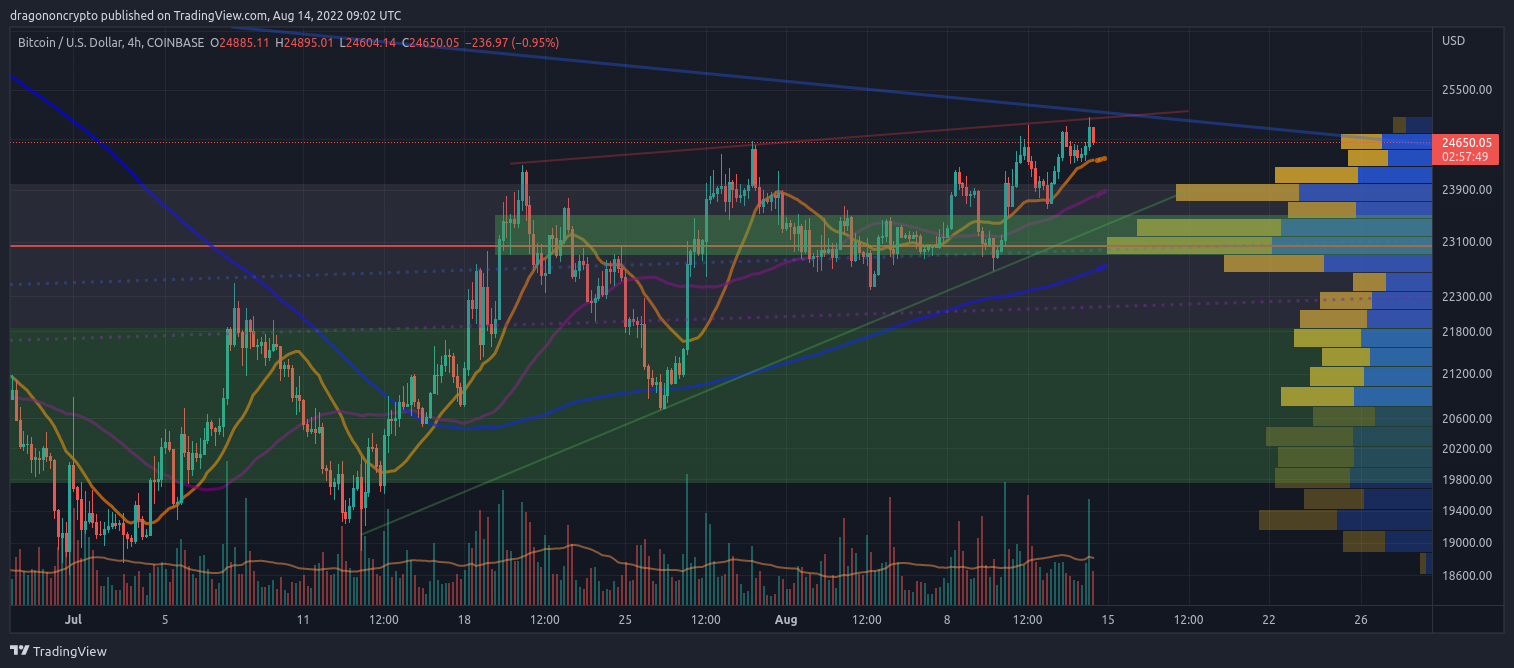 While this has yet to confirm a break-out to higher levels, price is looking bullish again short-term even without much volume during the weekend period. Not much change on the daily chart though price has closed a second consecutive candle above the $24K resistance level, even if only to get rejected by $24.5K. Ideally this is a slow break-out of an ascending triangle with a target around $29K, but there remains a lack of volume and higher prices (>$25K) to confirm such a break-out at present. Fortunately the 50 Day MA now lies at $22K level for support. Realistically price will need to hold $24K break-out level and previous resistance level and turn it into support for the ascending triangle to remain in tact which remains possible if bears fail to push prices lower. 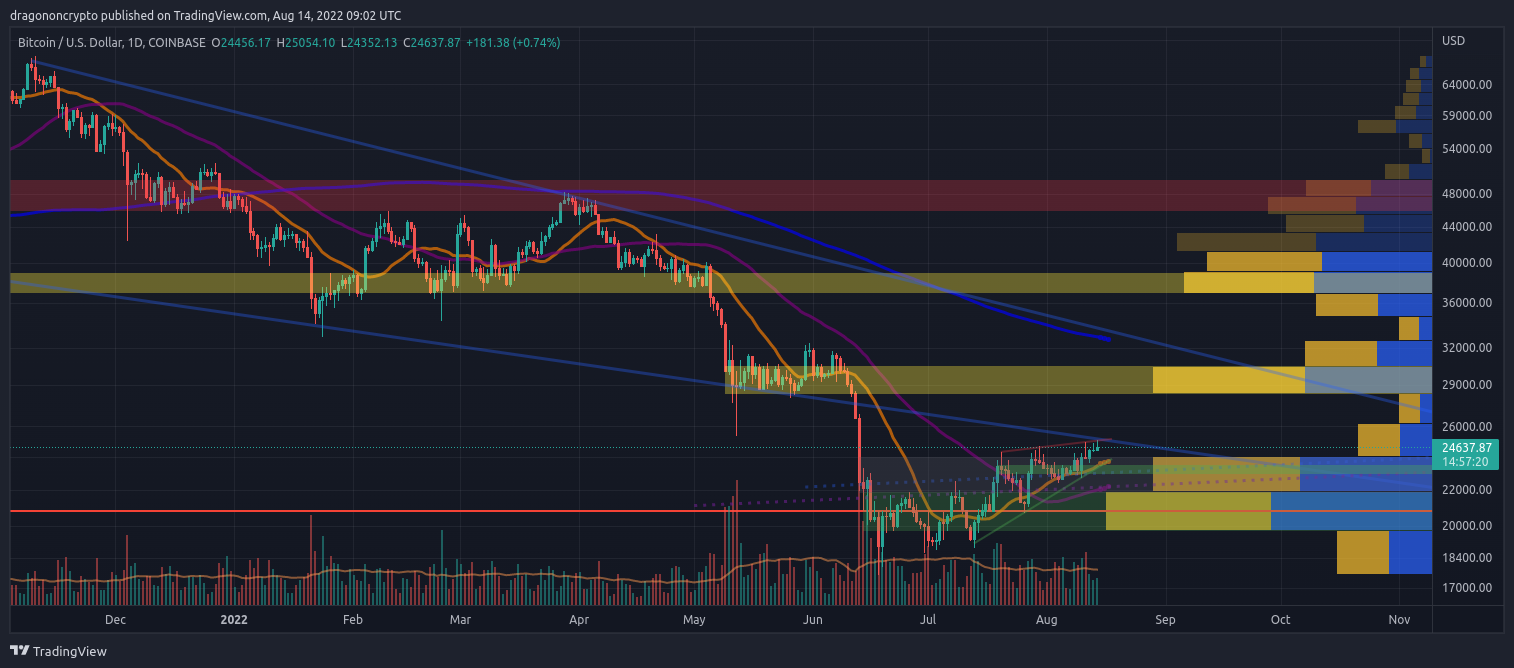 With the weekly chart due to close it's third consecutive week above the 200 WMA (~$23K), the immediate target next week would be the 20 Week MA that is fast declining and will be priced around $28K The weekly chart is otherwise due to close strong today at a new higher close again above the 200 WMA, though re-testing the 200 WMA for a third week around $23K remains likely if price consolidates further. Many saw continued rejection from $24K levels as bearish for some strange reason, but after 4 rejections, it seems price has finally broken through this resistance level as it became weaker over the past few weeks. While still remaining bullish short to mid-term now $24K resistance levels have been broken, I'm remaining sceptical of the breakout that lacks volume and price confirmation. With the pattern of early in the week corrections before higher prices in recent weeks, I'm inclined to think a correction back to $23K support levels and 200 WMA before higher prices is in order. Unfortunately this would likely negative the break-out of the ascending triangle and further confirm a bearish rising wedge pattern, therefore re-testing the main accumulation zone between $21K and $22K can't be ruled out at this point if $23K is lost as support. In summary, despite only really being bullish these past two weeks since the 200 WMA has been reclaimed, for the first time this month I see an argument for a deeper price correction around ~15% to $21K to $22K accumulation zone, if critical support is broken. Despite this, I still think price will rebound to upside relatively quickly finding support from the accumulation zone as well as 50 Day MA. |
|
|
|
dragonvslinux (OP)
Legendary
Offline
Activity: 1666
Merit: 2204
Crypto Swap Exchange
|
|
August 14, 2022, 09:44:19 AM |
|
As price today retests $22.5K, $500 short of the 200WMA, the Weekly RSI is now attempting to leave oversold conditions, for the first time since 2018: 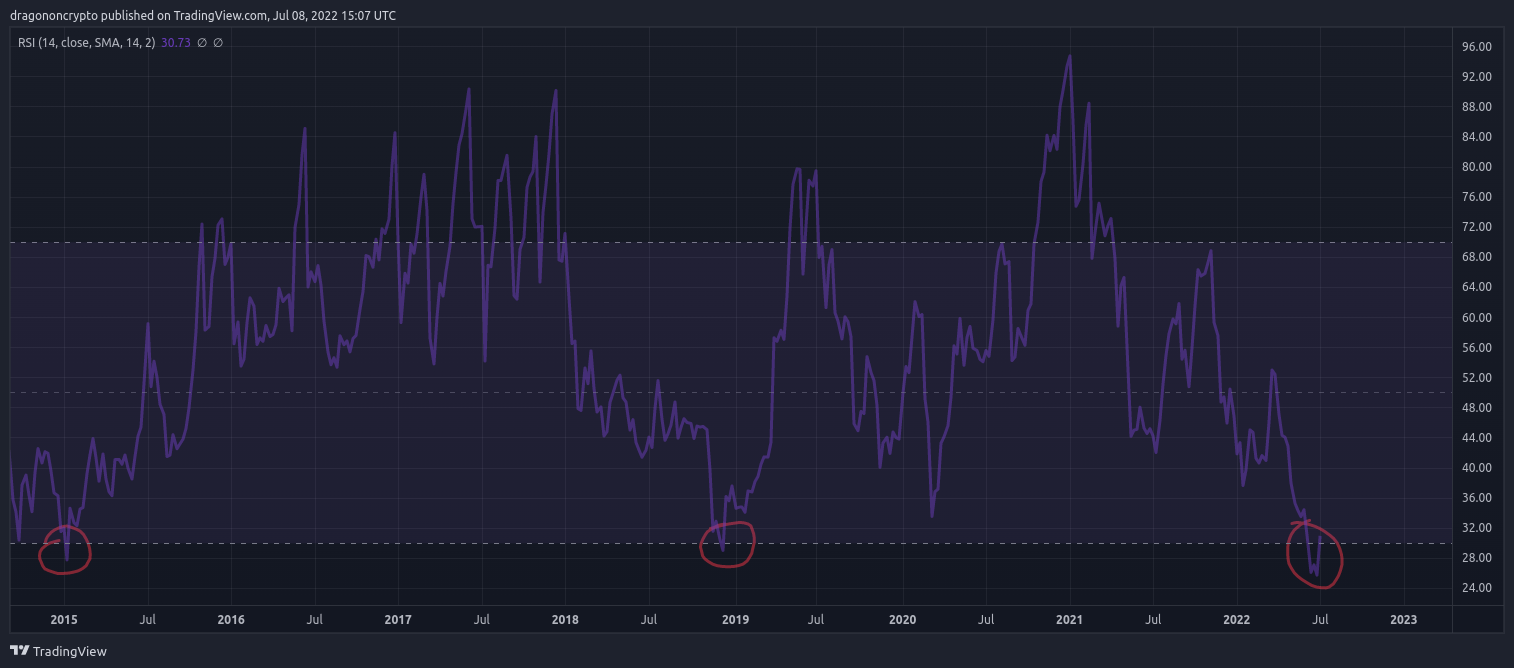 As an update from the original analysis of the RSI leaving oversold conditions. Despite initial rejection in early July, the weekly RSI did confirm a break-out outside of oversold territory (<30) a couple of weeks later at the same price of $22.5K. This level was then turned into new support a few weeks later. For reference sake, the RSI this week is now at 38.4 (though not confirmed with a close at this level yet). 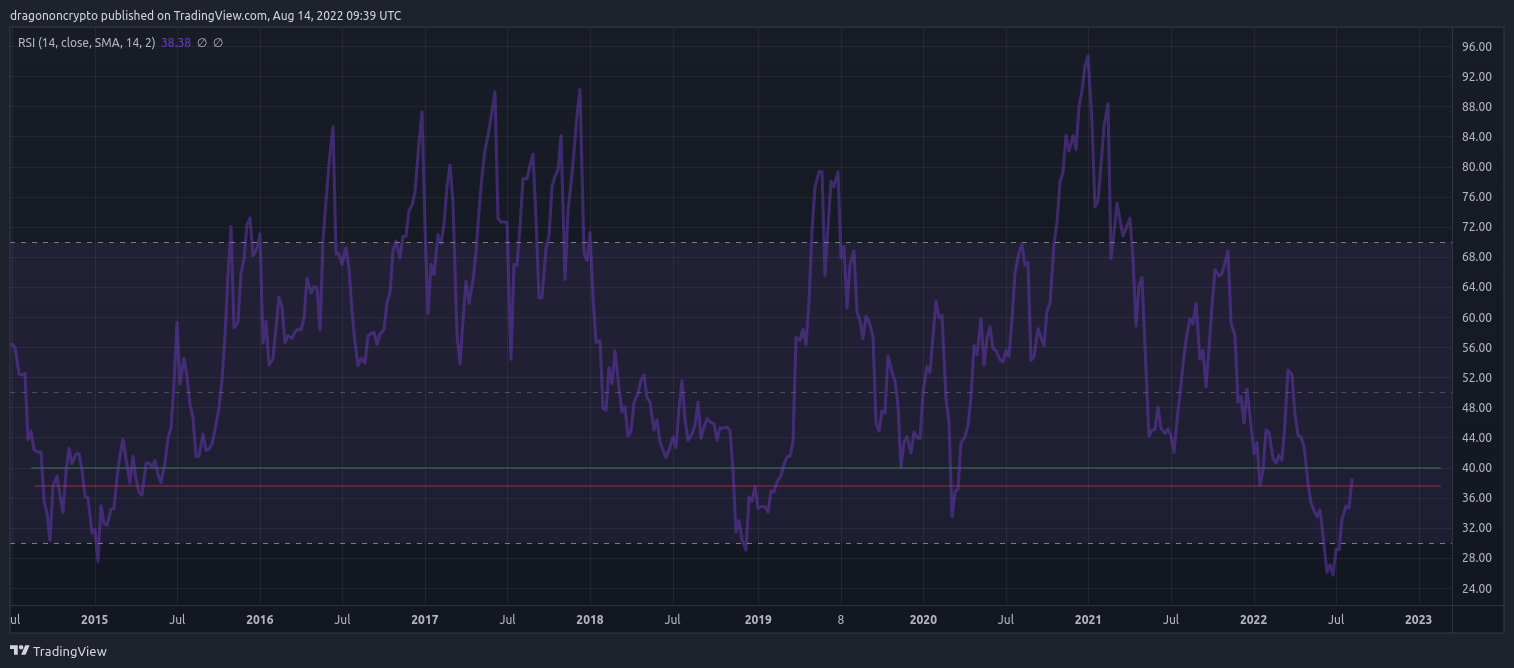 I referenced it elsewhere (can't remember where), other than leaving oversold territory, that 37.5 was arguably another critical level of the RSI in order to confirm a trend reversal (red line). This is a level where further upside has occurred once this level has beeen breached such as in 2019 as well as 2015 (after initially entering oversold conditions). This could arguably also be around 35, the mid-point of bearish price strength. It's also worth noting that despite the relatively tame price action in recent weeks, between $22K and $25K, the RSI is increasing fast and close to crossing into neutral territory (40 - green line). This would officially confirm the bearish momentum as passed, even if not necessarily confirming bullish momentum either, as the likelihood of further consolidation at higher levels remains strong (and has yet to be seen). |
|
|
|
dragonvslinux (OP)
Legendary
Offline
Activity: 1666
Merit: 2204
Crypto Swap Exchange
|
|
August 15, 2022, 11:06:48 AM |
|
On the 4hr price remains bullish, however there is an argument forming for a bearish rising wedge, given price has broken through the $24K resistance level but failed to move higher and formed bearish divergence. With price again getting rejected from $25K today, the bearish rising wedge is further confirming itself with the previously mentioned target of around $20.8K (previous support and volume point of control). Breaking below $24K will further invalidate the bullish ascending triangle break-out with a target of +20% to $29K while price currently holds onto to the 50 MA in the hope of continued upside (or re-tests of resistance). 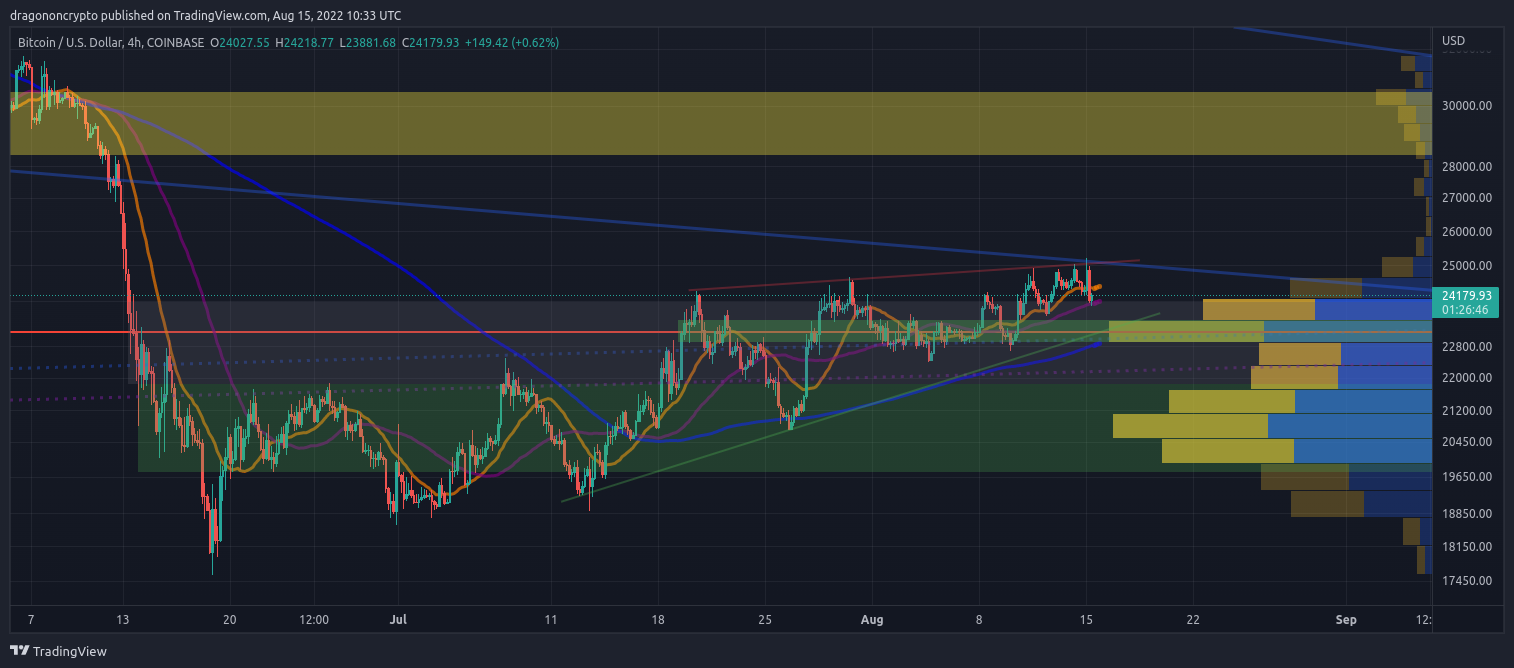 Realistically price will need to hold $24K break-out level and previous resistance level and turn it into support for the ascending triangle to remain in tact which remains possible if bears fail to push prices lower. On the daily chart the situation becomes a a bit clearer. Price has failed to close above $24.5K for the third consecutive day while today is forming another doji reversal candle, indicating a further correction. Price is also now finding resistance from the 100 Day MA (that I haven't previously been charting), but appears relevant when looking at price action back in March around this level, that of rejection before finding support at lower levels. Additionally the rejection comes where the long-term support trend-line of the previous wedge pattern remains, suggesting it has become new resistance for now. 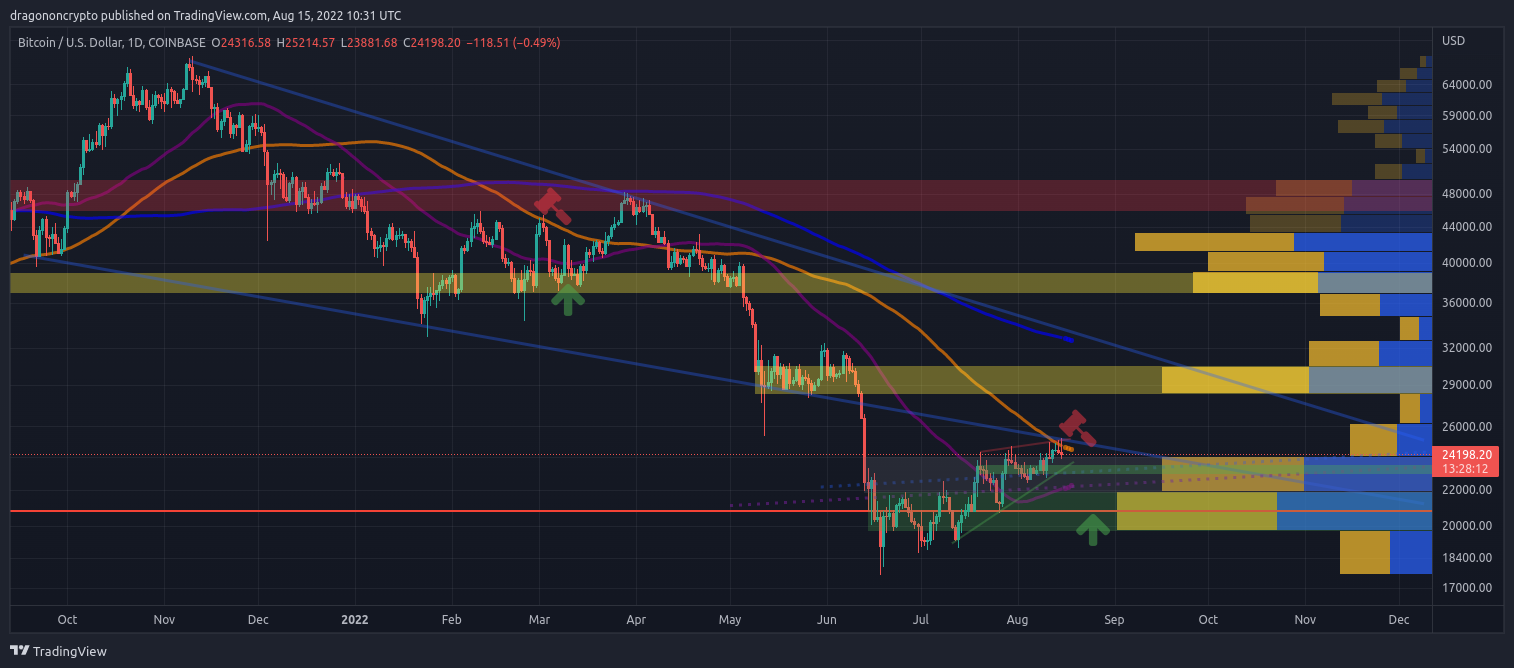 With similar price movement to that of March around the 100 Day MA would look like this, there are some alternative fractals in the immediate term to consider, if in fact the bottom is in and this isn't bearish consolidation before lower lows. Typically rejection from a bearish trending MA will bring prices down to the lower time-frame rising MA, such as the 50 Day around $22K, there still remains a reasonable possibility of holding the 200 WMA as immediate support and instead consolidating around $23K local accumulation zone. While keeping open-minded, breaking the support trend-line to the downside would more likely see $22K prices than further consolidation around $23K, even if the latter would be very bullish (negating the bearish rising wedge pattern). 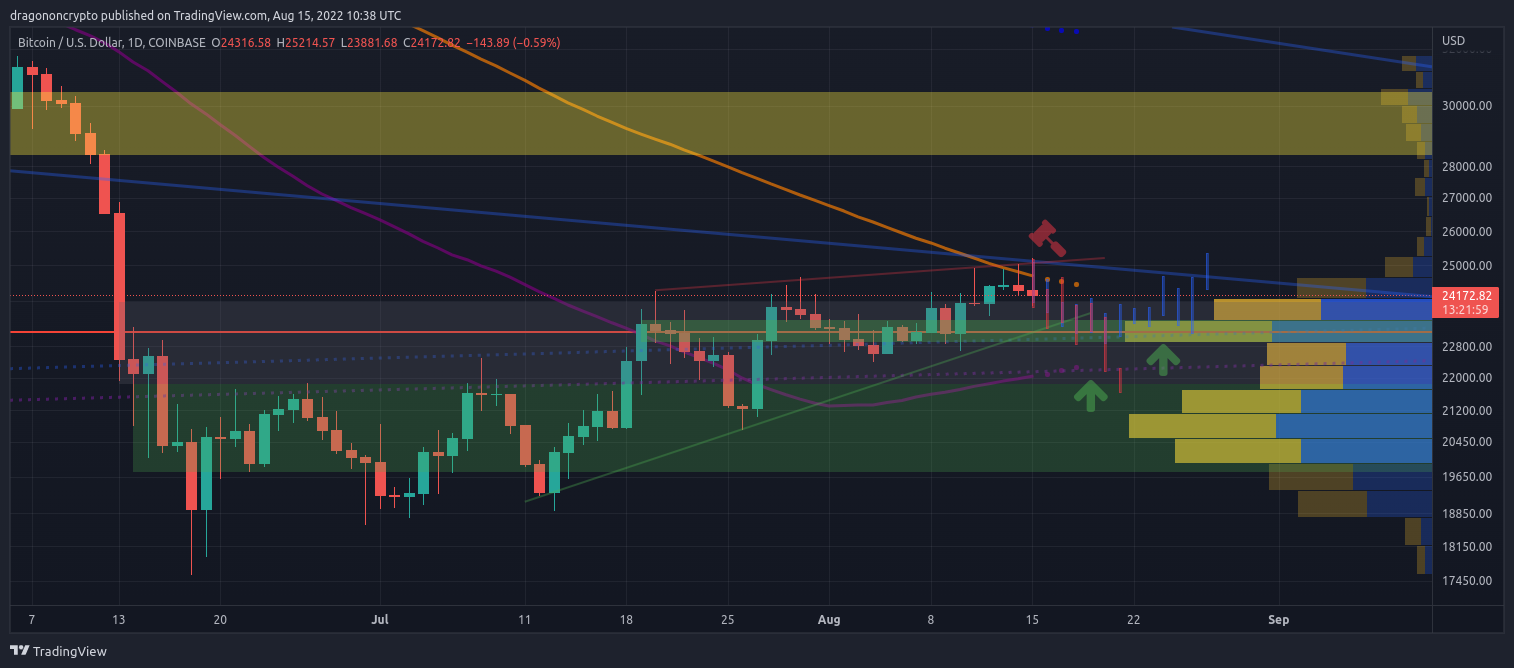 The weekly chart is otherwise due to close strong today at a new higher close again above the 200 WMA, though re-testing the 200 WMA for a third week around $23K remains likely if price consolidates further. Despite the short-term bearish outlook on shorter-term time-frames, the Weekly closed it's third consecutive week above the 200 WMA by +5% further confirming it as support for now. Hence holding $23K this week remains more than possible, even with prices falling to $21K or $22K levels given the shorter-term bearish patterns in play. With the pattern of early in the week corrections before higher prices in recent weeks, I'm inclined to think a correction back to $23K support levels and 200 WMA before higher prices is in order. TL:DRI see one of a few things happening next week:
1. Price holds $24K (previous resistance) and turns it into support, thus confirming bullish ascending triangle break-out with a measured move target of +20% to $29K (UP)
2. Price breaks below local accumulation zone of $23K and support trend-line, confirming a bearish rising wedge break-down back down to ~$21K prices (DOWN)
3. Price holds $23K accumulation zone / 200 WMA and consolidates further within a bearish rising wedge pattern before making a decision on up or down. |
|
|
|
dragonvslinux (OP)
Legendary
Offline
Activity: 1666
Merit: 2204
Crypto Swap Exchange
|
|
August 16, 2022, 08:45:18 AM |
|
Realistically price will need to hold $24K break-out level and previous resistance level and turn it into support for the ascending triangle to remain in tact which remains possible if bears fail to push prices lower. With price again getting rejected from $25K today, the bearish rising wedge is further confirming itself with the previously mentioned target of around $20.8K (previous support and volume point of control). Today bulls are again attempting to defend $24K on the 4hr chart, in order to turn previous resistance into new support, but otherwise struggling to bounce back to the upside from the 50 MA. Immediate support remains at previous accumulation zone of $23K, where the 200 MA as well as 200 WMA are priced. Failure to hold this level will likely see price re-test long-term accumulation zone of $20K to $22K.  Price has failed to close above $24.5K for the third consecutive day while today is forming another doji reversal candle, indicating a further correction. Yesterday confirmed another doji reversal candle, indicating the price is yet again getting rejected from higher levels. While the bears are struggling to push prices below $24K, the support level is none the less becoming weaker as $23K becomes more likely in the near future, in order to confirm this accumulation level as new support with a higher low. Failing that, a return to the 50 Day MA @ $22.1K becomes likely. 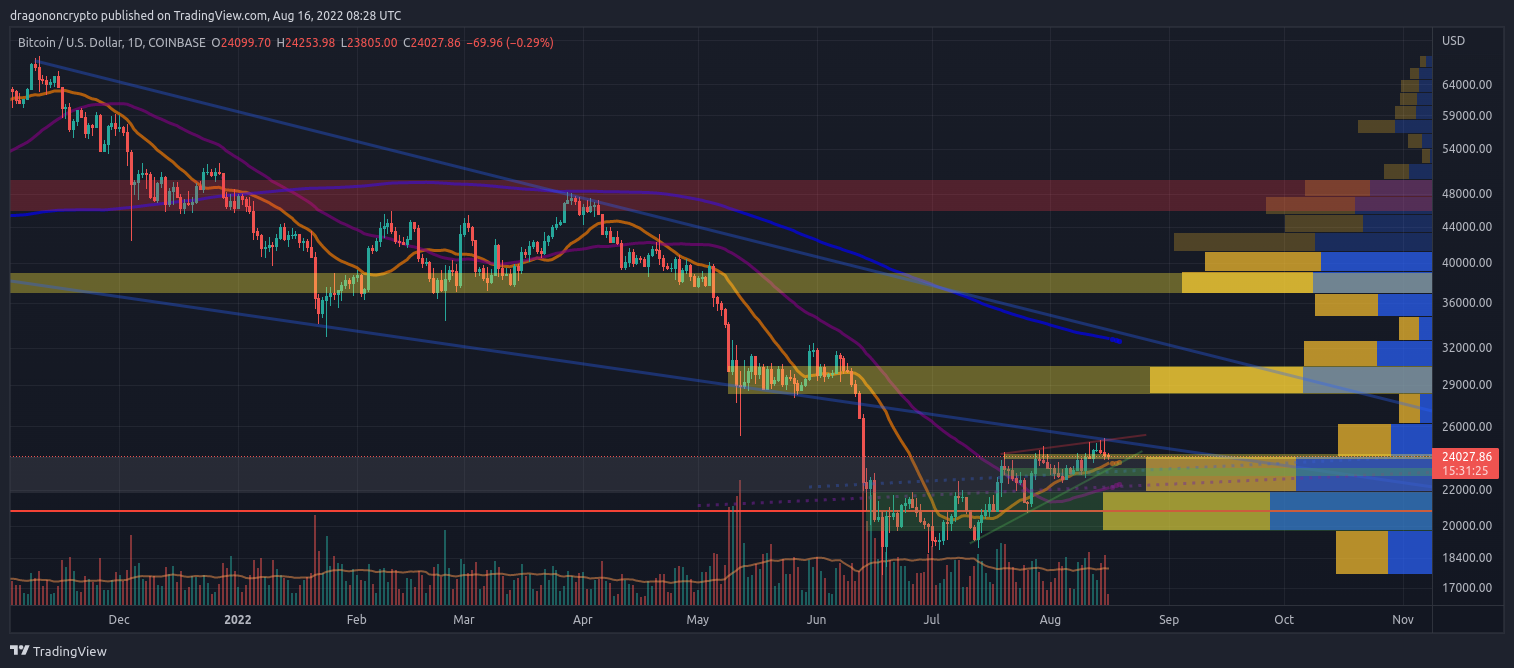 With the pattern of early in the week corrections before higher prices in recent weeks, I'm inclined to think a correction back to $23K support levels and 200 WMA before higher prices is in order. |
|
|
|
dragonvslinux (OP)
Legendary
Offline
Activity: 1666
Merit: 2204
Crypto Swap Exchange
|
|
August 17, 2022, 10:37:16 AM |
|
Today bulls are again attempting to defend $24K on the 4hr chart, in order to turn previous resistance into new support, but otherwise struggling to bounce back to the upside from the 50 MA. Immediate support remains at previous accumulation zone of $23K, where the 200 MA as well as 200 WMA are priced. Failure to hold this level will likely see price re-test long-term accumulation zone of $20K to $22K. As the immediate accumulation/distribution zone has become weaker, bulls have so far failed to turn $24K into new support as price moves below the 50 MA on the 4hr. With the 200 MA priced around $23K, this remains the area of support price will need to hold in order to continue to the upside, or maintain higher prices. Otherwise a re-test of lower levels previously mentioned becomes increasingly likely.  While the bears are struggling to push prices below $24K, the support level is none the less becoming weaker as $23K becomes more likely in the near future, in order to confirm this accumulation level as new support with a higher low. With the highest daily close just below $24.5K, the bears have now turned this into new resistance, close to the bearish trending 100 Day MA as price again forms another doji reversal candle near the highs. While the support trend-line remains in tact, breaking below $23K local accumulation increases the chances of a move back down to the 50 Day MA around $22K in order to re-test it as support. 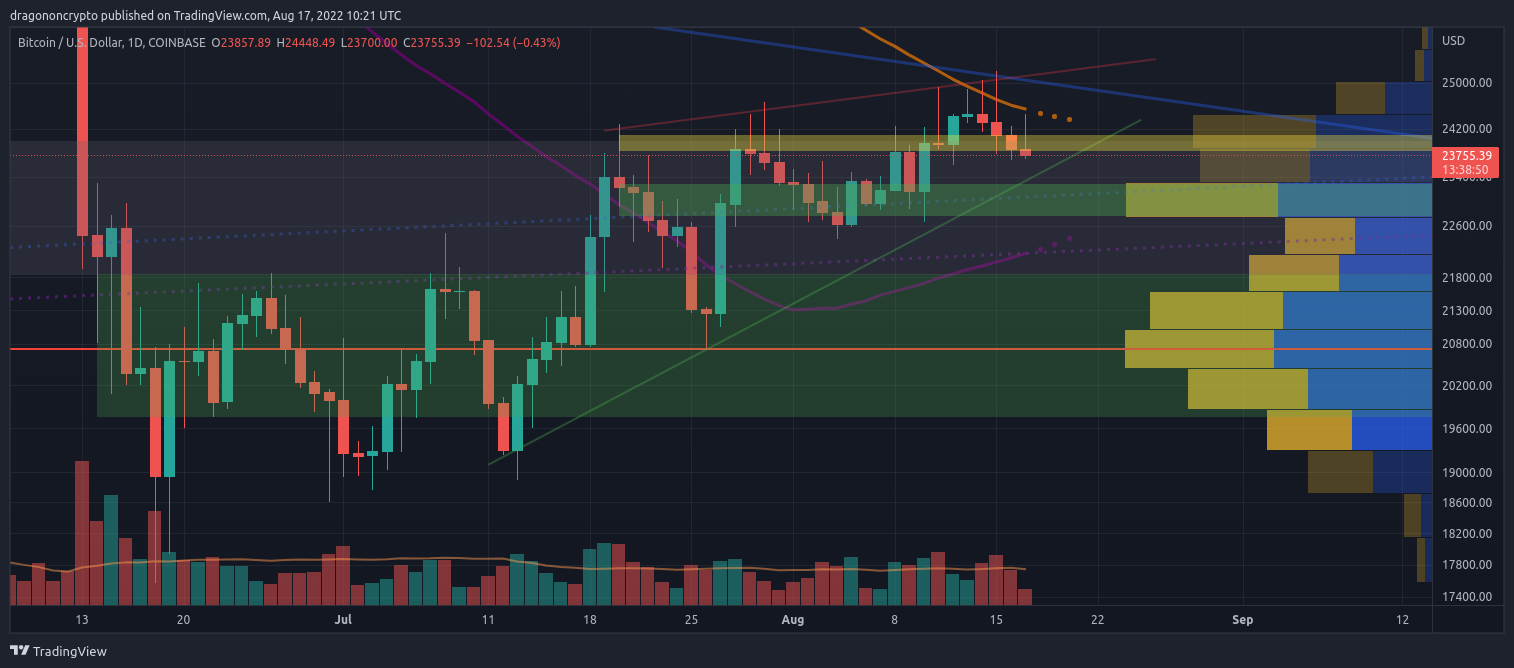 The original outlook therefore remains the same as price continues to correct, that of consolidation around $23K in order to invalidate the bearish rising wedge pattern which remains possible, or otherwise a break-down below the support trend-line of the wedge in order to re-test the long-term accumulation zone between $20K and $22K, where the the volume point of control lies around 21K, With the pattern of early in the week corrections before higher prices in recent weeks, I'm inclined to think a correction back to $23K support levels and 200 WMA before higher prices is in order. |
|
|
|
dragonvslinux (OP)
Legendary
Offline
Activity: 1666
Merit: 2204
Crypto Swap Exchange
|
|
August 18, 2022, 09:22:06 AM |
|
With the 200 MA priced around $23K, this remains the area of support price will need to hold in order to continue to the upside, or maintain higher prices. Otherwise a re-test of lower levels previously mentioned becomes increasingly likely. Today price is attempting to hold trend-line support of the bearish rising wedge close to the rising 200 MA. A break-down from the wedge remains around $21K, although there remains an argument for further consolidation around $23K as well as support from $22K, as shown on the daily chart. A volume point of control has now moved to $24K now confirming more distribution above than accumulation below. 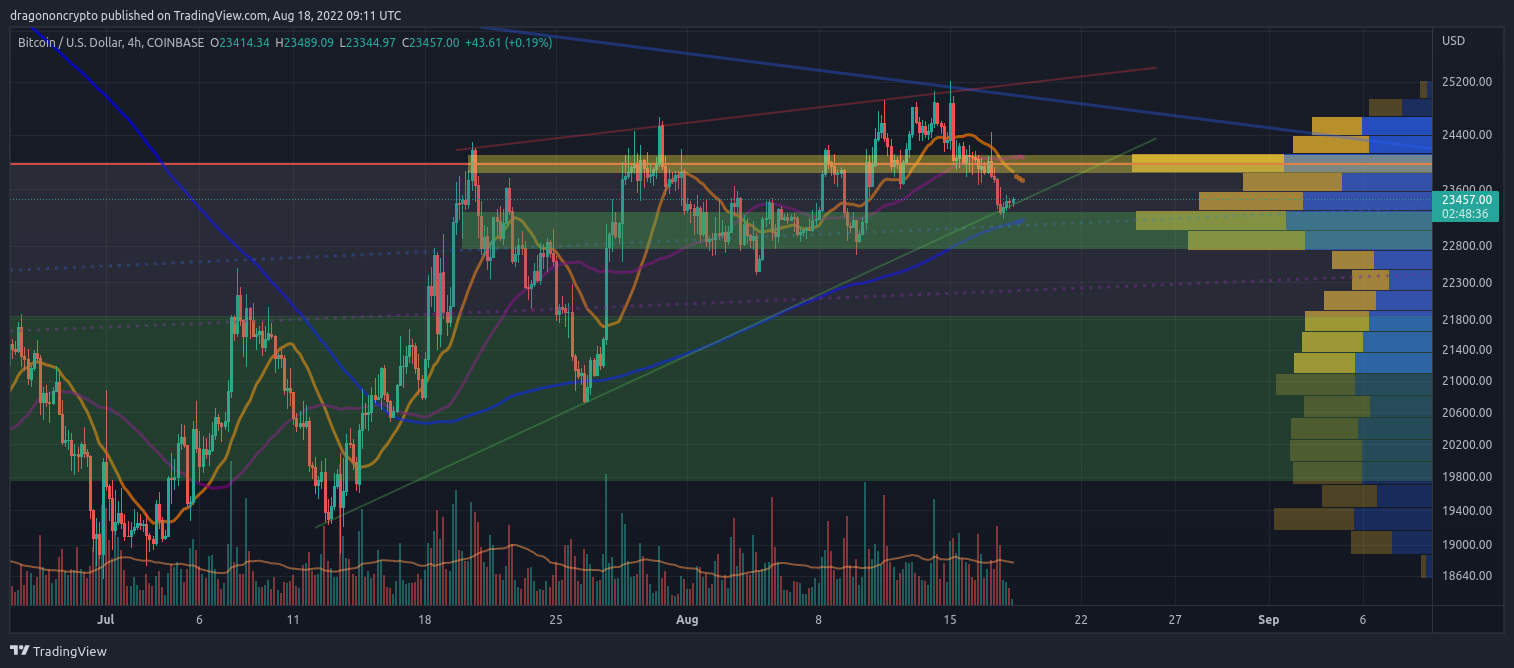 While the support trend-line remains in tact, breaking below $23K local accumulation increases the chances of a move back down to the 50 Day MA around $22K in order to re-test it as support. On the daily chart, price remains between $24.5K resistance (bearish down-trending 100 Day MA) and $22.2K (bullish rising 50 Day MA). Reclaiming a closing above $24.5K (+5%) would return the immediate bullish bias on this time-frame, while a break below $23K local accumulation would continue the bearish trend towards $22K with long-term accumulation average priced at $21K. 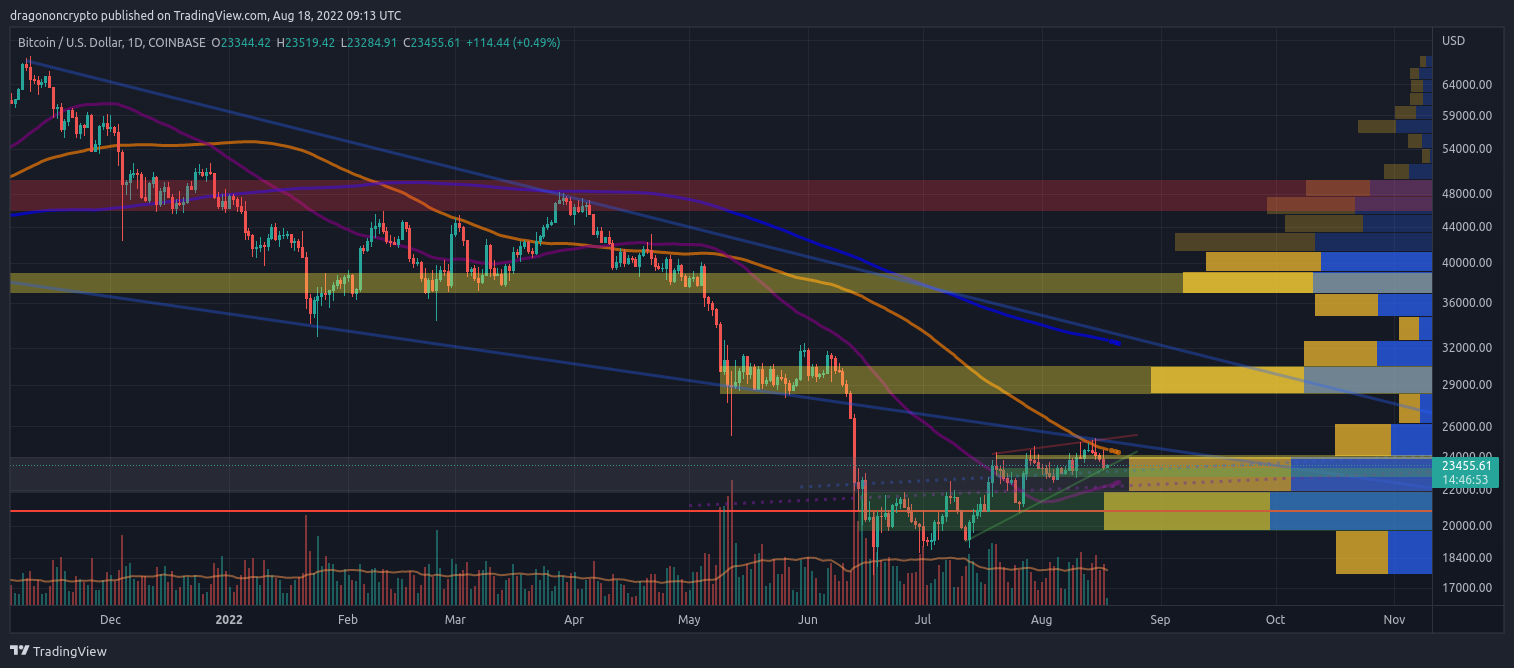 The original outlook therefore remains the same as price continues to correct, that of consolidation around $23K in order to invalidate the bearish rising wedge pattern which remains possible, or otherwise a break-down below the support trend-line of the wedge in order to re-test the long-term accumulation zone between $20K and $22K, where the the volume point of control lies around 21K, It's so far worth noting that price is currently following the previous corrective/consolidation pattern of -9% to $23K which is hopeful, as opposed to more aggressive bearish corrective fractals of -14% that would take prices below $22K. Either way, the type of correction will likely confirm itself in the coming days, dependant on holding $23K support level. With the pattern of early in the week corrections before higher prices in recent weeks, I'm inclined to think a correction back to $23K support levels and 200 WMA before higher prices is in order. |
|
|
|
dragonvslinux (OP)
Legendary
Offline
Activity: 1666
Merit: 2204
Crypto Swap Exchange
|
|
August 19, 2022, 11:02:49 AM |
|
With price again getting rejected from $25K today, the bearish rising wedge is further confirming itself with the previously mentioned target of around $20.8K (previous support and volume point of control). As emphasised throughout the week, breaking below the $23K level local accumulation level would most likely bring prices down to $22K previous resistance levels, with a target of long-term accumulation level around $21K. Now that this has happened relatively quickly, as expected with such break-down patterns and trend reversals, we can confirm the short-term bias favours the bears again. But for how long? 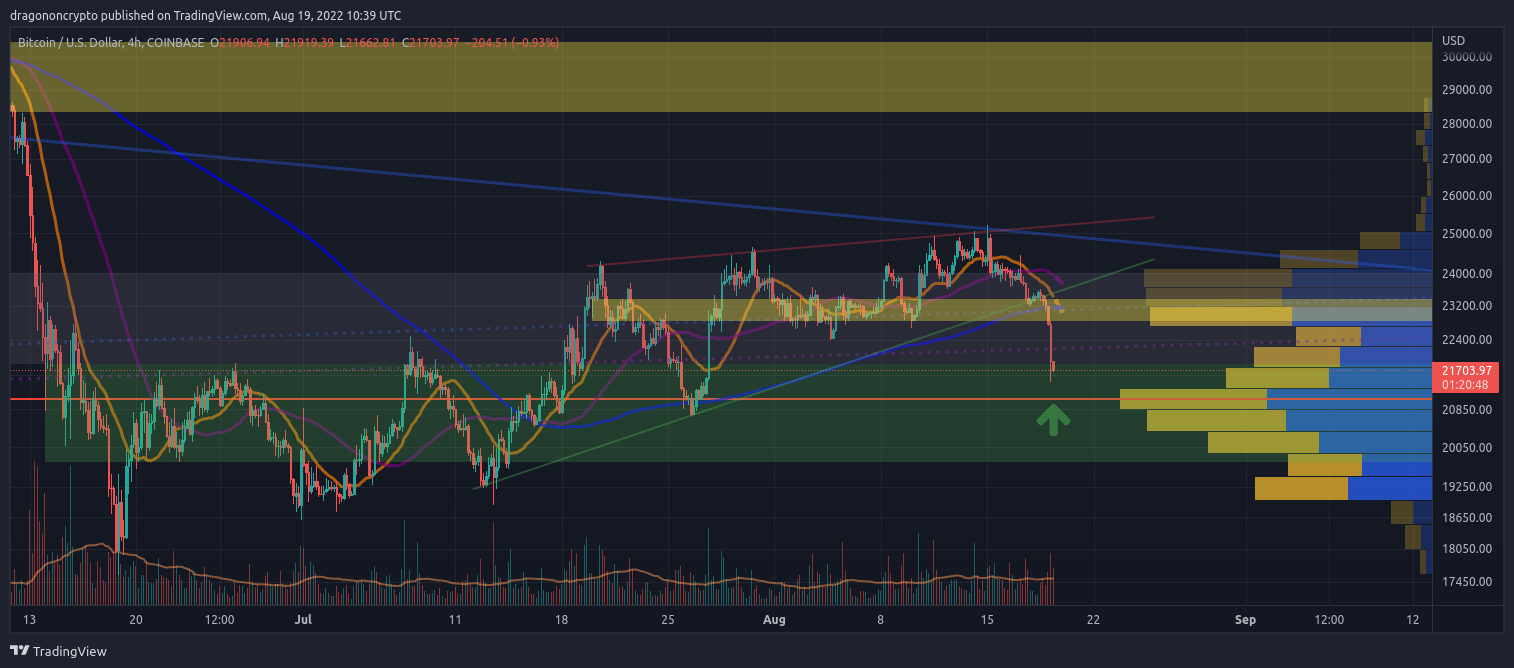 a break below $23K local accumulation would continue the bearish trend towards $22K with long-term accumulation average priced at $21K. Despite failing to find any buyers around the 50 Day MA, priced at $22.2K, there still remains the long-term accumulation level around $21K that will likely act as the "last line in the sand" for the bulls. Though the lower level of the accumulation zone around $20K can't be ruled out for any quick dips/wicks to the downside, failing to hold the volume point of control as support would turn my mid-term bias from bullish to bearish.  The current short-term positive outlook would be that price has already fallen enough to the downside in order to find support, despite not quite reaching the target of $21K. Similar to the move from $24K to $21K, as well as $22.5K to $19K prior to that, price has since corrected -14% from the swing high. Therefore it remains more than possible for price to quickly find support before continuing to rally to the upside.  While this may seem like a hopeful outlook now that $25K has been confirmed as a strong resistance level, similar price action occurred last month from the $22K resistance level, whereby after two -15% corrections, price quickly rallied back to the upside. I otherwise realise that for many it's a time to panic, but personally I see it as a time to remain cautious and wait for buyers to step in rather than catching a failing knife. On the weekly chart, after 6 weeks of bullish looking candles, this week looks set for bearish candle unless $23K can be reclaimed as support (where the 200 WMA lies). While unlikely it does remain possible, though I'm more inclined to think any immediate bullish price action would return next week, after what I believe will be a fake-out to the downside before returning to the $22K to $24K range. |
|
|
|
|


