dragonvslinux (OP)
Legendary

 Offline Offline
Activity: 1666
Merit: 2204
Crypto Swap Exchange

|
 |
August 20, 2022, 10:27:59 AM |
|
As emphasised throughout the week, breaking below the $23K level local accumulation level would most likely bring prices down to $22K previous resistance levels, with a target of long-term accumulation level around $21K. After high volume selling yesterday, the highest since the capitulation to $17.5K, price has now reached the break-down target of $20.8K volume point of control. Within the overall accumulation zone of $20K to $22K, price remains relatively neutral (but within a bear market) at this support level, despite being under the 50 Day MA that will now begin start to flatten out in order lose it's mid-term bullish bias.  Despite failing to find any buyers around the 50 Day MA, priced at $22.2K, there still remains the long-term accumulation level around $21K that will likely act as the "last line in the sand" for the bulls. On the 4hr, price is now between the local accumulation zone of $21K and the distribution zone of $23K. The 50 & 200 MAs are about to bear cross, confirming the end of bullish momentum on this time-frame, with the RSI reaching the lowest oversold conditions since June 13th. The possibility of continuing to the downside towards $20K remains high, unless bulls can recover the price back above $22K. 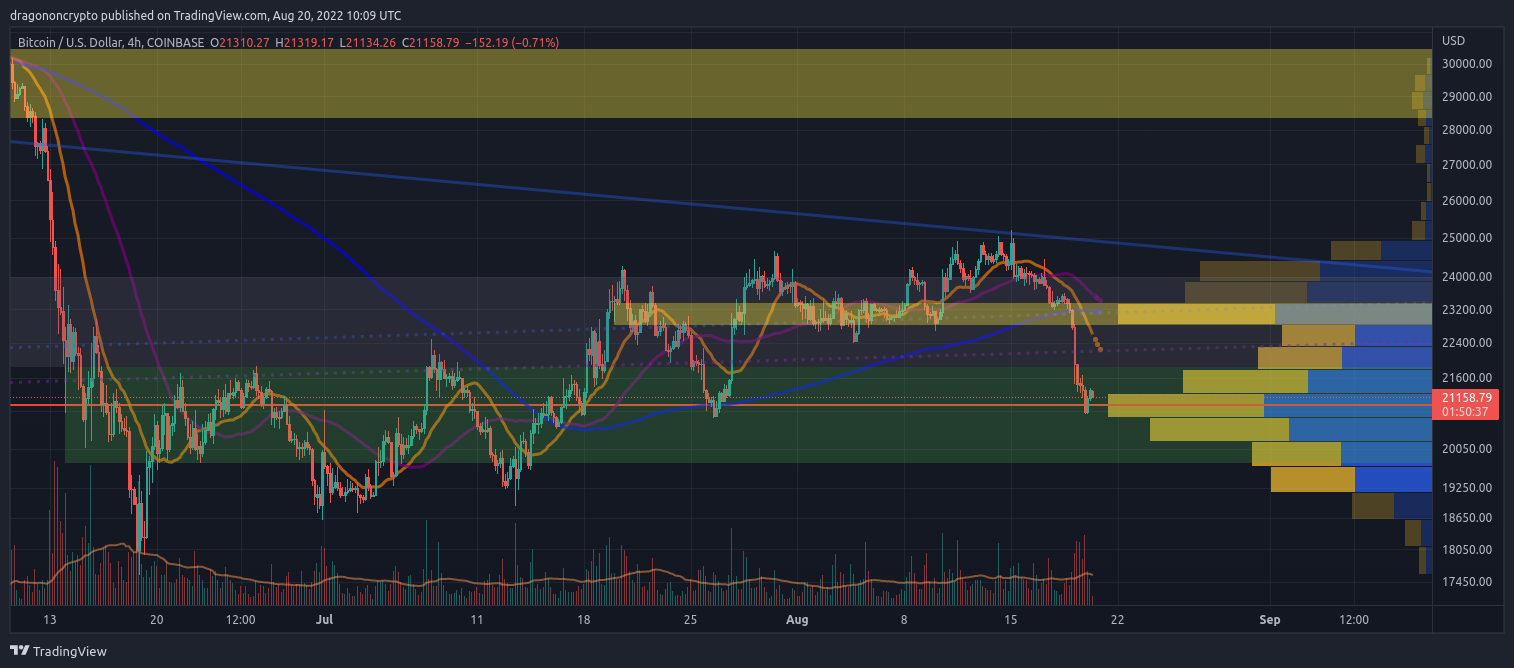 Similar to the move from $24K to $21K, as well as $22.5K to $19K prior to that, price has since corrected -14% from the swing high. As previously mentioned regarding this fractal, there remains a strong possibility of a V-shaped recovery, based on the previous fractal of a sort of rising triple top, before breaking resistance to the upside, however falling any lower than the current support level would negate this type of immediate recovery. Price has now corrected -17% from the swing high, similar to the early July correction of -16% from $22K strong resistance to $19K. 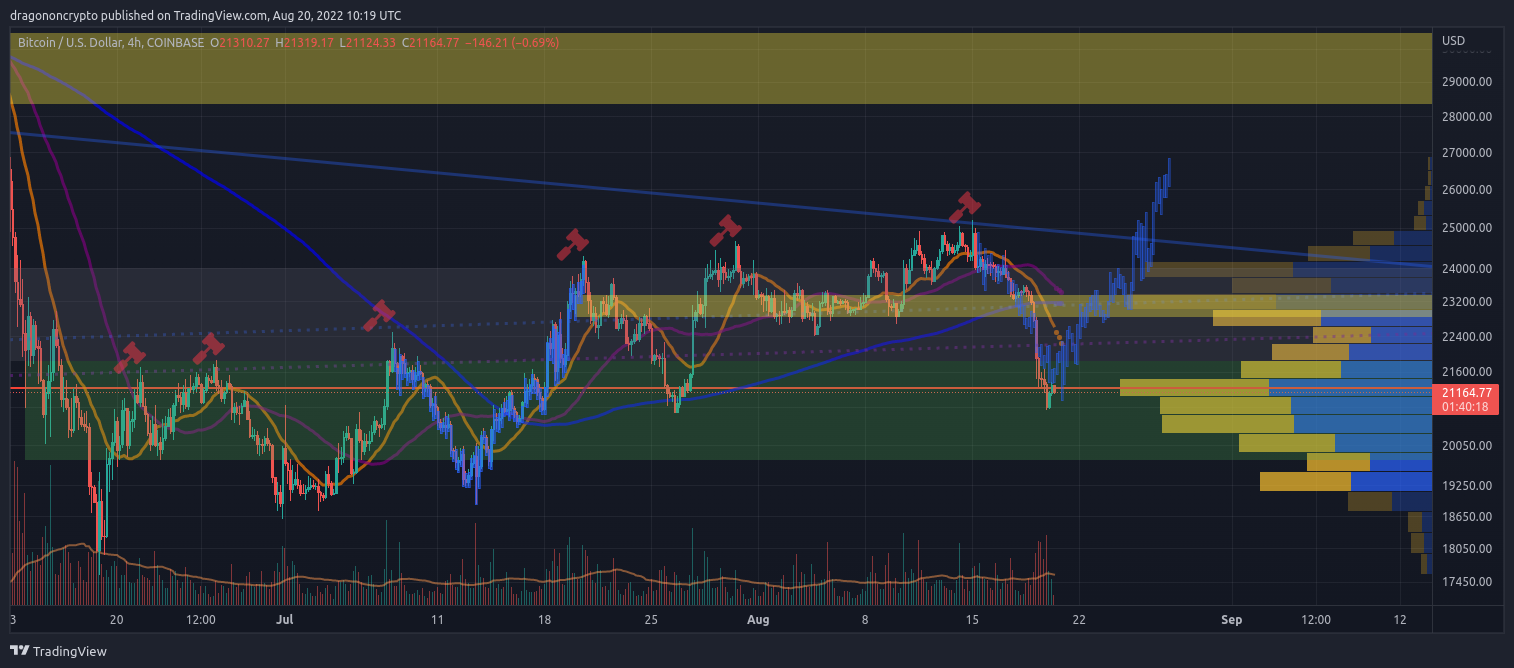 I otherwise realise that for many it's a time to panic, but personally I see it as a time to remain cautious and wait for buyers to step in rather than catching a failing knife. |
|
|
|
|
|
Advertised sites are not endorsed by the Bitcoin Forum. They may be unsafe, untrustworthy, or illegal in your jurisdiction.
|
|
|
dragonvslinux (OP)
Legendary
Offline
Activity: 1666
Merit: 2204
Crypto Swap Exchange
|
|
August 20, 2022, 10:40:00 AM |
|
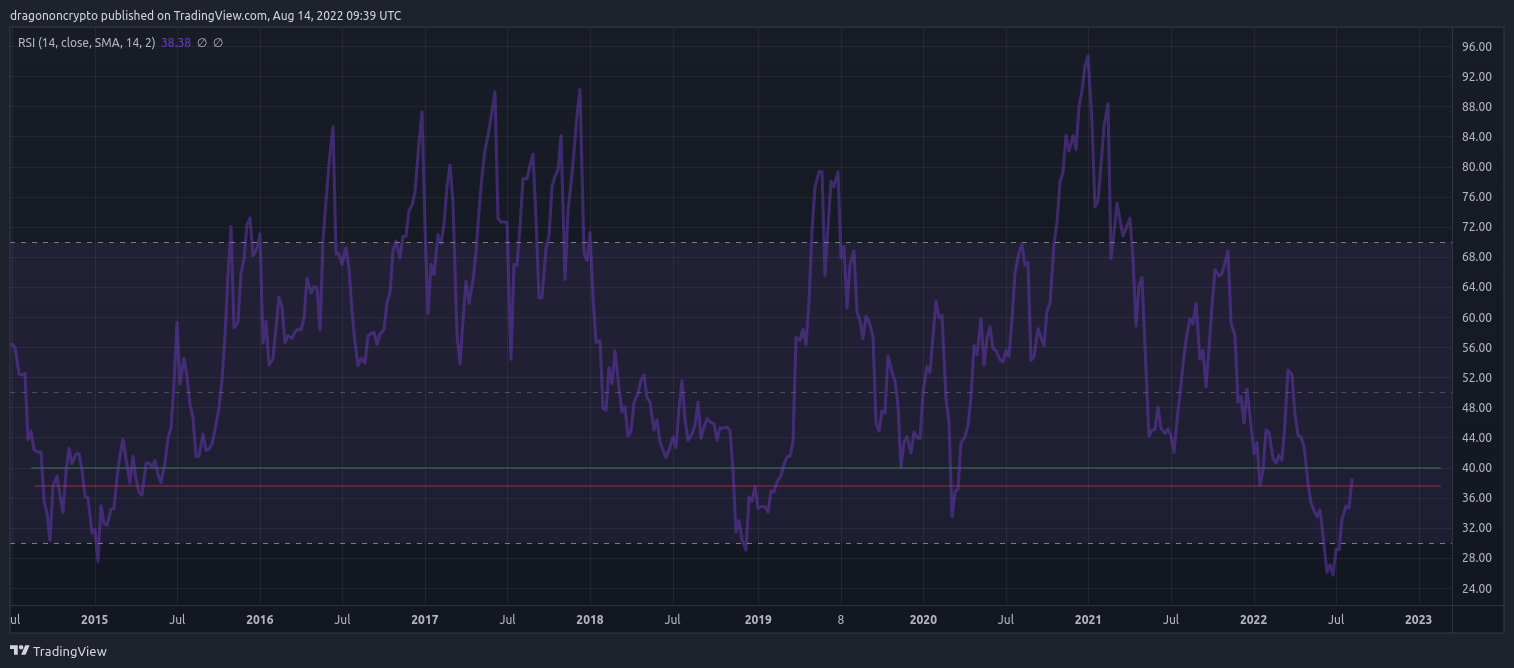 I referenced it elsewhere (can't remember where), other than leaving oversold territory, that 37.5 was arguably another critical level of the RSI in order to confirm a trend reversal (red line). As for a Weekly RSI update, last week price strength failed to close above 37.5, that remains relevant in the context of 2019 bear market. The RSI was initially rejected from this level and price saw a correction, with the trend reversal then confirmed above it. Currently this bear market has taken a similar path, that of being rejected by 37.5, with the hope of finding support around 34 this week, or risk falling lower to re-test oversold conditions, such as in 2015. Although far from an exact science, given in 2015 the re-test of price strength was much lower prior to a trend reversal (at 32), the patterns remain relevant today. 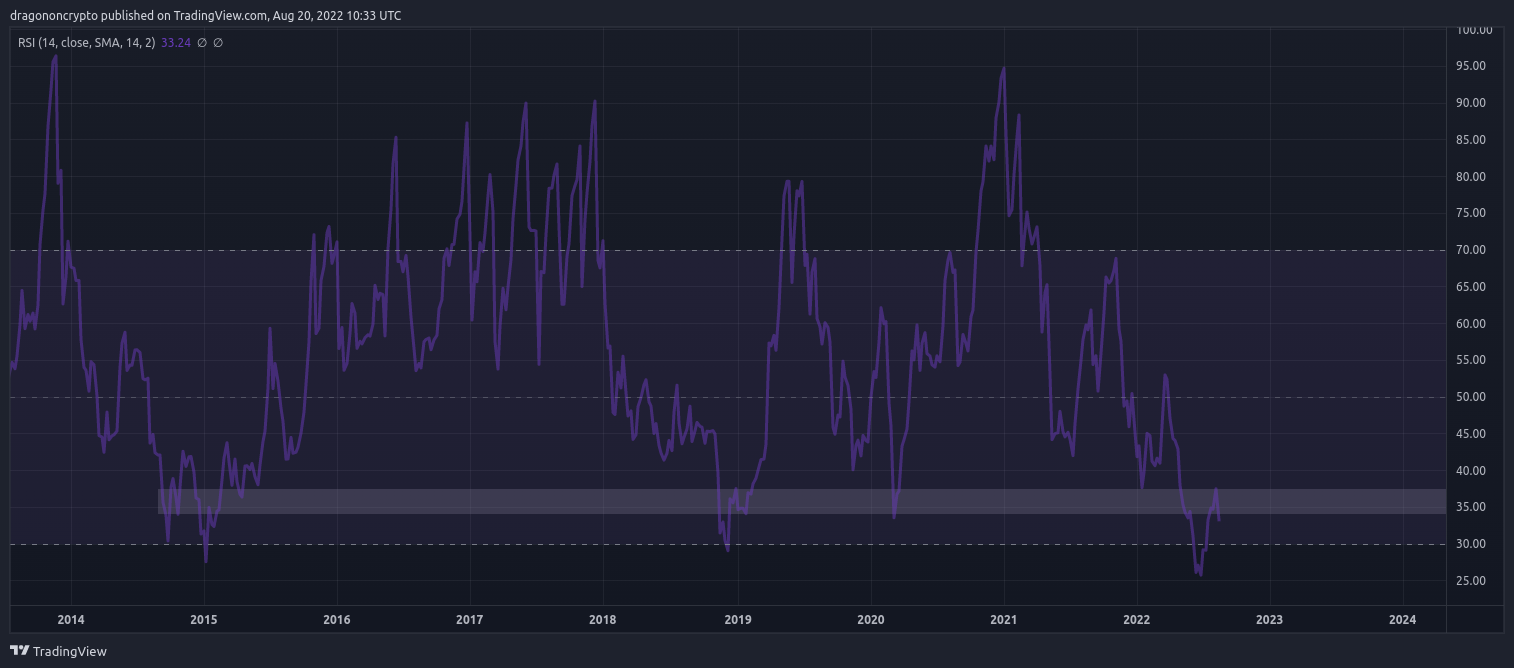 I still very much consider the bottom to be in, but as explained the RSI leaving oversold conditions doesn't confirm a trend reversal, only that the bottom is currently forming. |
|
|
|
globalpain
Full Member
 Offline
Activity: 1260
Merit: 103
The OGz Club
|
|
August 20, 2022, 12:34:07 PM |
|
The RSI indicator is indeed very helpful for predicting or analyzing the trend of a price,
here indeed the RSI of Bitcoin on a weekly time frame is still at 33, meaning it is already oversold,
but I think the trend will still fall below 30, and if the RSI is already at number 20 then that's the time for us to buy!
|
|
|
|
dragonvslinux (OP)
Legendary
Offline
Activity: 1666
Merit: 2204
Crypto Swap Exchange
|
|
August 20, 2022, 12:54:11 PM |
|
The RSI indicator is indeed very helpful for predicting or analyzing the trend of a price,
here indeed the RSI of Bitcoin on a weekly time frame is still at 33, meaning it is already oversold,
but I think the trend will still fall below 30, and if the RSI is already at number 20 then that's the time for us to buy!
33 means it's bearish, not oversold. <30 is oversold, 30-40 is bearish. For sure it could return to oversold conditions <30 which could provide another good buying opportunity. Bitcoin's Weekly RSI has never reached 20, only 25 at lowest (this year), but sure you could wait for 20 and it'd be a good buying opportunity if it happens, even if unlikely imo. |
|
|
|
dragonvslinux (OP)
Legendary
Offline
Activity: 1666
Merit: 2204
Crypto Swap Exchange
|
|
August 21, 2022, 11:55:22 AM |
|
After high volume selling yesterday, the highest since the capitulation to $17.5K, price has now reached the break-down target of $20.8K volume point of control. After reaching the break-down target of $20.8K, price has since found some buyers. Although far from a convincing higher low and support level, bulls have managed to avoid catastrophe by managing to hold this key level as support for now. With price only 2.5% away from $22K levels, re-confirming the $20K to $22K level as accumulation would return the bias in favour of the bulls for the mid-term. 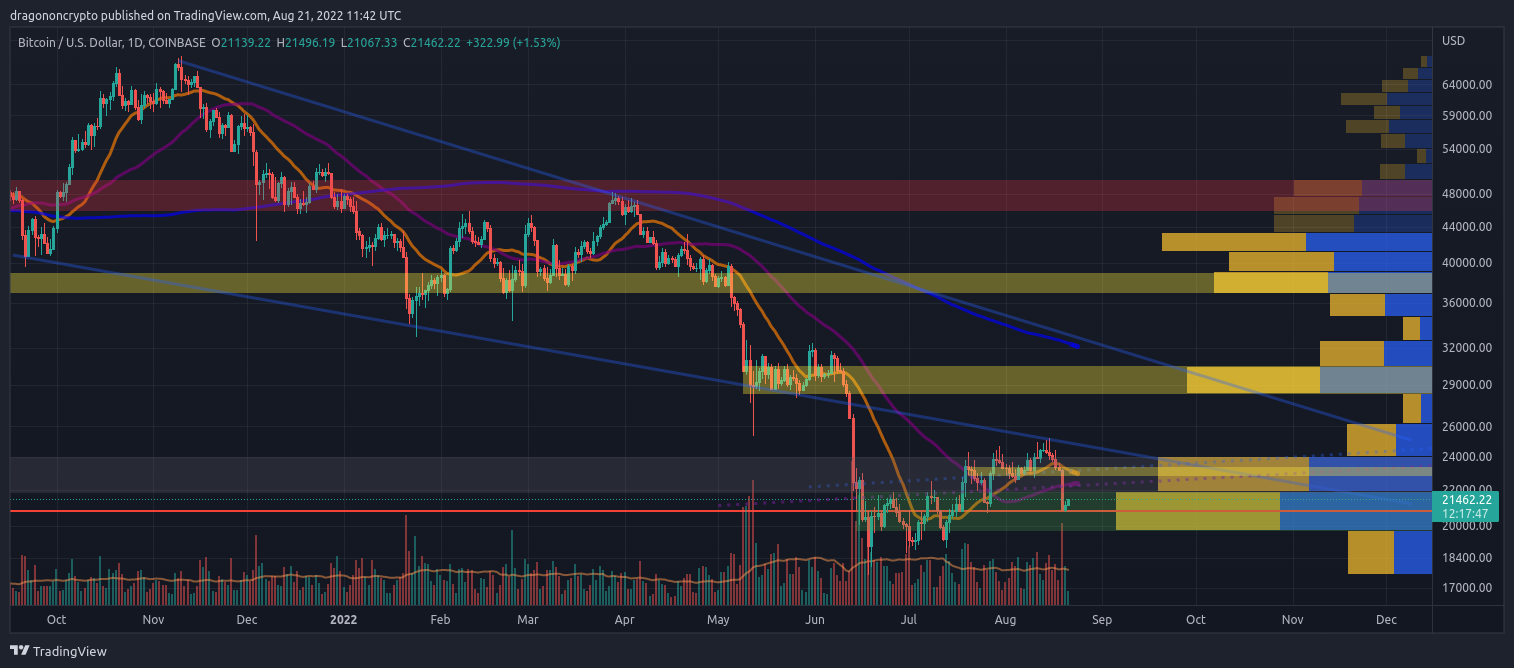 On the 4hr, price is now between the local accumulation zone of $21K and the distribution zone of $23K. With the 50 & 200 MAs crossing bearish, the 4hr chart isn't looking as hopeful as the Daily chart with price now in a range between local accumulation and distribution levels $21K and $23K, with the latter likely to act as new resistance where the 200 MA lies. After the RSI reached sub 15 levels, price has now returned to bearish territory, indicating a local low could have been formed for now. 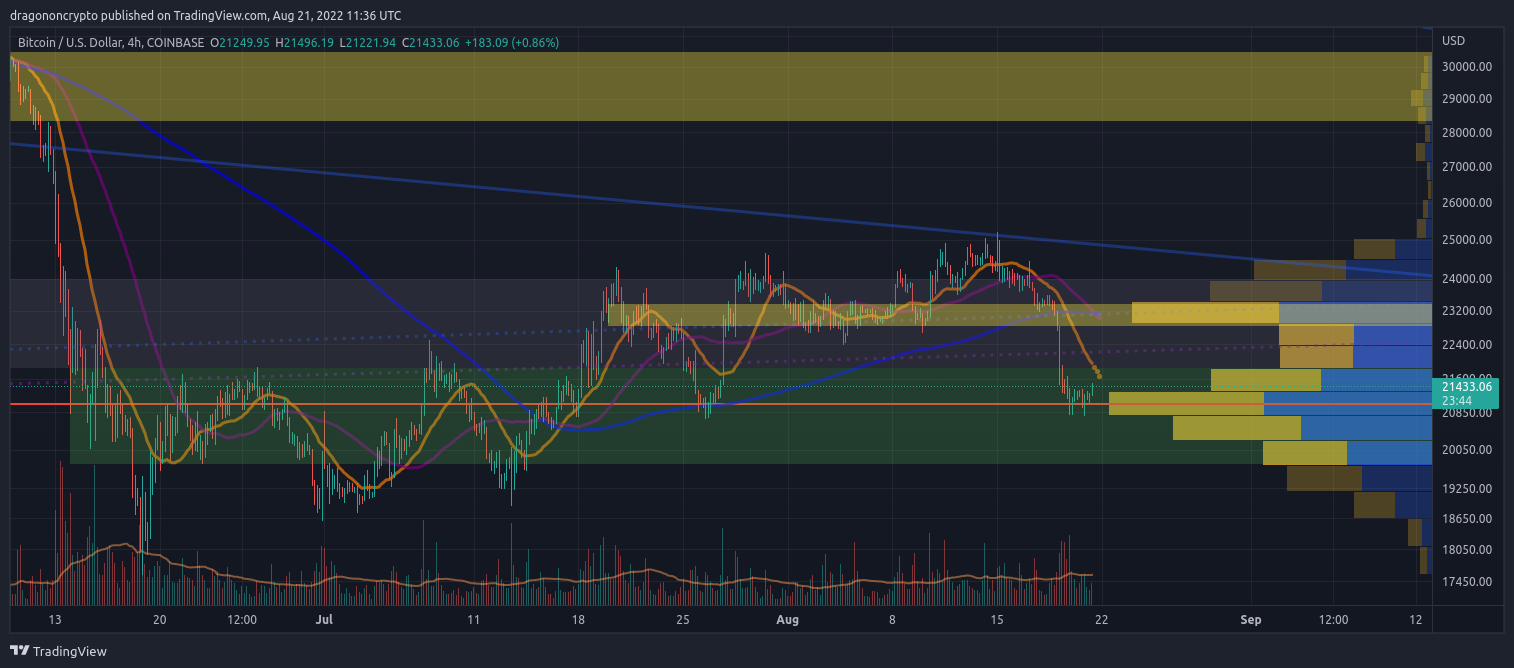 there remains a strong possibility of a V-shaped recovery, based on the previous fractal of a sort of rising triple top, before breaking resistance to the upside The fractal for a V-shaped recovery remains in tact so far, but price will have to rally in the coming hours and days in order for this to confirm, otherwise re-testing lower in the accumulation zone around $20K becomes increasingly likely. With the Hash Ribbons indicator now signalling a buy on the Daily time-frame, there is now understandably increased optimism that price will continue to move higher, as network growth returns. |
|
|
|
dragonvslinux (OP)
Legendary
Offline
Activity: 1666
Merit: 2204
Crypto Swap Exchange
|
|
August 22, 2022, 10:51:46 AM |
|
After reaching the break-down target of $20.8K, price has since found some buyers. Although far from a convincing higher low and support level, bulls have managed to avoid catastrophe by managing to hold this key level as support for now. On the Daily chart the bulls continue to defend $21K, however there remains low buying pressure as well as low volume as price struggles to move higher. With the week closing bearish yesterday (-11%), price risks falling lower to the lower range of accumulation around $20K if the volume point of control can't be maintained as support. Mid-term I remain neutral as price consolidates within this critical accumulation zone. 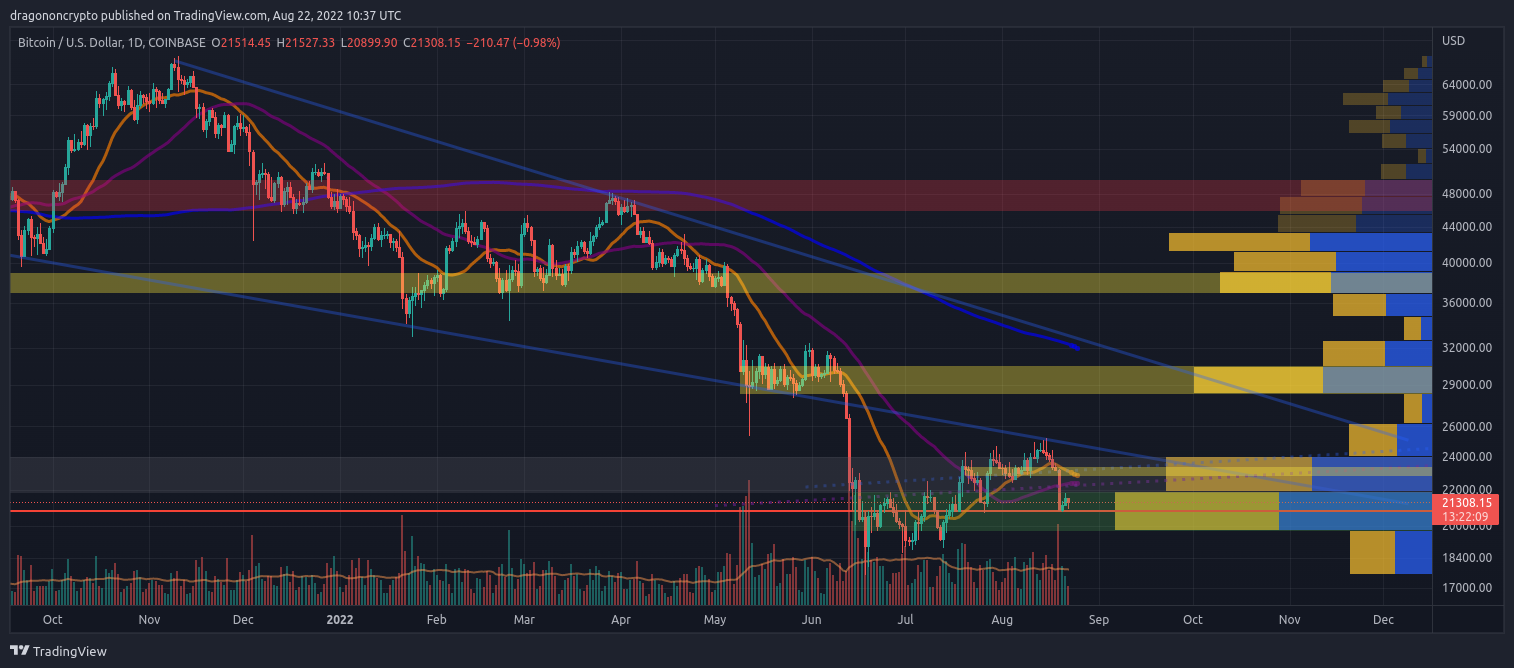 With the 50 & 200 MAs crossing bearish, the 4hr chart isn't looking as hopeful as the Daily chart with price now in a range between local accumulation and distribution levels $21K and $23K On the 4hr price is looking more bearish than bullish as price struggles to leave the accumulation zone around $22K, only to be rejected and return to $21K. While continuing to hold $20.8K remains positive, this support is only weakening as bears continue to re-test this level as support. As previously stated, price needs to move above $22K in order to return some bullish bias, that so far remains elusive. 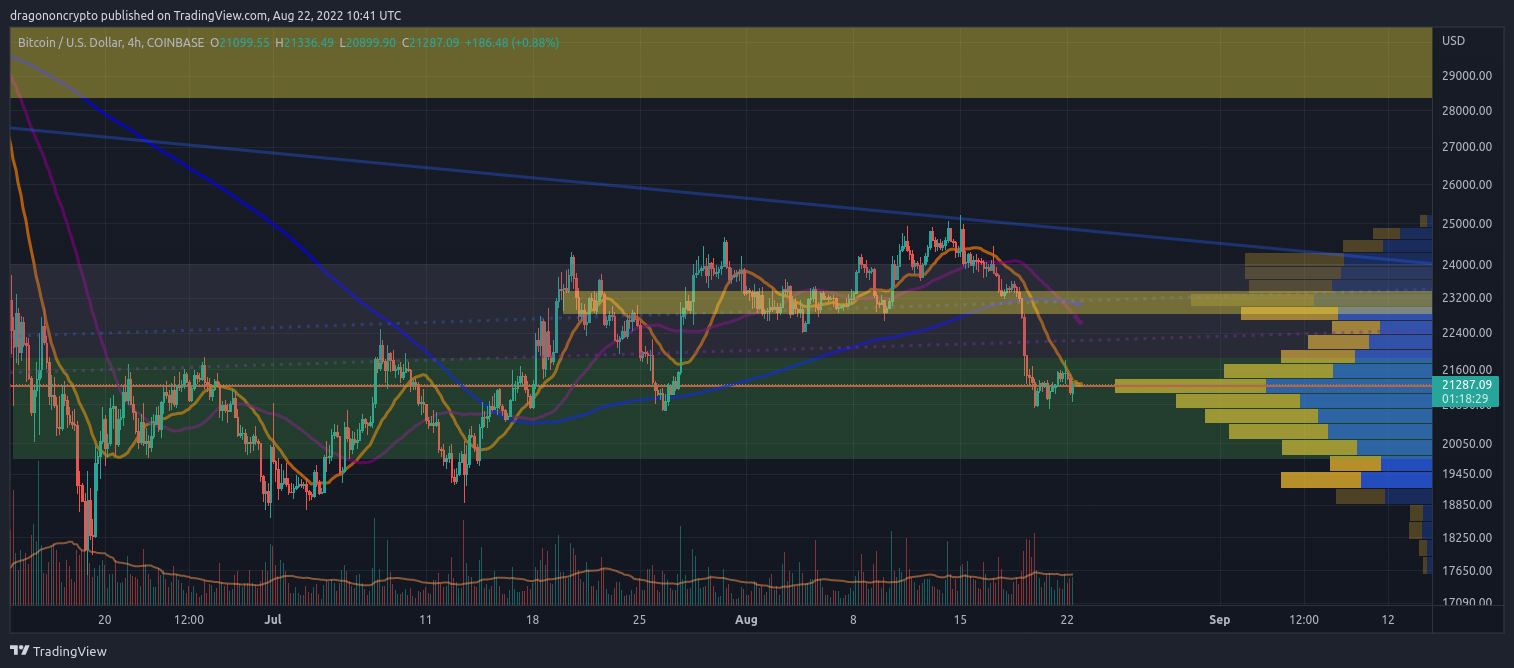 there remains a strong possibility of a V-shaped recovery, based on the previous fractal of a sort of rising triple top, before breaking resistance to the upside While still possible to see a swift recovery this week from support levels, the V-shaped recovery is looking increasingly unlikely as price consolidates sideways for the past two days, with neither the bulls nor the bears able to move the price in either significant direction. Avoiding an early week correction (as has been the case in previous weeks), after a bearish weekly close, would be a positive sign however. TL:DR: Short term bearish, mid-term neutral, long-term optimistic. |
|
|
|
dragonvslinux (OP)
Legendary
Offline
Activity: 1666
Merit: 2204
Crypto Swap Exchange
|
|
August 23, 2022, 07:47:23 AM
Last edit: August 23, 2022, 08:01:40 AM by dragonvslinux |
|
On the Daily chart the bulls continue to defend $21K, however there remains low buying pressure as well as low volume as price struggles to move higher. Not much has changed on the Daily chart today, only that as time passes without $22K level being reclaimed price looks increasingly bearish in the short-term while under the 50 Day MA. Hence re-testing the lower boundary of the accumulation zone around $20K becomes increasingly likely, however if this occurs I do still think this will hold in the long-term, based on the long-term accumulation so far. While $20K to $22K remains a good level for long-term accumulation, it looks far from a good trading opportunity, with either returning back above $22K or re-testing $20K looking like a better risk/reward entry price for long positions.  On the 4hr price is looking more bearish than bullish as price struggles to leave the accumulation zone around $22K, only to be rejected and return to $21K As with the Daily chart, the 4hr remains bearish with the bearish crossover of the 50 & 200 MAs that are now both declining, despite the bulls continuing to defend $21K. As with the daily chart, reclaiming $22K would help to confirm a higher low, but otherwise based on recent RSI fractals, it looks likely for price to re-test around $20K in order to form a higher low and re-test oversold conditions, similar to previous bottoms. 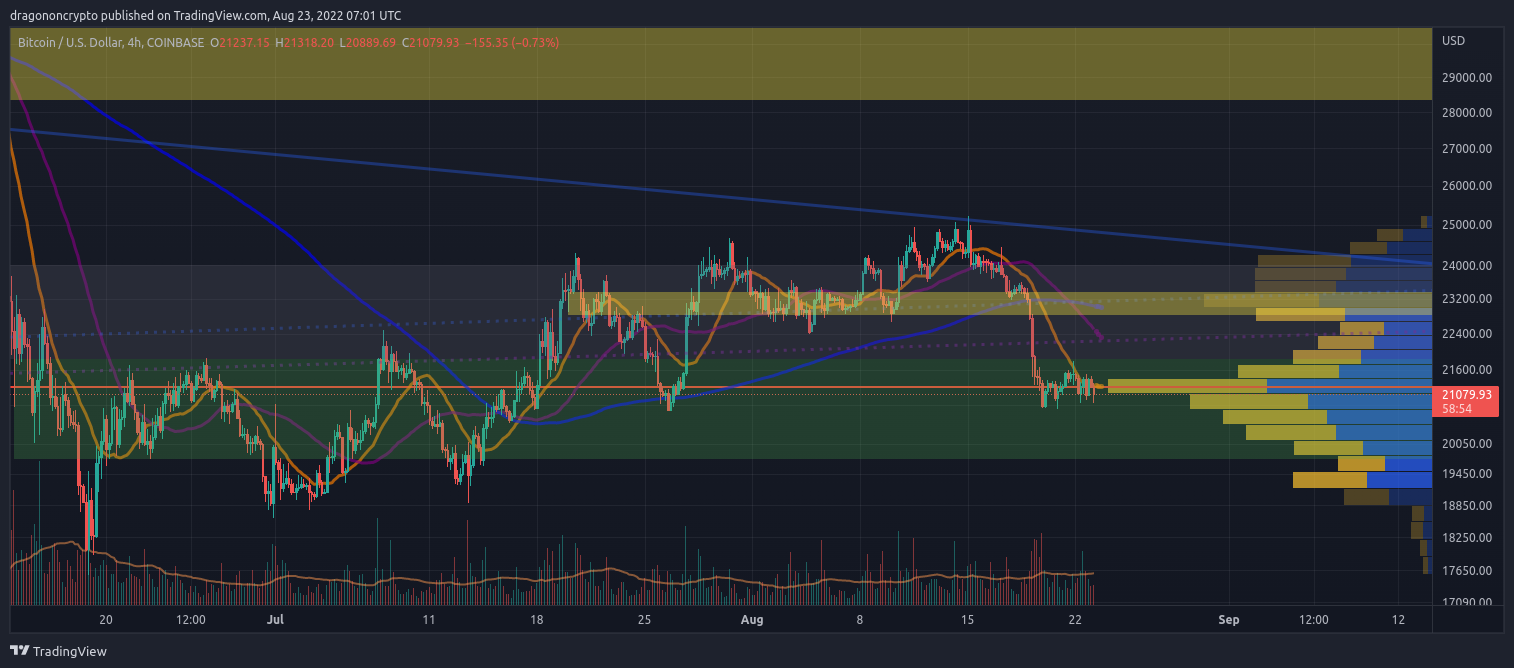 While still possible to see a swift recovery this week from support levels, the V-shaped recovery is looking increasingly unlikely as price consolidates sideways for the past two days With the V-shaped recovery very much off the table, a swift recovery would be more likely in the form of a bart pattern (green fractal) if the bulls fail to push prices back down to $20K. After a few days of consolidation within a tight trading range since the weekend, the market looks ready to make a move either down to $20K or back to $23K recent local distribution level, whith bearish price action favouring the former level for now (blue fractal). Somewhat optimistically, in the mid-term (next couple of weeks), I do see the 200 WMA being reclaimed again, despite remaining neutral at current prices within the $20K to $22K accumulation zone.  |
|
|
|
|
justdimin
|
|
August 23, 2022, 12:38:33 PM |
|
On the Daily chart the bulls continue to defend $21K, however there remains low buying pressure as well as low volume as price struggles to move higher. With the week closing bearish yesterday (-11%), price risks falling lower to the lower range of accumulation around $20K if the volume point of control can't be maintained as support. Mid-term I remain neutral as price consolidates within this critical accumulation zone.
I believe that bearish closing mainly happened because of the fear index situation. I mean people are scared a ton because of the bad news coming from mt.gox trustee considering to sell their tens of thousands of bitcoins and thats mainly the reason why its like this. People need to realize that there isn't a situation where we are doing something wrong right now, its doing fine and we shouldn't be worried about it. This is what the world is all about and the problem is that crypto could have bearish moments that is "fabricated" basically and not data backed, all because of some news. This doesn't mean that it is really bearish, it is just looking like that. |
|
|
|
dragonvslinux (OP)
Legendary
Offline
Activity: 1666
Merit: 2204
Crypto Swap Exchange
|
|
August 24, 2022, 09:17:44 AM |
|
Not much has changed on the Daily chart today, only that as time passes without $22K level being reclaimed price looks increasingly bearish in the short-term while under the 50 Day MA. Price is continuing to defend the long-term and shorter-term volume point of control (accumulation level) around $21K. Yesterday closed with another wick to the downside, showing that buyers remain present, despite being unable to push prices higher. While remaining bearish short-term, my bias is beginning to shift back to neutral as bears fail to push prices lower for yet another day, despite the bear flag pattern. 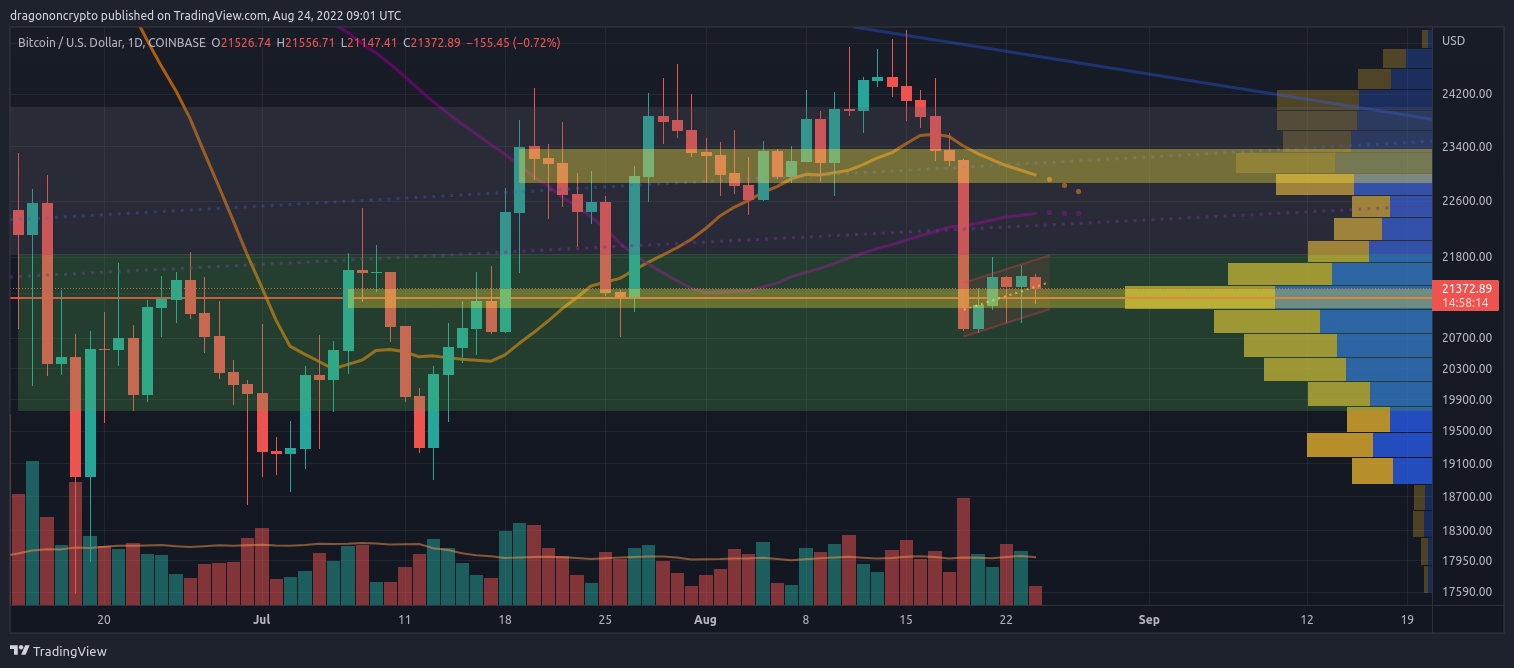 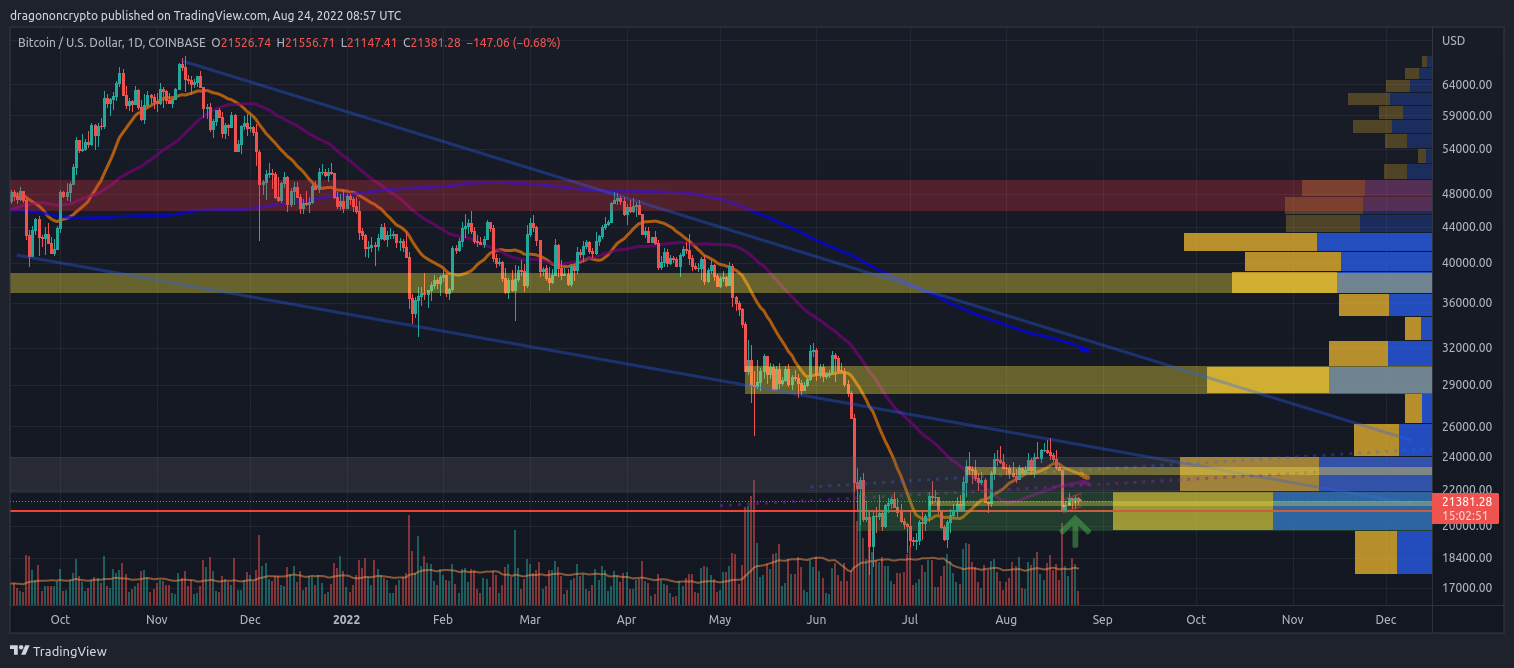 As with the daily chart, reclaiming $22K would help to confirm a higher low, but otherwise based on recent RSI fractals, it looks likely for price to re-test around $20K in order to form a higher low and re-test oversold conditions, similar to previous bottoms. Despite anticipating a re-test of the lower level around $20K based on RSI previous fractals, it seems that for now that the 4hr has avoided this re-test, instead comfortably returning to neutral RSI levels instead of being rejected and re-testing oversold conditions, as per previous times when the RSI reached deeply oversold levels <20. The notable difference being that this time around, it hasn't been with a new bear market low. 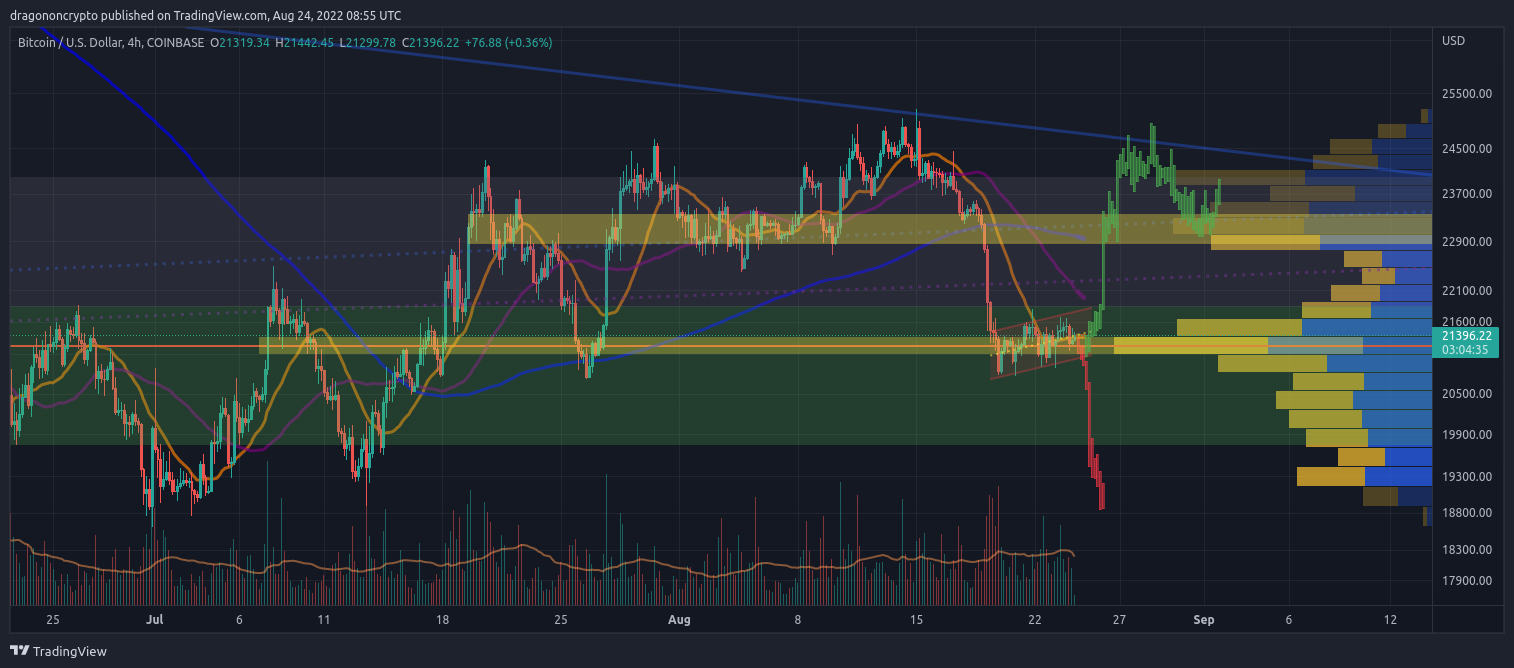 Price otherwise remains within a bear flag structure, that if broken targets around $19K (even if those prices are short lived). Personally I think the bart pattern back to the upside now remains just as likely given the bearish pressure is subsiding, as noted by the RSI as well as the CMF, that has returned to positive after 2-month lows. Although low volume, the buying pressure has reached similar levels to previous peaks in price last month at $24K as well as $22.5K, despite being at relative lows, which is a positive sign as well as difference compared to previous lows. After a few days of consolidation within a tight trading range since the weekend, the market looks ready to make a move either down to $20K or back to $23K recent local distribution level Although still anticipating a move in either direction as opposed to further consolidation at relative lows, based on the current bear flag structure the measured move target would be around $19K, even with $20K holding as support, so wicks below the accumulation level can't be ruled out at this point. Despite last week closing bearish, the bears have so far failed to follow through this week it's worth noting. |
|
|
|
dragonvslinux (OP)
Legendary
Offline
Activity: 1666
Merit: 2204
Crypto Swap Exchange
|
|
August 29, 2022, 01:57:10 PM
Last edit: August 29, 2022, 02:47:39 PM by dragonvslinux Merited by EarnOnVictor (1) |
|
Hence re-testing the lower boundary of the accumulation zone around $20K becomes increasingly likely, however if this occurs I do still think this will hold in the long-term, based on the long-term accumulation so far. Has been a few days without analysing the price, as it fell from the volume point of control from $21K down to $20K. Price today is attempting to bounce back from the lower level of the accumulation zone which is promising, but remains far from convincing for a reversal. Resistance to the upside will come from $21.4K local distribution level, followed by $23K levels where price initially fell from. The break-down target from the bear flag remains at around $19K, but given price has already reached $19.5K as bulls begin to defend $20K, it seems price has already fallen far enough, as the bearish momentum short-term begins to subside. 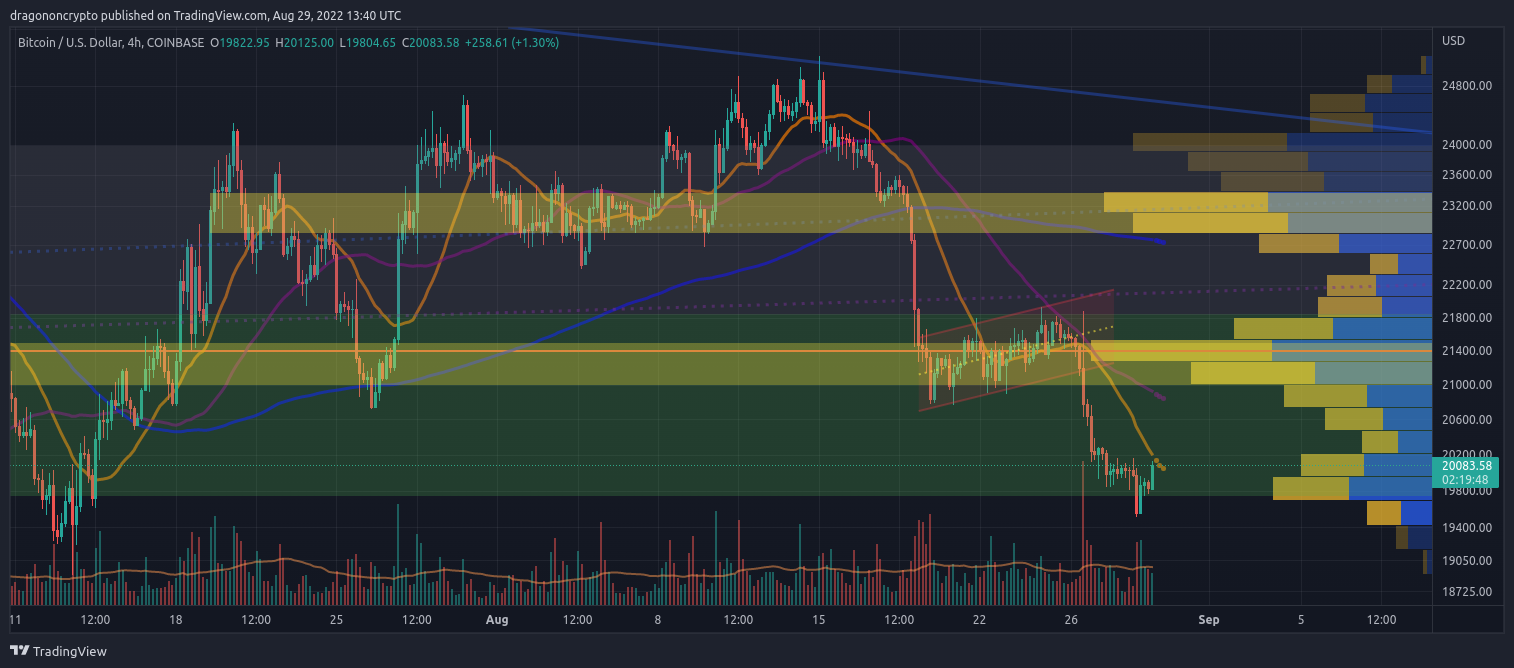 As with the daily chart, reclaiming $22K would help to confirm a higher low, but otherwise based on recent RSI fractals, it looks likely for price to re-test around $20K in order to form a higher low and re-test oversold conditions, similar to previous bottoms. There is some hope on the 4hr as the RSI has confirmed strong bullish divergence after re-testing oversold conditions, similar to the previous lows in May and June, this time at a higher price than yearly low. However given the resistance over-head, it's difficult to confirm this as a local low until price moves above $22K and outside of the current accumulation/distribution zone, in order to confirm it again as accumulation. 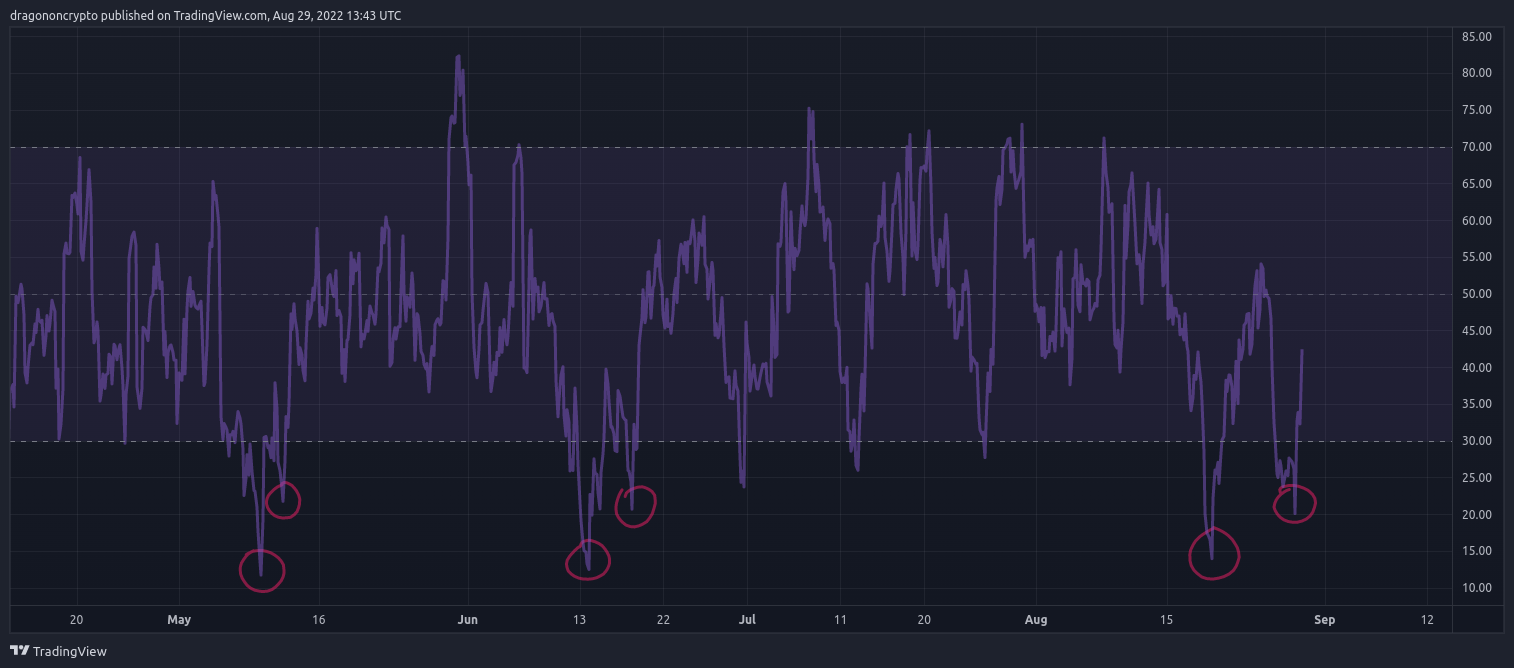 On the Daily chart price remains within the accumulation zone of $20K to $22K after briefly dipping below to $19.5K. As previously referenced, convincingly moving below $20K would return the bearish momentum long-term, but fortunately the bears have yet to achieve this, hence despite the bearish posture of price structure, I'm remaining neutral within this accumulation/distribution zone. 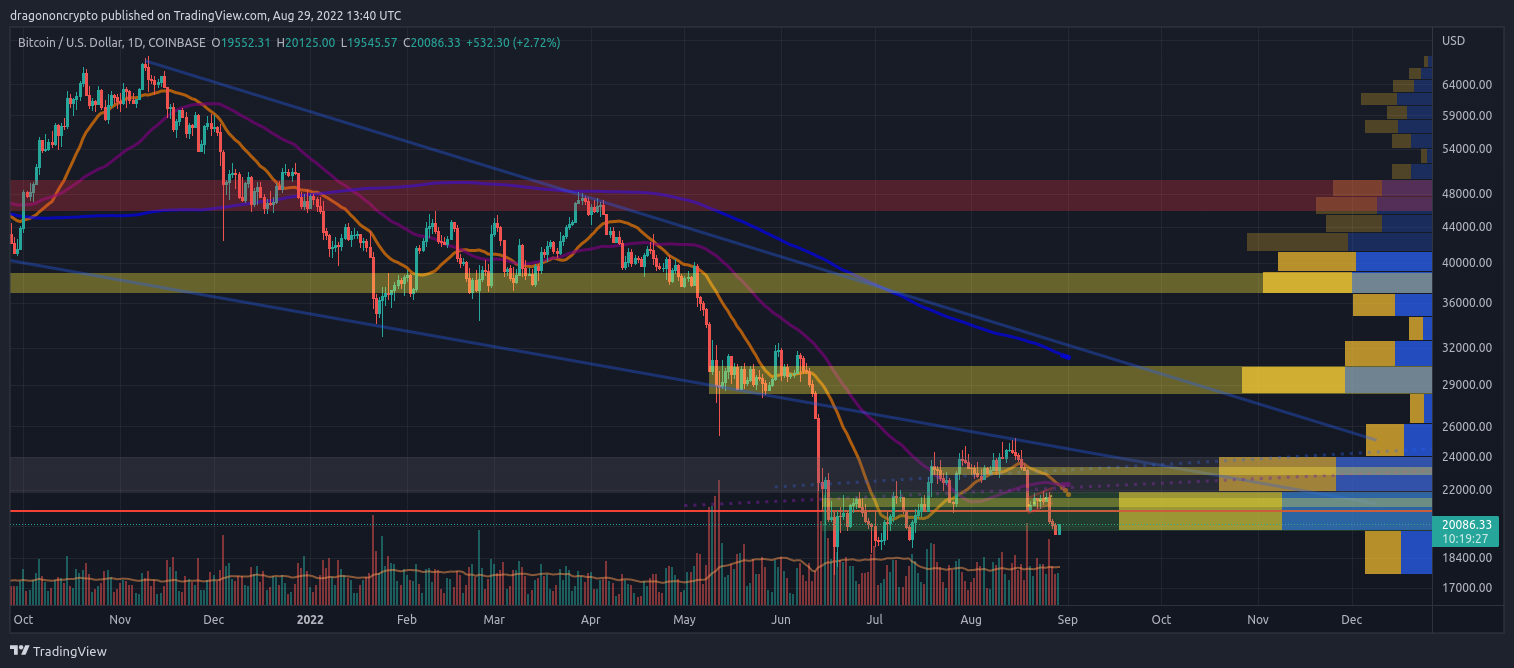 On the Weekly chart price closed at the second lowest level this year at $19.5K, just above the 2017 ATH closing weekly price of $19.3K. While the low close is certainly concerning long-term after failing to turn the 200 WMA into support, the RSI hasn't yet returned to oversold conditions, while price bouncing back this week would help to further confirm $17.5K as a low.  While not expecting a quick reversal back above $22K this week, I am anticipating further accumulation and distribution between $20K and $22K, specifically long-term buyers against short-term sellers, that now includes buyers from the previous two months who initially intended to be long-term holders but have changed their minds. Until then, price remains neutral within this zone until further confirmation. |
|
|
|
dragonvslinux (OP)
Legendary
Offline
Activity: 1666
Merit: 2204
Crypto Swap Exchange
|
|
August 31, 2022, 02:31:06 PM |
|
Price today is attempting to bounce back from the lower level of the accumulation zone which is promising, but remains far from convincing for a reversal. Price action today remains promising, despite the bearish looking double bottom in the short-term. Overall the bulls are continuing to defend $20K levels with a desire to push prices back to volume point of control around $21.4K in order to try and neutralise the current short-term bearish momentum. If it weren't for the bullish divergence referenced below, I'd be a lot more bearish at current prices.  There is some hope on the 4hr as the RSI has confirmed strong bullish divergence after re-testing oversold conditions, similar to the previous lows in May and June, this time at a higher price than yearly low. With price re-testing $19.5K level and swiftly rebounding back above $20K, this has helped to further confirm the bullish divergence on the RSI as currently on the 4hr price strength remains neutral around 50, despite the high volume selling yesterday. It remains to be seen whether there will be a short-term relief rally to the upside before breaking the lows, but for now bears are struggling to push prices lower. 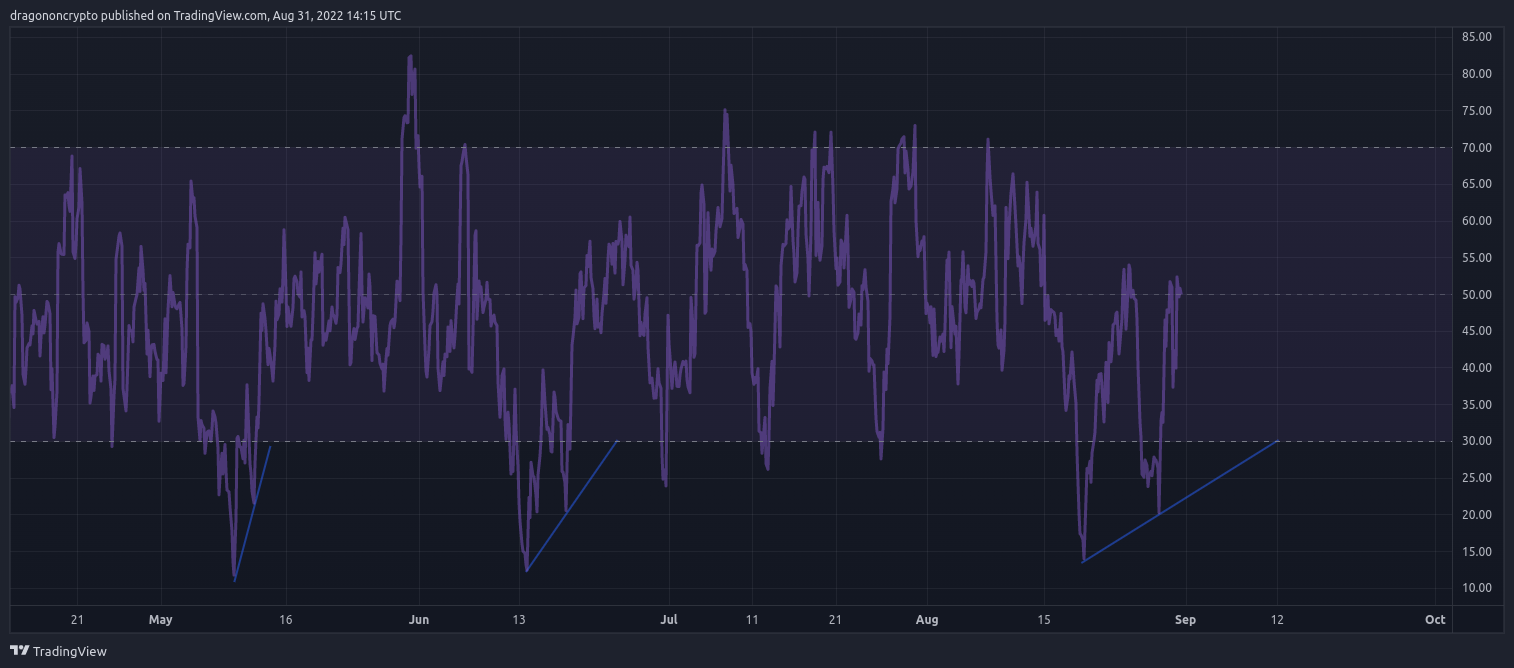 On the Daily chart price remains within the accumulation zone of $20K to $22K after briefly dipping below to $19.5K. Long-term accumulators are continuing to defend the $20K level as the lower band of this long-term trading range for the third day now which again is promising, but without a move back above $22K in order to re-confirm it as an accumulation zone, it remains a trading range. Similar to the 4hr, price will need to move back to $21K in order to neutralise the immediate bearish outlook of lower prices. 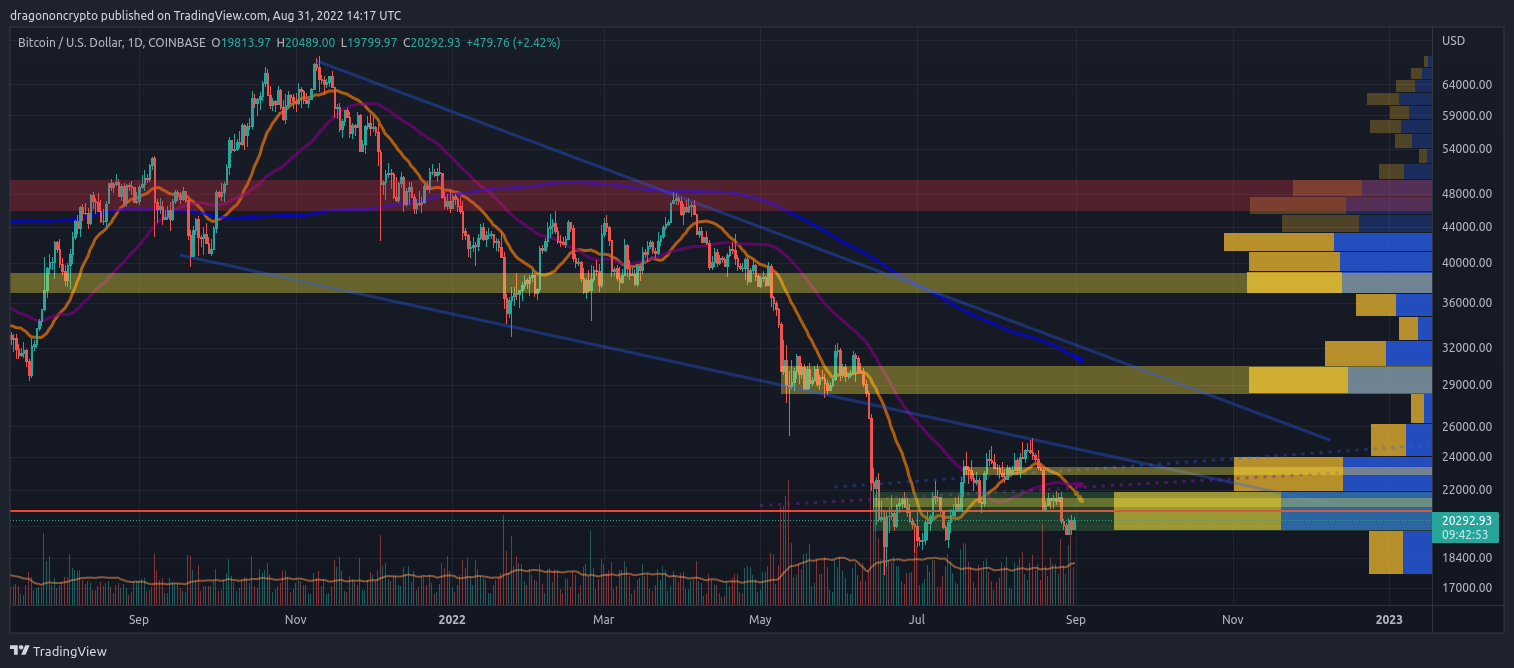 While not expecting a quick reversal back above $22K this week, I am anticipating further accumulation and distribution between $20K and $22K, specifically long-term buyers against short-term sellers Outlook remains the same, short-term slightly bullish, mid-term neutral as price consolidates within an accumulation zone and long-term optimistic that the low is already in. |
|
|
|
dragonvslinux (OP)
Legendary
Offline
Activity: 1666
Merit: 2204
Crypto Swap Exchange
|
|
September 01, 2022, 02:59:25 PM |
|
Overall the bulls are continuing to defend $20K levels with a desire to push prices back to volume point of control around $21.4K in order to try and neutralise the current short-term bearish momentum. Despite avoiding a new monthly low close below $20K yesterday, price is failing to confirm this level as support, instead creating lower highs in bearish fashion. If current price action is again within a bear flag structure, then the target would be around $18K to $19K, between the recent lows and lowest 4hr close. At present, this looks increasingly likely rather than re-testing $21K previous support. 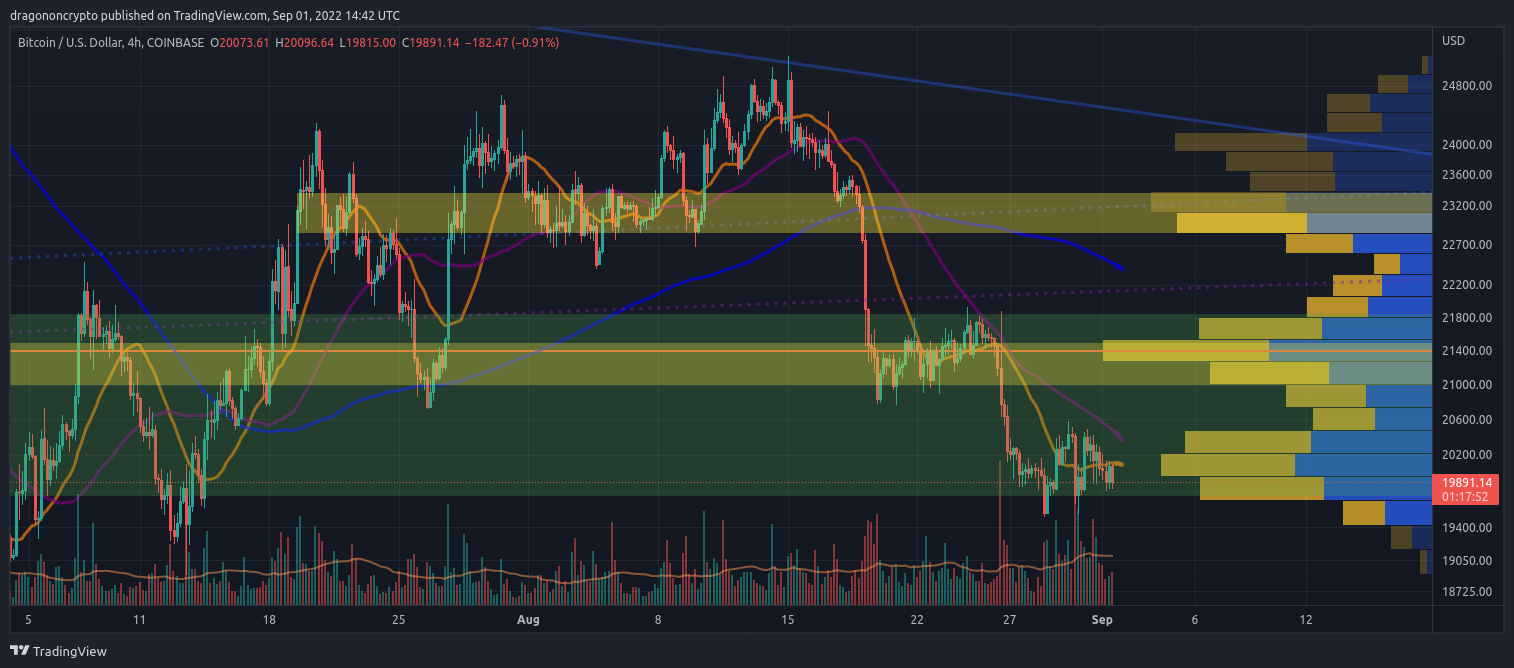 With price re-testing $19.5K level and swiftly rebounding back above $20K, this has helped to further confirm the bullish divergence on the RSI as currently on the 4hr price strength remains neutral around 50 The bullish divergence on the 4hr remains in tact, but this doesn't rule out a move towards $18K in order to further confirm. With further rejection from the neutral level of 50, this also looks increasingly likely. Long-term accumulators are continuing to defend the $20K level as the lower band of this long-term trading range for the third day now which again is promising, but without a move back above $22K in order to re-confirm it as an accumulation zone, it remains a trading range. Similar to the 4hr, price will need to move back to $21K in order to neutralise the immediate bearish outlook of lower prices. Finding support from the lower band of the accumulation around $20K still remains to be seen, with instead the Daily RSI getting rejected from neutral territory (40-60) and remaining bearish. After the initial bounce from oversold territory last week, price is threatening to return to oversold territory unless $21K is reclaimed in the coming days, followed by moving above $22K in order to return a bullish bias.  The only realistic hope is that price is now at the 0.236 fib retracement from $17.5K low to $25K, which is the same retracement level that price formed a higher low in 2019 to confirm the bear market low after moving from $3.2K to $4.2K and back down to $3.4K, so not all hope is lost quite yet. $20K is therefore the "line in the sand" for the bulls to confirm $17.5K as the bear market low, which remains entirely possible. Outlook remains the same, short-term slightly bullish, mid-term neutral as price consolidates within an accumulation zone and long-term optimistic that the low is already in.
Outlook now changed to short-term bearish, but still mid-term neutral as price remains within the accumulation zone. |
|
|
|
dragonvslinux (OP)
Legendary
Offline
Activity: 1666
Merit: 2204
Crypto Swap Exchange
|
|
September 05, 2022, 03:54:54 PM |
|
If current price action is again within a bear flag structure, then the target would be around $18K to $19K, between the recent lows and lowest 4hr close. As an update, price now appears to be forming a bearish descending triangle, with similar target as referenced previously. Price is continuing to get rejected by the 50 MA despite flattening out (shedding it's bearish bias) while the week-long horizontal support continues to weaken. While price has barely changed since previous update, the short-term bearish price structure has grown considerably, despite bullish divergence. The neutral outlook would be reclaiming $20.5K and invalidating the short-term lower highs structure, but without returning to ~$21K distribution zone the short-term bullish would still be lacking.  Finding support from the lower band of the accumulation around $20K still remains to be seen, with instead the Daily RSI getting rejected from neutral territory (40-60) and remaining bearish. Despite price remaining within the accumulation/distribution zone ($19.8K to $22K specifically), price is failing to find support from this lower level. As previously referenced, the RSI remains bearish and threatening to return to oversold levels if $21K (volume point of control) isn't reclaimed. The 50 Day MA is soon to start declining rapidly, returning the bearish confirmation in the mid-term as price remains below.  This still remains the case, that a higher low is still more than possible, similar to 2019 price structure which also at the time had a considerable bearish short-term outlook. Additionally until the long-term trading range is confirmed as distribution, it remains an accumulation zone with price within it off the lows. The Weekly close yesterday above $20K was almost promising, but still lacks any bullish follow through. |
|
|
|
|
bittraffic
|
|
September 07, 2022, 01:45:26 AM |
|
This plunge I think is more related to the fundamental news we see today with the war getting more brutal when it comes to sanctions which Russia had retaliated thru the gas pipe. I'm not sure if we can use the technical analysis anymore for this. If it breaks that last support on $17K, I'm not hoping it will happen but there is a possibility for $14k.
There is no way out of this if the economy is not rolling especially if this war prolongs. We can already see people burning thier electricity bill and demand not to pay their taxes. Looks like an apocalyptic scenario as they protest on the streets.
|
|
|
|
dragonvslinux (OP)
Legendary
Offline
Activity: 1666
Merit: 2204
Crypto Swap Exchange
|
|
September 07, 2022, 02:36:14 AM |
|
This plunge I think is more related to the fundamental news we see today with the war getting more brutal when it comes to sanctions which Russia had retaliated thru the gas pipe. I'm not sure if we can use the technical analysis anymore for this. If it breaks that last support on $17K, I'm not hoping it will happen but there is a possibility for $14k.
Whether related to "fundamental news" or not, the technical analysis not only suggested the likelihood of this exact this scenario, but it also happened: a drop to around $18K to $19K depending on how you measure the move of the descending triangle. I've never understood the concept of not being able to use technical analysis, as regardless of the news, this was the most likely scenario at play. The only times I do find "fundamental news" relevant is when TA suggests the likelihood of a scenario happening, and instead the opposite occurs, then it can be attributed more to such a news event. Given that (imo) there are enough TA & fundamental factors to confirm the low is already in at $17.5K, if price breaks below this, then it'd be fair to attribute to the macro climate. Especially if a bear trap low occurs. I don't mean to sound rude or disregard your argument, but merely that one doesn't need to follow the news to see what was most likely to happen in this case, or attribute the news to such predictable price movements. |
|
|
|
tranthidung
Legendary
Offline
Activity: 2268
Merit: 4006
Farewell o_e_l_e_o

|
|
September 07, 2022, 02:57:16 AM Merited by JayJuanGee (1) |
|
Whether related to "fundamental news" or not, the technical analysis not only suggested the likelihood of this exact this scenario, but it also happened: a drop to around $18K to $19K depending on how you measure the move of the descending triangle. I've never understood the concept of not being able to use technical analysis, as regardless of the news, this was the most likely scenario at play.
Because people believe in news. They don't actually believe in White paper, core concept, power of the network, effect of finite controlled supply, possibly lost Bitcoin, etc. Additionally, they believe in news as the reasons of all falls or rises of Bitcoin. When they have a few years in the market, they will realize news are not real reasons of market movement. Given that (imo) there are enough TA & fundamental factors to confirm the low is already in at $17.5K, if price breaks below this, then it'd be fair to attribute to the macro climate. Especially if a bear trap low occurs.
Trap or not, if it happens, it will be actually a lower low or a final bottom. Like the crash in March 2020 (as some believed it is because of Covid19), then price soared to the moon after washing out all weak hands. In fact, Covid-19 outbreak was in December 2019 and after 3 months, we knew that it was already a pandemic but just lack of the official announcement from WHO. After WHO made a press conference to announce it as a pandemic, namely Covid-19, all markets collapsed. Do people believe the announcement is the cause of market crashes? It's not! |
|
|
|
dragonvslinux (OP)
Legendary
Offline
Activity: 1666
Merit: 2204
Crypto Swap Exchange
|
|
September 07, 2022, 03:16:22 AM
Last edit: September 07, 2022, 03:26:42 AM by dragonvslinux Merited by JayJuanGee (1) |
|
Whether related to "fundamental news" or not, the technical analysis not only suggested the likelihood of this exact this scenario, but it also happened: a drop to around $18K to $19K depending on how you measure the move of the descending triangle. I've never understood the concept of not being able to use technical analysis, as regardless of the news, this was the most likely scenario at play.
Because people believe in news. They don't actually believe in White paper, core concept, power of the network, effect of finite controlled supply, possibly lost Bitcoin, etc. Additionally, they believe in news as the reasons of all falls or rises of Bitcoin. When they have a few years in the market, they will realize news are not real reasons of market movement. Well put. I do otherwise think news can effect price short-term, but that usually it's "priced in". For example recession and war, these factors have already been priced in and have been a factor for months already. Markets usually bottoms 3-6 months before the worst is over. People don't sell at the point where the economic climate is at it's worst, they sell because they are anticipating the worst. It's a lagging indicator at best. Given that (imo) there are enough TA & fundamental factors to confirm the low is already in at $17.5K, if price breaks below this, then it'd be fair to attribute to the macro climate. Especially if a bear trap low occurs.
Trap or not, if it happens, it will be actually a lower low or a final bottom. Like the crash in March 2020 (as some believed it is because of Covid19), then price soared to the moon after washing out all weak hands. In fact, Covid-19 outbreak was in December 2019 and after 3 months, we knew that it was already a pandemic but just lack of the official announcement from WHO. After WHO made a press conference to announce it as a pandemic, namely Covid-19, all markets collapsed. Do people believe the announcement is the cause of market crashes? It's not! I guess I've always been expecting a 3-6 month bottom, similar to 2019 as well as 2015 to some degree, as well as ironically like right now, rather than 2020 re-test of the lows. But you raise a valid point that a low below $17.5K could well be like 2020 with a quick wick and price recovering back to a sensible level shortly after. It also makes sense if price is coming down to around an 8-10 year average for an asset that's 12 years old, as it would be considered by many who believe in the fundamentals rather than the macro climate fears that price is at an enormous discount never seen before, roughly 50% more than usual. To be fair with March 2020 however, there wasn't any fear in December 2019, it was the spread and when lock-downs were being considered or happening in March that the fear set in, or otherwise fears of immediate recession. So in this sense, for the short-term price action, I can see how it affected everything. But also the swift recovery was based on the fact that the news wasn't that relevant after all (hence bear trap). Some would say that price was destined to re-test the 200 Week MA one year later, and therefore it presented a great buying opportunity, regardless of the macro environment.
Also worth pointing out that despite the short-term, as well as now mid-term bearish outlook, not all hope is lost in the long-term, based on the original title of this thread at least:  While it seems unlikely, as well as to myself, if price does rebound next week after closing this week near to oversold conditions (which is looking likely) it would be a bullish re-test of oversold conditions. Price could then be trading back in the $20K to $22K accumulation zone, but with the bullish factor of finding buyers prior to becoming oversold again. Call it hopium, but that's how it'd look to me if it occurs. |
|
|
|
|
bittraffic
|
|
September 07, 2022, 03:42:07 AM |
|
This plunge I think is more related to the fundamental news we see today with the war getting more brutal when it comes to sanctions which Russia had retaliated thru the gas pipe. I'm not sure if we can use the technical analysis anymore for this. If it breaks that last support on $17K, I'm not hoping it will happen but there is a possibility for $14k.
Whether related to "fundamental news" or not, the technical analysis not only suggested the likelihood of this exact this scenario, but it also happened: a drop to around $18K to $19K depending on how you measure the move of the descending triangle. I've never understood the concept of not being able to use technical analysis, as regardless of the news, this was the most likely scenario at play. The only times I do find "fundamental news" relevant is when TA suggests the likelihood of a scenario happening, and instead the opposite occurs, then it can be attributed more to such a news event. Given that (imo) there are enough TA & fundamental factors to confirm the low is already in at $17.5K, if price breaks below this, then it'd be fair to attribute to the macro climate. Especially if a bear trap low occurs. I don't mean to sound rude or disregard your argument, but merely that one doesn't need to follow the news to see what was most likely to happen in this case, or attribute the news to such predictable price movements. Definitely, we need the TA to look at where the market could possibly go. We tend to play this game to make money. Just like you, we trade oftentimes when there is an opportunity.  This is a monthly chart where RSI had not yet bottomed. We might be able to see this likely going to happen because of the panic due to the economy falling down actually and we are still early in this winter. |
|
|
|
dragonvslinux (OP)
Legendary
Offline
Activity: 1666
Merit: 2204
Crypto Swap Exchange
|
|
September 07, 2022, 04:08:30 AM
Last edit: September 10, 2023, 12:55:32 PM by dragonvslinux |
|
This plunge I think is more related to the fundamental news we see today with the war getting more brutal when it comes to sanctions which Russia had retaliated thru the gas pipe. I'm not sure if we can use the technical analysis anymore for this. If it breaks that last support on $17K, I'm not hoping it will happen but there is a possibility for $14k.
Whether related to "fundamental news" or not, the technical analysis not only suggested the likelihood of this exact this scenario, but it also happened: a drop to around $18K to $19K depending on how you measure the move of the descending triangle. I've never understood the concept of not being able to use technical analysis, as regardless of the news, this was the most likely scenario at play. The only times I do find "fundamental news" relevant is when TA suggests the likelihood of a scenario happening, and instead the opposite occurs, then it can be attributed more to such a news event. Given that (imo) there are enough TA & fundamental factors to confirm the low is already in at $17.5K, if price breaks below this, then it'd be fair to attribute to the macro climate. Especially if a bear trap low occurs. I don't mean to sound rude or disregard your argument, but merely that one doesn't need to follow the news to see what was most likely to happen in this case, or attribute the news to such predictable price movements. Definitely, we need the TA to look at where the market could possibly go. We tend to play this game to make money. Just like you, we trade oftentimes when there is an opportunity. 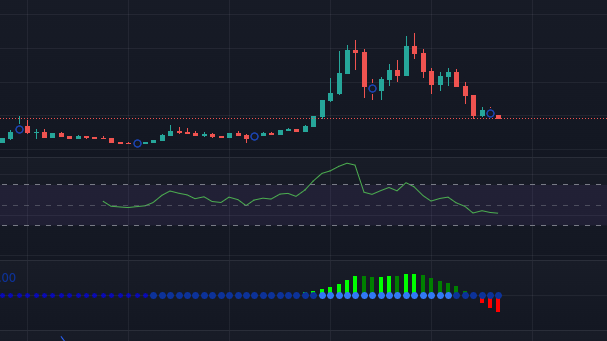 This is a monthly chart where RSI had not yet bottomed. We might be able to see this likely going to happen because of the panic due to the economy falling down actually and we are still early in this winter. Firstly, I personally wouldn't trading using the monthly RSI. That'd be for investing at best, as it's based on the longest time-frame possible: the monthly time-frame. Or otherwise just completely ignoring as it's historically never been bearish (<40) so doesn't really tell you much, only when price is overbought on this time-frame. It's therefore a "one-purpose indicator" for selling too early, not much else imo. Only this year did it first become relevant when it signalled bearish divergence at $69K, but otherwise has never signalled any bullish divergence, which is one of the main uses of the RSI generally speaking. It also doesn't suggest price hasn't bottomed, only that there isn't confirmation of a bottom. The confirmation on the monthly wouldn't come until >$30K at least if $17.5K were the bottom. For example the RSI rebounding in 2019 and back above the mid-level was only by the end of April, when price was at $5.2K. Sure that price was a good entry for the long-term, but also far away both time & price from the $3.2K low four months prior to that. Similar to 2015 the break-out of the RSI was in October 2015, 10 months after the low with a close of $300, +100% from the lows of $150. Neither time did it signal any useful bullish divergence. Meanwhile, there were a handful of indicators that were able to confirm a bottom prior to that. TL:DR: You're highlighting an indicator that's currently neutral (between 40-60) to highlight that we're in a bear market and the bottom isn't in, makes no sense. Maybe wait until it turns bearish first? This is otherwise why investors use the Weekly RSI, rarely ever the Monthly. The Monthly RSI would be useful for confirming a bottom out of a decade long bear market, like for example with Gold in the 90s where it finally formed strong bullish divergence in order to confirm a bottom in the market after being in a downtrend for 19 years. This also remain the only relevant example I can actually think of! |
|
|
|
dragonvslinux (OP)
Legendary
Offline
Activity: 1666
Merit: 2204
Crypto Swap Exchange
|
|
September 07, 2022, 04:05:26 PM Merited by LFC_Bitcoin (1) |
|
If current price action is again within a bear flag structure, then the target would be around $18K to $19K, between the recent lows and lowest 4hr close. As an update, price now appears to be forming a bearish descending triangle, with similar target as referenced previously. With yesterday's break-down, price has reached the measured move target of the descending triangle but remains increasingly bearish. The bears are threatening to break the final higher low from June that would likely see a re-test of $17.5K yearly low. Furthermore the local volume point of control has now lowered to around $20K, which will likely act as new resistance if price is able to move higher. 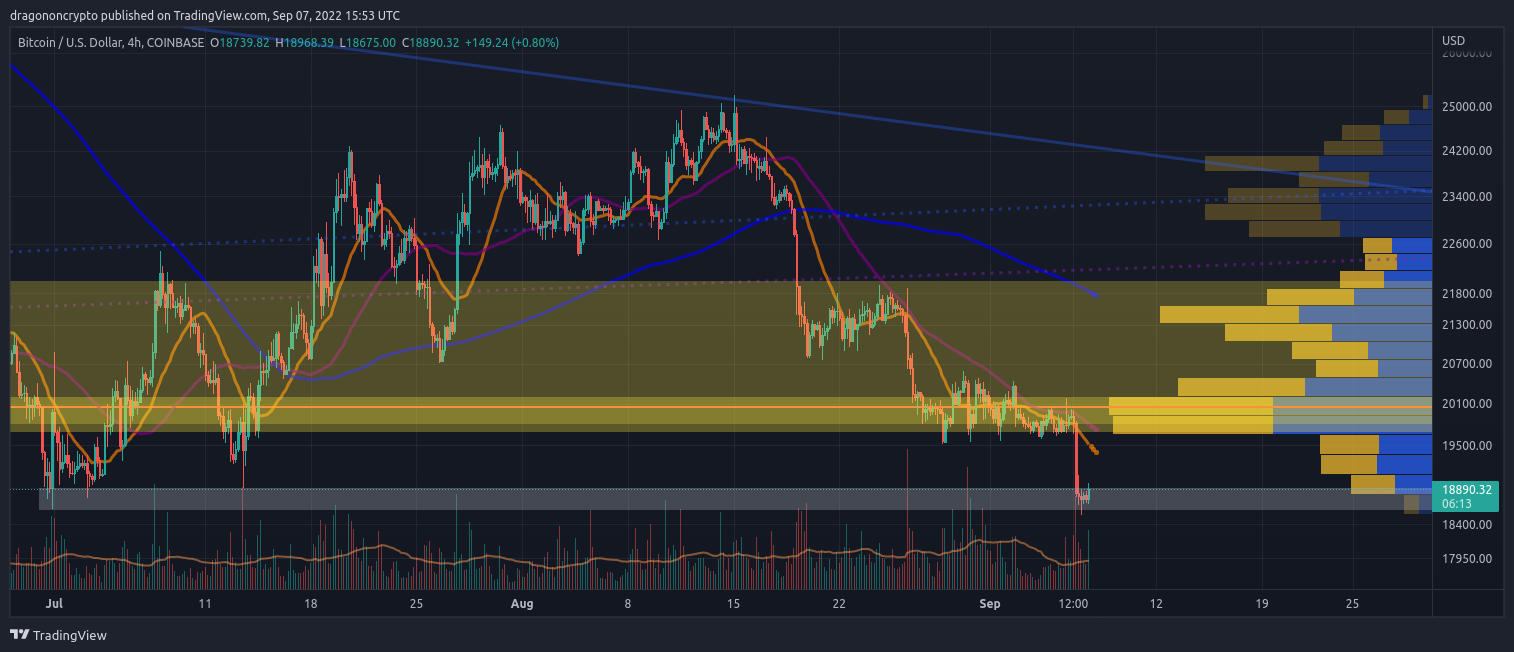 Despite price remaining within the accumulation/distribution zone ($19.8K to $22K specifically), price is failing to find support from this lower level. With price now confirming $20K to $22K trading zone as distribution from the past years worth of trading volume, after initially confirming it as accumulation, all hope for bullish continuation has been lost for now in the mid-term unless $20K is reclaimed. If the bulls are able to achieve this, then it would neutralise the bearish outlook for now until $22K is reclaimed which would provide a bullish bias. 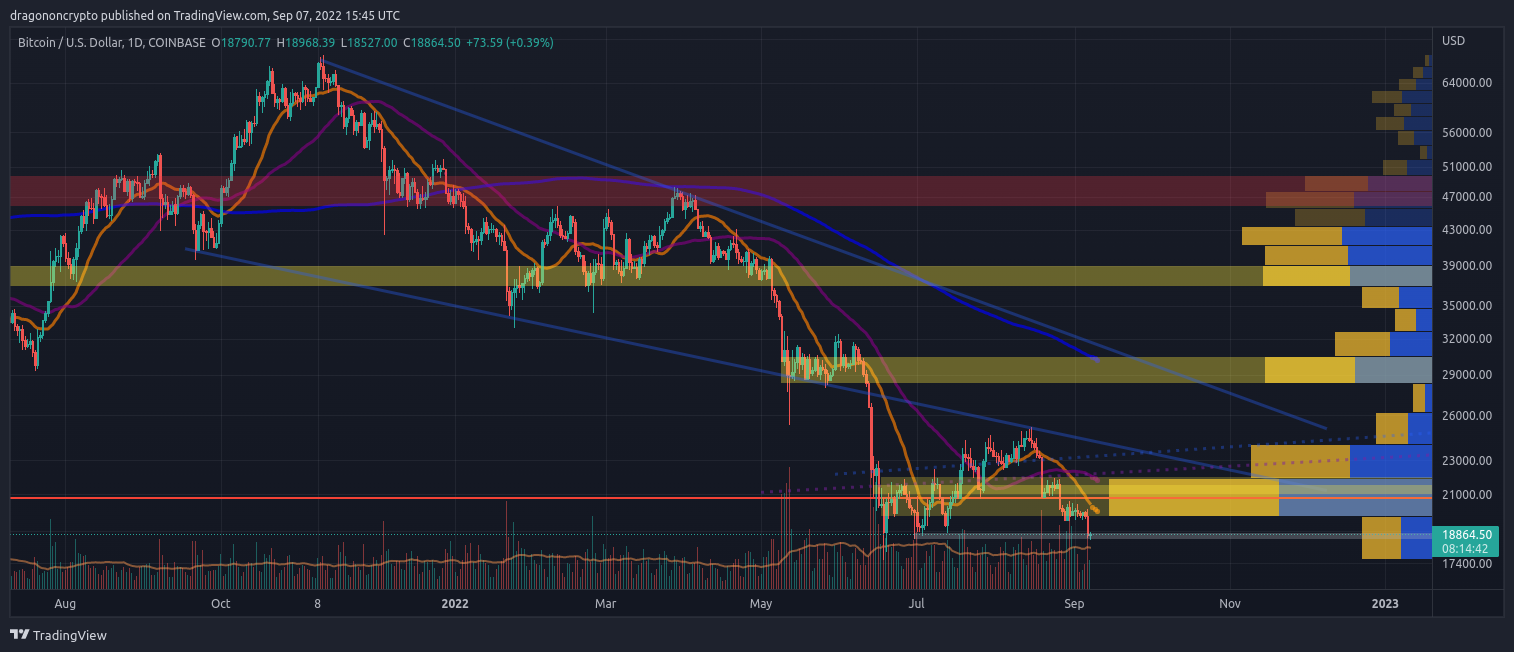 As previously referenced, the RSI remains bearish and threatening to return to oversold levels if $21K (volume point of control) isn't reclaimed. With price closing a new yearly low on the Daily time-frame ($18.8K), price has found some buyers at oversold levels (<30) which remains the only hope for a relief rally. There is an argument for hidden bullish divergence given the double bottom closing lows and price strength at higher levels, but this also means price can fall lower while maintain regular bullish divergence before seeing an upswing in price. 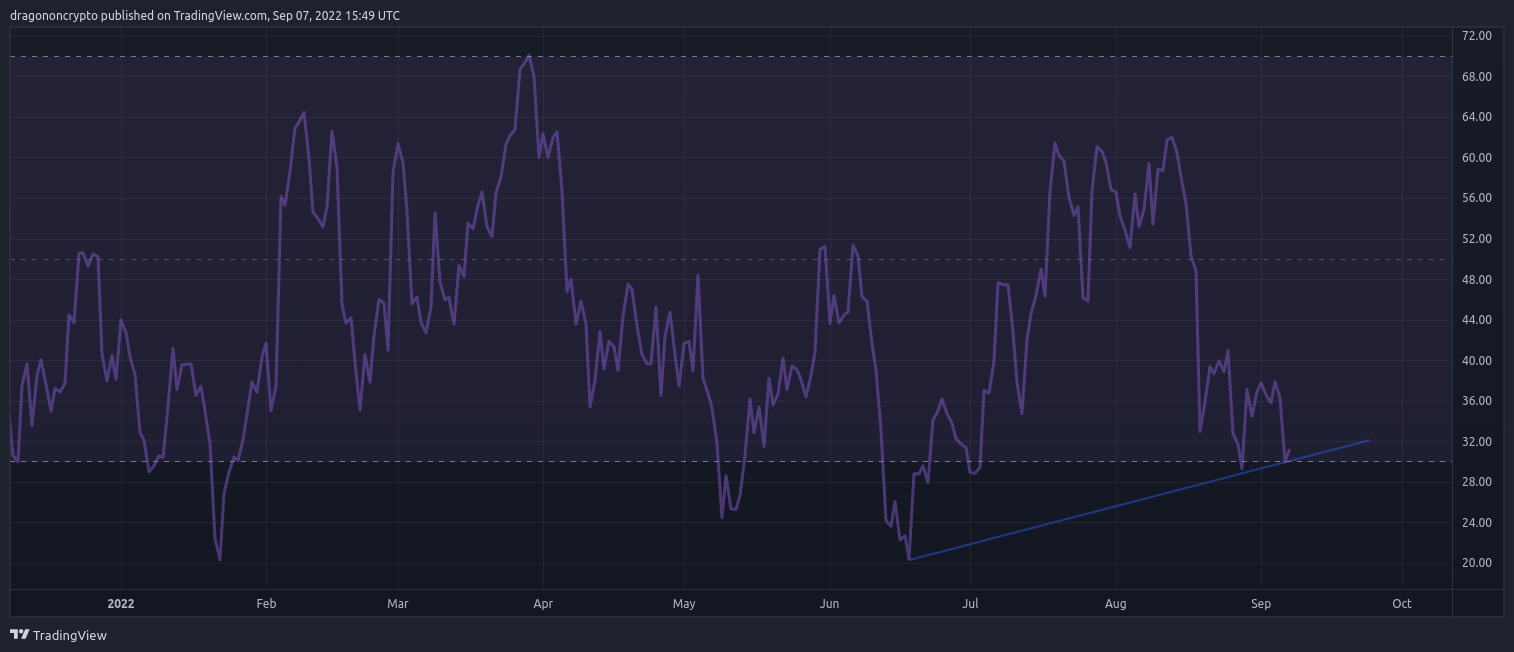 It could be argued that price remains in an accumulation/distribution level based on the past two years of trading volume with a point of control around $20K, that therefore includes trading from late 2020, but ultimately the main concern is the large volume gap between $18K and $14K, and therefore a collapse to considerably lower levels would be highly likely if the yearly lows are lost. 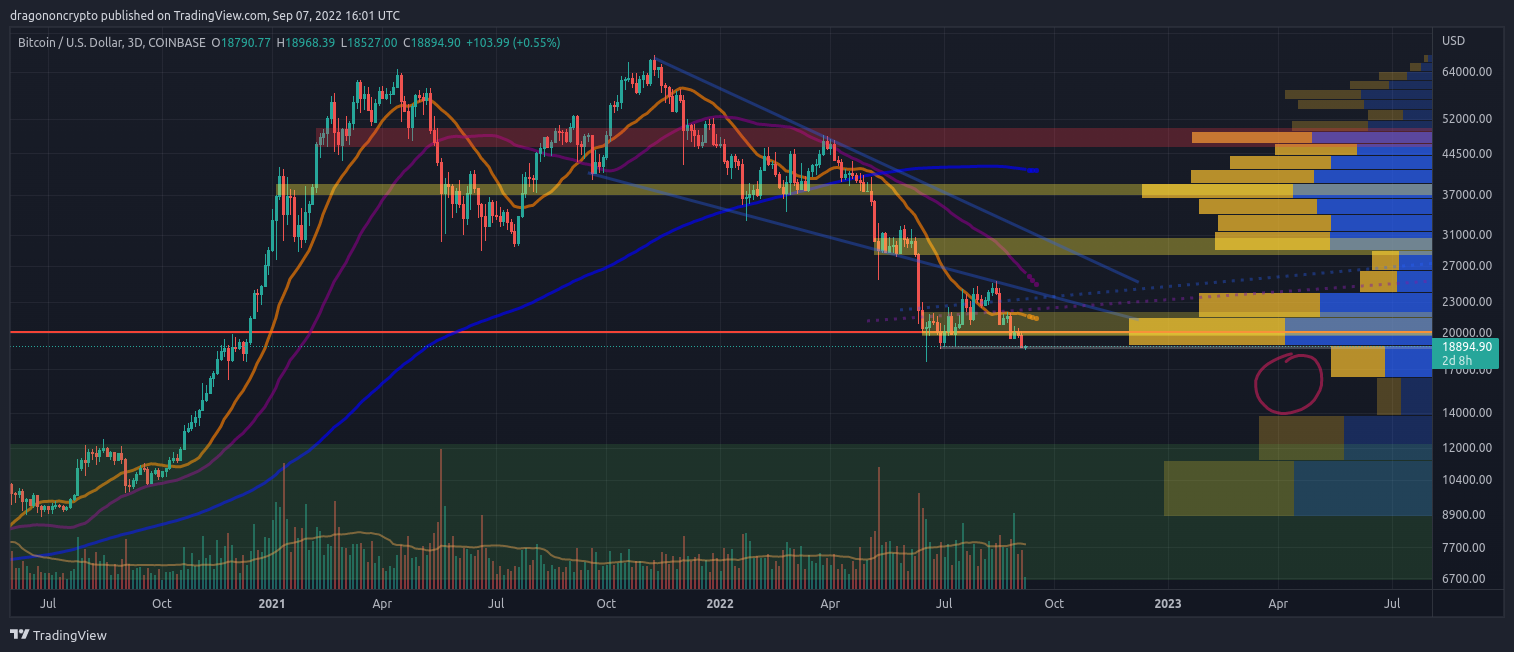 On the Weekly time-frame, a close back above $20K (the weeks opening price) would provide the sort of bullish wick to the downside that would help confirmation a higher low after 3 months of consolidation at the lows (enough time to form a macro bottom). Price would therefore first have to breach this resistance level which has been proven to be a high volume selling area, so won't be easy. Fortunately price only needs to increase by 6% and close the week at this level (~$20K) in order to return some bullish bias on the Weekly time-frame, but this will be against the tide of sellers in the short to mid-term time-frame that have shown strength in recent days and weeks. With the fear around MtGox distribution finalising next week, this is also unlikely to inspire many buyers right now. |
|
|
|
|


