udayantha11 (OP)
Member

 Offline Offline
Activity: 756
Merit: 17
2023 would most likely be as bearish as 2022


|
 |
January 03, 2023, 12:27:42 PM |
|
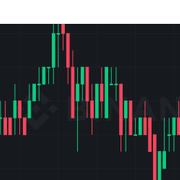 This is not normal wicks, so why like this? it because of low liquidity?? |
we all need universal power and cyclist of Everything
-2023 would most likely be as bearish as 2022-
=BTC will make it, but might be a long winter=
Stronger the storm, brighter the rainbow
|
|
|
|
|
|
|
|
Remember that Bitcoin is still beta software. Don't put all of your money into BTC!
|
|
|
Advertised sites are not endorsed by the Bitcoin Forum. They may be unsafe, untrustworthy, or illegal in your jurisdiction.
|
|
|
|
palle11
|
|
January 03, 2023, 01:04:41 PM |
|
What is wrong with it? I don't think anything is wrong there even a low liquidity is not abnormal. The candle formation showed drop in demand though and it is not unusual for that to happen because price bounce up or down and that is what happened with the candlestick. Meanwhile, you only showed only candle and no pairs so that someone could check it out for you.
|
|
|
|
|
Oshosondy
Legendary
 Offline
Activity: 1442
Merit: 1125
Gamble responsibly
|
|
January 03, 2023, 01:26:38 PM |
|
This is not normal wicks, so why like this? it because of low liquidity??
What is your complain? I hope you can also differentiate between candlesticks and wicks? Because both are not the same. I found it hard to know what your complain is about, you see a chart, you screenshot it without indicating any information, it shows less information. As for the chart, it seems normal though. Even the coin you indicates its chart is no known, the time used is not known and many other information not indicated. |
|
|
|
Mpamaegbu
Legendary
Offline
Activity: 2688
Merit: 1208
Once a man, twice a child!
|
|
January 03, 2023, 02:32:05 PM |
|
You're seeing a doji that shows you reversal pattern and you're complaining that it's not a normal wick? What have you come to the wilderness to behold? That type of wick is something many a trader don't like missing for anything because it gives a clear indication of what next to follow. The best way to maximize its use (for me) is to trigger your trade when you notice that the upper or lower candle movements have been exhausted. Well, going forward, I guess you should visit babypips.com to read up on candle patterns.
|
|
|
|
mk4
Legendary
Offline
Activity: 2758
Merit: 3830
Paldo.io 🤖
|
|
January 03, 2023, 11:06:14 PM |
|
There's mostly no such thing as a "not-normal" wick, as there's almost always a reason(outside of API bugs and such) why a chart looks a certain way.
|
|
|
|
|
nara1892
|
|
January 06, 2023, 04:29:47 PM |
|
Can you clarify your question? Honestly, I don't really understand what answer you want with a question like that. The candle that you show is normal, and if you have ever read science that discusses candlesticks, many will explain that.
We always see the candles that you show in price movements, so there's nothing wrong about that. Usually traders who use the scalping method look for this moment for them to trade.
|
| | .
.Duelbits│SPORTS. | | | ▄▄▄███████▄▄▄
▄▄█████████████████▄▄
▄███████████████████████▄
███████████████████████████
█████████████████████████████
███████████████████████████████
███████████████████████████████
███████████████████████████████
█████████████████████████████
███████████████████████████
▀████████████████████████
▀▀███████████████████
██████████████████████████████ | | | | ██
██
██
██
██
██
██
██
██
██
██ | | | | ███▄██▄███▄█▄▄▄▄██▄▄▄██
███▄██▀▄█▄▀███▄██████▄█
█▀███▀██▀████▀████▀▀▀██
██▀ ▀██████████████████
███▄███████████████████
███████████████████████
███████████████████████
███████████████████████
███████████████████████
███████████████████████
▀█████████████████████▀
▀▀███████████████▀▀
▀▀▀▀█▀▀▀▀ | | OFFICIAL EUROPEAN
BETTING PARTNER OF
ASTON VILLA FC | | | | ██
██
██
██
██
██
██
██
██
██
██ | | | | 10% CASHBACK
100% MULTICHARGER | │ | | │ |
|
|
|
|
Zilon
|
|
January 06, 2023, 10:19:47 PM |
|
The wick is just a normal occurrence in the market. From the chart the wick couldn't push price up because the trend wasn't going up, and before the wick formed there was a bearish engulfing candle which later turned into three black soldiers which meant anything that formed after ward will have to obey the bearish trend the reason price kept going down despite the long wick.
|
|
|
|
|
|
DoublerHunter
|
|
January 06, 2023, 10:25:57 PM |
|
This is not normal wicks, so why like this? it because of low liquidity?? ^Is this chart for BTC? I think you need to have more specific in your question because it is hard to guess which coin has low liquidity. As I see it, that is a normal wick because it is obvious that crypto has a volatile nature that can move and wick the price in the market every now and then. That's pattern could be a sign that you need to reinvest again and watch for the reversal. |
|
|
|
|
adaseb
Legendary
Offline
Activity: 3752
Merit: 1710
|
|
January 07, 2023, 04:25:59 AM |
|
These wicks are generally not normal. They are happening now due to a small daily range and poor liquidity. These wicks usually happen during pivots and most commonly at daily highs and lows.
Usually people put their stops at those areas and thats when price ends up hitting a bunch of stops however since liquidity is lower it spikes up more than usual and then reverts back down.
We had this in the past but it wasnt this extreme as it is now.
|
|
|
|
|
dansus021
|
|
January 07, 2023, 10:55:18 AM |
|
I don't know but I usually see types of candle on dogecoin low timeframe like 1 minute or so. and you will see bunch of it in stablecoin pair like USDT/USD, BUSD/USDT and other type of stablecoin.
|
| .
.Duelbits. | │ | | │ | ▄▄█▄▄░░▄▄█▄▄░░▄▄█▄▄
███░░░░███░░░░███
▀░░░▀░░▀░░░▀░░▀░░░▀
▄░░░░░░░░░░░░
▀██████████
░░░░░███░░░░▀
░░█░░░███▄█░░░█
░░██▌░░███░▀░░██▌
░█░██░░███░░░█░██
░█▀▀▀█▌░███░░█▀▀▀█▌
▄█▄░░░██▄███▄█▄░░▄██▄
▄███▄
░░░░▀██▄▀ | .
REGIONAL
SPONSOR | | ███▀██▀███▀█▀▀▀▀██▀▀▀██
██░▀░██░█░███░▀██░███▄█
█▄███▄██▄████▄████▄▄▄██
██▀ ▀███▀▀░▀██▀▀▀██████
███▄███░▄▀██████▀█▀█▀▀█
████▀▀██▄▀█████▄█▀███▄█
███▄▄▄████████▄█▄▀█████
███▀▀▀████████████▄▀███
███▄░▄█▀▀▀██████▀▀▀▄███
███████▄██▄▌████▀▀█████
▀██▄███▀██▄█▄▄▄██▄████▀
▀▀██████████▄▄███▀▀
▀▀▀▀█▀▀▀▀ | .
EUROPEAN
BETTING
PARTNER | |
|
|
|
|
Mr. Magkaisa
|
|
January 07, 2023, 11:20:54 AM |
|
This is not normal wicks, so why like this? it because of low liquidity?? - I don't know nor understand what you want to point out in this topic you made. Because the only thing I can see is the candlestick between buyers and sellers and the big lines at the end of the candlestick that is long and short. What is your problem with that OP? So what crypto is that? Bitcoin? or what? because if I look at the chart, it's moving normally regardless of the coin you're referring to. |
| | .
Duelbits | │ | | │ | DUELBITS
FANTASY
SPORTS | ████▄▄▄█████▄▄▄
░▄████████████████▄
▐██████████████████▄
████████████████████
████████████████████▌
█████████████████████
████████████████▀▀▀
███████████████▌
███████████████▌
████████████████
████████████████
████████████████
████▀▀███████▀▀ | .
▬▬
VS
▬▬ | ████▄▄▄█████▄▄▄
░▄████████████████▄
▐██████████████████▄
████████████████████
████████████████████▌
█████████████████████
███████████████████
███████████████▌
███████████████▌
████████████████
████████████████
████████████████
████▀▀███████▀▀ | /// PLAY FOR FREE ///
WIN FOR REAL | │ | █████
██
██
██
██
██
██
██
██
██
██
██
█████ | ██████████████████████████████████████████████████████
.
PLAY NOW
.
██████████████████████████████████████████████████████ | █████
██
██
██
██
██
██
██
██
██
██
██
█████ | |
|
|
|
hugeblack
Legendary
Offline
Activity: 2506
Merit: 3645
Buy/Sell crypto at BestChange
|
|
January 07, 2023, 12:58:08 PM |
|
This is not normal wicks, so why like this? it because of low liquidity?? So, more than 3 days, you got some responses without giving us any additional details, this screenshot does not show anything, there are no additional details, and therefore all responses will be far from what you want to get. Candles alone and for a short period will not tell you much, but when used with trading strategies, you will get a better ability to predict the long term. |
|
|
|
|
so98nn
|
|
January 07, 2023, 01:06:59 PM |
|
There's mostly no such thing as a "not-normal" wick, as there's almost always a reason(outside of API bugs and such) why a chart looks a certain way.
Give it zoom in and zoom out, it's even not the normal wick. Lolz. Charts could be funny and the perspective will change as we view them on different scale. The only person that could answer this correctly is the op and the way they are looking at the candlesticks. Try rendering different scales and also adding methods for TA so that you can understand why are that particular coin is behaving like that. Plus, no one even knows in what relation these candlesticks are and whats the asset behind it. (like one could tell about bitcoin, at X time, on Y day, with AB factor). You are asking everyone to find needle in haystack. |
|
|
|
|
|


