Bitcoin Forum
April 28, 2024, 07:49:51 AM *
News: Latest Bitcoin Core release: 27.0 [Torrent]
 
   Home   Help Search Login Register More  
Pages: [1]
  Print  
Author Topic: How to use Rising Wedge Pattern??  (Read 149 times)
thecryptogandalf (OP)
Member
**
Offline Offline

Activity: 147
Merit: 21


View Profile
June 06, 2023, 03:09:47 PM
Merited by hugeblack (2), GreatArkansas (1)
 #1

Chart patterns are one of the key tools for traders to understand market behavior and predict future price movements accurately. Whether you're a newbie or an experienced trader, they can enhance your strategies and boost profits. So, I thought it will be useful to summarize the article for the people here. Here is the source, where you can find also other chart patterns.

The rising wedge pattern is a triangle pattern characterized by both trendlines heading in an upward direction. It often occurs during consolidation phases in an uptrend and can indicate a potential reversal in the previous upward trend. This forum post will provide a summary of the key points discussed in the article and shed light on how to identify and trade this pattern effectively.

What is Rising Wedge Pattern:

A wedge pattern is a triangle pattern with both trendlines heading in the same direction. A rising wedge has both lines heading upward, with the lower bound rising more quickly than the upper bound. Rising Wedge patterns are more common during consolidation periods, but they can provide more significant signal after a peak has already been established. The price usually stays within the trendlines (with no intraday or fake breakouts) until the final breakout occurs. Rising Wedge patterns can play different roles, serving as consolidation patterns against or with the prevailing trend or as topping patterns, particularly when accompanying a liquidity run peak.
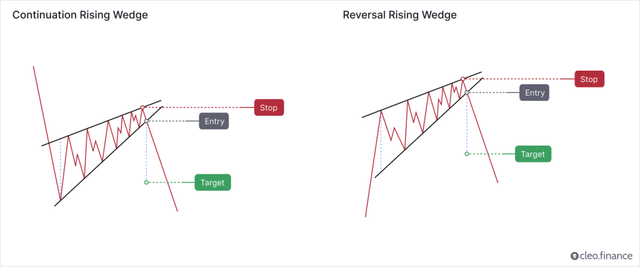


Continuation or Reversal Pattern?


The rising wedge pattern is commonly considered a bearish reversal pattern. However, it’s important to note that each subsequent peak and trough is getting shorter than the last, indicating that bearish momentum is building.

On the other hand, there are cases where the rising wedge pattern can act as a continuation pattern. If the pattern forms in an uptrend and the price breaks above the upper trendline, it may indicate that the bulls are still in control and the price is likely to continue higher. However, this is less common than the bearish reversal scenario.

According to Thomas Bulkowski's findings, the rising wedge tends to perform better in upward breakouts, compared to downward breakouts. The pattern ranked 32nd out of 39 chart patterns for upward breakouts and ranked last out of 36 chart patterns for downward breakouts.


Identifying a Good Rising Wedge Pattern:

The rising wedge pattern can be challenging to identify accurately, but there are guidelines to simplify the process.

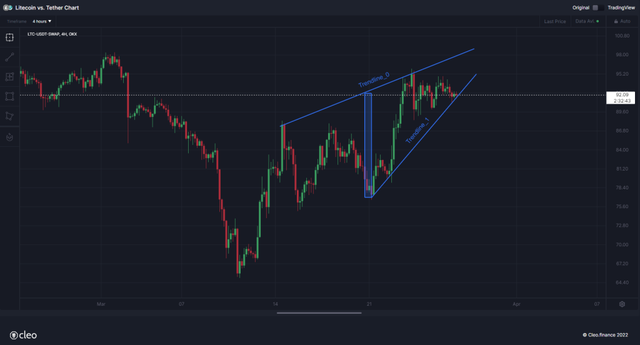
Look for price movements that form higher highs and higher lows within the two trendlines, which contain the price most of the time.

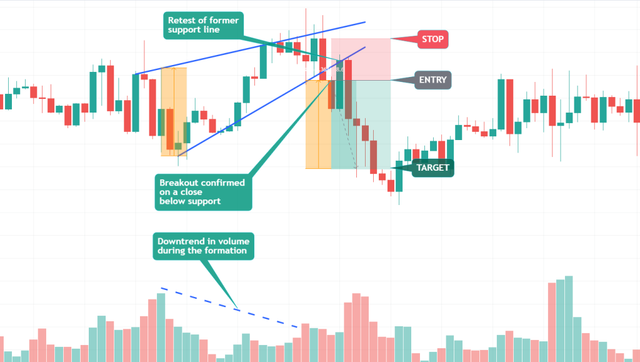
Diminishing volume during the pattern formation is typical.

According to Bulkowski, to be classified as a wedge, the pattern needs to touch at least five reversal points in total – three on one trendline and a minimum of two on the other trendline.

Rising wedges can form during a long downward price trend or after an upward peak, resembling small rallies against the overall trend.

When a rising wedge pattern reaches a peak, the chances are high that the break out will be downward. This is because the emotions and commitments have been exhausted during the peak and that leaves little room for a comeback during the test phase.


Target and Stop Loss Placement:

For target placement, measure the height of the wedge at its widest point and extend that distance up from the trendline breakout.


Stops are commonly placed above the top side of the rising wedge.

Aim for a risk-to-reward ratio of at least 2R (two units of potential reward for every unit of risk).

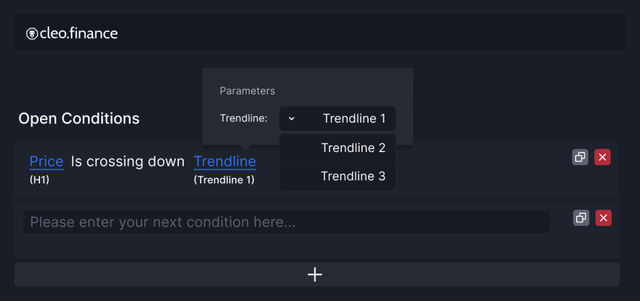
How to incorporate Rising Wedge Pattern into your automated trading strategy?

To include the Rising Wedge Pattern in your automated trading strategy, you can identify the pattern on the cleo.finance chart and use the pattern's lines as your automated entry and exit conditions, along with your stop losses and take profits. Then automate it.


1714290591
Hero Member
*
Offline Offline

Posts: 1714290591

View Profile Personal Message (Offline)

Ignore
1714290591
Reply with quote  #2

1714290591
Report to moderator
1714290591
Hero Member
*
Offline Offline

Posts: 1714290591

View Profile Personal Message (Offline)

Ignore
1714290591
Reply with quote  #2

1714290591
Report to moderator
1714290591
Hero Member
*
Offline Offline

Posts: 1714290591

View Profile Personal Message (Offline)

Ignore
1714290591
Reply with quote  #2

1714290591
Report to moderator
"The nature of Bitcoin is such that once version 0.1 was released, the core design was set in stone for the rest of its lifetime." -- Satoshi
Advertised sites are not endorsed by the Bitcoin Forum. They may be unsafe, untrustworthy, or illegal in your jurisdiction.
1714290591
Hero Member
*
Offline Offline

Posts: 1714290591

View Profile Personal Message (Offline)

Ignore
1714290591
Reply with quote  #2

1714290591
Report to moderator
1714290591
Hero Member
*
Offline Offline

Posts: 1714290591

View Profile Personal Message (Offline)

Ignore
1714290591
Reply with quote  #2

1714290591
Report to moderator
1714290591
Hero Member
*
Offline Offline

Posts: 1714290591

View Profile Personal Message (Offline)

Ignore
1714290591
Reply with quote  #2

1714290591
Report to moderator
hugeblack
Legendary
*
Offline Offline

Activity: 2492
Merit: 3611


Buy/Sell crypto at BestChange


View Profile WWW
June 07, 2023, 11:50:09 AM
 #2

Thanks for the explanation, but I think that some of the images need to be re-adjusted for the images and more explanation on how to use each pattern, but before that you need to define the user of what the pattern is and how to define it, and then explain the types of patterns.
Also, reading trading patterns must be within the trading strategy, in which trading volumes must be explained, in addition to support and resistance levels and expectations for price direction, all of which are additional factors to ensure that the trading pattern you are trying to anticipate is real.
Also, defining the trading framework is an additional and decisive factor in such things.

.BEST..CHANGE.███████████████
██
██
██
██
██
██
██
██
██
██
██
██
██
██
██
██
██
██
██
██
██
██
██
██
███████████████
..BUY/ SELL CRYPTO..
Tytanowy Janusz
Legendary
*
Offline Offline

Activity: 2156
Merit: 1622


View Profile
June 07, 2023, 02:42:57 PM
 #3

Good topic. According to Barry D. Moore CFTe rising wedge has a success rate of 81% which is super decent in TA. Also in crypto trading wedges are very popular andvery accurate (this 81% sounds very likely). One of my best patter.

Speaking of rising wedges, it begs to mention falling wedges. After all, it is exactly the same pattern with the same specifics and principles, but only in the opposite direction. 1 more photo and 2 more sentences and the topic is supplemented with a second pattern.
thecryptogandalf (OP)
Member
**
Offline Offline

Activity: 147
Merit: 21


View Profile
June 08, 2023, 02:07:00 PM
 #4

Good topic. According to Barry D. Moore CFTe rising wedge has a success rate of 81% which is super decent in TA. Also in crypto trading wedges are very popular andvery accurate (this 81% sounds very likely). One of my best patter.

Speaking of rising wedges, it begs to mention falling wedges. After all, it is exactly the same pattern with the same specifics and principles, but only in the opposite direction. 1 more photo and 2 more sentences and the topic is supplemented with a second pattern.

You brought up a good point about falling wedges being the flip side of rising wedges. They share the same principles but go in the opposite direction. I was planning to mention falling wedges separately in another post but may be it is good to add here in this post. I will update post, thanks for the comment.
jeraldskie11
Sr. Member
****
Offline Offline

Activity: 1246
Merit: 356


View Profile
June 08, 2023, 03:44:00 PM
 #5

I thought the rising wedge pattern could only be used as a bearish pattern. When I started learning to trade through free YouTube videos, I studied pattern trading. This method, I suppose, is well-known but still profitable. That is why, even if I am not currently employing this strategy, I will not prevent others from doing it. The significance of that approach is that you should have a confluence such as RSI, Volume, or MACD that shows a bearish divergence, as we saw in the Op. So, in my opinion, the more confluences you have, the more likely it is that your trade will work.

💀|.
   ▄▄▄▄█▄▄              ▄▄█▀▀  ▄▄▄▄▄█      ▄▄    ▄█▄
  ▀▀▀████████▄  ▄██    ███▀ ▄████▀▀▀     ▄███   ▄███
    ███▀▄▄███▀ ███▀   ███▀  ▀█████▄     ▄███   ████▄
  ▄███████▀   ███   ▄███       ▀▀████▄▄███████████▀
▀▀███▀▀███    ███ ▄████       ▄▄████▀▀████   ▄███
 ██▀    ▀██▄  ██████▀▀   ▄▄█████▀▀   ███▀   ▄██▀
          ▀▀█  ▀▀▀▀ ▄██████▀▀       ███▀    █▀
                                      ▀
.
.PLAY2EARN.RUNNER.GAME.
||VIRAL
REF.SYSTEM
GAME
|
████████████████████████████
████████████████████████████
████████████████████████████
██████ ▄▀██████████  ███████
███████▄▀▄▀██████  █████████
█████████▄▀▄▀██  ███████████
███████████▄▀▄ █████████████
███████████  ▄▀▄▀███████████
█████████  ████▄▀▄▀█████████
███████  ████████▄▀ ████████
████████████████████████████
████████████████████████████
████████████████████████████
████████████████████████████
████████████████████████████
████████████████████████████
████████▀▀▄██████▄▀▀████████
███████  ▀        ▀  ███████
██████                ██████
█████▌   ███    ███   ▐█████
█████▌   ▀▀▀    ▀▀▀   ▐█████
██████                ██████
███████▄  ▀██████▀  ▄███████
████████████████████████████
████████████████████████████
████████████████████████████
rhomelmabini
Hero Member
*****
Offline Offline

Activity: 2002
Merit: 578


View Profile
June 08, 2023, 04:08:45 PM
 #6

What's the best pair of indicator for a rising wedge, is it RSI or just focus on the volume? I mean they could be both good but for you what would be the best pair just referring on your post considering it was the only indicator being used in this example. Or having a multiple indicators or confluence as per jeraldskie11 said? Thanks! Not that really good in these type of patterns plus  indicators.
jeraldskie11
Sr. Member
****
Offline Offline

Activity: 1246
Merit: 356


View Profile
June 08, 2023, 11:22:01 PM
 #7

What's the best pair of indicator for a rising wedge, is it RSI or just focus on the volume? I mean they could be both good but for you what would be the best pair just referring on your post considering it was the only indicator being used in this example. Or having a multiple indicators or confluence as per jeraldskie11 said? Thanks! Not that really good in these type of patterns plus  indicators.
If you're a trader, you probably agree that the more confluences you use in your setup, the more likely you are to win the trade. There are so-called "schools of traders" who trade solely on RSI, Volume, FIB, and other indicators. If the RSI shows signs of weakness, such as overbought and bearish divergences, it signals that demand is decreasing. Volume also shows bearish divergences, indicating that demand is low. The point is, not every time you see a rising wedge or any pattern in the chart, you will notice a bearish divergence in RSI and Volume; sometimes you won't. There is often a bearish divergence in RSI but not in Volume. That's why, when you get bearish divergences both RSI and Volume along with a bearish pattern on the chart, it's a high probability trade for me.

💀|.
   ▄▄▄▄█▄▄              ▄▄█▀▀  ▄▄▄▄▄█      ▄▄    ▄█▄
  ▀▀▀████████▄  ▄██    ███▀ ▄████▀▀▀     ▄███   ▄███
    ███▀▄▄███▀ ███▀   ███▀  ▀█████▄     ▄███   ████▄
  ▄███████▀   ███   ▄███       ▀▀████▄▄███████████▀
▀▀███▀▀███    ███ ▄████       ▄▄████▀▀████   ▄███
 ██▀    ▀██▄  ██████▀▀   ▄▄█████▀▀   ███▀   ▄██▀
          ▀▀█  ▀▀▀▀ ▄██████▀▀       ███▀    █▀
                                      ▀
.
.PLAY2EARN.RUNNER.GAME.
||VIRAL
REF.SYSTEM
GAME
|
████████████████████████████
████████████████████████████
████████████████████████████
██████ ▄▀██████████  ███████
███████▄▀▄▀██████  █████████
█████████▄▀▄▀██  ███████████
███████████▄▀▄ █████████████
███████████  ▄▀▄▀███████████
█████████  ████▄▀▄▀█████████
███████  ████████▄▀ ████████
████████████████████████████
████████████████████████████
████████████████████████████
████████████████████████████
████████████████████████████
████████████████████████████
████████▀▀▄██████▄▀▀████████
███████  ▀        ▀  ███████
██████                ██████
█████▌   ███    ███   ▐█████
█████▌   ▀▀▀    ▀▀▀   ▐█████
██████                ██████
███████▄  ▀██████▀  ▄███████
████████████████████████████
████████████████████████████
████████████████████████████
GreatArkansas
Legendary
*
Offline Offline

Activity: 2296
Merit: 1345


Buy/Sell crypto at BestChange


View Profile WWW
June 09, 2023, 01:33:06 AM
Merited by hugeblack (1)
 #8

What's the best pair of indicator for a rising wedge, is it RSI or just focus on the volume? I mean they could be both good but for you what would be the best pair just referring on your post considering it was the only indicator being used in this example. Or having a multiple indicators or confluence as per jeraldskie11 said? Thanks! Not that really good in these type of patterns plus  indicators.
Some momentum indicators would do for the pairing indicator for this pattern.
RSI is not on the volume, it's a momentum oscillator that measures the change in price movements. And it will help you to identify if the asset is oversold or overbought, this indicator is very good to use when you are about to entry a trade or exit a trade because it will help you to decide when to enter or exit.

.BEST..CHANGE.███████████████
██
██
██
██
██
██
██
██
██
██
██
██
██
██
██
██
██
██
██
██
██
██
██
██
███████████████
..BUY/ SELL CRYPTO..
348Judah
Hero Member
*****
Offline Offline

Activity: 700
Merit: 521


View Profile
June 09, 2023, 11:42:21 AM
Merited by fillippone (1)
 #9

Chart patterns such as the rising wedge can be useful tools for traders. The rising wedge is a triangular pattern with both trendlines pointing up. It often occurs during the consolidation phases of an uptrend and may indicate a possible reversal. The rising wedge has a rapidly rising lower boundary and an upper boundary.

In trading, we keep learning new and more patterns from what others having been using, though this kind of pattern can also be included in ones trading plan to serve as good indicators for to get more informations on the chart to give adequate direction on how the flow trend is moving with steady speculation.

The price usually stays within the trend lines until the final breakout.
Rising wedge patterns can play different roles. They can be consolidation patterns when they oppose or work with the prevailing trend. They can also be top patterns, especially when liquidity peaks. It is important to note that patterns do not guarantee a certain outcome and may be subject to false signals. Therefore, for successful trading, rely not only on chart patterns, but also on other analytical tools and strategies.

One can always give a try and see if this pattern can be work out as expected, we can also use it in combination with other indicators to arrived on a good result for our trading experience.

R


▀▀▀▀▀▀▀██████▄▄
████████████████
▀▀▀▀█████▀▀▀█████
████████▌███▐████
▄▄▄▄█████▄▄▄█████
████████████████
▄▄▄▄▄▄▄██████▀▀
LLBIT
  CRYPTO   
FUTURES
 1,000x 
LEVERAGE
COMPETITIVE
    FEES    
 INSTANT 
EXECUTION
.
   TRADE NOW   
Flexystar
Full Member
***
Offline Offline

Activity: 1092
Merit: 227


View Profile
June 09, 2023, 02:12:26 PM
Merited by fillippone (1)
 #10

I am thankful to this guy for sharing such good article on the finances. The blog is written super nice and could help me understand more about the trading pattern. Frankly I have seen many videos on YouTube (which are shit) and they try to show you similar charts but they always fail to explain in a great detail as you did here. If it is your blog then I’m sure you have done good job and all the visitors would be befitting from this. Now I see how important it is to learn about the trading charts and how they process the information for future updates.

I think I will take few lessons from this and try my luck. Honestly, I am guy who is Bitcoin Hodler since long and never tried the hardcore trading because of the same reason as we are discussing here - technical analysis knowledge. Good luck to all
cute nmp
Jr. Member
*
Offline Offline

Activity: 1652
Merit: 3


View Profile
June 09, 2023, 06:43:31 PM
Merited by fillippone (1)
 #11

The Rising Wedge pattern is a bearish reversal pattern that consists of converging trendlines sloping upward. Traders can use this pattern by looking for a break below the lower trendline as a potential signal to enter short positions. They may also consider using additional technical indicators or confirming signals to strengthen their trading decisions, such as bearish candlestick patterns or decreasing volume during the pattern formation. Risk management and setting appropriate stop-loss levels are crucial when trading based on the Rising Wedge pattern.

▀ ▀ ▀ ▀ ▀ ▀          SUGARS.ZONE     ❤[nbs
adaseb
Legendary
*
Offline Offline

Activity: 3738
Merit: 1708


View Profile
June 10, 2023, 04:48:25 AM
Merited by fillippone (1)
 #12

I find this to be one of the most unreliable indicators out there. In your examples it looks like a good setup because it worked however if you draw these in real time you will find out that you will get chopped due to how unreliable the odds are the wedge breaks.

I think the only common technical indicator is a basic horizontal support and resistance. Most trades can spot these areas and usually around them is some action. Same with psychological numbers. Sometimes on the very high time frames you can add Fibonacci, however even that can be unreliable at times.

.BEST..CHANGE.███████████████
██
██
██
██
██
██
██
██
██
██
██
██
██
██
██
██
██
██
██
██
██
██
██
██
███████████████
..BUY/ SELL CRYPTO..
gunhell16
Sr. Member
****
Offline Offline

Activity: 1680
Merit: 474


Crypto Swap Exchange


View Profile
June 10, 2023, 06:25:57 AM
 #13

Nice dude, you did a great job, it's an added knowledge for me and also for other communities here on the forum. Because based on the illustration you gave here on the topic you made, I discovered that it can be used in the same season as the bear and bull market.

That is if it can be used by reading the chart correctly, although it is not that easy to be applied immediately in actual trade activity. And it's just my idea because trading is more about reading the high and low swing and reading the chart and using other tools in the trading view, thank you OP.

█▀▀▀


█▄▄▄
▀▀▀▀▀▀▀▀▀▀▀
e
▄▄▄▄▄▄▄▄▄▄▄
█████████████
████████████▄███
██▐███████▄█████▀
█████████▄████▀
███▐████▄███▀
████▐██████▀
█████▀█████
███████████▄
████████████▄
██▄█████▀█████▄
▄█████████▀█████▀
███████████▀██▀
████▀█████████
▀▀▀▀▀▀▀▀▀▀▀▀▀▀▀▀▀▀▀▀▀
c.h.
▄▄▄▄▄▄▄▄▄▄▄▄▄▄▄▄▄▄▄▄▄
▀▀▀█


▄▄▄█
▄██████▄▄▄
█████████████▄▄
███████████████
███████████████
███████████████
███████████████
███░░█████████
███▌▐█████████
█████████████
███████████▀
██████████▀
████████▀
▀██▀▀
Zilon
Sr. Member
****
Offline Offline

Activity: 966
Merit: 421

Bitcoindata.science


View Profile WWW
June 10, 2023, 07:00:33 AM
 #14

Nice job! This rising wedge forms higher lows and lower highs and this is one strong indication for a reversal because since the highs is not going above the highs of the previous high it Shows the bears are gradually entering the market in which if this moves and forms a wedge in an uptrend there is a big chance of a sell. Some times there is a fake break out towards the bull and if one doesn't understand this wedge pattern the fall towards the wrong price direction following the fake break out.
thecryptogandalf (OP)
Member
**
Offline Offline

Activity: 147
Merit: 21


View Profile
June 12, 2023, 12:20:27 PM
 #15

Nice job! This rising wedge forms higher lows and lower highs and this is one strong indication for a reversal because since the highs is not going above the highs of the previous high it Shows the bears are gradually entering the market in which if this moves and forms a wedge in an uptrend there is a big chance of a sell. Some times there is a fake break out towards the bull and if one doesn't understand this wedge pattern the fall towards the wrong price direction following the fake break out.

 Thanks! That is correct, the higher highs are getting shorter and shorter which indicates the bears are getting in control.  Fake break out it is always important to wait for the confirmation and watch out guidelines strictly.
Pages: [1]
  Print  
 
Jump to:  

Powered by MySQL Powered by PHP Powered by SMF 1.1.19 | SMF © 2006-2009, Simple Machines Valid XHTML 1.0! Valid CSS!