Bitcoin Forum
May 02, 2024, 09:28:30 PM *
News: Latest Bitcoin Core release: 27.0 [Torrent]
 
   Home   Help Search Login Register More  
Pages: [1]
  Print  
Author Topic: BARR Pattern - Best performing chart pattern according to Bulkowski Stats  (Read 100 times)
thecryptogandalf (OP)
Member
**
Offline Offline

Activity: 147
Merit: 21


View Profile
July 12, 2023, 12:22:49 PM
 #1

Chart patterns, when combined with technical indicators, offer crucial insights to traders, enhancing their market analysis capabilities. These patterns serve as invaluable tools within a trader's toolkit. I made a short summary of another article for you, about the bump and reversal bottom (BARR)  pattern. Thet the source is here, where you can also learn about other chart patterns.

What is a Bump and Run Reversal Bottom (BARR) Pattern?

The Bump and Run Reversal Bottom (BARR) pattern is characterized by three distinct phases: the lead-in phase, the bump phase, and the run phase. The lead-in phase is a period of gradual price decline, followed by a sudden and sharp price increase during the bump phase. The run phase is a gradual price decline that follows the bump phase.


Is the Bump and Run Reversal Bottom (BARR) pattern a Continuation or Reversal Pattern?

The BARR pattern indicates a possible shift from a falling to a rising trend, as it is a reversal pattern. Although continuations sometimes occur, reversal is more likely and effective than continuations.

Bump and Run Reversal Bottom Pattern (BARR) Thomas Bulkowski conducted extensive research on chart patterns. He examined daily data of US stocks and found over 1099 trades based on the breakout Bump and Run Reversal Bottom pattern. The pattern had the best overall performance rank among 39 chart patterns.


(EURUSDT D1 – Bump and Run Reversal Bottom Pattern (BARR))

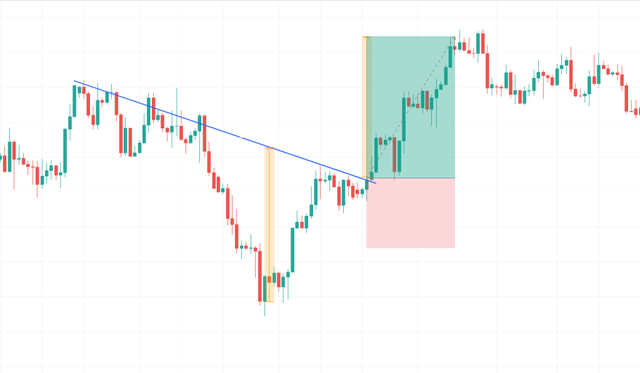
How to Identify a Bump and Run Reversal Bottom (BARR) Pattern?

The bump and Run Reversal Bottom (BARR) pattern has three phases: the lead-in phase, the bump phase, and the run phase. The lead-in phase involves a gradual price decline, while the bump phase is a sudden and sharp price increase. Finally, the run phase is a gradual price decline that follows the bump phase.

The trendline of the BARR pattern connects the lows of the lead-in phase and the bump phase. Once the price breaks through this trendline, it signals a potential trend reversal from a downward to an upward trend.
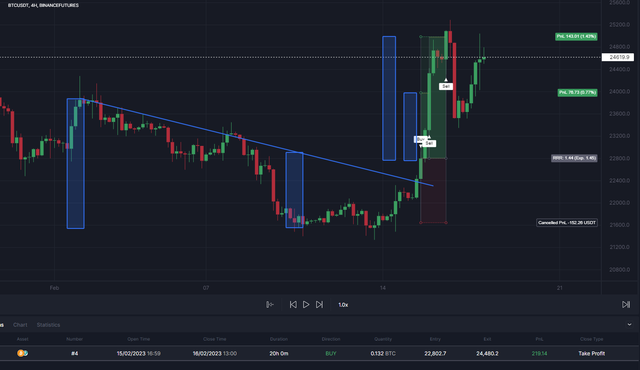

(BTCUSDT D1 – Bump and Run Reversal Bottom Pattern (BARR))

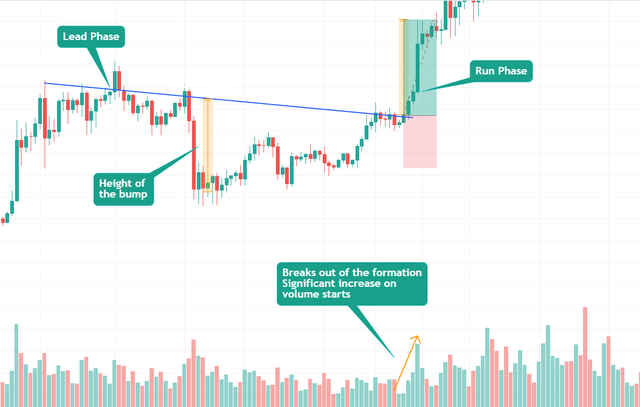
The volume trend during formation has no effect on the performance. But as prices break out of the formation and start moving higher, there is a significant increase in trading volume. Rising prices characterize the uphill run phase.


(GBPUSDT H4 – Bump and Run Reversal Bottom Pattern (BARR))

Where to Place Target and Stop Loss?

Target: Measure the height of the bump and add it to the breakout point.
Stop-loss: Typically placed at the midpoint of the bump phase, aiming for a risk-to-reward ratio of at least 2R.
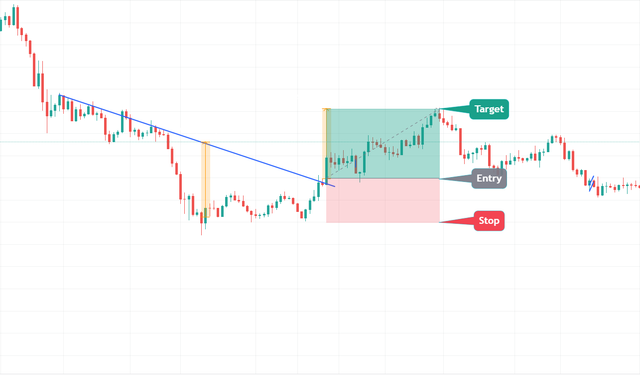

(ETHUSDT D1 – Bump and Run Reversal Bottom Pattern (BARR))

How to Trade a Bump and Run Reversal Bottom (BARR) Pattern Automatically?

To use the BARR Pattern in your automated trading strategy, you can identify the pattern on the cleo.finance chart and use the pattern's lines as your automated entry and exit conditions, along with your stop losses and take profits. Then automate it. You also have the option to backtest the strategy using a manual backtester on the chart equipped with drawing tools. This allows you to simulate the BARR pattern on the chart and assess its effectiveness.  


Advertised sites are not endorsed by the Bitcoin Forum. They may be unsafe, untrustworthy, or illegal in your jurisdiction.
1714685310
Hero Member
*
Offline Offline

Posts: 1714685310

View Profile Personal Message (Offline)

Ignore
1714685310
Reply with quote  #2

1714685310
Report to moderator
1714685310
Hero Member
*
Offline Offline

Posts: 1714685310

View Profile Personal Message (Offline)

Ignore
1714685310
Reply with quote  #2

1714685310
Report to moderator
1714685310
Hero Member
*
Offline Offline

Posts: 1714685310

View Profile Personal Message (Offline)

Ignore
1714685310
Reply with quote  #2

1714685310
Report to moderator
hugeblack
Legendary
*
Offline Offline

Activity: 2506
Merit: 3631


Buy/Sell crypto at BestChange


View Profile WWW
July 13, 2023, 09:17:12 AM
 #2

Thank you for your explanatory explanation, and I was hoping that you would provide new charts explaining the Bump and Run Reversal Bottom (BARR) in current BTC/USDT chart or during the past weeks, but from what I understood, most of us start this model without knowing, as the resistance points are either momentum points to break the next top or Bounce, volume is a confirmatory indicator in this case.

Using this indicator alone without formulating a general strategy will lead to wrong results, as despite the high trading volumes, Bitcoin fails to reverse its direction, but by following the pattern for a longer period, the closer the price is to the top, the easier it is to break it and with lower trading volumes next time.

.BEST..CHANGE.███████████████
██
██
██
██
██
██
██
██
██
██
██
██
██
██
██
██
██
██
██
██
██
██
██
██
███████████████
..BUY/ SELL CRYPTO..
hd49728
Legendary
*
Offline Offline

Activity: 2086
Merit: 1027


View Profile WWW
July 14, 2023, 12:58:23 AM
 #3

Thank you for your explanatory explanation, and I was hoping that you would provide new charts explaining the Bump and Run Reversal Bottom (BARR) in current BTC/USDT chart or during the past weeks, but from what I understood, most of us start this model without knowing, as the resistance points are either momentum points to break the next top or Bounce, volume is a confirmatory indicator in this case.

Using this indicator alone without formulating a general strategy will lead to wrong results, as despite the high trading volumes, Bitcoin fails to reverse its direction, but by following the pattern for a longer period, the closer the price is to the top, the easier it is to break it and with lower trading volumes next time.
Trading volume is most important indicator but a raw trading volume indicator is not enough. I would like to look at Volume profile VPVR indicator on Trading View with a paid account, not free account. It is more helpful to see top and bottom of trading volume and those tops or bottoms will be where the market might have very big movement like break out or break down.

Price tends to move up or down very quickly between two tops on VPVR chart.

.freebitcoin.       ▄▄▄█▀▀██▄▄▄
   ▄▄██████▄▄█  █▀▀█▄▄
  ███  █▀▀███████▄▄██▀
   ▀▀▀██▄▄█  ████▀▀  ▄██
▄███▄▄  ▀▀▀▀▀▀▀  ▄▄██████
██▀▀█████▄     ▄██▀█ ▀▀██
██▄▄███▀▀██   ███▀ ▄▄  ▀█
███████▄▄███ ███▄▄ ▀▀▄  █
██▀▀████████ █████  █▀▄██
 █▄▄████████ █████   ███
  ▀████  ███ ████▄▄███▀
     ▀▀████   ████▀▀
BITCOIN
DICE
EVENT
BETTING
WIN A LAMBO !

.
            ▄▄▄▄▄▄▄▄▄▄███████████▄▄▄▄▄
▄▄▄▄▄██████████████████████████████████▄▄▄▄
▀██████████████████████████████████████████████▄▄▄
▄▄████▄█████▄████████████████████████████▄█████▄████▄▄
▀████████▀▀▀████████████████████████████████▀▀▀██████████▄
  ▀▀▀████▄▄▄███████████████████████████████▄▄▄██████████
       ▀█████▀  ▀▀▀▀▀▀▀▀▀▀▀▀▀▀▀▀▀▀▀▀▀▀▀▀▀  ▀█████▀▀▀▀▀▀▀▀▀▀
▀▀▀▀▀▀▀▀▀▀▀▀▀▀▀▀▀▀▀▀▀▀▀▀▀▀▀▀▀▀▀▀▀▀▀▀▀▀▀▀▀▀▀▀▀▀▀▀▀▀▀▀▀▀▀▀▀▀
.PLAY NOW.
thecryptogandalf (OP)
Member
**
Offline Offline

Activity: 147
Merit: 21


View Profile
July 19, 2023, 07:30:19 AM
 #4

Using this indicator alone without formulating a general strategy will lead to wrong results, as despite the high trading volumes, Bitcoin fails to reverse its direction, but by following the pattern for a longer period, the closer the price is to the top, the easier it is to break it and with lower trading volumes next time.

I fully agree with your point. As I mentioned, chart patterns can be really useful when crafting your strategy but only when you use them a part of your trading arsenal. Using and relying solely on the chart patterns wont provide optimal results definitely.
jeraldskie11
Sr. Member
****
Offline Offline

Activity: 1260
Merit: 356


View Profile
July 23, 2023, 09:18:16 PM
 #5

This is the first time I heard this strategy in trading. The pattern trading that I heard are cup n handle, ascending triangle, pennant, bullish flag, and etc. In my opinion, this is just like accumulation and followed by manipulation and advancing or what we called the power of 3 by ICT. But what makes it different is that it's using breakout entry, which is best since there's a chance that there's no pullback until it hits your target. I just want to know what's the win rate of this strat.
goaldigger
Sr. Member
****
Online Online

Activity: 2352
Merit: 356


View Profile
July 23, 2023, 09:41:06 PM
 #6

This is a good explanation about this indicator and I’m wondering now what other indicators to be used just to complement the idea. Its good if we use the recent trend here so many can relate, anyway if you are going to follow this better to understand as well the other indicators since there are reasons why the price is not moving upward despite of the volume. Indicators are very powerful and can work like this, beginner trader should not skip learning this one.

███████████████████████
████████████████████
██████████████████
████████████████████
███▀▀▀█████████████████
███▄▄▄█████████████████
██████████████████████
██████████████████████
███████████████████████
█████████████████████
███████████████████
███████████████
████████████████████████
███████████████████████████
███████████████████████████
███████████████████████████
█████████▀▀██▀██▀▀█████████
█████████████▄█████████████
███████████████████████
████████████████████████
████████████▄█▄█████████
████████▀▀███████████
██████████████████
▀███████████████████▀
▀███████████████▀
█████████████████████████
O F F I C I A L   P A R T N E R S
▬▬▬▬▬▬▬▬▬▬
ASTON VILLA FC
BURNLEY FC
BK8?█▀▀▀


█▄▄▄
.
PLAY NOW
▀▀▀█


▄▄▄█
Tytanowy Janusz
Legendary
*
Offline Offline

Activity: 2156
Merit: 1622


View Profile
August 28, 2023, 05:25:20 AM
 #7

@OP thanks for a great expalanation of this pattern.

I know its way to soon to call it now, but if bitcoin is about to reverse right here we can see exacly this scenario with a price target @new high of current uptrend:


(BTCUSDT D1 – Bump and Run Reversal Bottom Pattern (BARR))


red - height of the bump
green - run phase

We even had same faked breakout in Lead Phase.
Pages: [1]
  Print  
 
Jump to:  

Powered by MySQL Powered by PHP Powered by SMF 1.1.19 | SMF © 2006-2009, Simple Machines Valid XHTML 1.0! Valid CSS!