With price currently re-testing $42.5K high volume zone, do you think price will reach $45K or $35K first, or simply consolidate longer around $40K?
Decided to provide my own interpretation, based on different time-frames, with my own predictions in the near-term. Feel free to disagree, that's the idea

Have tried maintain some bullish/bearish balance based on time-frames, so perspectives may seem conflicting, hence there is a TL:DR below.
Monthly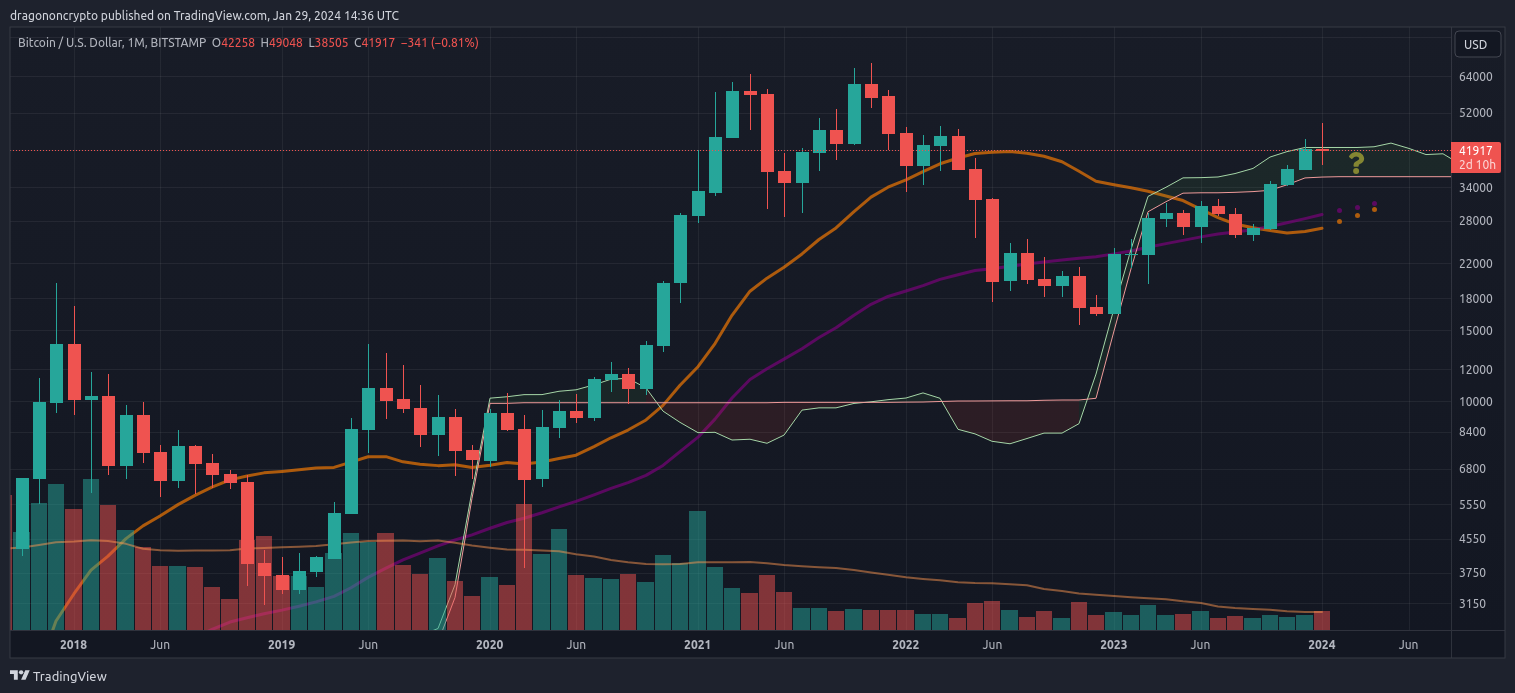
With the Monthly candle closing in a few days, some would consider a red close below $42,258 as bearish. Personally, I'm not of that opinion. The candle itself is currently an indecisive doji candle, signifying indecision in the market as opposed to a trend reversal. It more often than not signals continuation of a trend, whether that be to the upside or the downside. In this case, it'd be to the upside.
It would however be the first red candle after 3 months of upside. I've included the Ichimoku Cloud, which while seemingly insignificant (historically for 10 years on this time-frame), may finally be relevant. While in a bullish structure, price is currently getting rejected by $42.6K resistance band with support around $36K. Consolidation within this range for the coming months is therefore not out the question.
Weekly
Similarly, the Weekly is looking indecisive, highlighting the indecision on the Monthly time-frame. The high volume bearish wick and candle, closing -15% from the highs, has been met with a +10% bullish doji-ish candle to the upside after testing $40K level. Price is otherwise at the 0.5 fib retracement level ($42,240) after rejection from the
anticipated 0.618 retracement level ($48,555).
Despite the current indecision, there is notably more support below than resistance above, signifying that a longer-term uptrend is currently in play. Long-term moving averages are currently at $31.4K (50 WMA) and $30.7K (200 WMA), after the bullish cross-over this month. Cloud support is otherwise between $27K and $23.6K, highlighting significant support at lower levels, as well as volume support.
Daily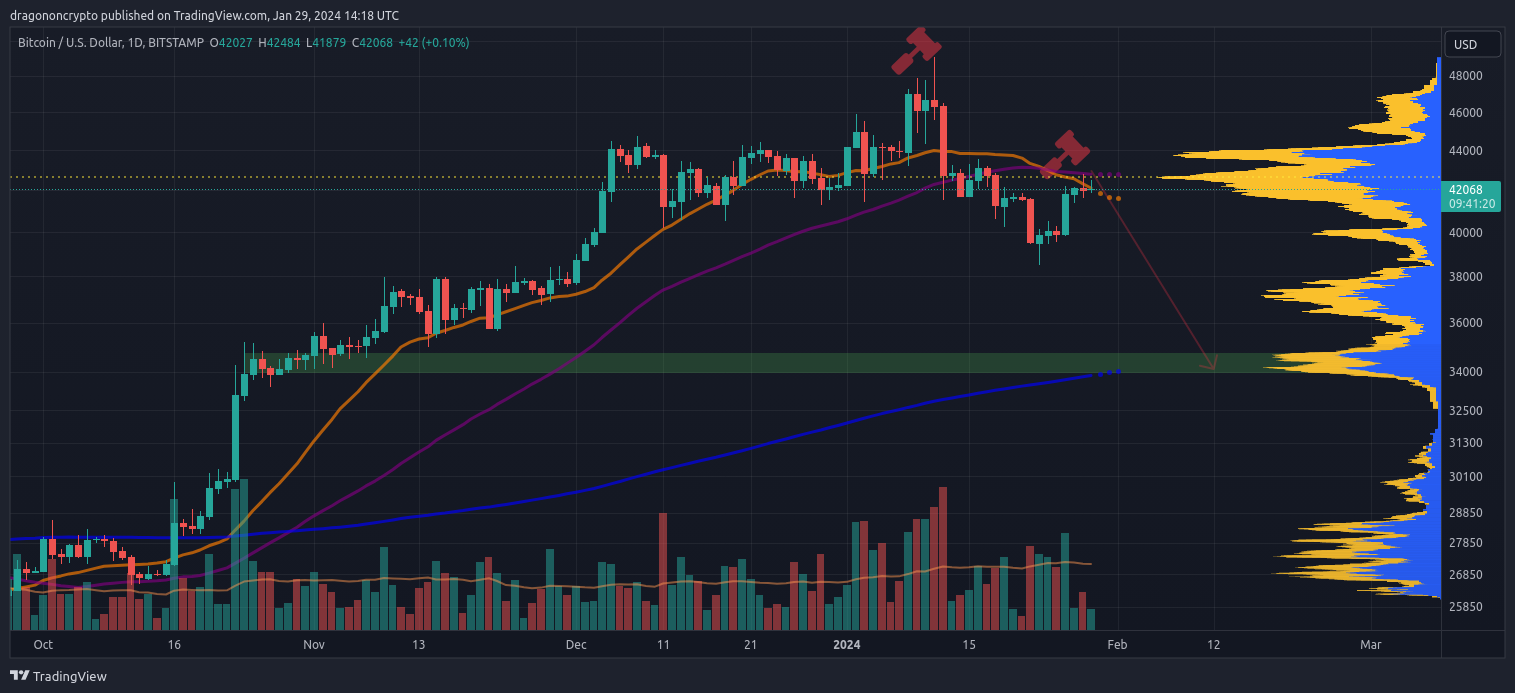
This is where it get's iffy. After the January 12th sell-off, price failed to utilise the 50 Day MA as support, previously untested throughout the past 3 month bull run. Price is further struggling to maintain the previous accumulation zone, and instead is threatening to turn it into new resistance, in order to confirm further downside. While I still think a re-test of $44K to $45K previous resistance levels, above the Weekly high closes remains likely (the latter being the 0.618 fib retracement from recent high to recent low), the current structure suggests otherwise unless $43K can swiftly be reclaimed.
Confirming the accumulation zone as distribution, would most likely lead to further downside. While there is volume support between $36K and $38K, the longer-term support on this time-frame (after breaching the immediate 50 DMA support level) is around $34K to $35K where the 200 DMA is priced, as well as where there was previous consolidation and therefore volume support.
4 hour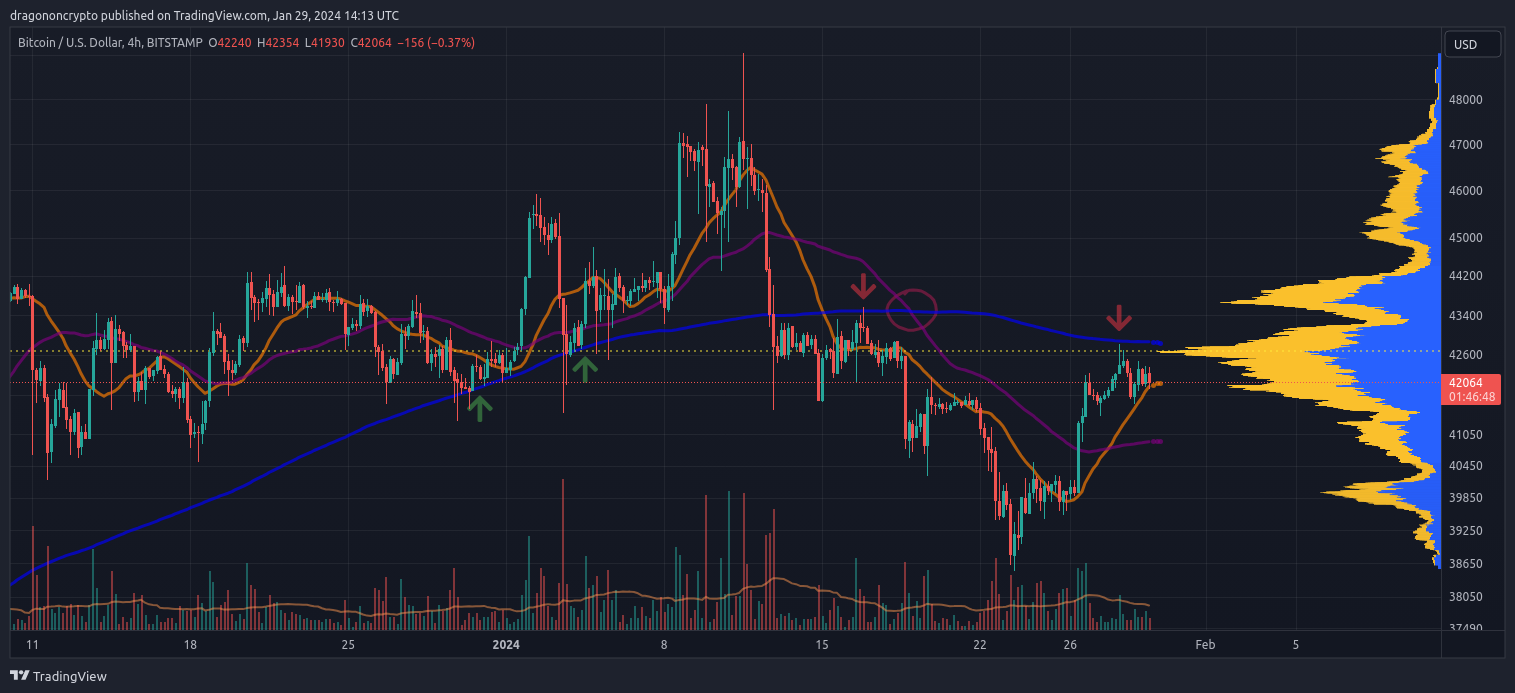
Now to look at the 4hr, does it match up with the indecisive Weekly or Monthly charts or allign more so with the bearish Daily signals? Unfortunately, it's very much the latter. The 200 MA, that previously twice acted as support, has now twice acted as resistance. This is also at the same level as the 50 Day MA and volume profile point of control, as a cluster of resistance required to be broken in order to avoid further downside.
There was additionally a death cross of the 50 & 200 MAs at $41,283 (as circled) after the golden cross in September 18th last year at $26,266. To put this into context, for short-term traders, after a +57% move from golden cross to bear cross, despite the current decline of -15% from recent high prior to the bearish crossover occuring, it does signal to take profits after 4 months, until a new uptrend is confirmed.
TL:DR Summary- Weekly time-frame, the market remains in a bull trend until $23-30K levels, with the uptrend being in a corrective phase when below $38K, that has still yet to be seen (bullish)
- Daily, the market remains in a bull trend above $35K, even if the uptrend is currently undergoing a short-term correction/consolidation when below $43K (neutral)
- 4hr, price remains in a textbook bear trend until at minimum $43K is reclaimed and maintained, followed by an MA golden cross trend reversal (bearish)
Overall, given the bearish short-term pressure on price, followed by the neutral mid-term outlook that's eyeing up a corrective move back to $35K support, this is what I believe will turn the Weekly from bullish to neutral in order for a correction to lower level support to occur. Consecutive Weekly closes back above $44K would otherwise nullify this analysis, breaking below $38K would further confirm it.


 Poll
Poll
