TL;DR: I present a second strategy to outperform buy and hold. Bitcoin has excellent performance when stocks have low volatility. Bitcoin has poor performance when stocks have high volatility. Only holding Bitcoin during low-volatility-times gives you higher returns with lower drawdowns than buy and hold. However this strategy is still inferior to timing the Bitcoin cycle (buy trend-40%, sell trend+750 days). Combining cycle and volatility information does not improve results vs. only timing the cycle, but can give you additional clarity about our position in the cycle.How would you use our indicator (Bitcoin outperforming during periods of low volatility) to modify buy and hold or DCA?
Above average volatility in the S&P 500 stock index is associated with poor Bitcoin returns in a stable way.evidence #1

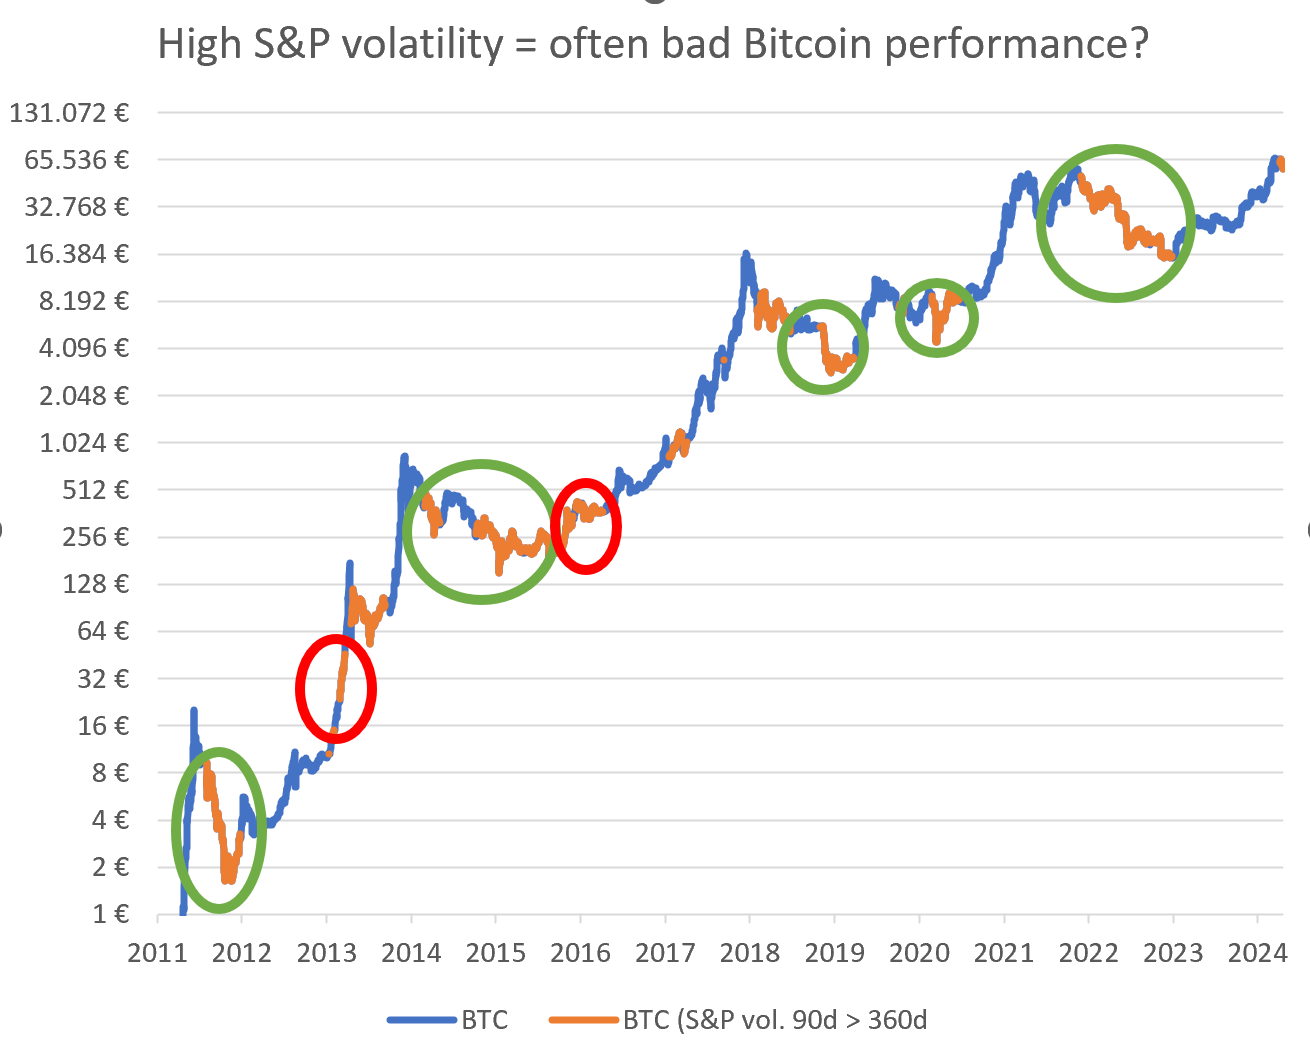
 Chart description:
- blue line = Bitcoin price at low S&P volatility
- orange line = Bitcoin price during high S&P volatility
- green circle = expected result: high S&P volatility leads to poor bitcoin performance
- red circle = unexpected result: good bitcoin performance despite high S&P volatility
- yellow circle = no significant bitcoin price movement during high S&P volatility
Interpretation: As you can see, most of our cycles are green, so high S&P volatility almost always gives us poor Bitcion returns. There are a few periods where our bitcoin volatility indicator "does not work" and bitcoin performs well despite above average S&P volatility. I like the stability of the results. No matter how we measure short-term (30 days or 90 days) and long-term (360 days or 500 days) volatility, our volatility indicator works reliably.
evidence #2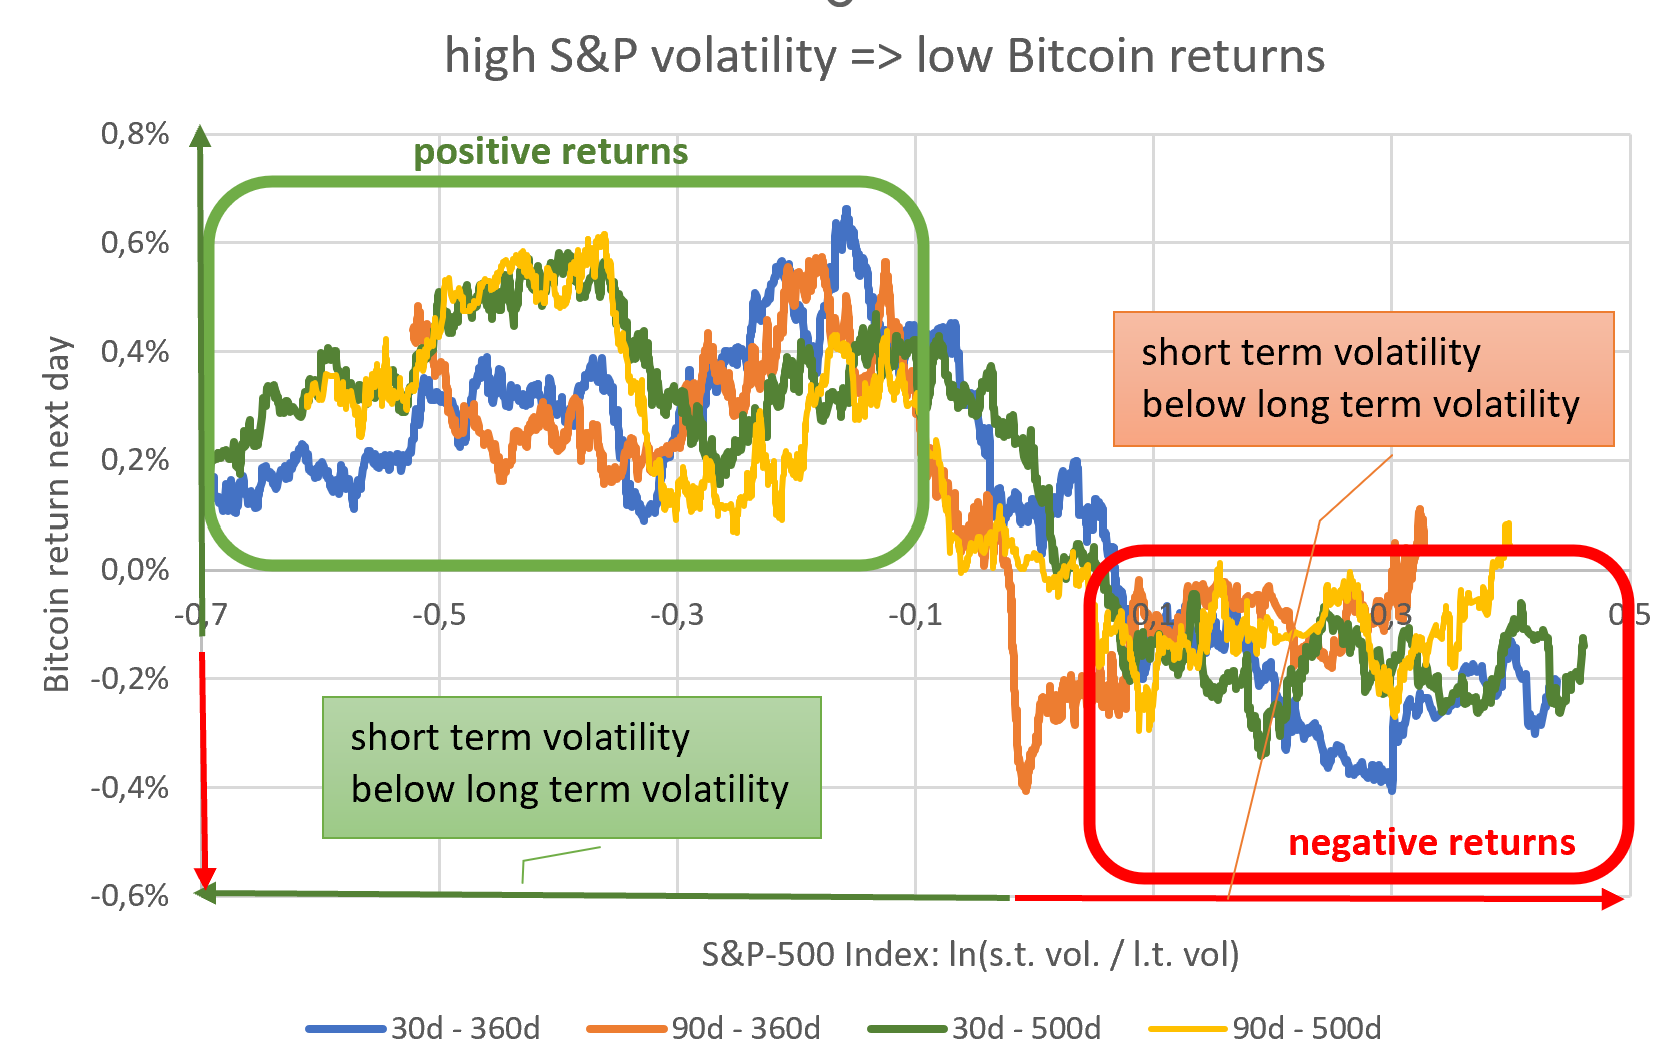 Chart description:
 We can plot the relative short-term to long-term volatility of the S&P on the x-axis. We can then plot the expected daily price return on Bitcoin on the y-axis. To average out the noise, I have calculated 500 day averages of 250 data points with worse higher volatility and 250 data points with lower volatility.
Interpretation: High S&P volatility gives you negative bitcoin returns the following day. Low volatility gives you positive bitcoin returns the next day. The positive Bitcoin returns are quite stable between -0.7 (very low volatility) and -0.1 (moderately low volatility). It is also stable no matter how we measure our volatility (30d/90d/360d/500d).
Why do we like stable results? Stable results in the past are more likely to be stable in the future and are more likely to provide outperformance than a model based on unstable results.
An example of unstable results is plotting bitcoin's next-day price returns against bitcoin's own volatility.
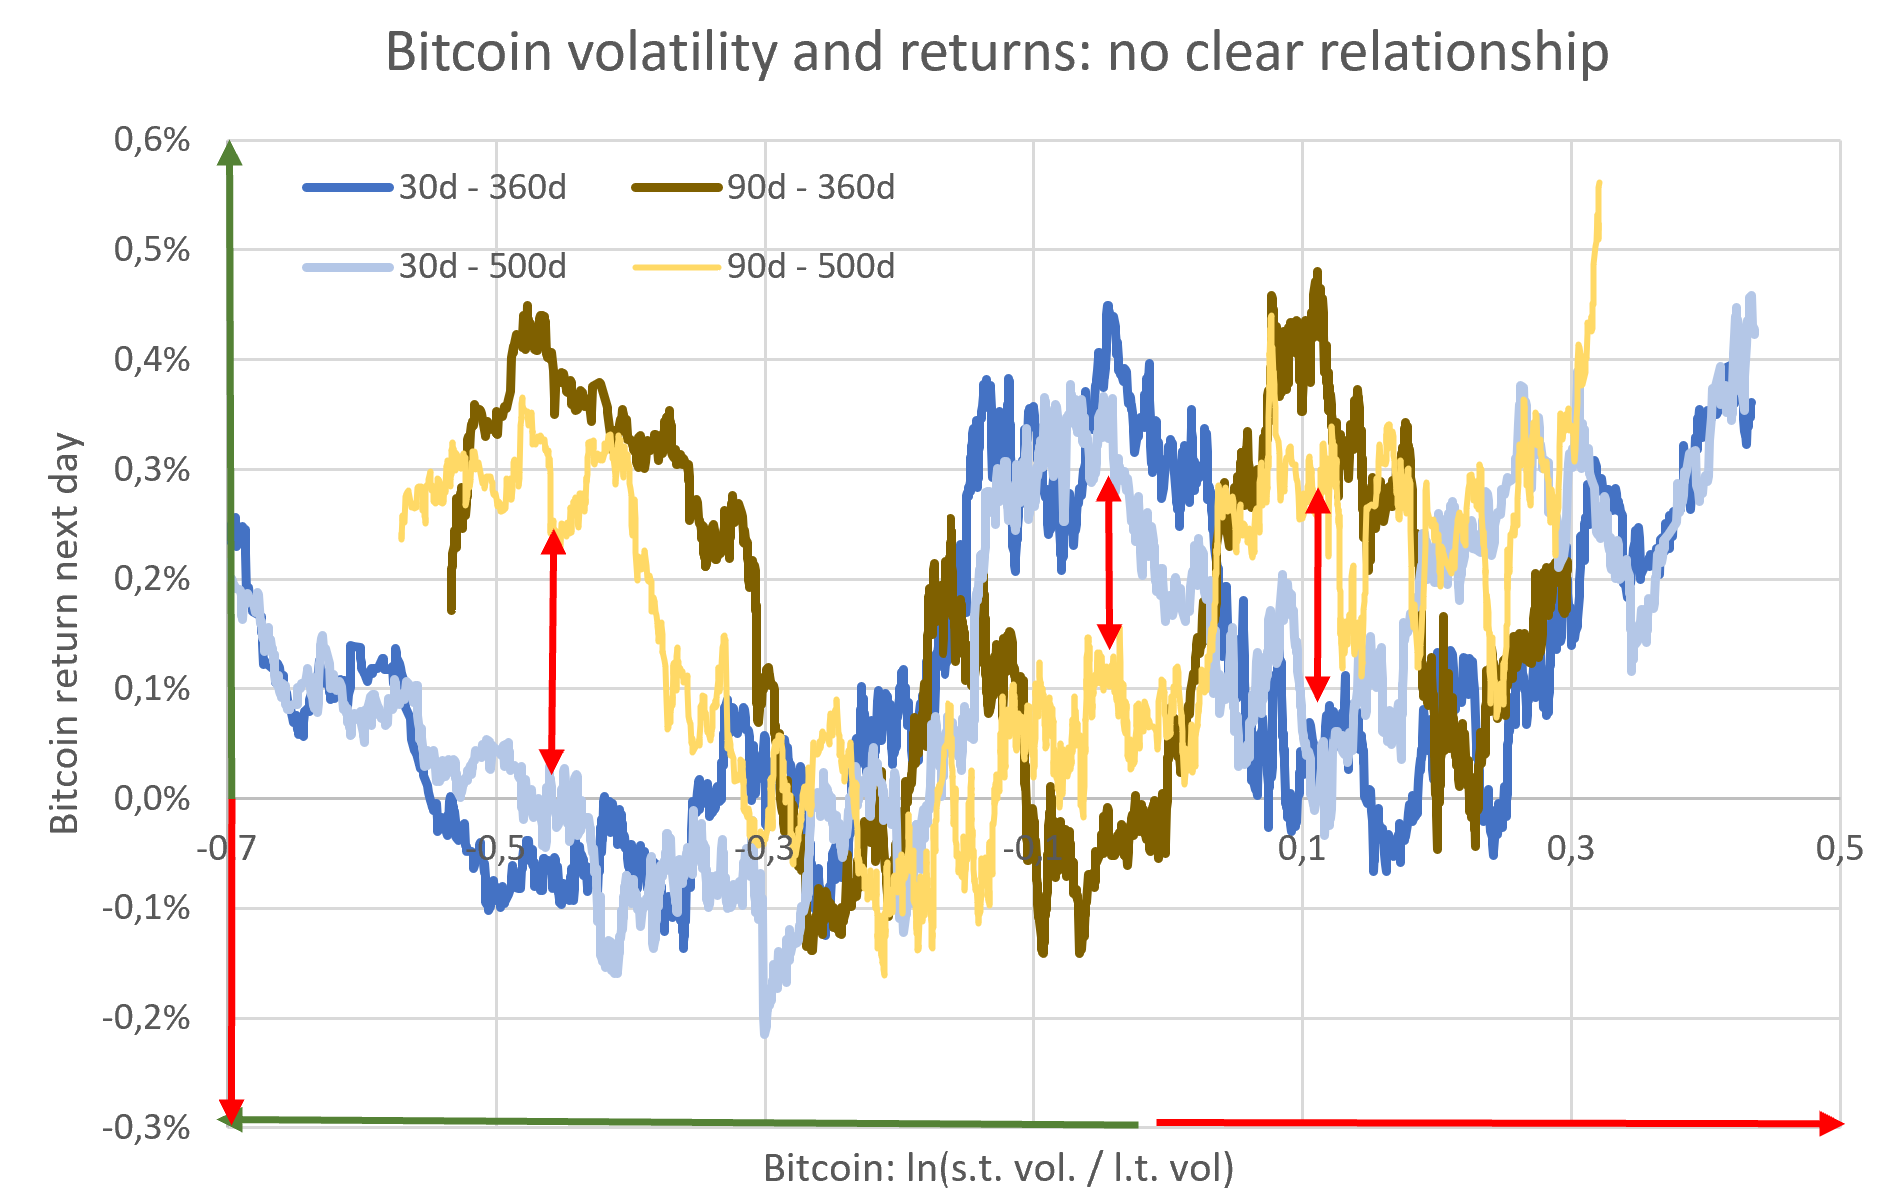 Chart description:
 Same like last chart, except the x-axis representing Bitcoin's own volatility instead of the S&P's volatility.
Interpretation: The 30-day results are the opposite of the 90-day results. We also cross the x-axis (which separates positive and negative returns) several times. Both show us low stability when estimating bitcoin retrurns from bitcoin volatility. Estimating bitcoin returns from S&P volatility is much more fruitful than estimating bitcoin returns from bitcoin volatility.
Choosing the volatility measure an the cut-off: We have seen that there is little difference in the choice (30 days or 90 days and 360 days and 500 days) to measure our relative S&P volatility. I don't like to trade, so for similar out-performance I prefer the model with the least number of trading signals, which would be 90 days volatility versus 500 days volatility. Because of evidence #2, I use a cut-off point of -0.1. This means that our signal becomes bullish when the S&P 90-day volatility is slightly below the 500-day volatility:
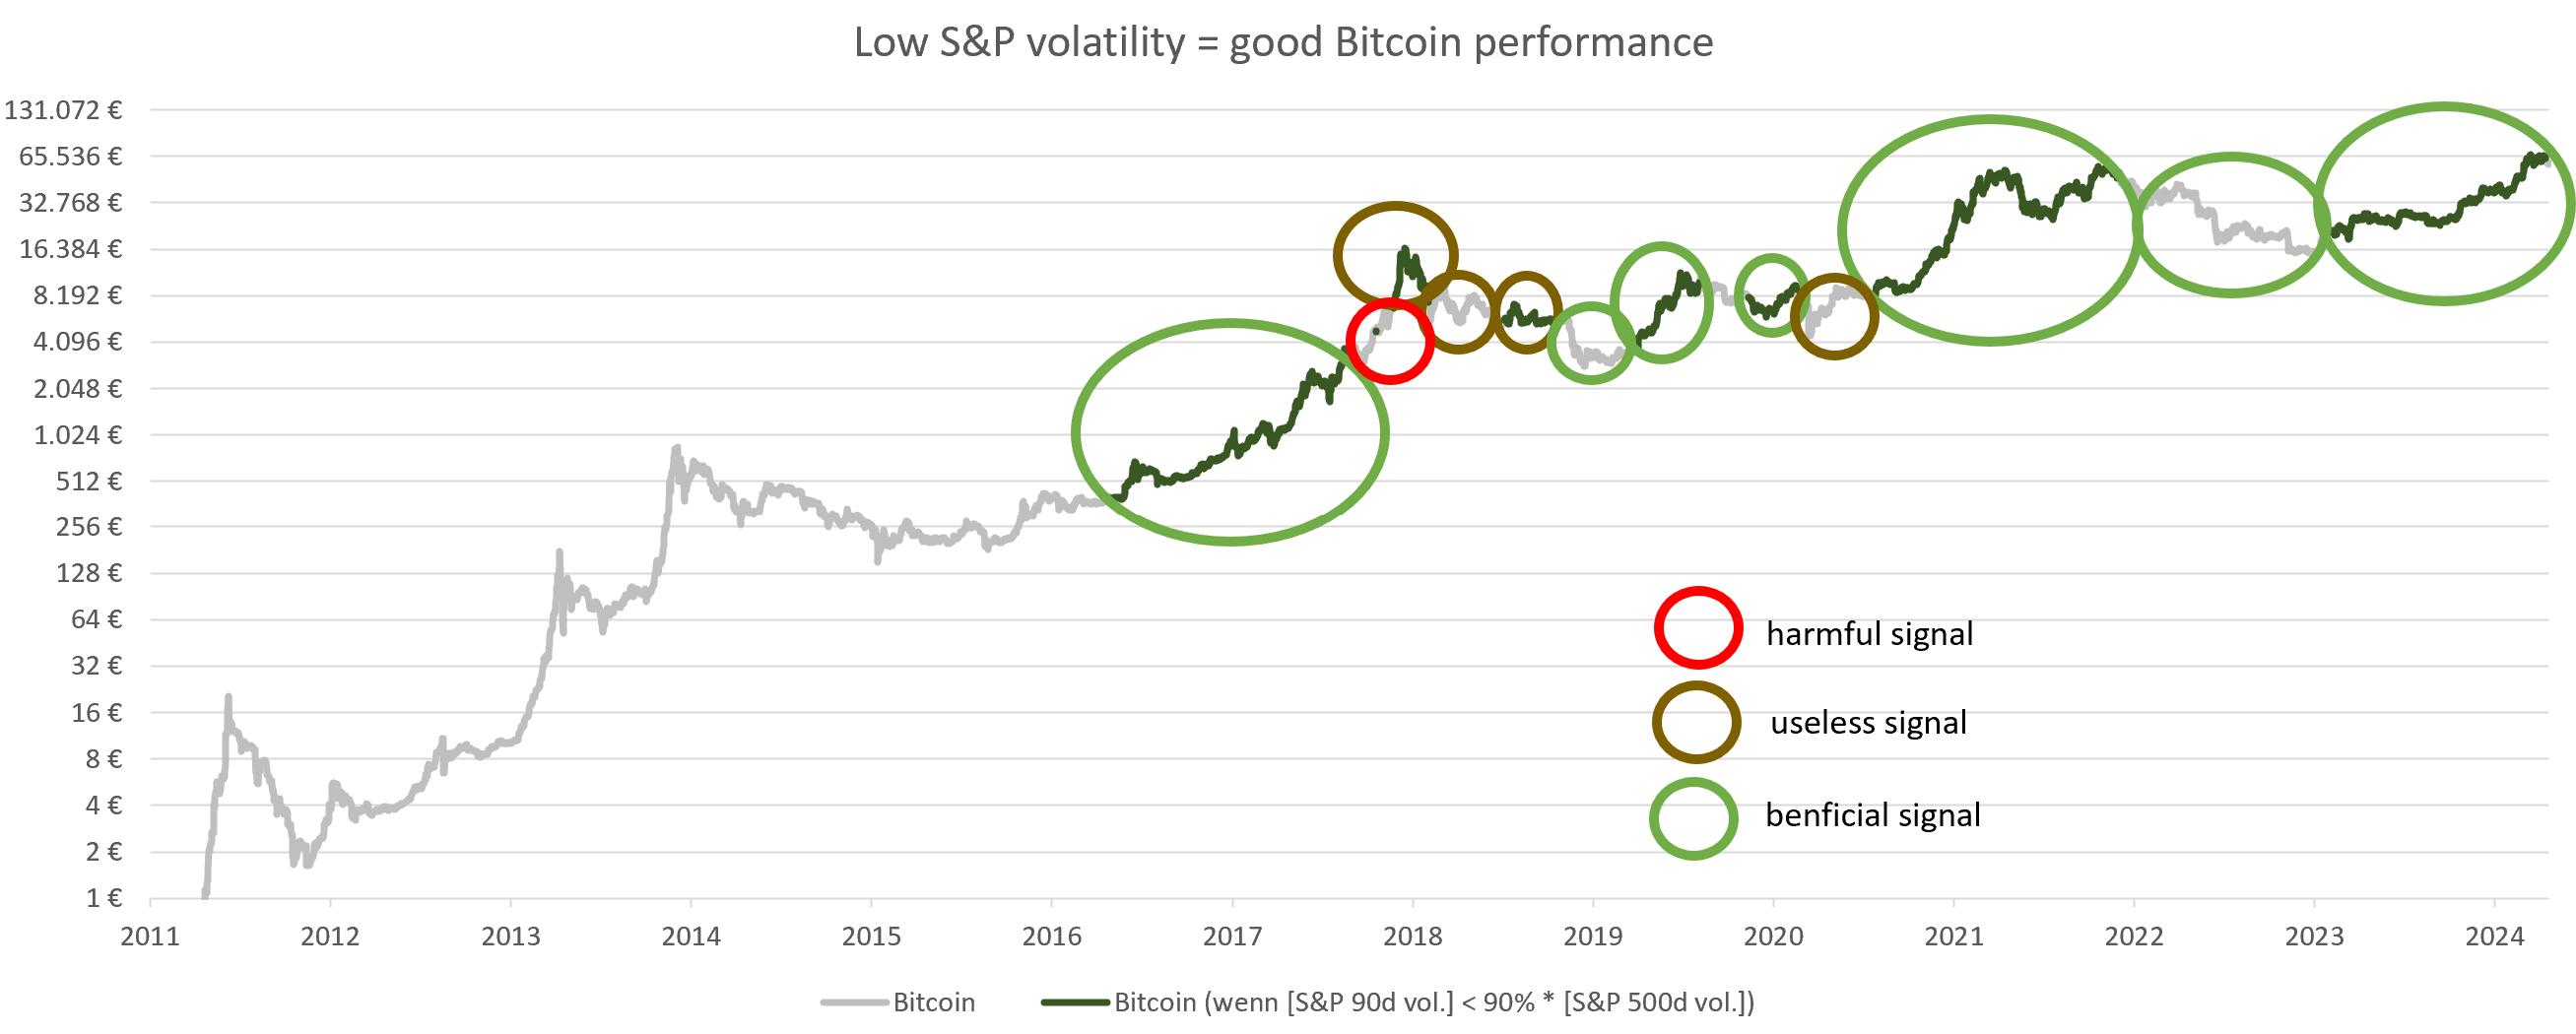 Chart description:
 see evidence #1
Interpretation: We can see that most signals look decent, but we have one very harmful signal (red cycle) in recent years. At the end of 2018, we had a period of very positive bitcoin performance despite high S&P volatility.
evidence #3How good is our volatility signal?
 Chart description:
 I draw a line starting on the first day after the low volatility period begins. Each line is described with its first day. The line stops at the end of the low volatility period. The x-axis represents the number of days in low volatility market conditions. The y-axis show how much Bitcoin price increased sind day 0. Green lines represent very good Bitcoin performances. Yellow lines represent ok performances. The black line represents the average of all other lines.
Interpretation: For most of the low volatility periods we can see very decent returns for the bitcoin price. The worst period gives us a return of around 0, while the best period gives us a return of around 2 (=638%). Periods of high volatility generally show poor returns, with some exceptions showing positive returns. I can conclude that trading bitcoin according to the S&P volatility looks very promising. However, some risk remains. We are quite safe buying bitcoin when stocks enter a period of low volatility.
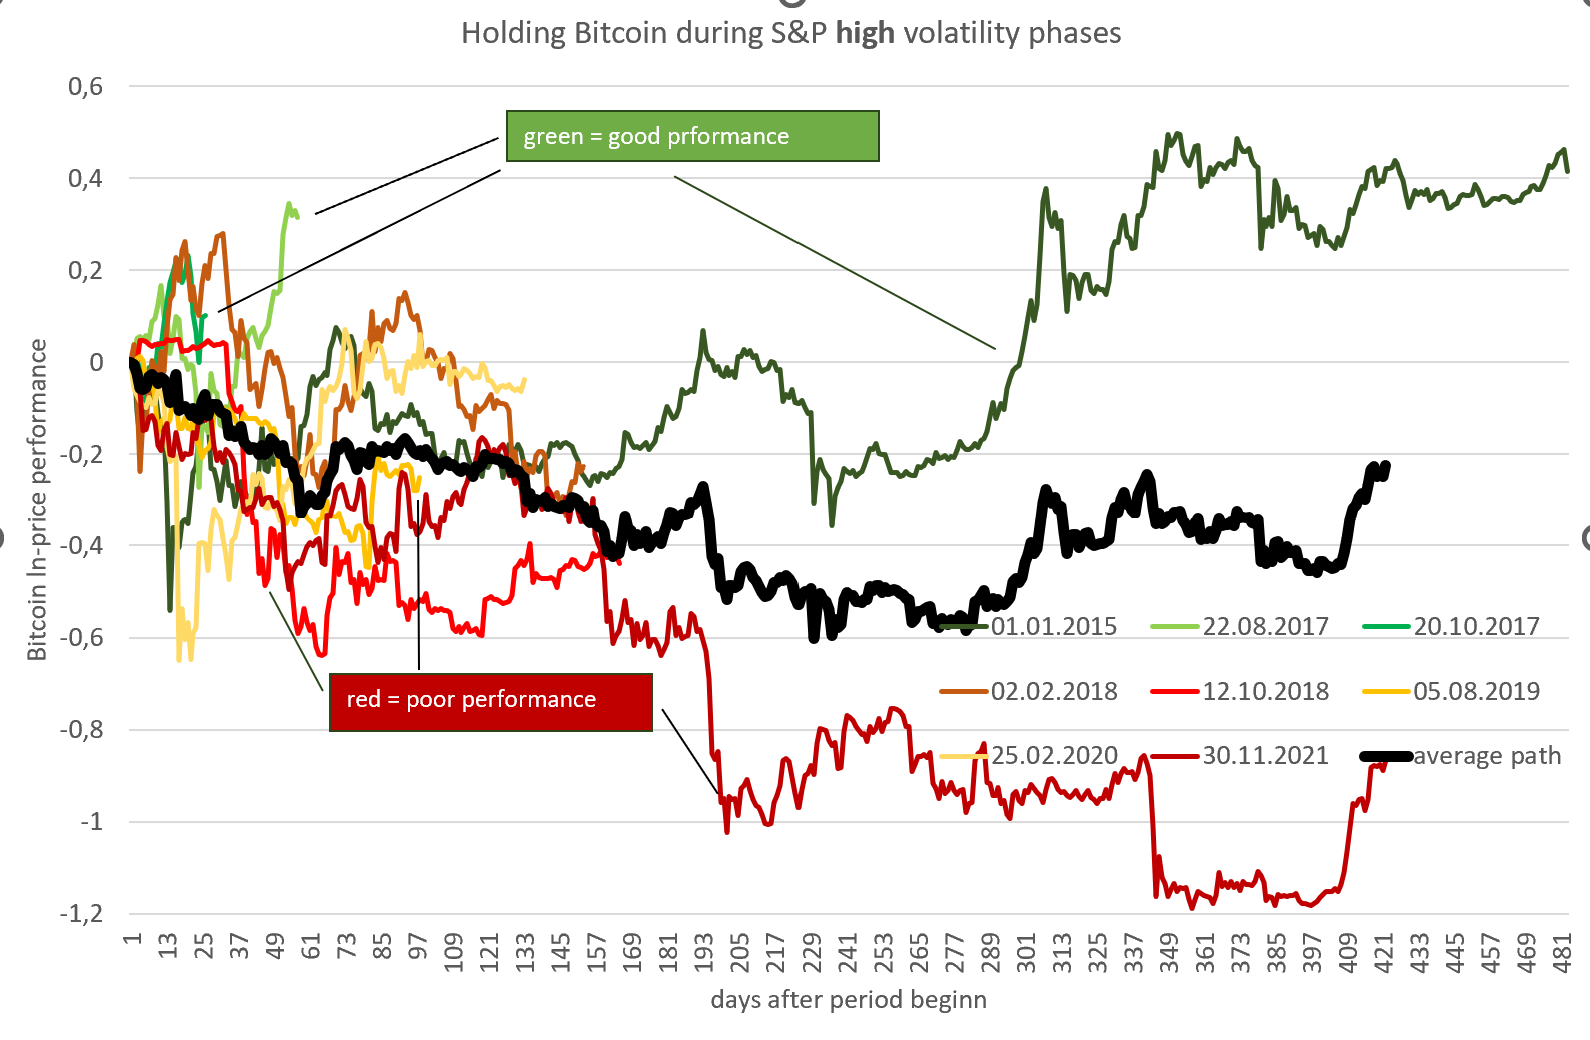 Chart description:
 Same like above, but we are looking at the performance for the high volatility periods.
Interpretation: Selling bitcoin when we enter a high volatility period for stocks is a bit riskier than buying at the beginning of low volatility periods. Sometimes the price of bitcoin still performs well and we have to buy back more expensive.
Now we have established 3 pieces of evidence to show that
Bitcoin performs much better during periods of low S&P volatility than during periods of high S&P volatility. However our volatility signal is not perfect.
How damaging are our few bad signals? Let's do a backtest.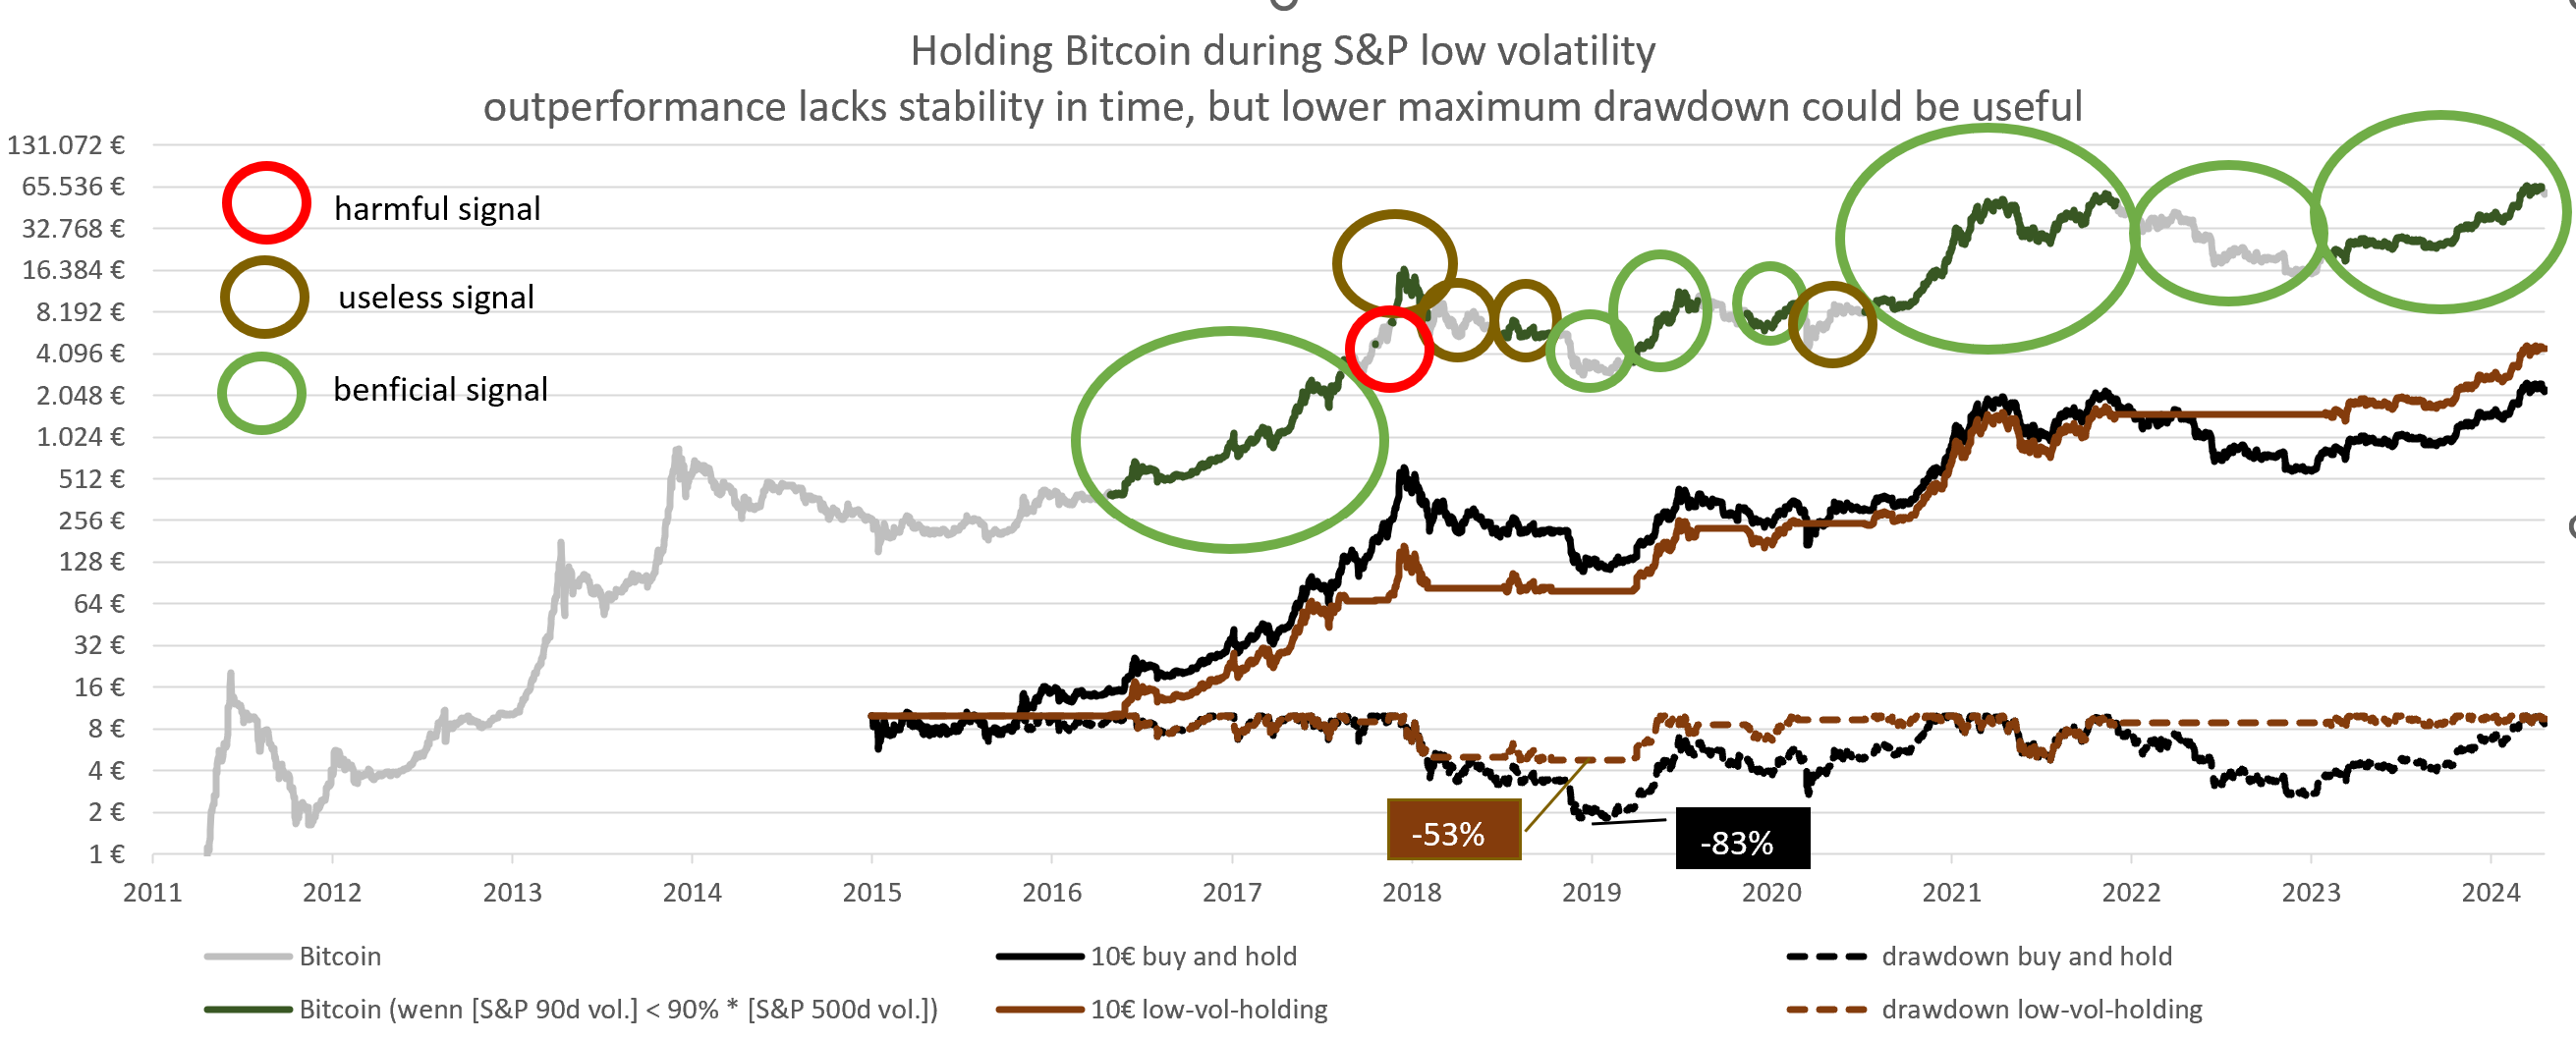 Chart description:
 We compare two strategies:
1. (black line): We buy 10 of Bitcoin on 01/01/2005 and hold it until today.
2. (brown line): We start with 10. We hold bitcoin during periods of low volatility and cash during periods of high volatility.
Interpretation: We can see that we start with some underperformance (brown line is blowing black line) which turns into outperformance later on. Perhaps Bitcoin is now trading with a higher correlation to traditional financial markets than in the past.
I would say that the observed outperformance of our strategy alone is a bit weak, as we can also observe historical periods of underperformance. Together with the significantly lower drawdown of our strategy (-53% vs. -83% for buy and hold), the strategy is still okay. If you dislike drawdowns, the significant reduction in maximum drawdown could make this strategy still interesting despite the mixed outperformance track record.
Comparison with cycle timing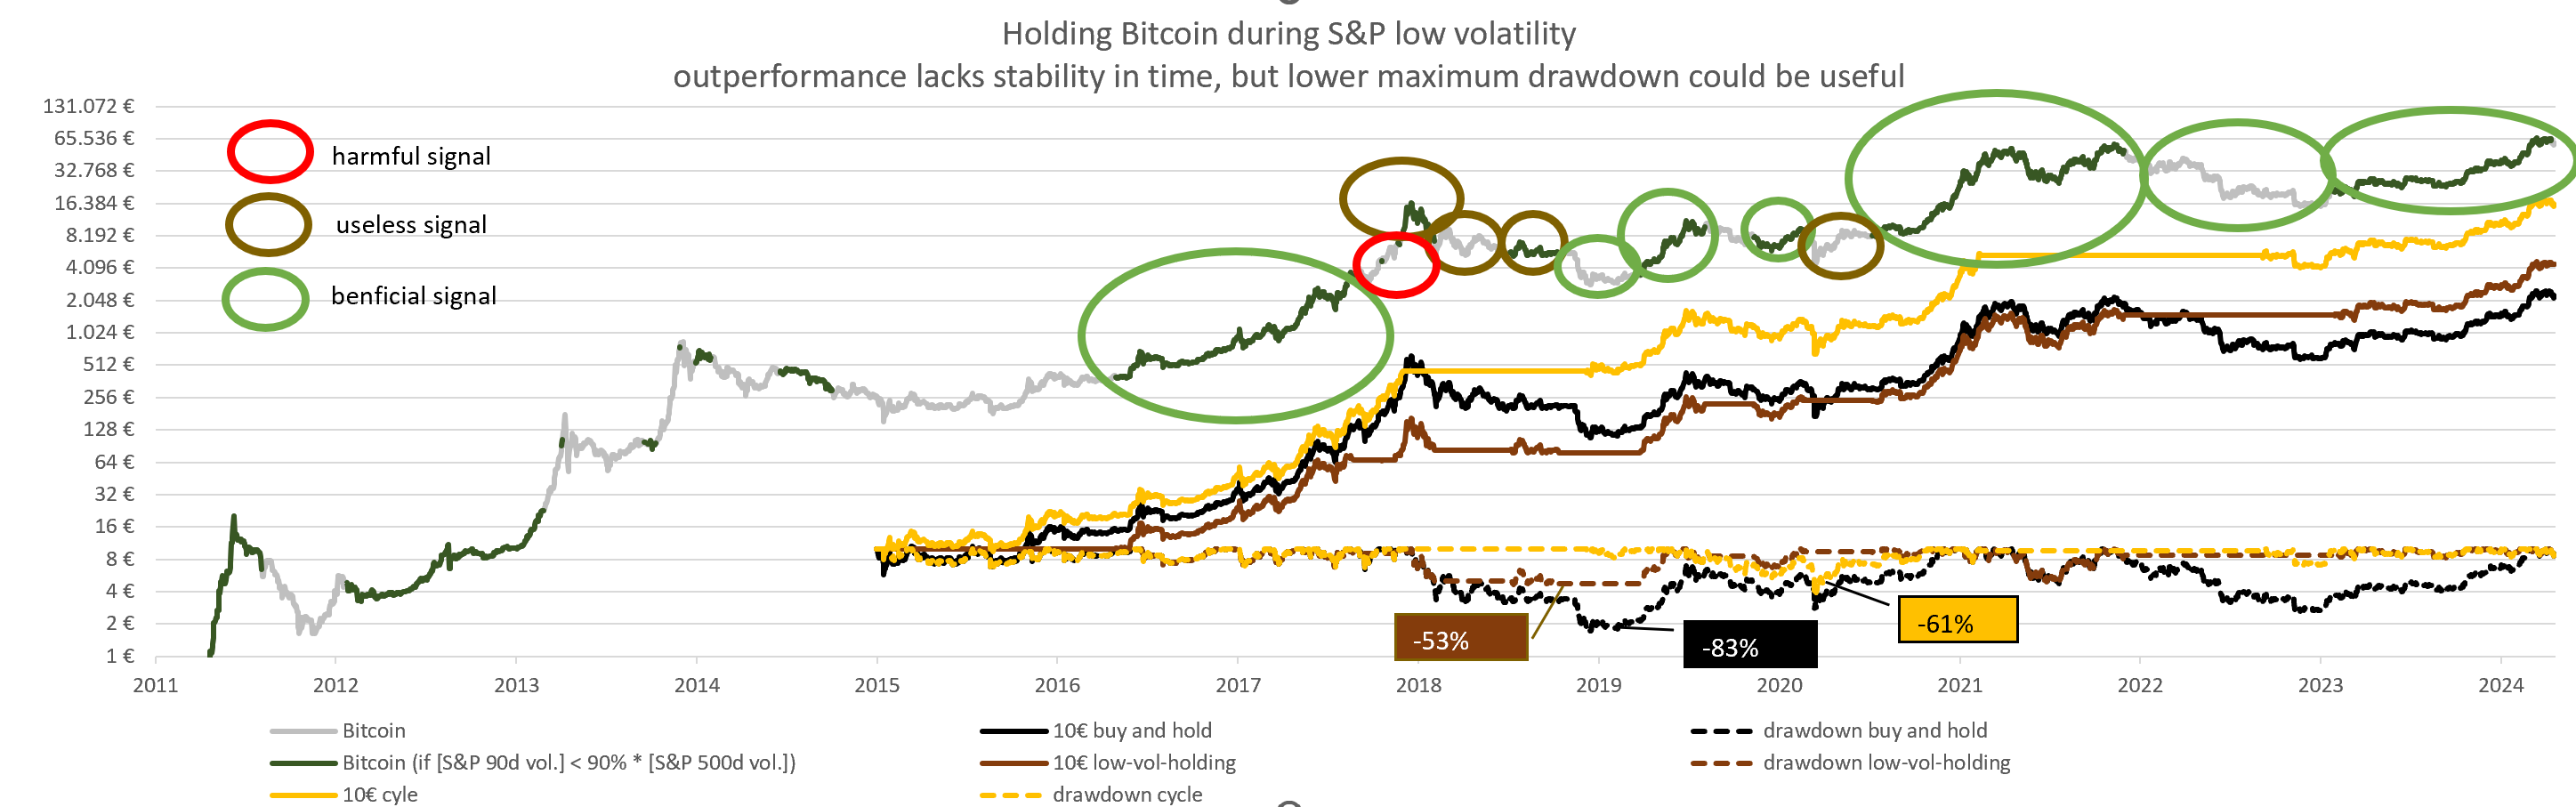 Chart description:
 We add one more strategy (yellow line): Buy Bitcoin at trend*e⁻0.5 and sell Bitcoin at trend+750 days.
Interpretation: When we back-test our valuation trigger for trading Bitcoin in the OP, we get even better results (yellow line). We can see significant outperformance, hardly any underperformance and only a slightly worse drawdown.
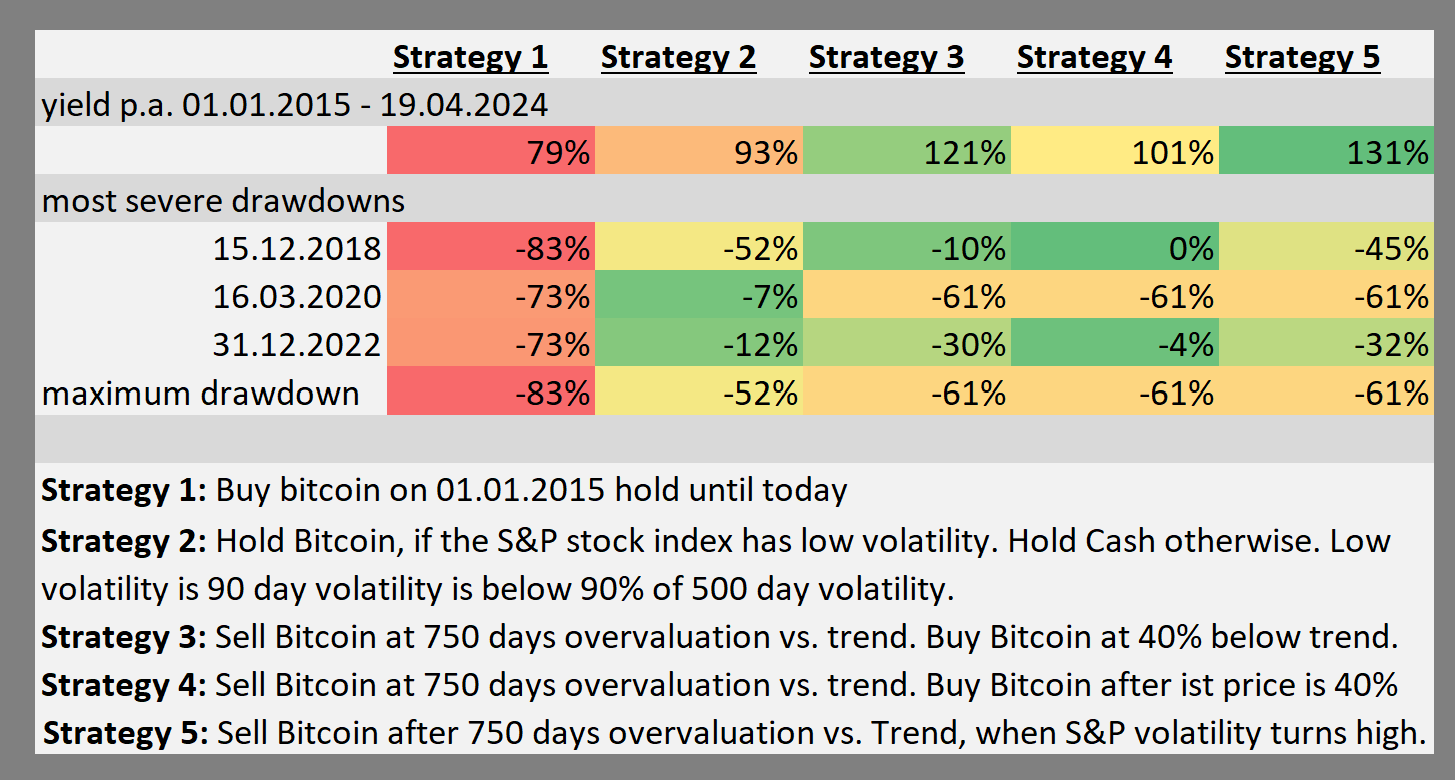 Results:
 Both strategies, trading by volatility (strategy 2) and trading by valuation (strategy 3), outperform buy and hold (strategy 1) before tax with higher average returns and lower drawdowns. However, strategy 3, as explained in the OP, performs much better.
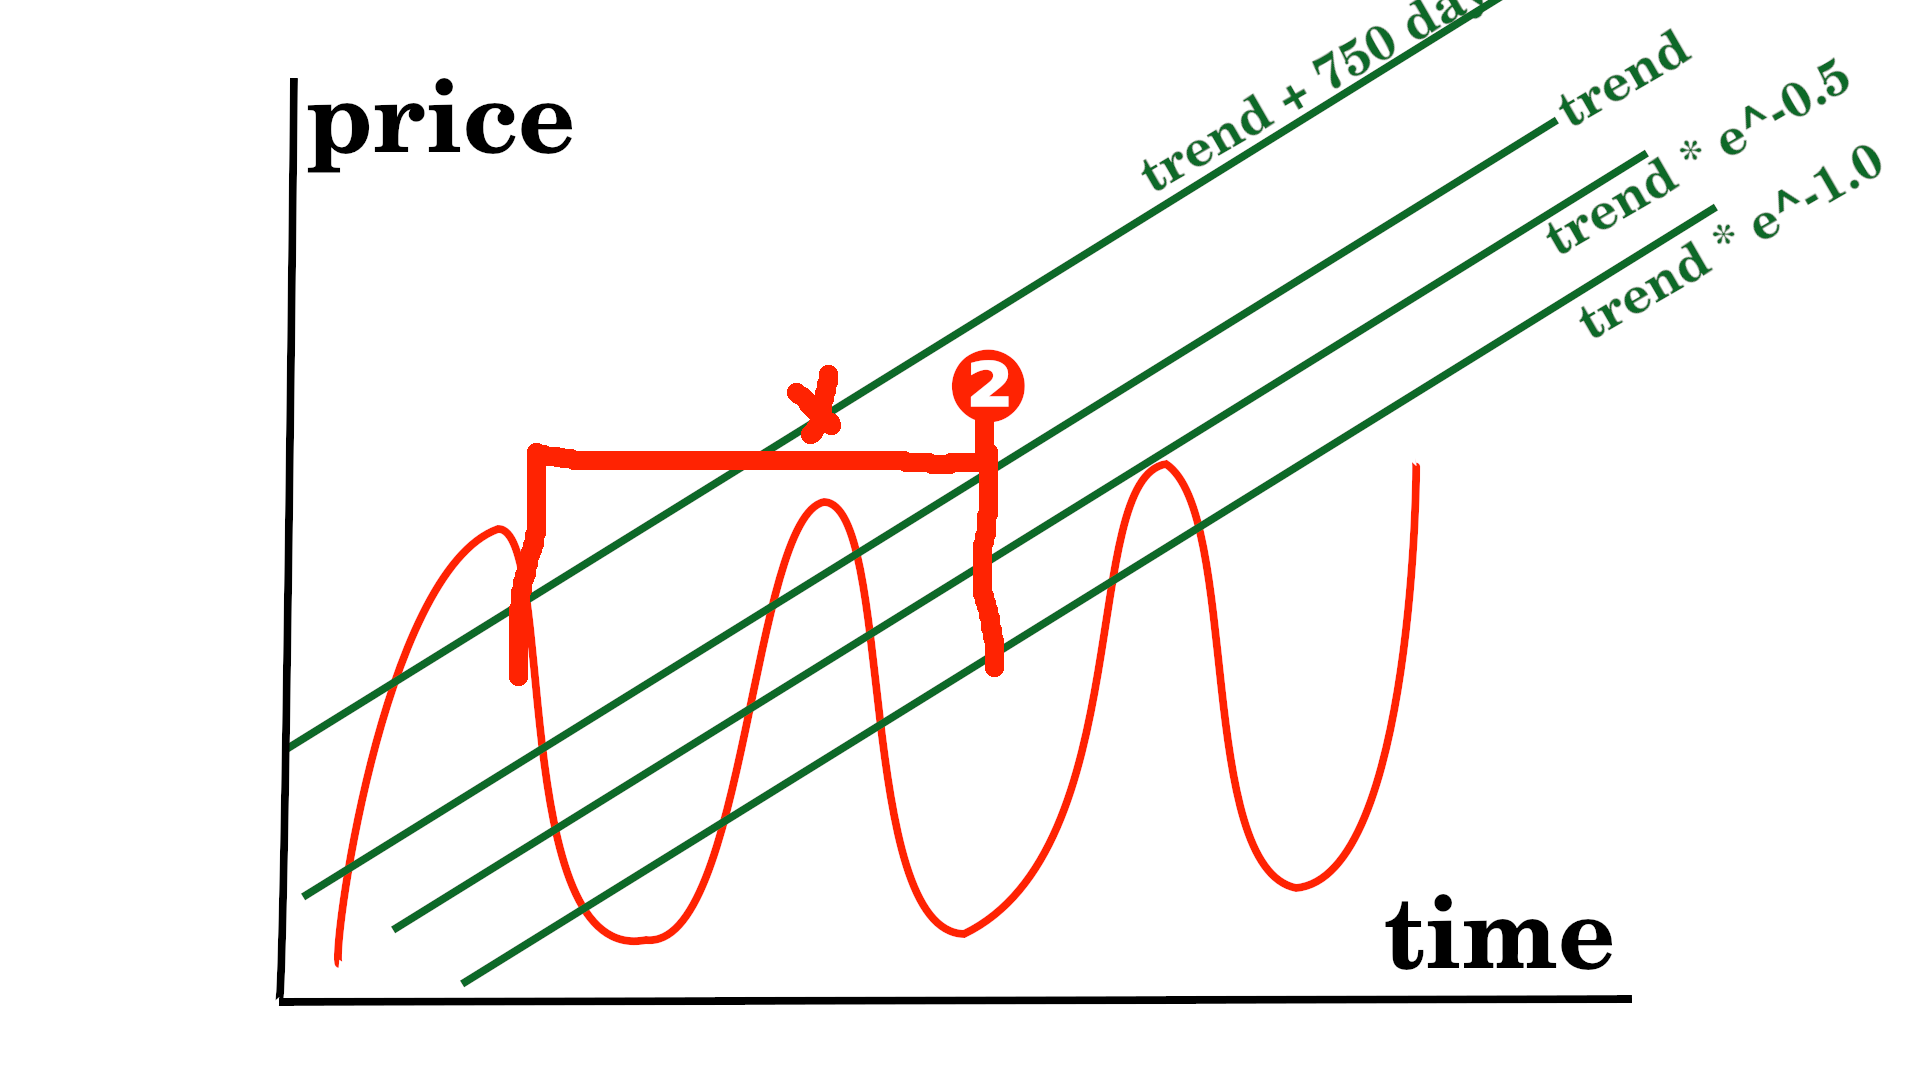
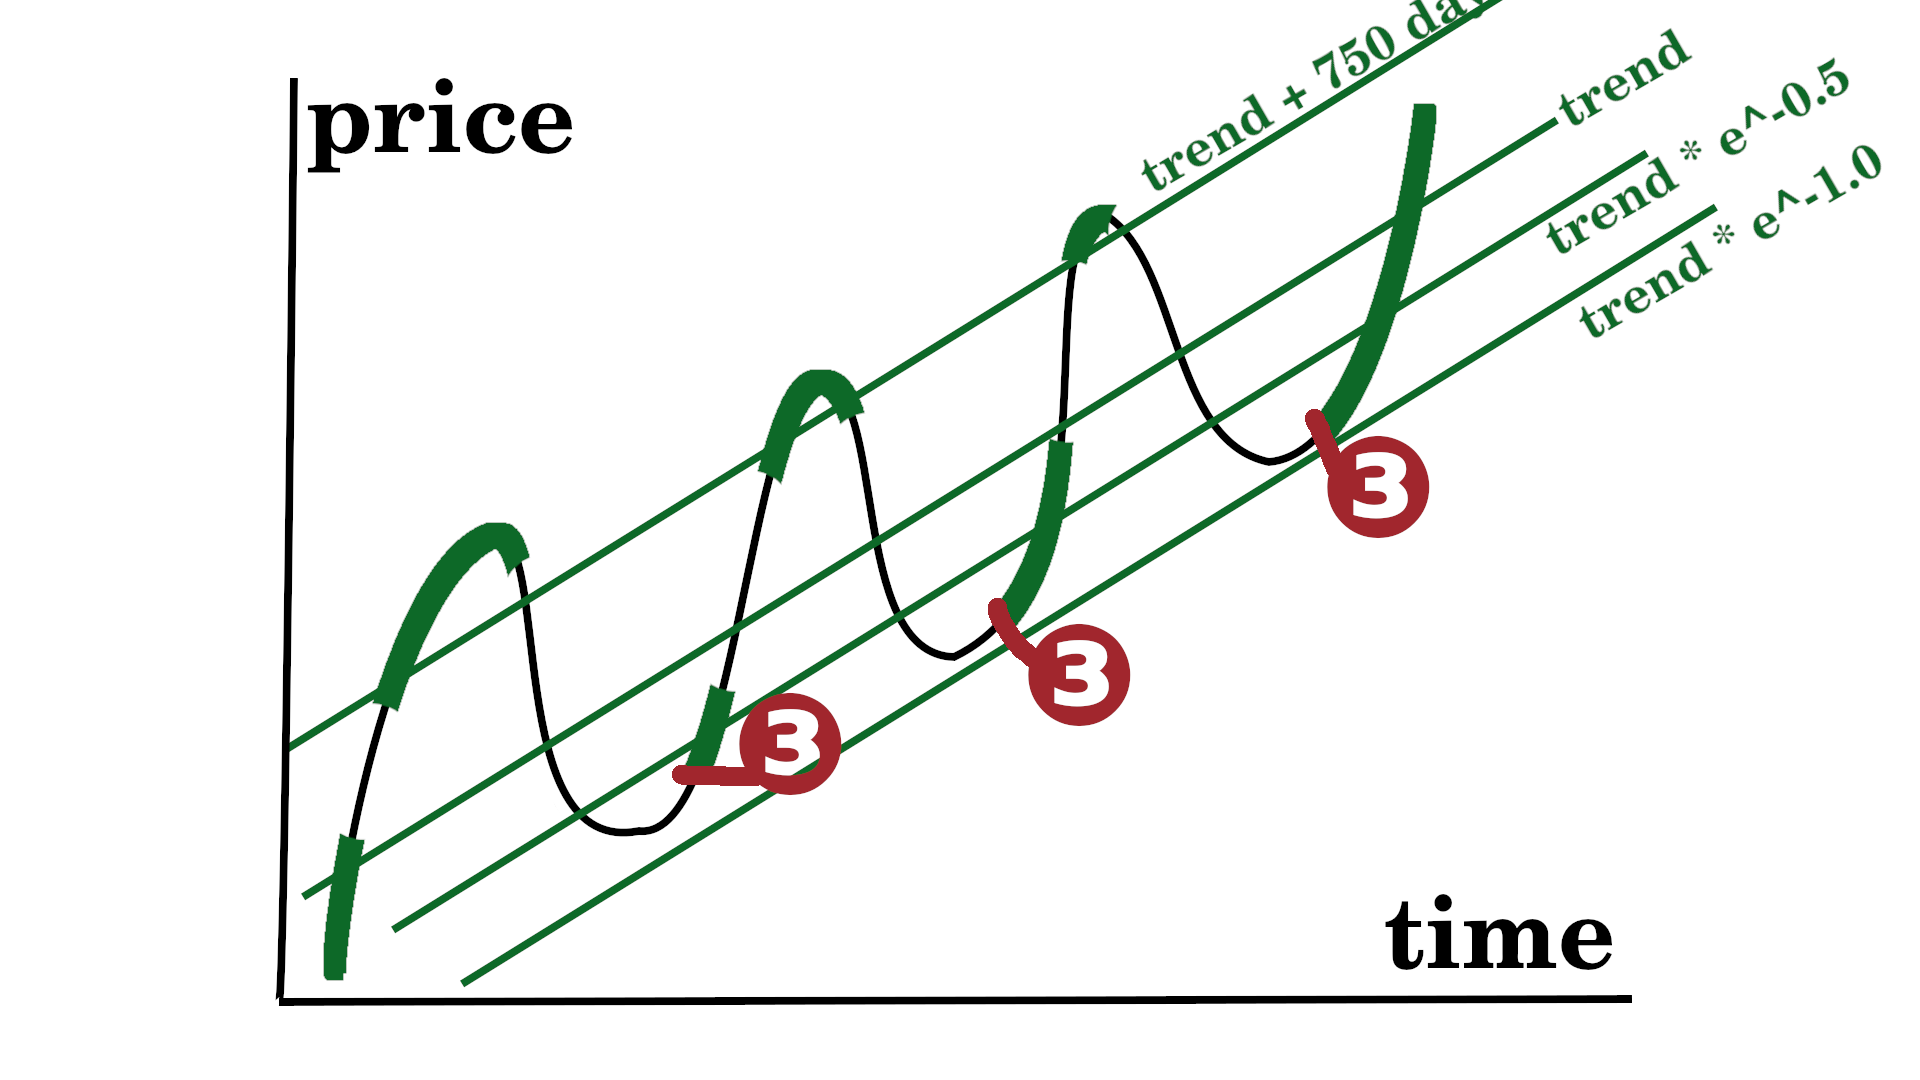
Can combine two good strategies (2 and 3) to get an even better trading strategy?We know that buying Bitcoin cheap gives us outperformance (strategy 3). We also know that Buying bitcoin during a period of low volatility gives us outperformance (strategy 2).
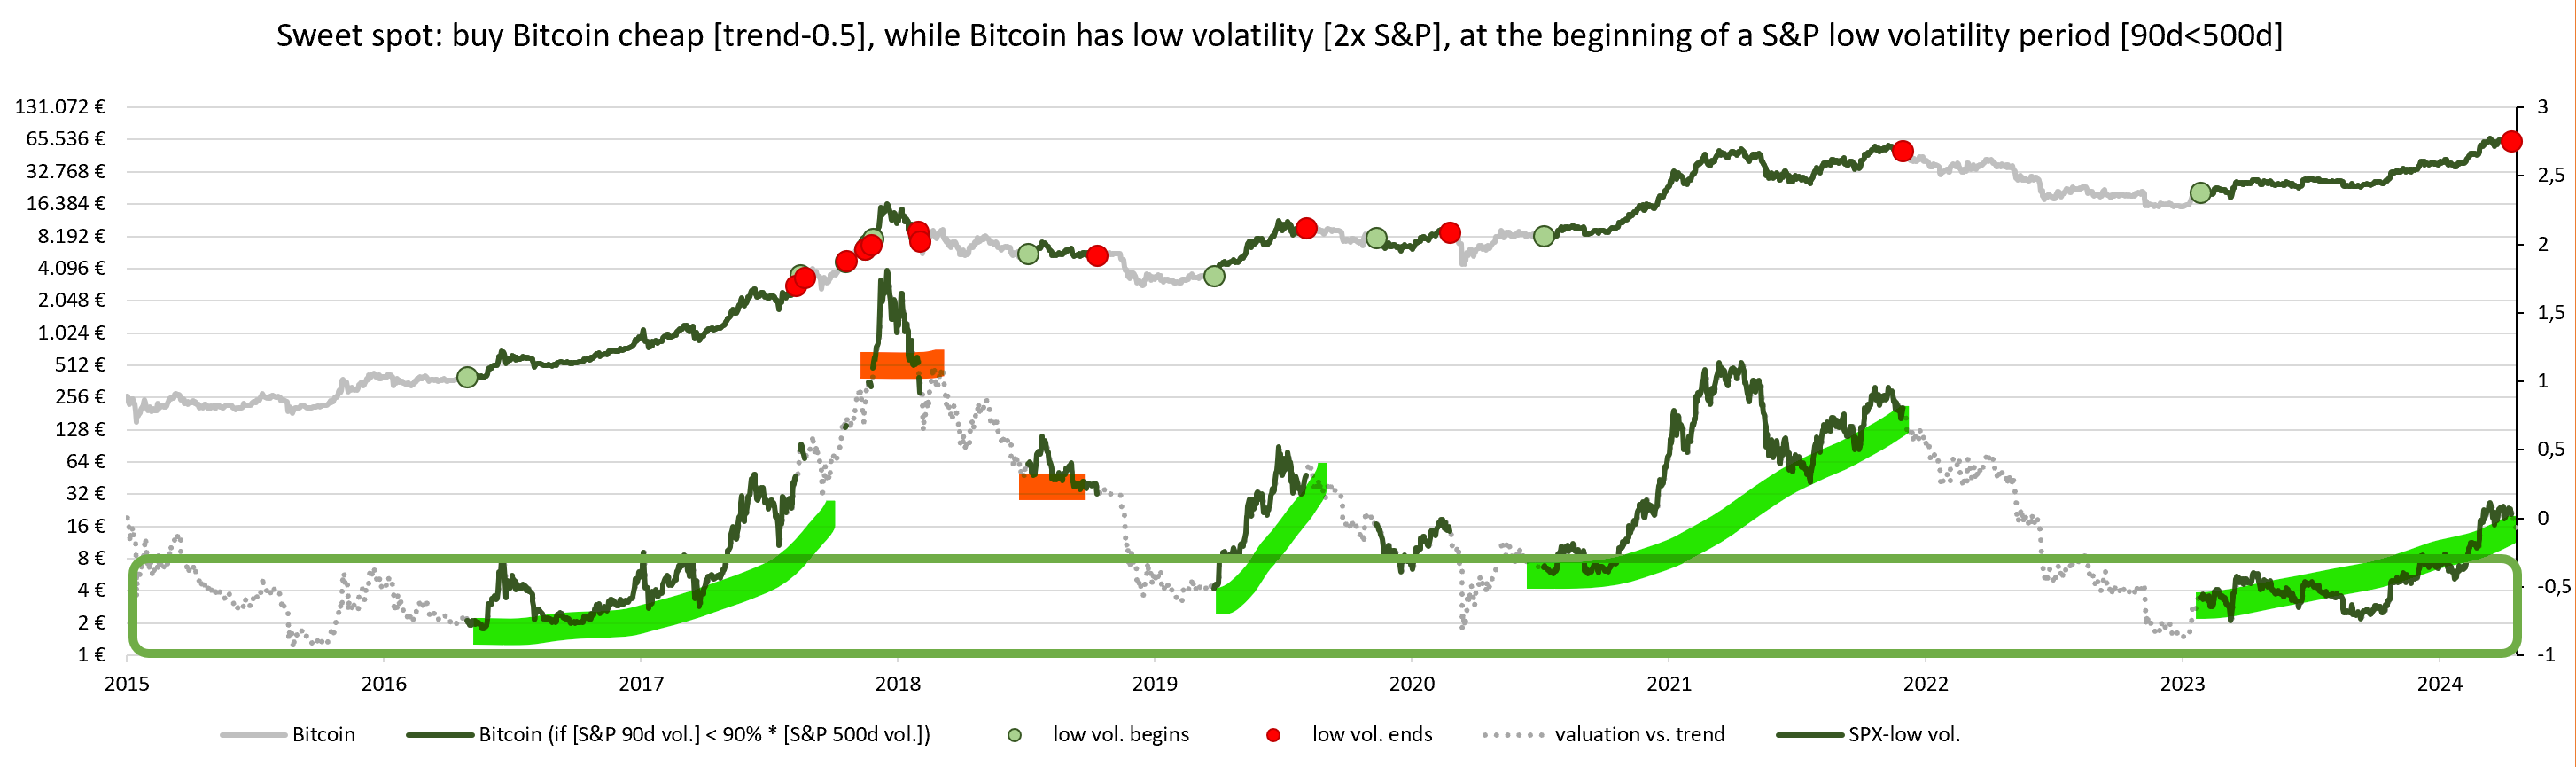
Buying bitcoin cheap (green box) and entering a period of low volatility (green line) could be an excellent investment, as all green lines end up much higher than they started (marked in green), while the less useful green lines (marked in red) are not included.
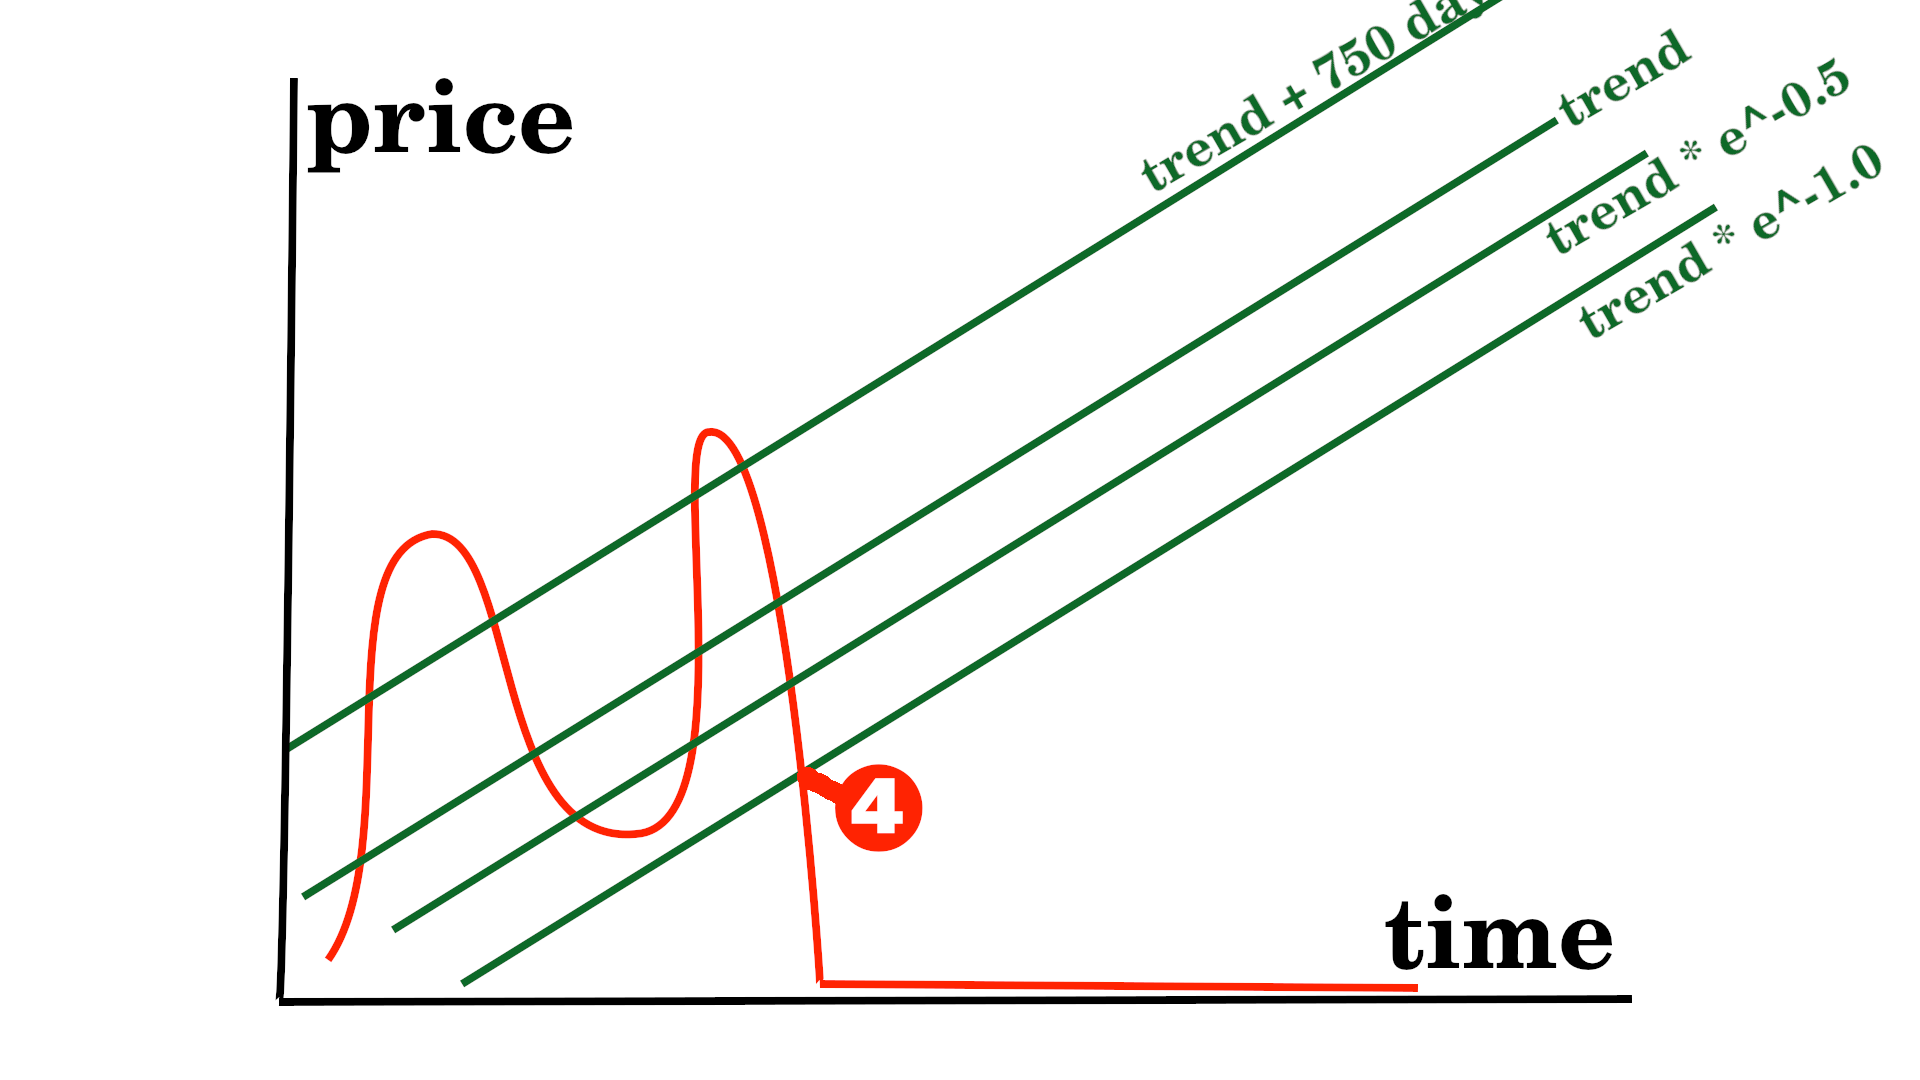
This idea sounds good, but waiting for (a) valuation and (b) volatility to turn favorable (strategy 4) gives us a lower return (101% p.a.) than only waiting for (a) valuation to turn favorable (121%).
We are missing out on returns by sitting in cash while waiting for volatility to come down. While waiting for volatility to come down may not be a good quantitative strategy, it could still be useful from a psychological perspective. If you didn't buy enough Bitcoin during the bear market, because you were scared, but the volatility didn't turn favorable, it could give you the confirmation to buy. At this point, we are still very early in the bear market.
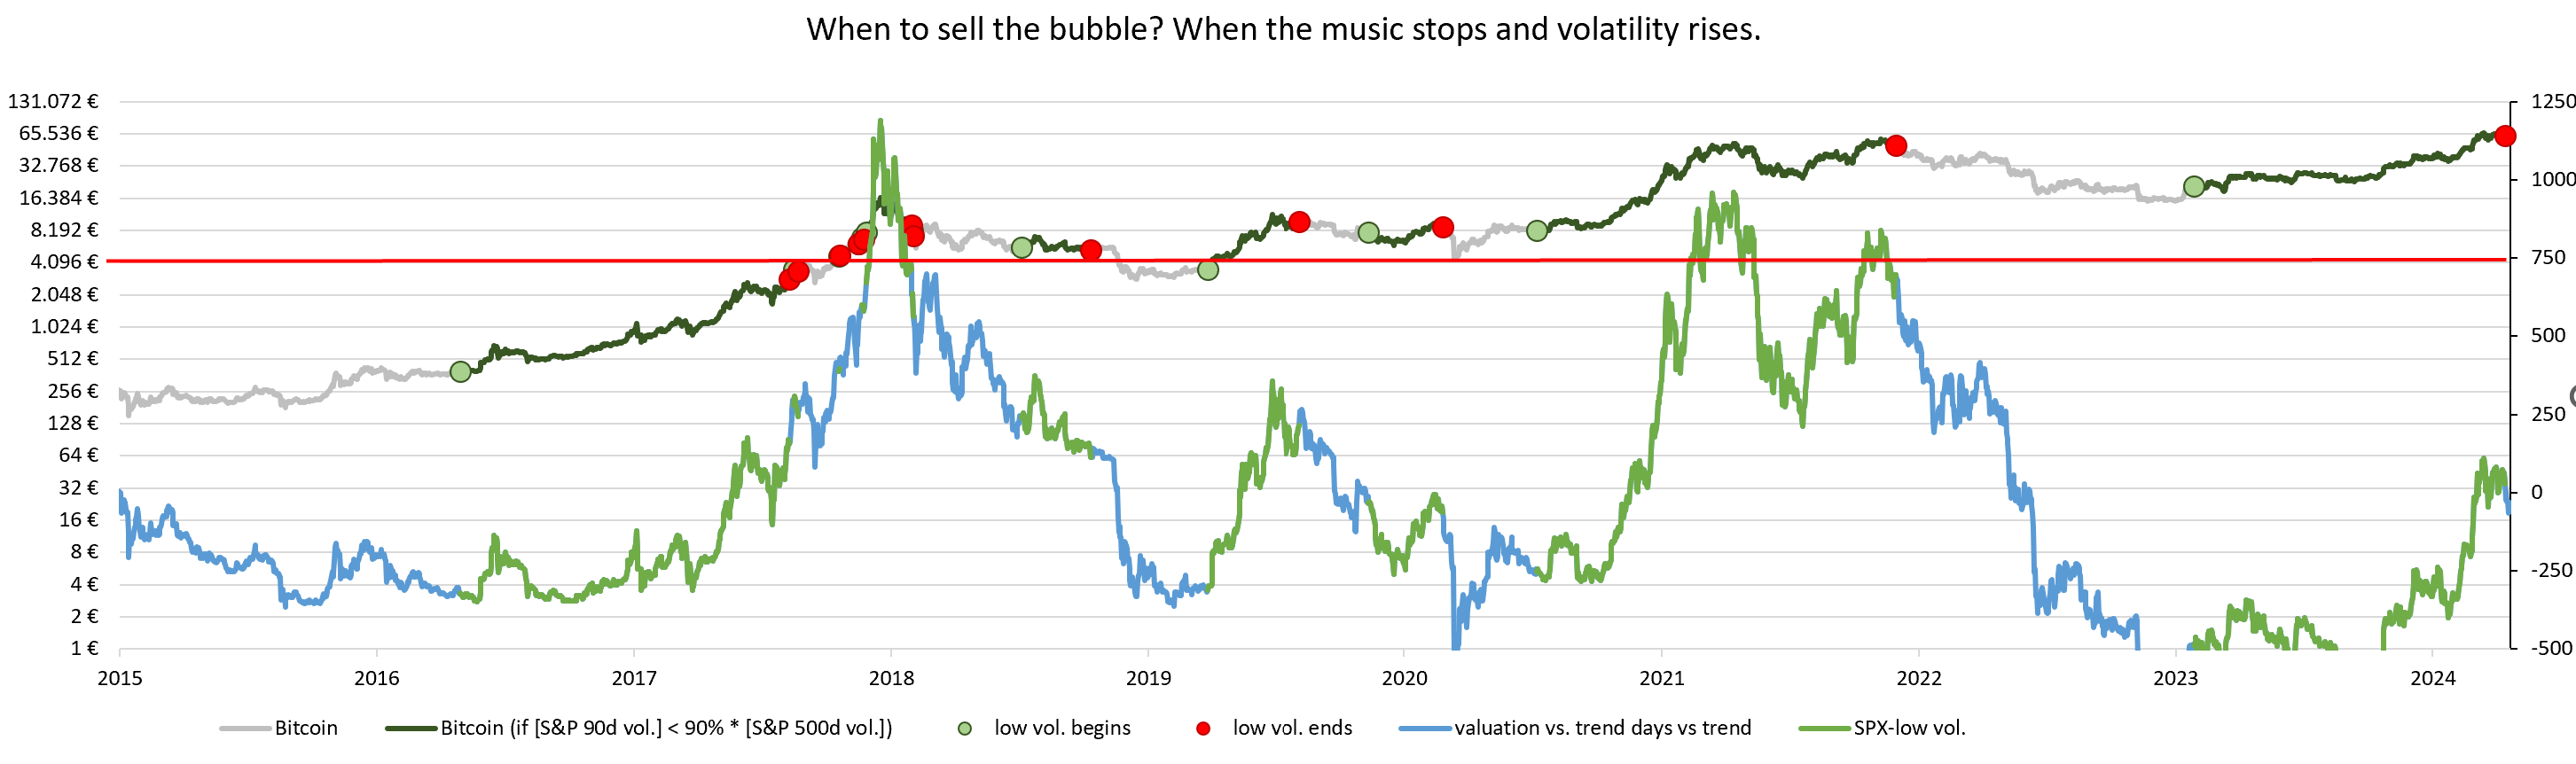
The second combination possibility would be strategy 5:
Strategy 3: We are selling at an overvaluation (Bitcoin price = Bitcoin price trend + 750 days). However, the historical top was around +1000 days or even +1250 days. I still use the 750 days cut-off point in my strategy 3 because we only know the exact top in hindsight. I want to allow for some margin of error to not miss the top in case the next top is lower.
Strategy 5 modifies strategy 3: We could wait for bitcoin to reach trend + 750 days overvaluation and only sell when the volatility trigger turns red (= entering a period of high volatility).
This strategy 5 gives us an even better return (131% p.a.) than pure cycle timing (121%) with similar drawdowns. However, despite the higher average return, I still prefer pure cycle timing (strategy 3) because we sell a bit before the peak rather than a bit after the peak. Since in real life we will need some time to sell, I would rather start too early than too late.
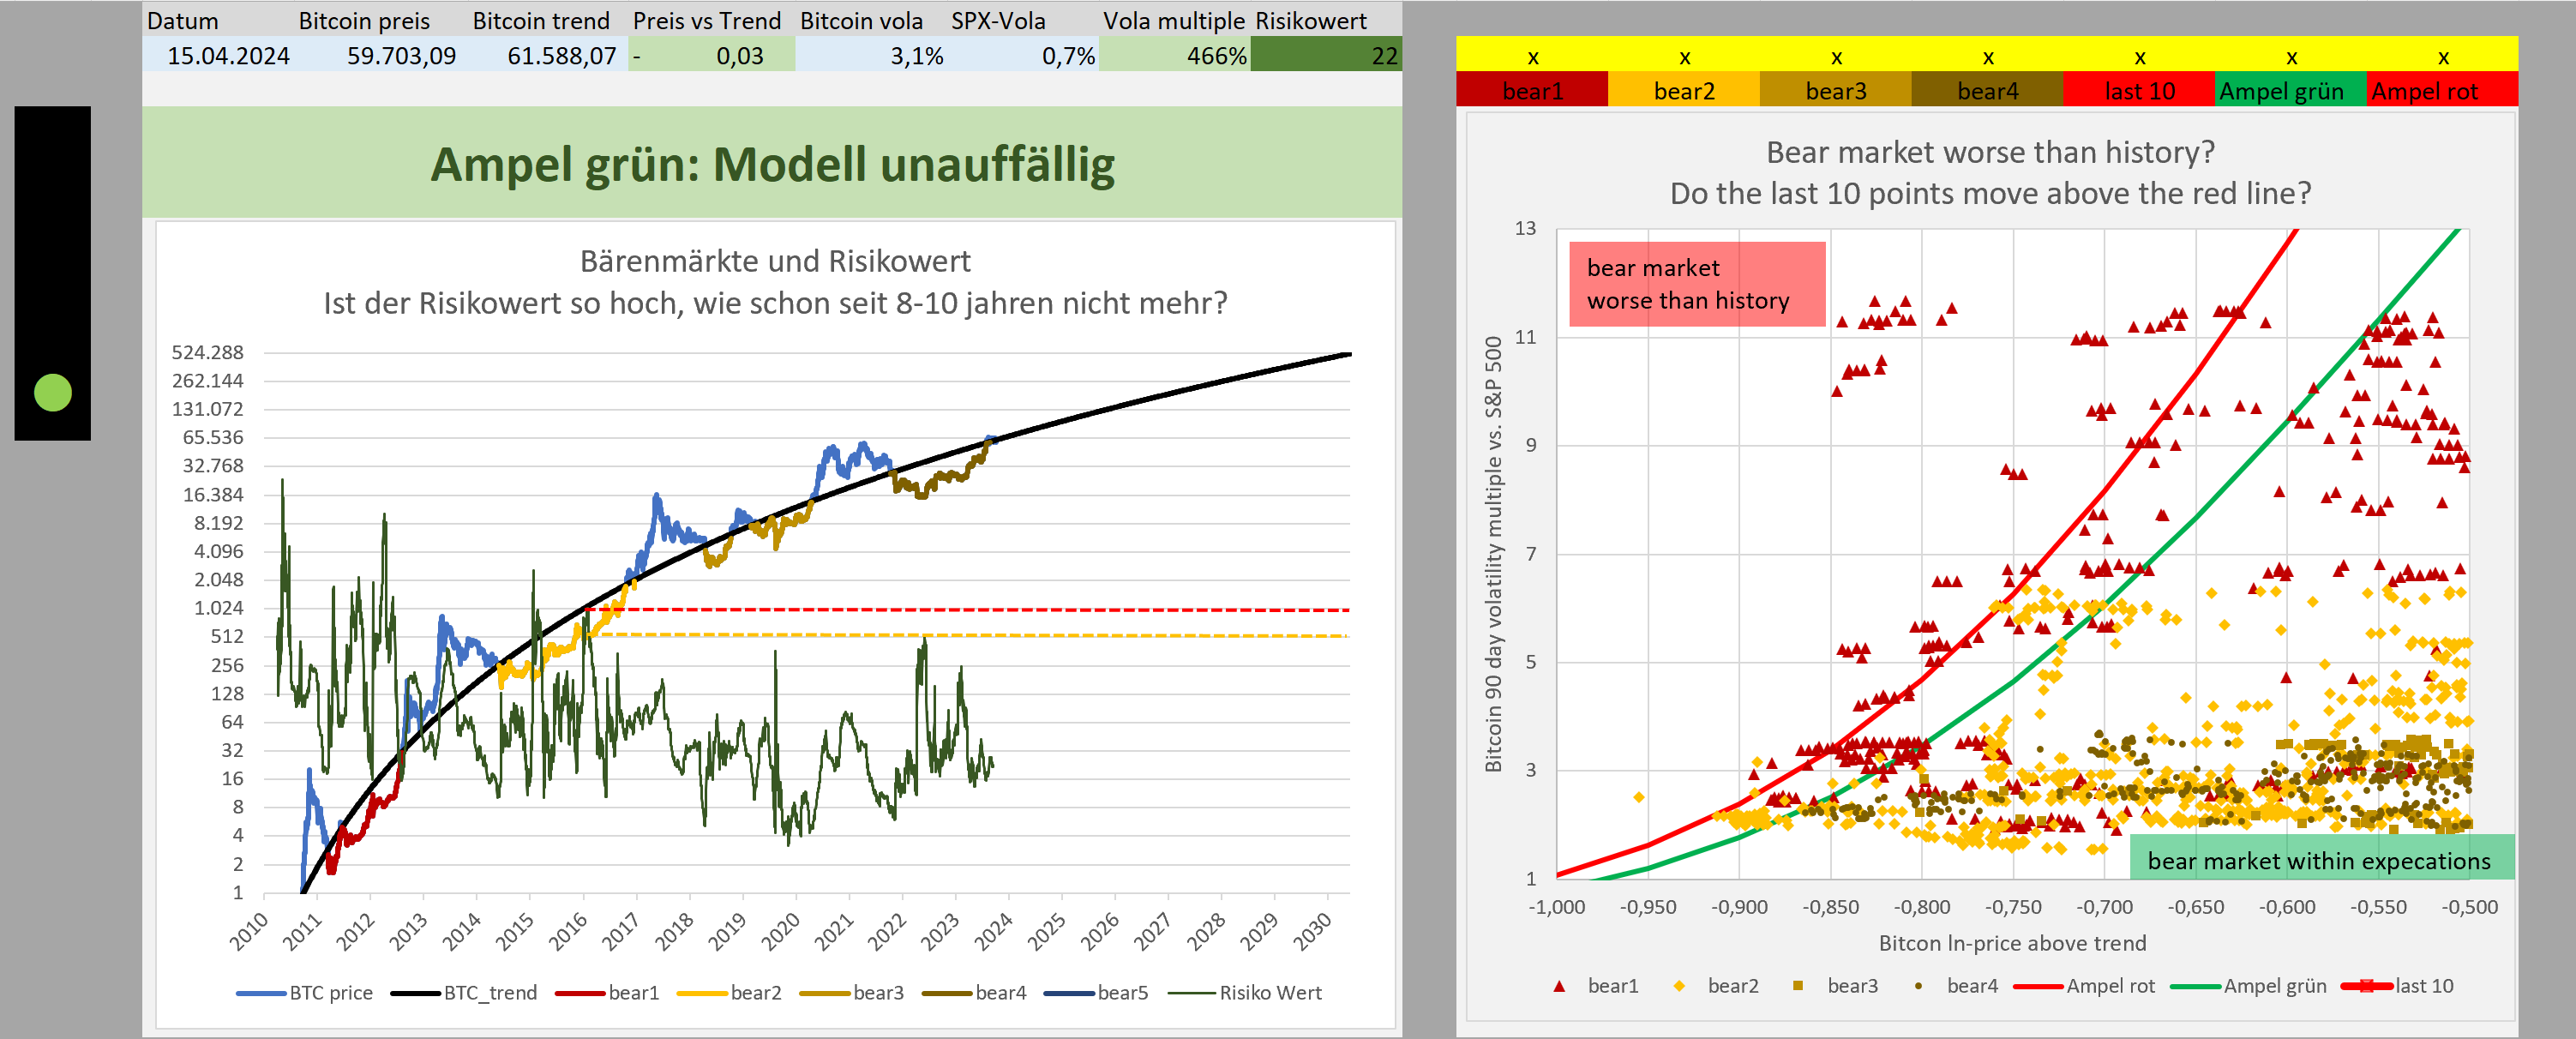
Valuation leads to action, volatility is confirmationWe buy when Bitcoin is 40% below trend. Entering the next period of low volatility in equities is likely to mark the end of the bottom. We sell when Bitcoin price is 750 days ahead of trend. The subsequent entry of a period of high volatility marks the end of the top.
Let me give you an idea for such a DCA savings plan for accumulation between trend line (0.0) and bottom line (-1.0) with a stack of 5 limit orders (simplified regarding of the previous bear market):
I also thought about how to use our position in the cycle to modify my DCA strategy.
Background: I changed my model for calculation the optimal allocation into Bitcoin from adjusted risk parity (=old model) to maximum allocation after taking into account liquidity constraints (= new model). As a result I have to sell a lot of stocks (e.g. 15.000 ) to buy more Bitcoin. However I'm already exposed to Bitcoin since end of 2021. I create 3 baskets:- very cheap basket (trend * e^-0.5): 5.000
- cheap basket (below trend): 5.000
- ok basket (trend to trend + 150 days): 5.000
Investment decision triggers:❶ If Bitcoin price is below trend*e^-0.5, I will invest all my remaining funds into Bitcoin. This would be 15.000 as of today.
❷ If Bitcoin price is above trend*e^-0.5, but below trend, I will invest 1000 from cheap basket and 1000 from ok basket every month.
❸ If Bitcoin price is above trend, but below trend +150 days, I will invest 1000 from ok basket every month.
❹ If Bitcoin price is above trend + 150 days, but below trend + 750 days, I will DCA surplusses into Bitcoin, but not sell any extra shares.
❺ If Bitcoin price reaches trend +750 days, I will sell Bitcoin. I will sell 3x my monthly net salary each month until we fall below trend + 750 days. All the selling will go 50% to the very cheap basket and 50% to the cheap basket.
❻ On the way down from trend + 750 days to trend I will put my DCA into my 3 baskets and only buy Bitcoin, when Basket rules allow for it.
Model maintenance triggers:My DCA management can be easily implemented in excel and does not cause much of a headache or costs a lot of time. However I'm very dependent on my model to continue to describe the Bitcoin price behavior. Therefore I have to check, if my model is still correct.
We assume Bitcoin price is moving around a upwards trend.
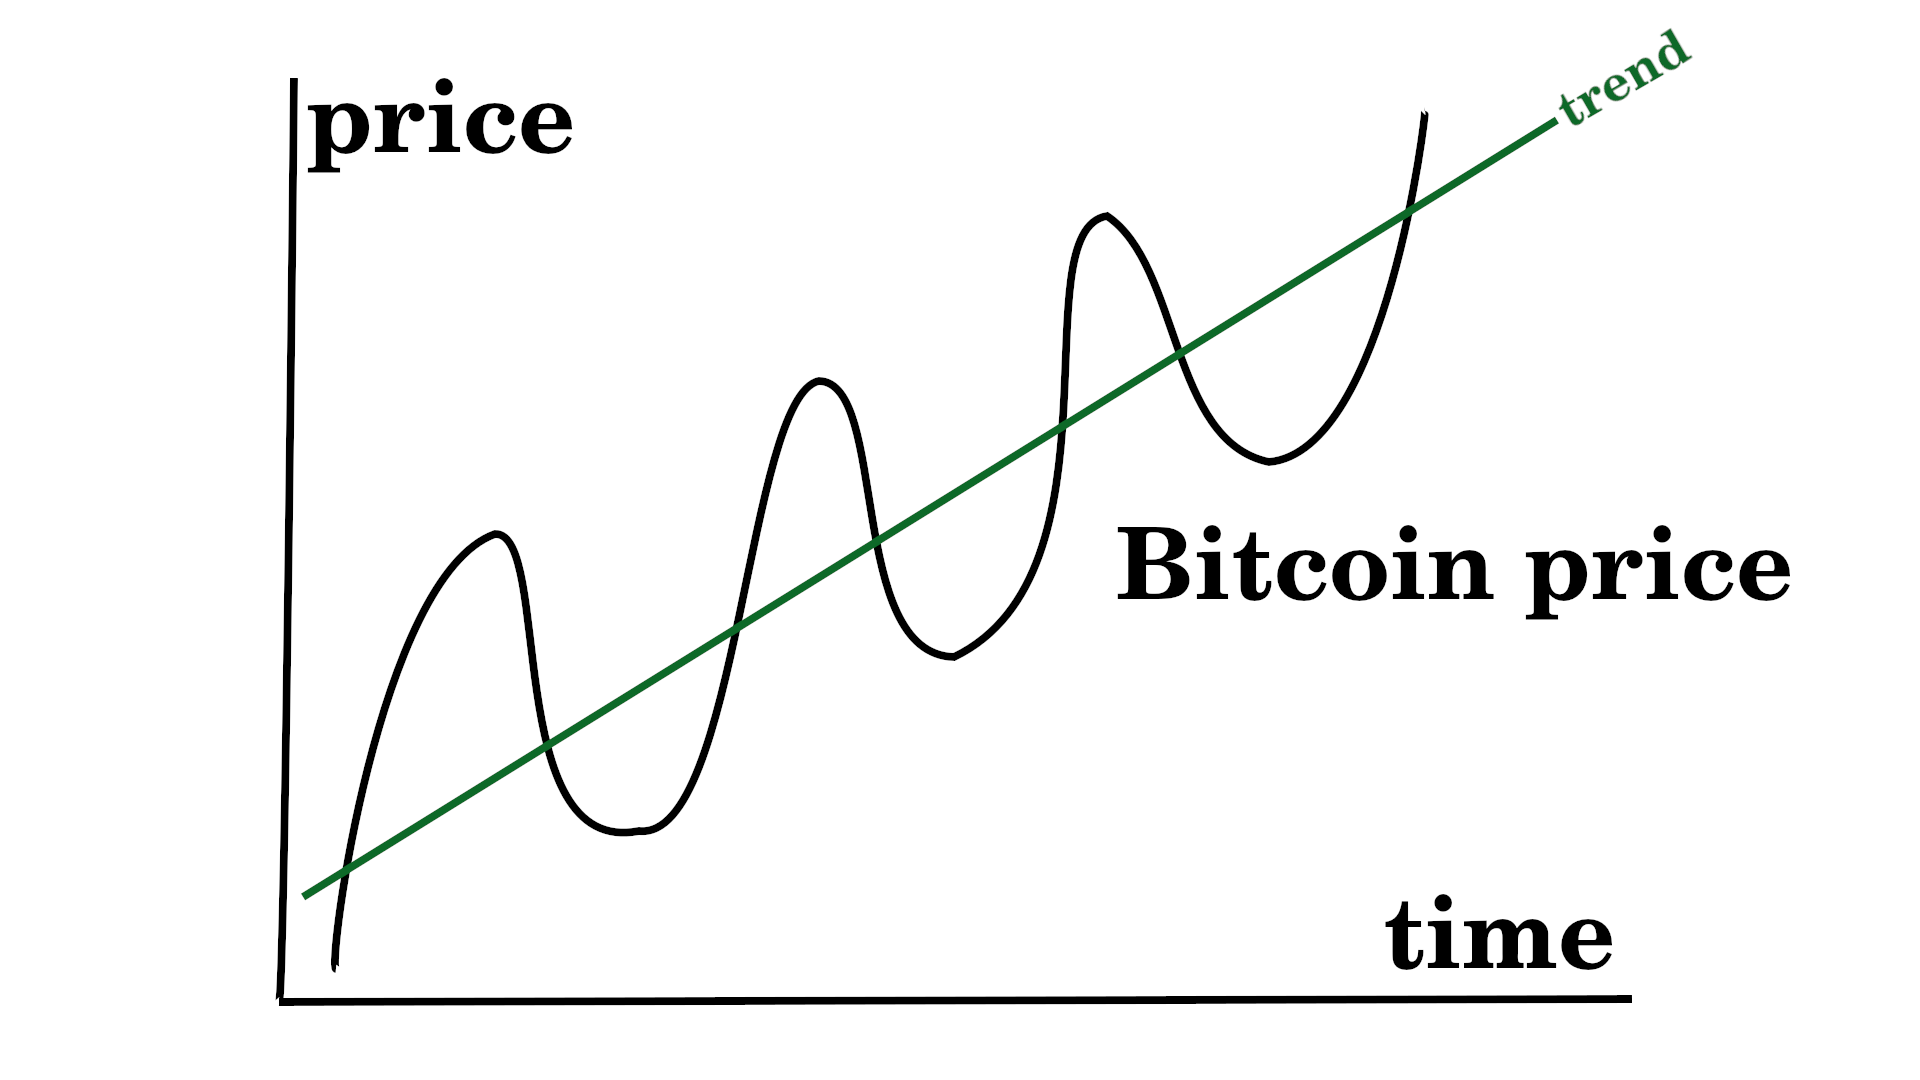
Sometimes Bitcoin price is supported by the macroeconomic environment

❶ Maintenance trigger "new top found":
in theory the trigger looks like this:
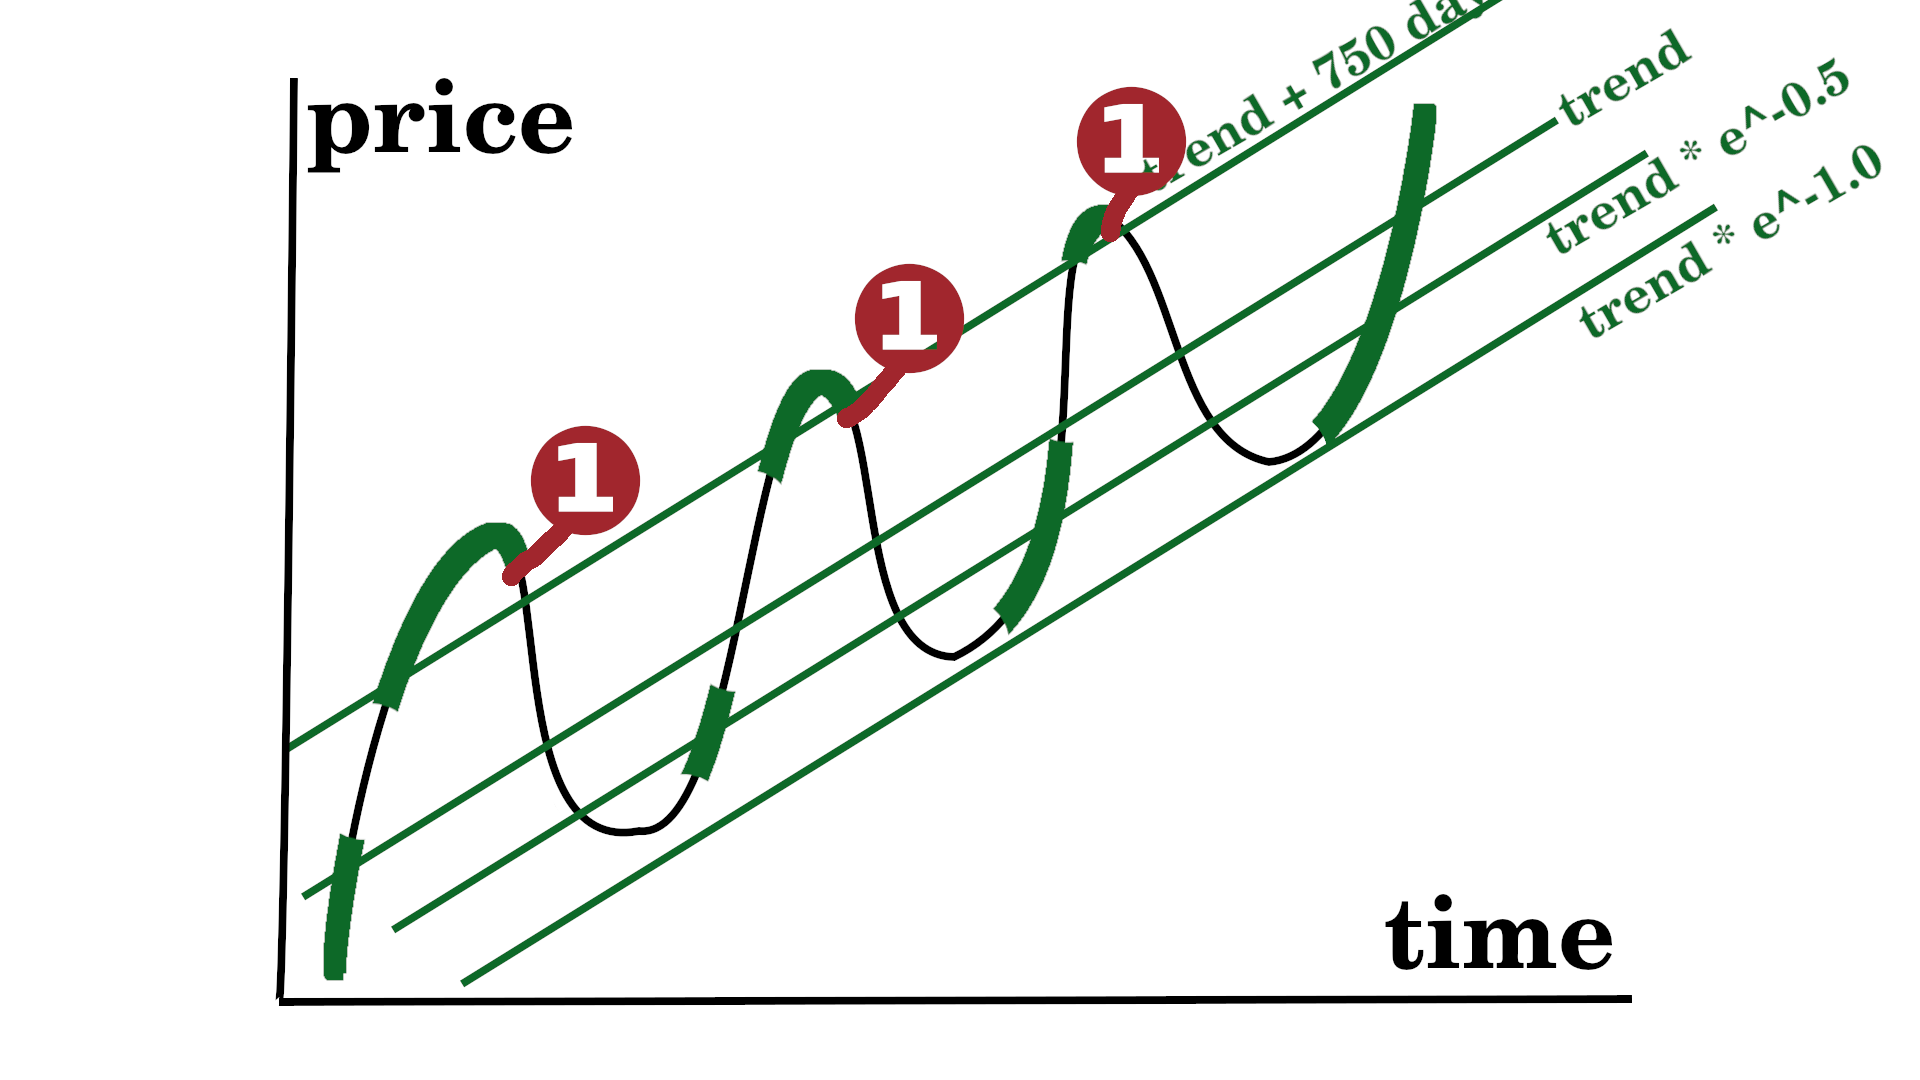
1st trigger:
Bitcoin price = trend +750 days
2nd trigger:
[Bitcoin price 10% below all time high] and [S&P 90d volatility > S&P 500d volatility] or
[Bitcoin price 50% below all time high]
I will then check, if the slope is still slightly below 6.
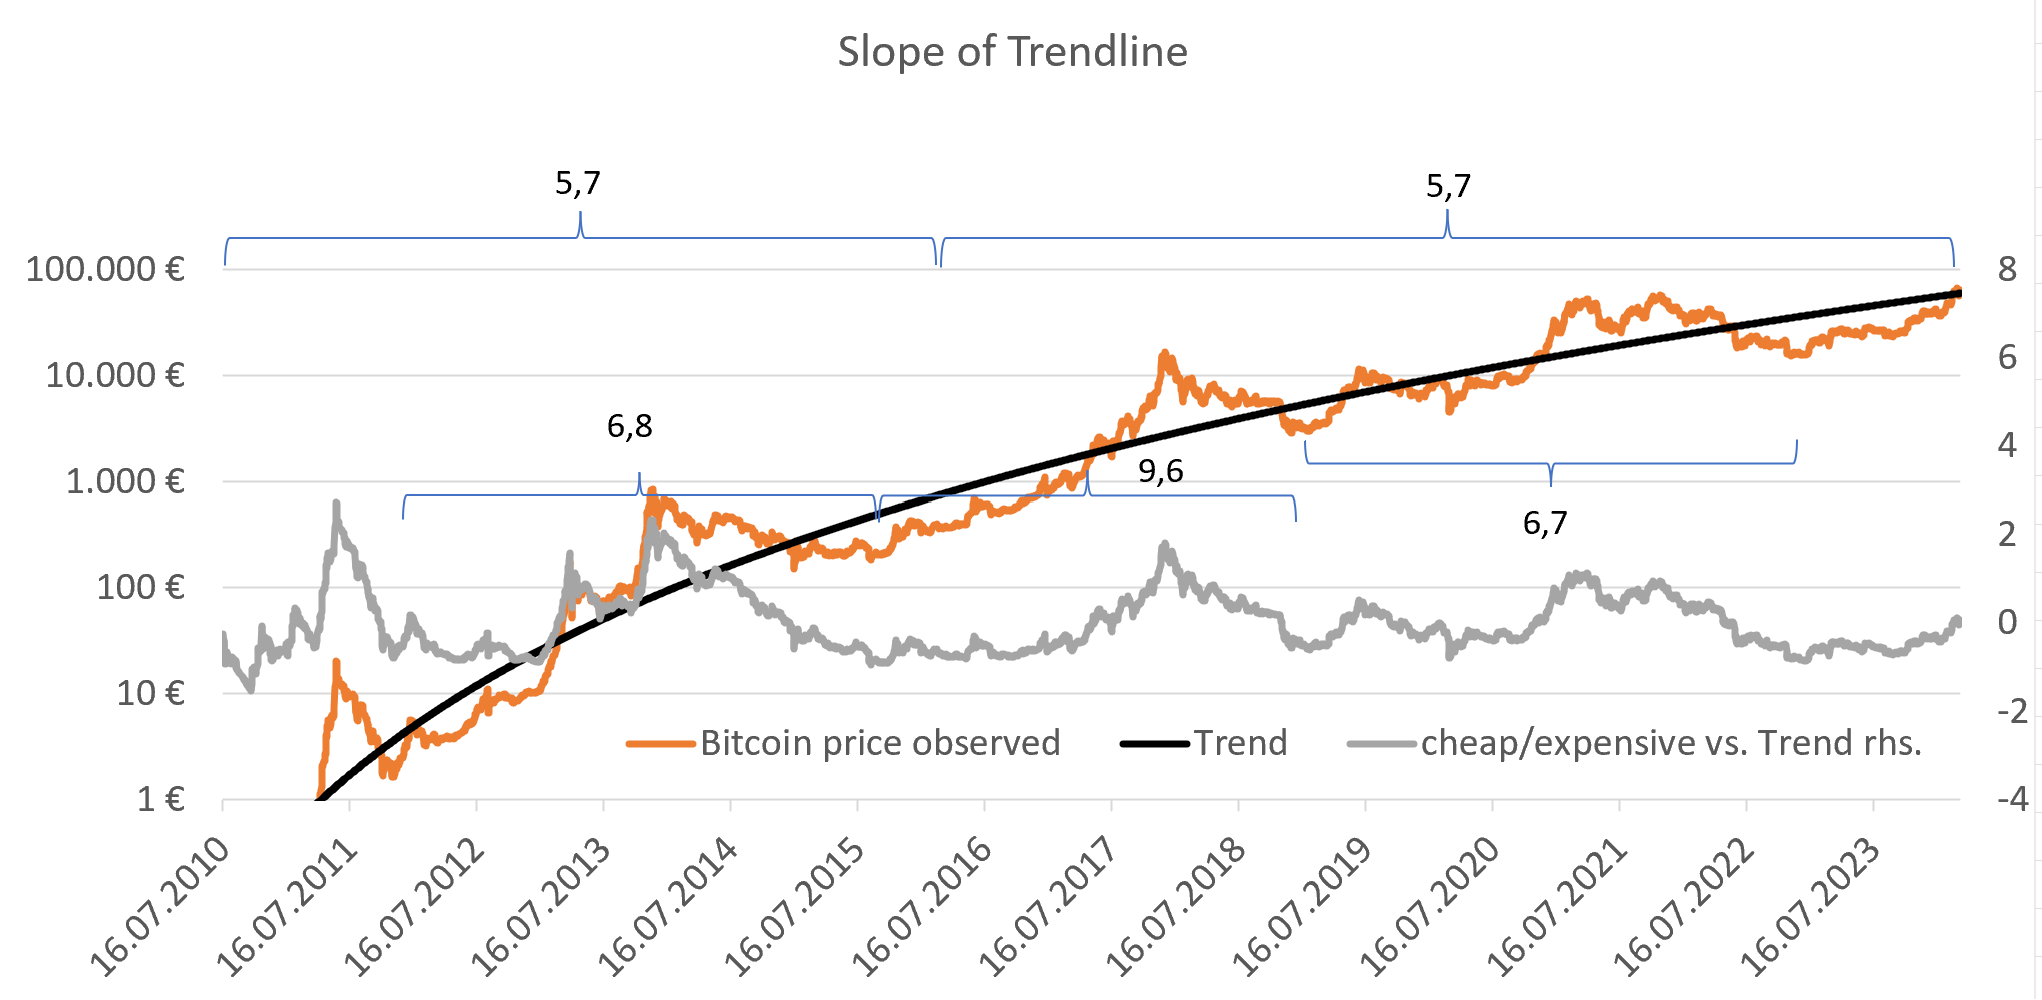
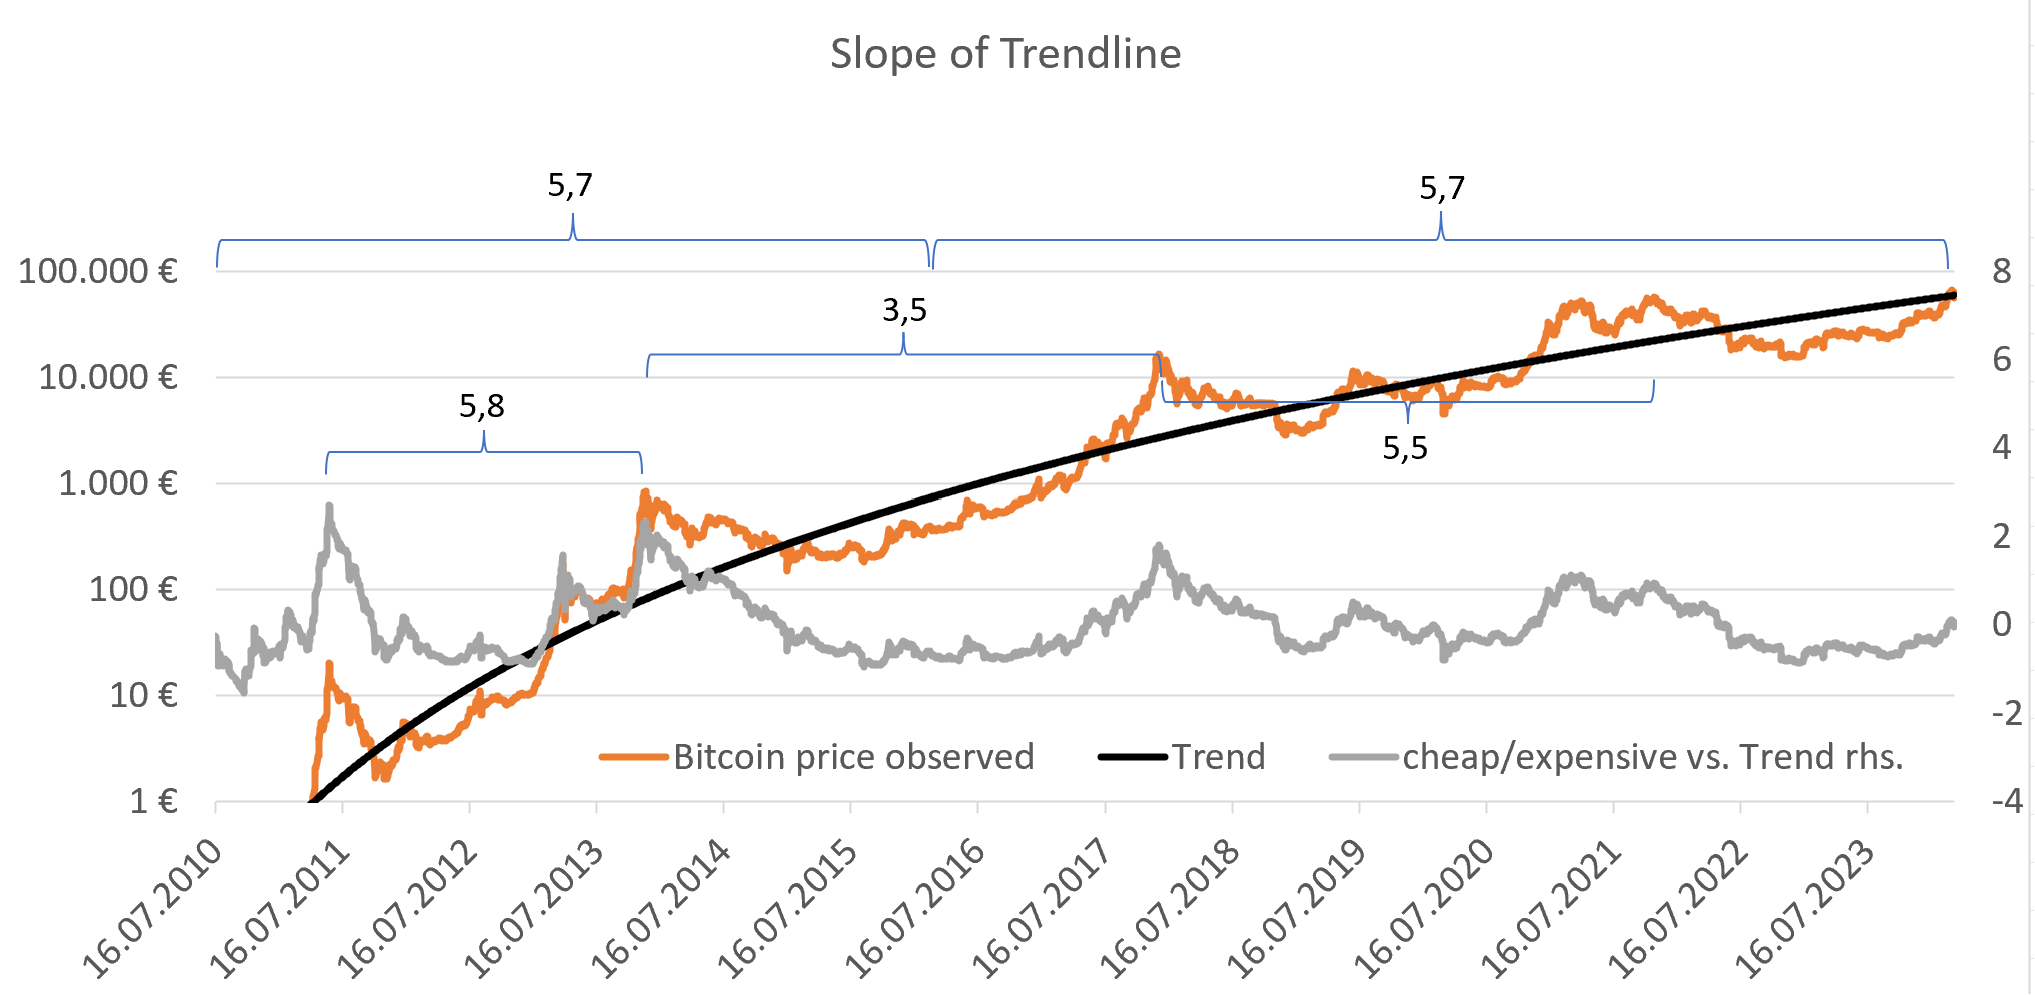
A significantly lower slope would require a new hedonistic optimization to get a new bitcoin allocation (e.g. 50% instead of 66%).
I will also check how far above trend the Bitcoin price went, to set a new trading trigger for the next cycle (e.g. 500 days overvaluation instead of 750 days or switiching form days overvaluation to ln overvaluation).
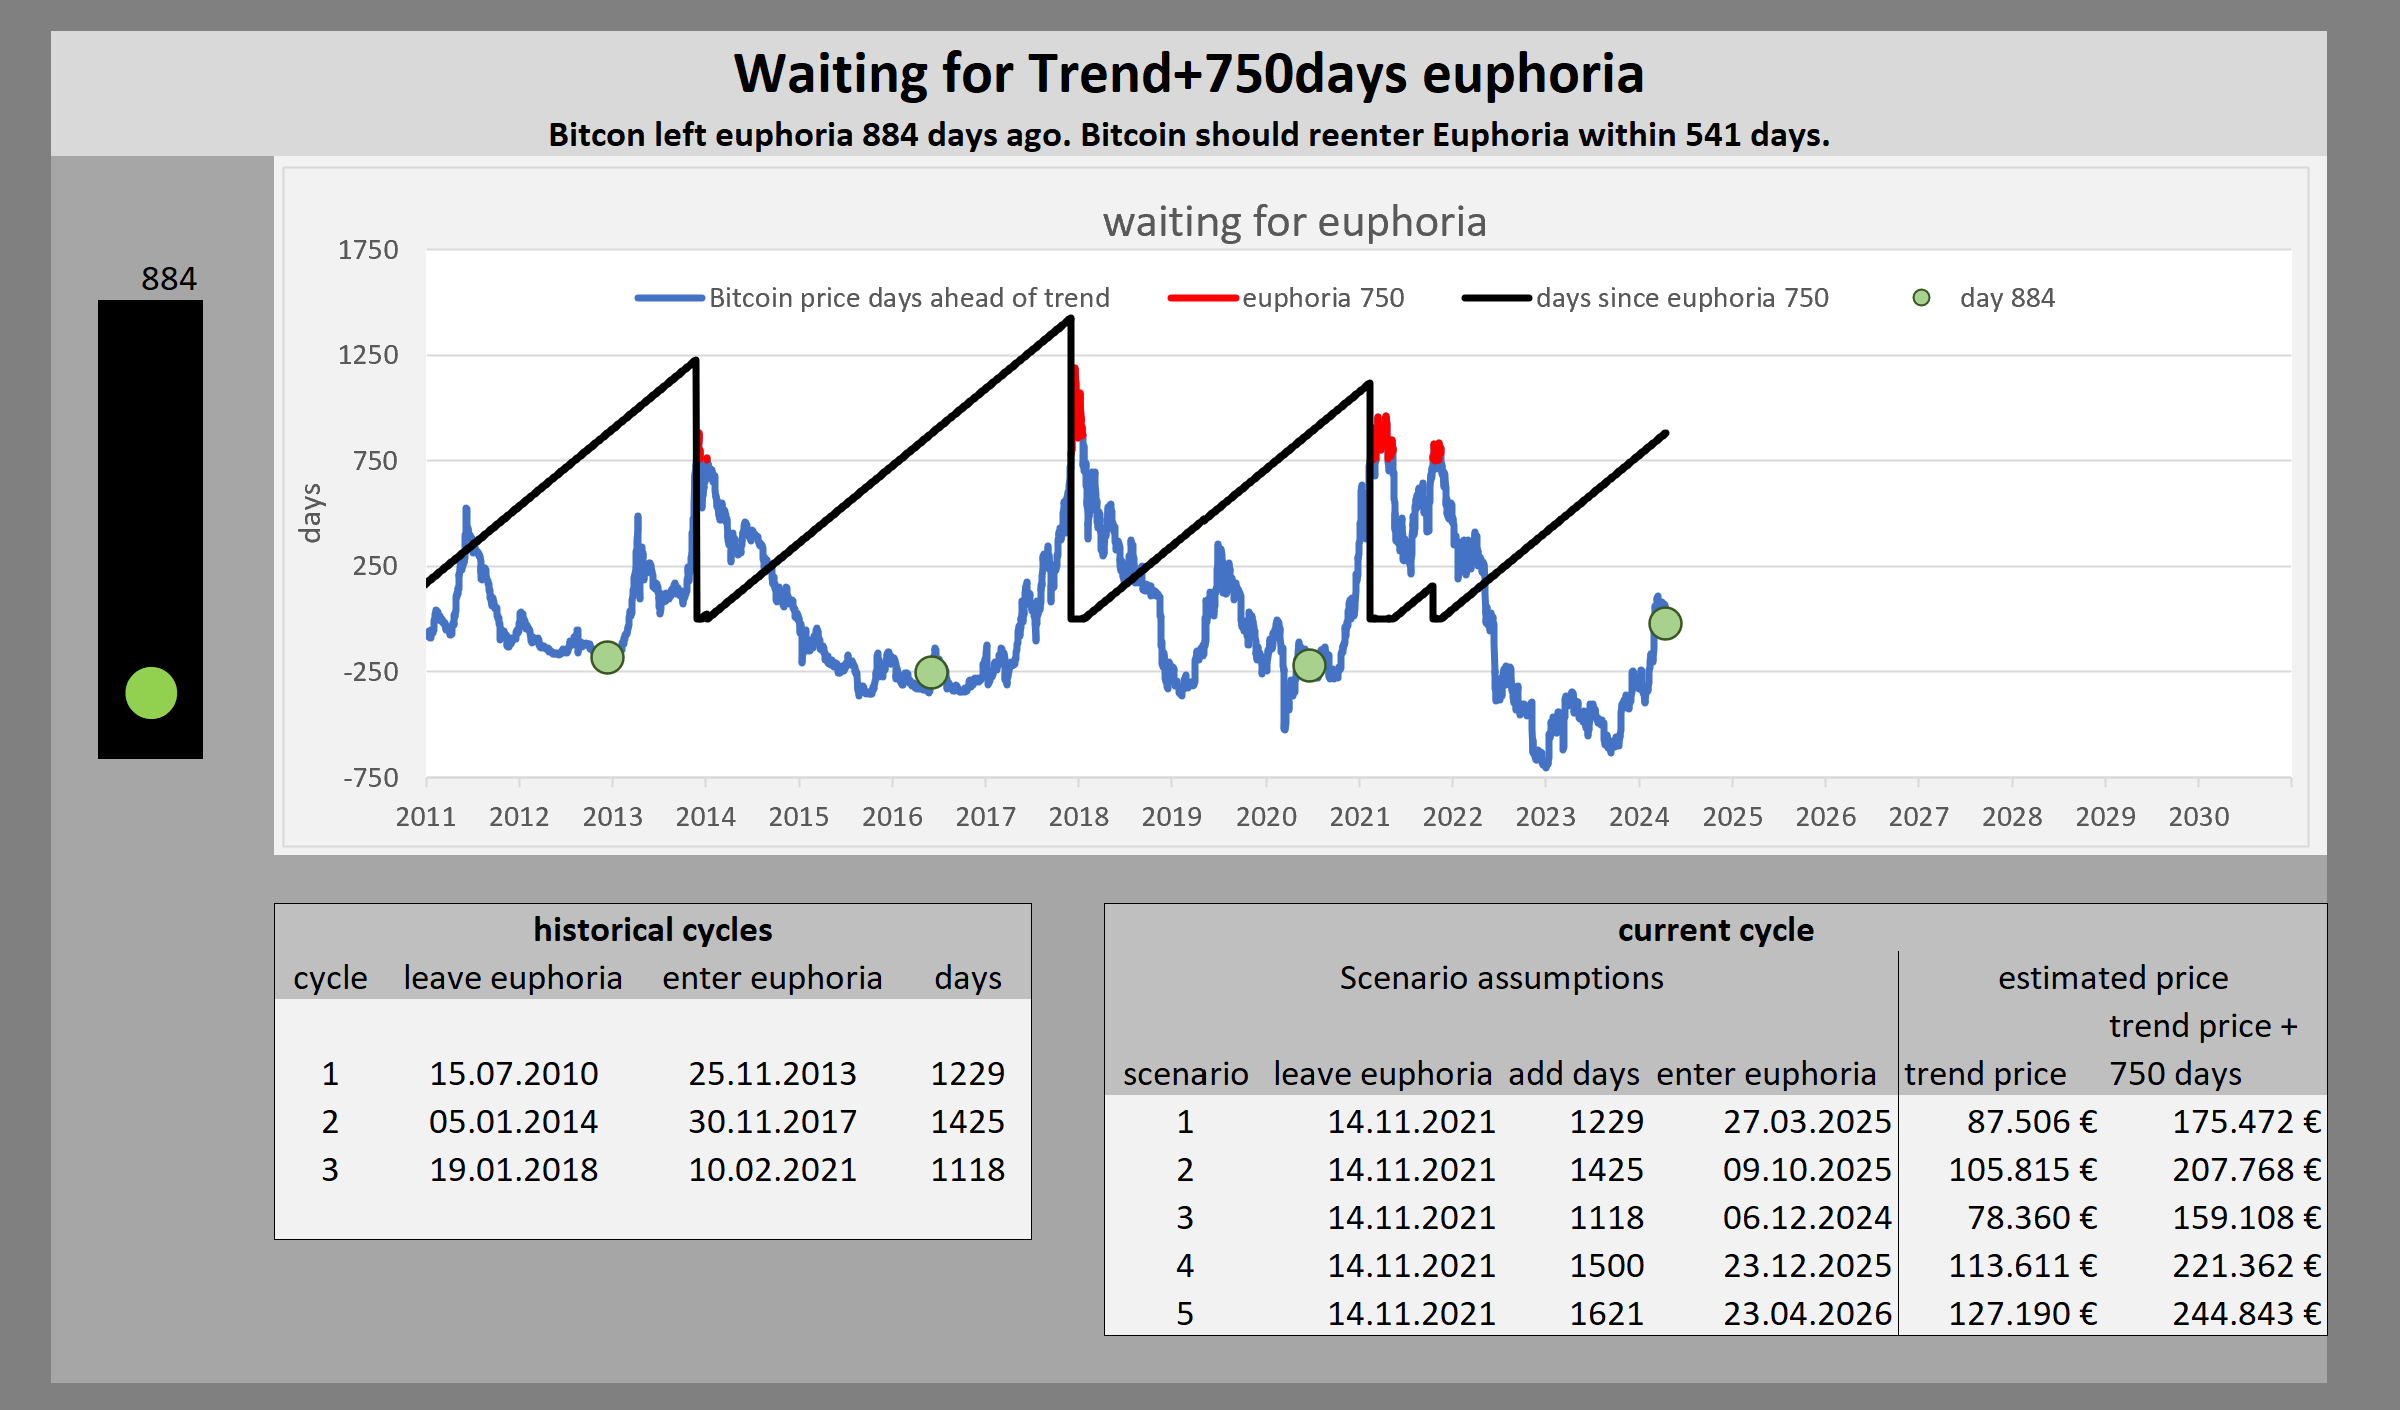
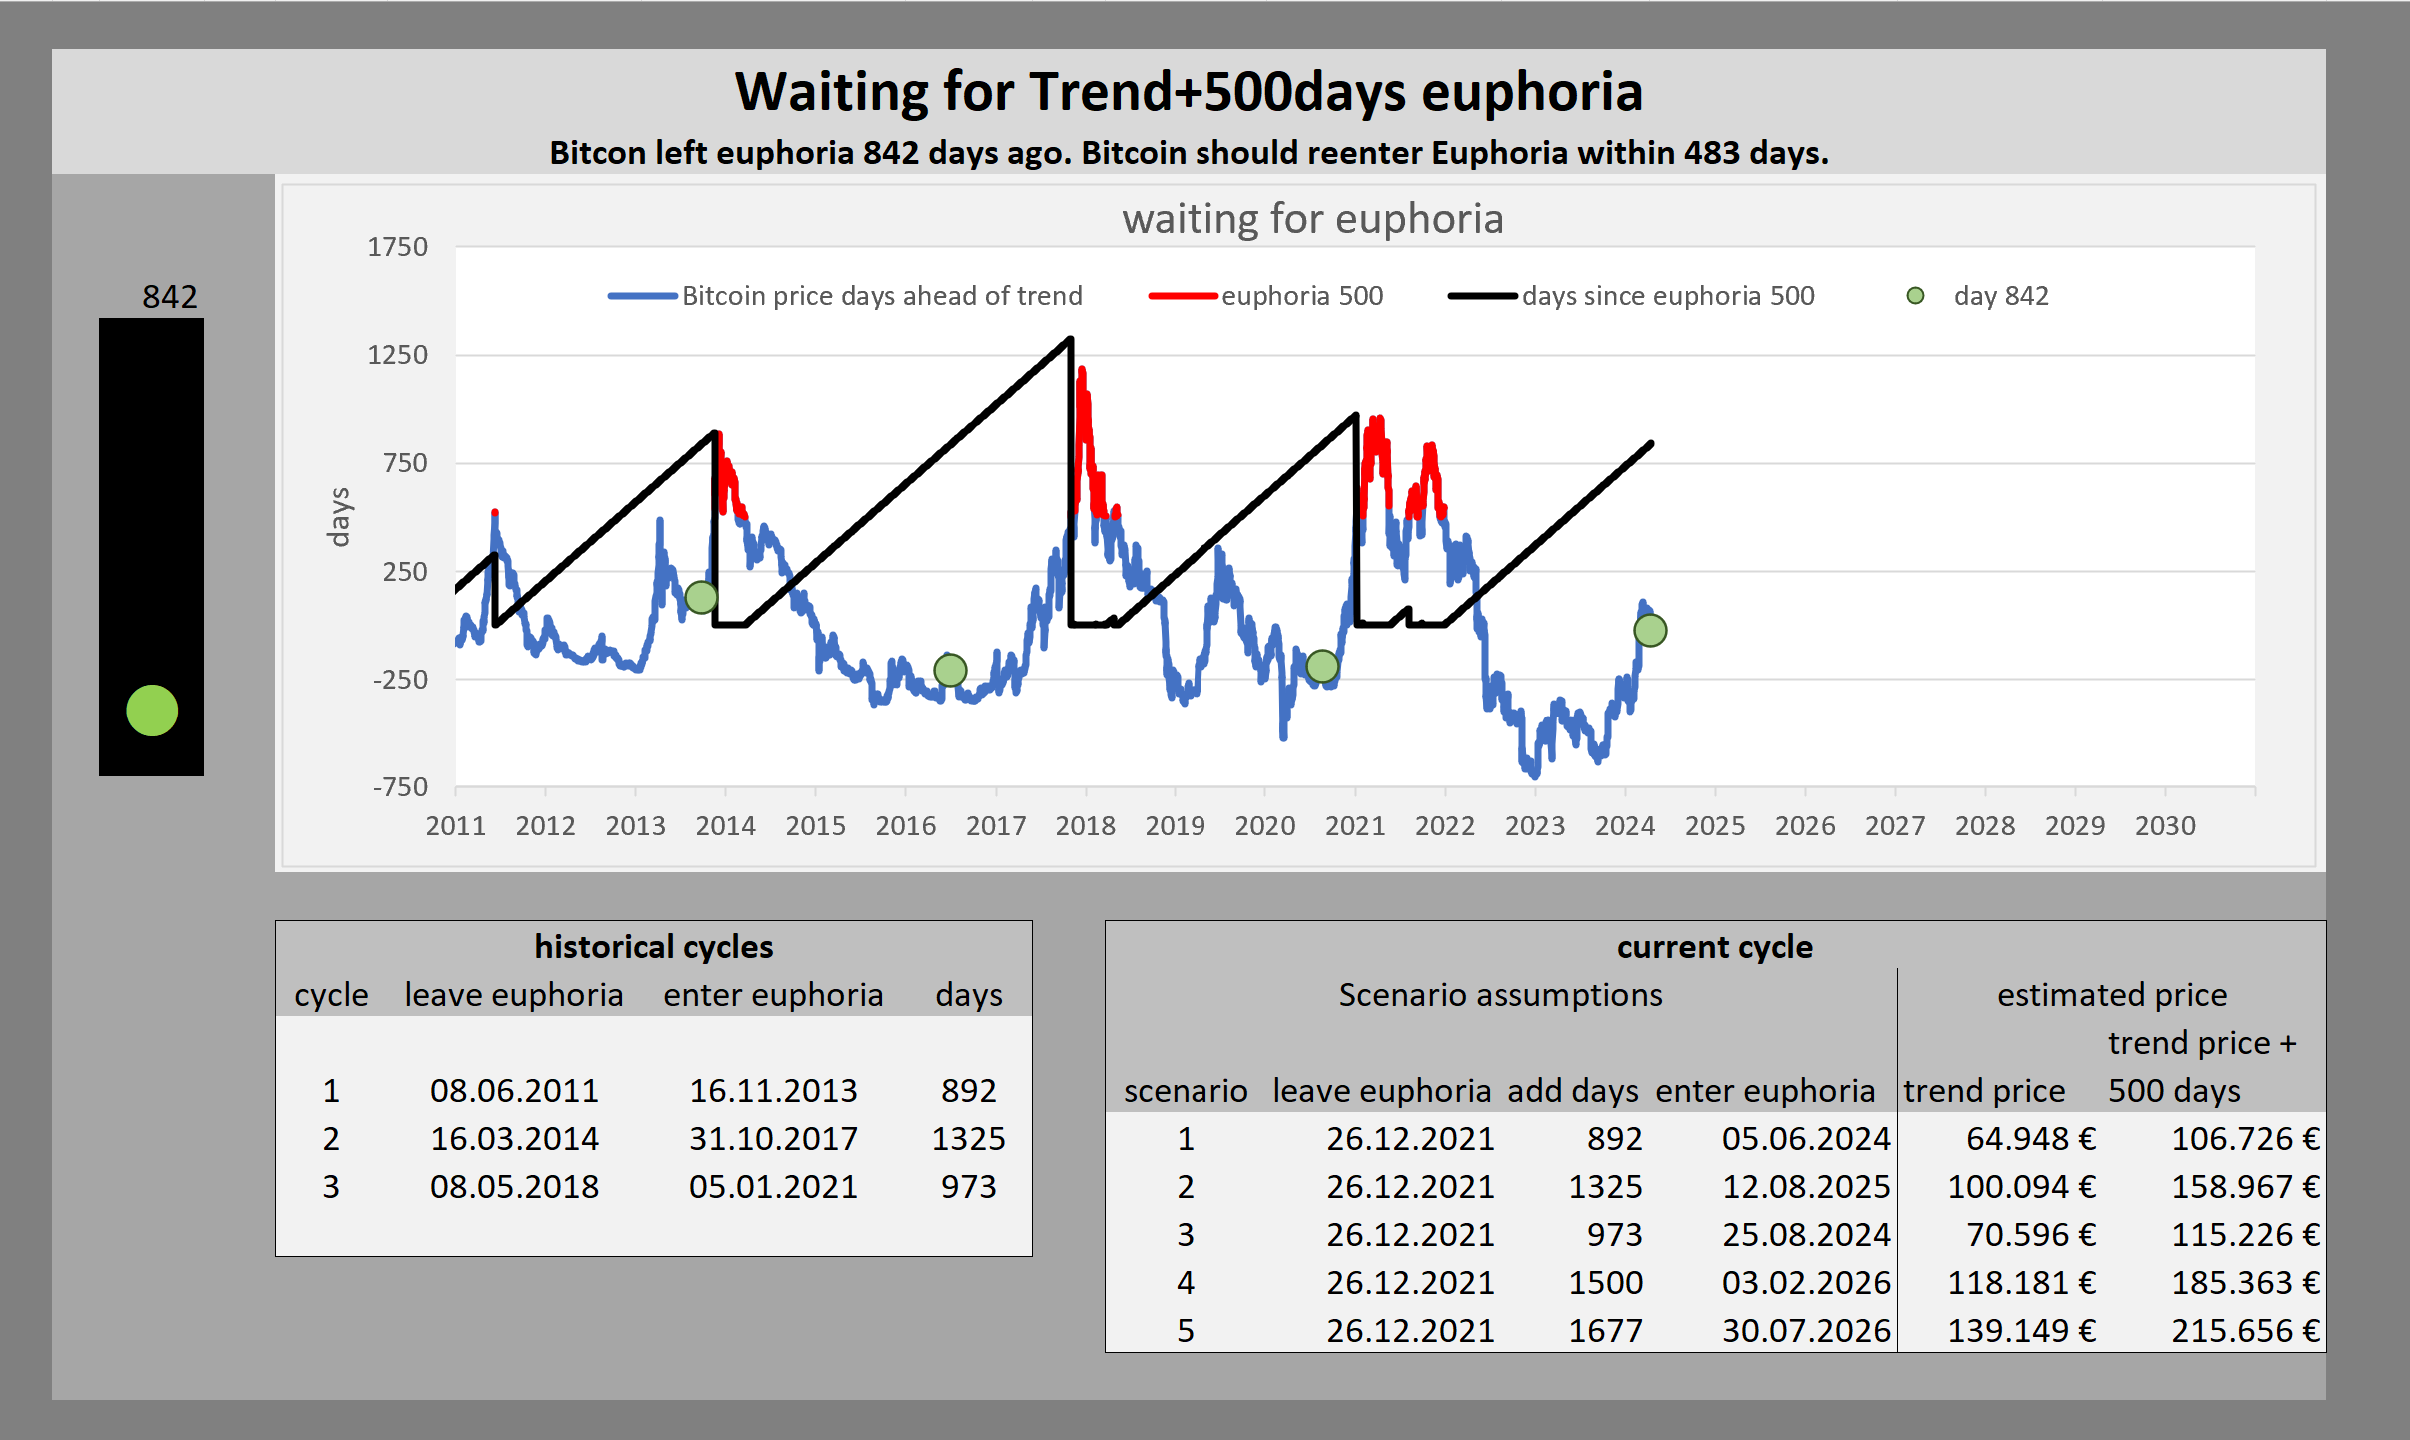
❷ Maintenance trigger "new top missed":
trigger:
no euphoria since 1621 or 1677 days
❸ Maintenance trigger "new bottom found":
1st trigger:
Bitcoin price = 40% below trend
2nd trigger:
[Bitcoin price 10% above 12 months low] and [S&P 90d volatility < 90% S&P 500d volatility] or
[Bitcoin price 50% above 12 months low]
I will then check, if the slope is still slightly below 6. Also I will check the picture of undervaluation and volatility to re-calibrate our trading triggers and our maintenance triggers.
❹ Maintenance trigger "bottom broken":

trigger:
crushing with high volatility through the floor or
gradually lower and lower bottoms