NVDA Share Price Soars 11% after Report The signs of concern we wrote about yesterday have largely subsided. After three days of declines, the price of E-mini Nasdaq 100 futures bounced off the lower boundary of the channel (see yesterday's chart) and rose, led by NVDA stock. Nvidia's quarterly report exceeded expectations: → earnings per share: actual = USD 5.16, expected = USD 4.59; → gross revenue: actual = USD 22.10 billion, expected = USD 20.39 billion. According to the head of the company: → Accelerated computing and generative AI have reached a tipping point. → Demand for computing is growing worldwide among companies, industries and governments. → The coming year will bring major new product cycles with exceptional innovations that will help propel the industry forward. In post-market trading, NVDA's price rose 11% to over USD 740 per share. Thus, the price increase for NVDA since the beginning of 2024 is about 50%.  VIEW FULL ANALYSIS VISIT - FXOpen Blog...Disclaimer: This article represents the opinion of the Companies operating under the FXOpen brand only (excluding FXOpen EU). It is not to be construed as an offer, solicitation, or recommendation with respect to products and services provided by the Companies operating under the FXOpen brand, nor is it to be considered financial advice. VIEW FULL ANALYSIS VISIT - FXOpen Blog...Disclaimer: This article represents the opinion of the Companies operating under the FXOpen brand only (excluding FXOpen EU). It is not to be construed as an offer, solicitation, or recommendation with respect to products and services provided by the Companies operating under the FXOpen brand, nor is it to be considered financial advice.
|
|
|
|
GBPUSD Technical Analysis 21st FEB, 2024GBPUSD Bullish Price Crossover GBPUSD had a bullish momentum yesterday when it touched a high of 1.2667 after which we can see some downwards correction coming into the markets. The prices of GBPUSD have entered into a consolidation channel after which we can see some bullish moves. We can see the formation of Bullish Price crossover pattern with the Moving Average MA20 and MA100 in the 15-minutes timeframe. The prices of GBPUSD are ranging near the support of the channel in the 1-hourly timeframe. We can see the formation of Bullish Trend reversal pattern with the Adaptive Moving Average AMA20 and AMA50 in the 15-minutes timeframe. GBPUSD is now trading above its 100-hour SMA and below its 200-hour SMA simple moving average. - Pound bullish reversal seen above the 1.2602 mark.
- Short-term range appears to be Mild Bullish.
- GBPUSD continues to remain above the 1.2600 levels.
- Average true range ATR is indicating high market volatility.
GBPUSD is now trading above its Pivot levels of 1.2617 and is moving into a Bullish channel. The price of GBPUSD has already crossed its Classic resistance levels of 1.2622 and the next target is located at 1.2645 which is a 14-3 Day Raw Stochastic at 50%. Note: This Analytics is created by me and is based on my own personal Forex trading experience of 10 years. I am using my trading experience to help Experienced and Newbie traders and they should know about the risks of Forex trading.For in-depth analysis, please check FXOpen Blog
|
|
|
|
EURUSD Technical Analysis 21st FEB, 2024EURUSD Bullish Trend Reversal EURUSD was moving in a bullish momentum yesterday and touched a high of 1.0838 after which we can see a downwards pressure coming into the markets which brought down the prices of Euro towards a low of 1.0789. Today we can see the formation of Bullish Trend Reversal pattern with MA20 in the 30-minutes timeframe. The Momentum indicator is back over zero in the 2-hourly timeframe indicating the bullish tone present in the markets. The prices of EURUSD are ranging near the support of the triangle and channel in the weekly timeframe. In the short term we are now looking at some market consolidation after which the prices will start moving upwards with immediate targets of 1.0836 which is a 14-3 Day Raw Stochastic at 70%. EURUSD is now trading above its 100-hour SMA and 200-hour SMA simple moving averages. - Euro bullish reversal seen above the 1.0789 mark.
- Short-term range appears to be Mild Bullish.
- EURUSD continues to remain above the 1.0780 levels.
- Average true range ATR is indicating high market volatility.
The next resistance is located at 1.0818 which is a 3-10 Day MACD Oscillator Stalls. EURUSD is now trading below its Pivot levels of 1.0810 and is moving into a Mild Bullish Channel. The price of EURUSD remains above its Classic support levels of 1.0803 and is moving towards its next target of 1.0836. Note: This Analytics is created by me and is based on my own personal Forex trading experience of 10 years. I am using my trading experience to help Experienced and Newbie traders and they should know about the risks of Forex trading.For in-depth analysis, please check FXOpen Blog
|
|
|
|
Ethereum Price Falls after Exceeding $3,000 We previously wrote about the reasons for the positive sentiment in the ETH/USD market. Optimism was added by a post on X (Twitter) by Vitalik Buterin about the so-called Werkle trees. This technology, which should (according to the information in the roadmap) be introduced in the future, it includes the advantages of: → reduced requirements for validators; → faster network synchronization, and others. The ETH/USD chart shows that: → ETH price is within a larger uptrend (shown in orange); → the price is within the February bullish trend (shown by blue lines); → the market is in an overbought state, judging by the bearish divergence on the MACD indicator.  VIEW FULL ANALYSIS VISIT - FXOpen Blog...Disclaimer: This article represents the opinion of the Companies operating under the FXOpen brand only (excluding FXOpen EU). It is not to be construed as an offer, solicitation, or recommendation with respect to products and services provided by the Companies operating under the FXOpen brand, nor is it to be considered financial advice. VIEW FULL ANALYSIS VISIT - FXOpen Blog...Disclaimer: This article represents the opinion of the Companies operating under the FXOpen brand only (excluding FXOpen EU). It is not to be construed as an offer, solicitation, or recommendation with respect to products and services provided by the Companies operating under the FXOpen brand, nor is it to be considered financial advice.
|
|
|
|
S&P 500 Inches Down After Long Rally as FOMC Minutes Approach Aside from the performance of a national currency, a popular yardstick by which to gauge anticipation or reaction to an economic event or announcement is the market sentiment surrounding the top listed stocks on premier exchanges. Today, as market participants around the world await the release of the minutes from the FOMC meeting that took place at the end of January, the S&P 500 index will begin trading slightly lower, an interesting movement considering that for the past three months, this premier index which includes the most prestigious and highly capitalised publicly listed companies listed on US exchanges, has been rallying. Since the end of October, only a few minor dips have taken place. However, the tailing off which took place during the New York trading session yesterday places the S&P 500 under the 5,000 point mark when the market opens in New York today. On February 19, the S&P 500 finished the trading day (Eastern Standard Time) at 5,008.7, according to FXOpen charts and will begin the trading session today at 4,973.6, which is its closing price yesterday. VIEW FULL ANALYSIS VISIT - FXOpen Blog...Disclaimer: This article represents the opinion of the Companies operating under the FXOpen brand only (excluding FXOpen EU). It is not to be construed as an offer, solicitation, or recommendation with respect to products and services provided by the Companies operating under the FXOpen brand, nor is it to be considered financial advice.
|
|
|
|
NASDAQ Price Declining Ahead of NVDA Report E-mini NASDAQ 100 futures fell below the psychological 17,500 level yesterday after trading above 18,000 on Friday. The reason for the decline may be the fears of market participants ahead of the news release: → today after the close of the main trading session, Nvidia, the 5th largest company by capitalization, will publish its report; → today at 22:00 GMT+3, data from the Federal Reserve will be published, which will provide important information about the prospects for lowering the interest rate. However, for now the decline looks like a correction. The NASDAQ 100 chart shows that: → the price is within an uptrend (shown by a blue channel); → the level of 18000 acted as psychological resistance, as the price turned down after a small puncture; → the price fixes below the local ascending channel (shown by purple lines). For now, the support level at 17,500 is keeping the price from falling further, but if the news is disappointing, the price may drop to the lower border of the channel it is even possible that the bears will attempt a breakout. 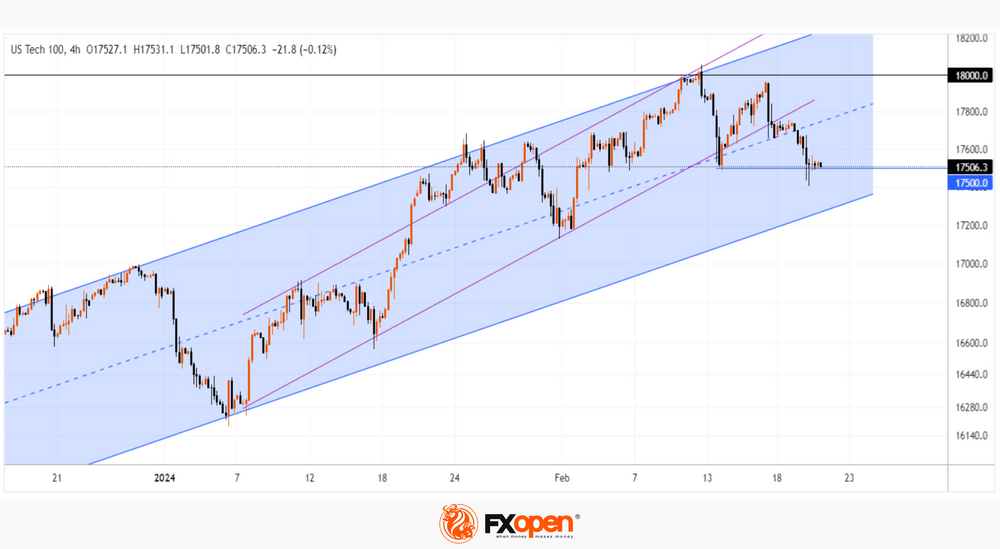 VIEW FULL ANALYSIS VISIT - FXOpen Blog...Disclaimer: This article represents the opinion of the Companies operating under the FXOpen brand only (excluding FXOpen EU). It is not to be construed as an offer, solicitation, or recommendation with respect to products and services provided by the Companies operating under the FXOpen brand, nor is it to be considered financial advice. VIEW FULL ANALYSIS VISIT - FXOpen Blog...Disclaimer: This article represents the opinion of the Companies operating under the FXOpen brand only (excluding FXOpen EU). It is not to be construed as an offer, solicitation, or recommendation with respect to products and services provided by the Companies operating under the FXOpen brand, nor is it to be considered financial advice.
|
|
|
|
Market Analysis: EUR/USD Starts Increase While USD/JPY Dips EUR/USD gained bullish momentum above the 1.0800 resistance. USD/JPY is declining and showing bearish signs below the 150.40 level.Important Takeaways for EUR/USD and USD/JPY Analysis Today EUR/USD gained bullish momentum above the 1.0800 resistance. USD/JPY is declining and showing bearish signs below the 150.40 level.Important Takeaways for EUR/USD and USD/JPY Analysis Today- The Euro remained in a bullish zone and climbed above the 1.0800 resistance zone.
- There is a key bullish trend line forming with support near 1.0790 on the hourly chart of EUR/USD at FXOpen.
- USD/JPY is trading in a bearish zone below the 150.40 and 150.15 levels.
- There is a major bearish trend line forming with resistance near 150.15 on the hourly chart at FXOpen.
EUR/USD Technical Analysis On the hourly chart of EUR/USD at FXOpen, the pair started a fresh increase above the 1.0745 zone. The Euro climbed above the 1.0800 resistance zone against the US Dollar. The pair even settled above the 1.0800 resistance and the 50-hour simple moving average. Finally, it tested the 1.0840 resistance. A high is formed near 1.0838 and the pair is now consolidating gains. There was a minor decline below the 23.6% Fib retracement level of the upward move from the 1.0761 swing low to the 1.0838 high. Immediate support is near the 1.0800 level. The next major support is at 1.0790. There is also a key bullish trend line forming with support near 1.0790 and the 50-hour simple moving average. It coincides with the 61.8% Fib retracement level of the upward move from the 1.0761 swing low to the 1.0838 high. If there is a downside break below 1.0790, the pair could drop toward the 1.0745 support. The main support on the EUR/USD chart is near 1.0695, below which the pair could start a major decline. On the upside, the pair is now facing resistance near 1.0840. The next major resistance is near the 1.0885 level. An upside break above 1.0885 could set the pace for another increase. In the stated case, the pair might rise toward 1.0950. VIEW FULL ANALYSIS VISIT - FXOpen Blog...Disclaimer: This article represents the opinion of the Companies operating under the FXOpen brand only (excluding FXOpen EU). It is not to be construed as an offer, solicitation, or recommendation with respect to products and services provided by the Companies operating under the FXOpen brand, nor is it to be considered financial advice.
|
|
|
|
GBPUSD Technical Analysis 20th FEB, 2024GBPUSD Bullish Harami Cross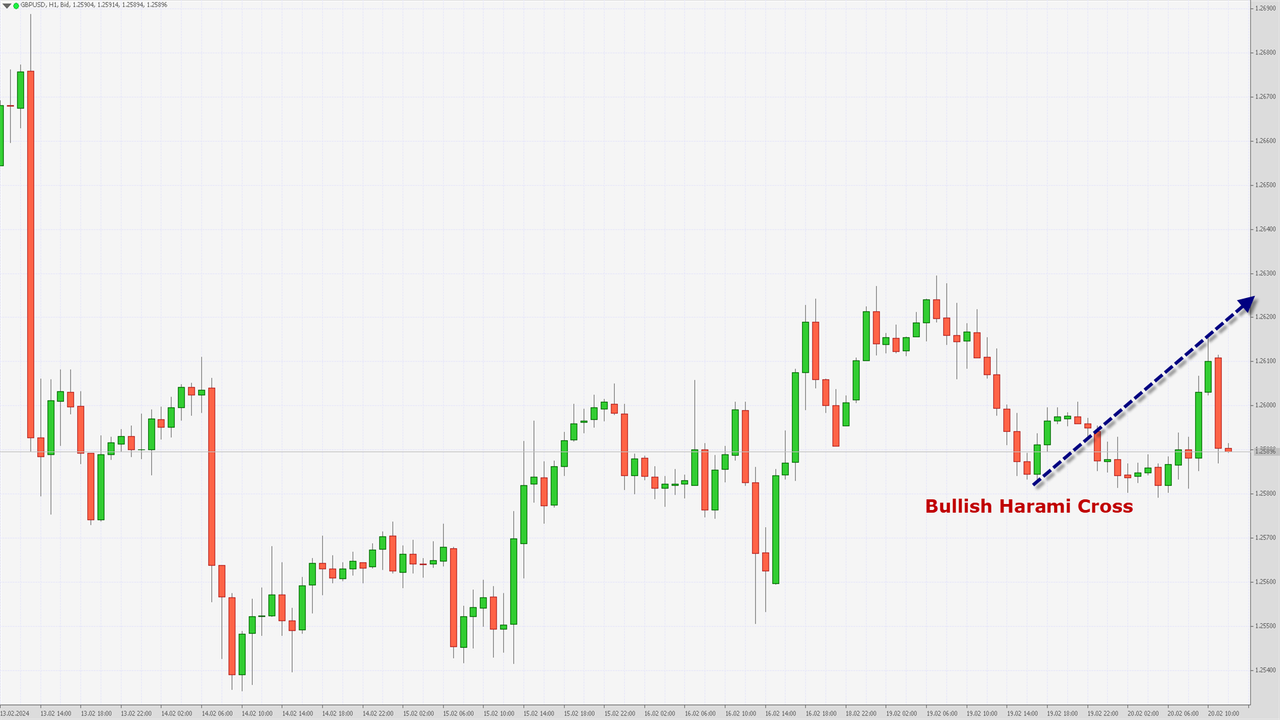 GBPUSD started today on a subdued note after which we can see some bullish moves in the European trading session today. The prices of GBPUSD have managed to touch a high of 1.2615 after which we saw some short-term decline in its levels. We can see the formation of Bullish Harami cross pattern in the 30-minutes timeframe. The resistance of the channel is broken in the 15-minutes timeframe. We can see the formation of Bullish price crossover with the Adaptive moving average AMA50 in the 30-minurtes timeframe. The parabolic SAR indicator is also giving a bullish reversal signal in the 2-hourly timeframe. GBPUSD is now trading above its 100-hour SMA and below its 200-hour SMA simple moving average. - Pound bullish reversal seen above the 1.2580 mark.
- Short-term range appears to be Neutral.
- GBPUSD continues to remain above the 1.2580 levels.
- Average true range ATR is indicating high market volatility.
GBPUSD is now trading below its Pivot levels of 1.2610 and is moving into a Consolidation channel. The price of GBPUSD needs to cross its Classic resistance levels of 1.2604 and the next target is located at 1.2631 which is a 61.8% Retracement from the 52 Week Low. Note: This Analytics is created by me and is based on my own personal Forex trading experience of 10 years. I am using my trading experience to help Experienced and Newbie traders and they should know about the risks of Forex trading.For in-depth analysis, please check FXOpen Blog
|
|
|
|
EURUSD Technical Analysis 20th FEB, 2024EURUSD MACD Crosses UP its Moving Average EURUSD started moving today in a consolidation channel after which we can see some bullish moves towards the 1.0800 handle. The MACD crosses UP its Moving average in both the 2-hourly and 4-hourly timeframes. We can see the formation of Bullish engulfing lines in the 15-minutes timeframe. We can see the formation of a bullish price crossover pattern with both the MA20 and MA100 in the daily timeframe. The prices of Euro are ranging near the support of triangle and channel in the Tick trader terminal at present market levels of 1.0798. EURUSD is now trading above its 100-hour SMA and 200-hour SMA simple moving averages. - Euro bullish reversal seen above the 1.0762 mark.
- Short-term range appears to be Mild Bullish.
- EURUSD continues to remain above the 1.0780 levels.
- Average true range ATR is indicating high market volatility.
The next resistance is located at 1.0836 which is a 14-3 Day Raw Stochastic at 70%. EURUSD is now trading just above its Pivot levels of 1.080 and is moving into a Mild Bullish Channel. The price of EURUSD has already crossed its Classic resistance levels of 1.0796 and is moving towards its next target of 1.0836. Note: This Analytics is created by me and is based on my own personal Forex trading experience of 10 years. I am using my trading experience to help Experienced and Newbie traders and they should know about the risks of Forex trading.For in-depth analysis, please check FXOpen Blog
|
|
|
|
Will investors focus on commodities in the advent of tomorrow's FOMC Minutes? Just over a day remains before the Federal Open Market Committee (FOMC) in the United States is set to release the minutes from its policy meeting, which was held at the end of January. Ordinarily, announcements such as this are considered to be very important events in the global economic calendar, especially given that monetary policy, which the FOMC is responsible for administering, has been a very significant feature during these prolonged times of high-interest rates and stringent rulings by central banks across Western markets which have continued despite the high levels of inflation which ran into double figures being long since a thing of the past. Perhaps the forthcoming publication of the minutes from the FOMC meeting, which took place on the final days of January, will not reveal any particular new matters of interest, largely because it is already widely understood that the US authorities will not be reducing interest rates in the foreseeable future, contrary to the understanding of many analysts and investors at the beginning of this year. Given that Federal Reserve chairman Jerome Powell underscored the decision in a message at the beginning of February by saying that the Federal Reserve will not cut rates until it is certain that inflation is nearing the 2% target, it appears that any such minutes from a more recent meeting are not likely to affect the market that much. In times during which the market expects a favourable approach by central bankers which will accelerate the economy, such as rate cuts which were anticipated for March and June this year, which do not materialise, it is often the case that attention turns to commodities. Over the past few days, spot gold has been increasing in value. On February 13, spot gold was at its lowest value this year, trading at $1,990.69 per troy ounce at the bottom end of the candlestick, according to FXOpen pricing. This low point reversed, and spot gold has made a remarkable return over the past week, entering the market this morning across European time zones at just over $2,021 per troy ounce. VIEW FULL ANALYSIS VISIT - FXOpen Blog...Disclaimer: This article represents the opinion of the Companies operating under the FXOpen brand only (excluding FXOpen EU). It is not to be construed as an offer, solicitation, or recommendation with respect to products and services provided by the Companies operating under the FXOpen brand, nor is it to be considered financial advice.
|
|
|
|
GBPUSD Technical Analysis 19th FEB, 2024GBPUSD Ichimoku - Bullish crossover GBPUSD started this week on an indecisive note with the prices oscillating between a high of 1.2628 and a low of 1.2582 today. We can see the formation of Ichimoku - Bullish crossover pattern in the 4-hourly timeframe which is a Bullish pattern. The prices of GBPUSD are ranging near the support of channel and triangle in the daily timeframe. We can see that the price of GBPUSD is ranging near horizontal support in the 15-minutes timeframe indicating a bullish tone present in the markets. Some of the technical indicators are neutral with the formation of Doji seen in both the daily and weekly timeframes. GBPUSD is now trading above its 100-hour SMA and below its 200-hour SMA simple moving average. - Pound bullish reversal seen above the 1.2550 mark.
- Short-term range appears to be Neutral.
- GBPUSD continues to remain above the 1.2580 levels.
- Average true range ATR is indicating high market volatility.
GBPUSD is now trading above its Pivot levels of 1.2586 and is moving into a Consolidation channel. The price of GBPUSD has already crossed its Classic resistance levels of 1.2582 and the next target is located at 1.2614 which is a 3-10-16 Day MACD Moving Average Stalls. Note: This Analytics is created by me and is based on my own personal Forex trading experience of 10 years. I am using my trading experience to help Experienced and Newbie traders and they should know about the risks of Forex trading.For in-depth analysis, please check FXOpen Blog
|
|
|
|
EURUSD Technical Analysis 19th FEB, 2024EURUSD Bullish Trend Reversal AMA50 EURUSD started this week on an indecisive move with the prices oscillating between a high of 1.0788 and a low of 1.0761 today, after which we can see a move towards the consolidation phase in the markets. We can see Bullish trend reversal with the Adaptive Moving Average AMA50 in the 1-hourly timeframe. The price of EURUSD is back over the Pivot point which suggests Bullish undertone present in the markets with immediate targets of 1.0790. We can see the formation of a bullish channel above the 1.0745 levels, as the prices are ranging near the support of the channel and triangle in the weekly timeframe. The MACD crosses UP its moving average in the 30-minutes timeframe. EURUSD is now trading above its 100-hour SMA and 200-hour SMA simple moving averages. - Euro bullish channel seen above the 1.0745 mark.
- Short-term range appears to be Mild Bullish.
- EURUSD continues to remain above the 1.0750 levels.
- Average true range ATR is indicating less market volatility.
The next resistance is located at 1.0791 at which the price Crosses 18 Day Moving Average. EURUSD is now trading just above its Pivot levels of 1.0768 and is moving into a Mild Bullish Channel. The price of EURUSD has already crossed its Classic resistance levels of 1.0765 and is moving towards its next target of 1.0790. Note: This Analytics is created by me and is based on my own personal Forex trading experience of 10 years. I am using my trading experience to help Experienced and Newbie traders and they should know about the risks of Forex trading.For in-depth analysis, please check FXOpen Blog
|
|
|
|
Dollar Holds Steady after Producer Price Data Release Market activity remains quite low at the beginning of the week, as American trading floors are closed to celebrate Presidents' Day. At the same time, investors continue to evaluate the data on manufacturing inflation published last Friday. Thus, the producer price index increased by 0.3% on a monthly basis and by 0.9% on an annual basis, which turned out to be higher than the predicted 0.1% and 0.6% and the December values of −0.1% and 1.0 %, respectively. In addition, trading participants paid attention to the publication of the consumer confidence index from the University of Michigan, a leading indicator that predicts consumer spending: in February it increased from 79.0 points to 79.6 points, slightly lower than the estimated 80.0 points. EUR/USD Today, the European currency is holding near the 1.0780 mark against the backdrop of weak investor activity, while market participants evaluate Friday's publications from Europe and the United States. Immediate resistance can be seen at 1.0790, a break higher could trigger a rise towards 1.0815. On the downside, immediate support is seen at 1.0732, a break below could take the pair towards 1.0695. According to French statistics, the consumer price index, calculated according to EU standards, showed a decrease of 0.2% month on month, and an increase of 3.4% in annual terms. However, prices excluding tobacco products fell 0.3% month-on-month after rising 0.1%. Technical analysis of EUR/USD shows that a new ascending channel has formed at the highs of two days of last week. Now the price is in the middle of the channel and may continue to rise. VIEW FULL ANALYSIS VISIT - FXOpen Blog...Disclaimer: This article represents the opinion of the Companies operating under the FXOpen brand only (excluding FXOpen EU). It is not to be construed as an offer, solicitation, or recommendation with respect to products and services provided by the Companies operating under the FXOpen brand, nor is it to be considered financial advice.
|
|
|
|
GBP/JPY: Price Corrects from 8.5 Year High According to CNN, the economies of the UK and Japan entered a technical recession last week as data showed a second consecutive quarterly decline in gross domestic product. And if in the UK the economic downturn can be associated with high inflation and the strict policies of the Bank of England, then in Japan the reason may be the population decline (which has been going on for 14 years in a row). At the same time, the GBP/JPY chart shows that last week the rate exceeded 190 yen per pound for the first time since August 2015. However: → the price is at the upper border of the ascending channel (shown in blue); → at the beginning of this week, the price of GBP/JPY is below the 190 yen level and a false bullish breakout of the psychological level should be regarded as a bearish sign; → the MACD indicator indicates that demand forces are fading.  VIEW FULL ANALYSIS VISIT - FXOpen Blog...Disclaimer: This article represents the opinion of the Companies operating under the FXOpen brand only (excluding FXOpen EU). It is not to be construed as an offer, solicitation, or recommendation with respect to products and services provided by the Companies operating under the FXOpen brand, nor is it to be considered financial advice. VIEW FULL ANALYSIS VISIT - FXOpen Blog...Disclaimer: This article represents the opinion of the Companies operating under the FXOpen brand only (excluding FXOpen EU). It is not to be construed as an offer, solicitation, or recommendation with respect to products and services provided by the Companies operating under the FXOpen brand, nor is it to be considered financial advice.
|
|
|
|
Is the UK really in a recession? Perhaps 2024 data will be different It's Monday morning, and a deluge of doom and gloom relating to a recession having begun in the United Kingdom is abound. Many mainstream news channels, along with analyses coming from a number of financial markets commentators, are outlining the potential contraction of the British economy should the central bank monetary policy remain hardline regarding interest rates. There is a school of thought which warns investors that if the Bank of England does not decide to reduce interest rates, the British economy would perhaps become less competitive, and language such as causing a worsening of an existing recession could take place. This is a very intriguing view, however, because the British Pound has been performing against other major currencies in a pattern that would suggest anything but a recession is even existent, let alone in full swing as is being touted by many reports. During the course of this year so far, the British Pound has been gaining value significantly against the Euro, with the EURGBP pair having hit 0.850 at the bottom of the market on February 14, according to FXOpen charts, a far cry from its 0.869 value on January 1. VIEW FULL ANALYSIS VISIT - FXOpen Blog...Disclaimer: This article represents the opinion of the Companies operating under the FXOpen brand only (excluding FXOpen EU). It is not to be construed as an offer, solicitation, or recommendation with respect to products and services provided by the Companies operating under the FXOpen brand, nor is it to be considered financial advice.
|
|
|
|
Watch FXOpen's 12 - 16 February Weekly Market Wrap VideoWeekly Market Wrap With Gary Thomson: US INFLATION, GBP/USD, GOLD, BITCOINGet the latest scoop on the week's hottest headlines, all in one convenient video. Join Gary Thomson, the COO of FXOpen UK, as he breaks down the most significant news reports and shares his expert insights..- News about US Inflation Shake Markets #Inflation
- GBP/USD Price Declining after Encouraging UK Inflation Data Release #GBPUSD
- Gold Price Takes Hit While Crude Oil Price Extends Rally #Gold #Oil #CrudeOil
- Bitcoin Price Exceeds Psychological Level of $50k #Bitcoin #BTC
Stay in the know and empower yourself with our short, yet power-packed video.Watch it now and stay updated with FXOpen.Don't miss out on this invaluable opportunity to sharpen your trading skills and make informed decisions. FXOpen YouTubeDisclaimer: This article represents the opinion of the Companies operating under the FXOpen brand only (excluding FXOpen EU). It is not to be construed as an offer, solicitation, or recommendation with respect to products and services provided by the Companies operating under the FXOpen brand, nor is it to be considered financial advice. FXOpen YouTubeDisclaimer: This article represents the opinion of the Companies operating under the FXOpen brand only (excluding FXOpen EU). It is not to be construed as an offer, solicitation, or recommendation with respect to products and services provided by the Companies operating under the FXOpen brand, nor is it to be considered financial advice. #fxopen #fxopenyoutube #fxopenuk #fxopenint #weeklyvideo
|
|
|
|
TSLA Share Price Rises Sharply amid News of Musk's Increased Stake in the Company According to media reports, Elon Musk has increased his stake in Tesla by more than one and a half times previously, the billionaire owned approximately 13% of the shares, now he owns 20.5% of Tesla. And earlier it was reported that Musk wants to increase his stake in Tesla to at least 25%. At the same time, the TSLA share price rose sharply in yesterday's trading by more than 6%, while the S&P 500 stock market index increased by only +0.6%. The TSLA stock chart today shows that: → the price has overcome the psychological mark of USD 200 per share; → the price has overcome the resistance level of USD 195 per share; → a bullish reversal pattern inverted head-and-shoulders has formed on the chart.  VIEW FULL ANALYSIS VISIT - FXOpen Blog...Disclaimer: This article represents the opinion of the Companies operating under the FXOpen brand only (excluding FXOpen EU). It is not to be construed as an offer, solicitation, or recommendation with respect to products and services provided by the Companies operating under the FXOpen brand, nor is it to be considered financial advice. VIEW FULL ANALYSIS VISIT - FXOpen Blog...Disclaimer: This article represents the opinion of the Companies operating under the FXOpen brand only (excluding FXOpen EU). It is not to be construed as an offer, solicitation, or recommendation with respect to products and services provided by the Companies operating under the FXOpen brand, nor is it to be considered financial advice.
|
|
|
|
Gold Price Recovers from Year Lows On Wednesday, the gold price XAU/USD set a year low due to news about inflation in the US, which does not want to decline to target levels. As a result, market participants are revising their estimates regarding the price of gold with the prospect that the Fed's tight policy may last for a longer time, as well as taking into account yesterday's news: → Retail Core Sales in the US fell by 0.6%, although an increase of +0.2% was expected, a month ago = +0.4%. → the number of unemployment applications for the week remains relatively stable: actual = 212k, a week ago = 218k, a month ago = 202k.  VIEW FULL ANALYSIS VISIT - FXOpen Blog...Disclaimer: This article represents the opinion of the Companies operating under the FXOpen brand only (excluding FXOpen EU). It is not to be construed as an offer, solicitation, or recommendation with respect to products and services provided by the Companies operating under the FXOpen brand, nor is it to be considered financial advice. VIEW FULL ANALYSIS VISIT - FXOpen Blog...Disclaimer: This article represents the opinion of the Companies operating under the FXOpen brand only (excluding FXOpen EU). It is not to be construed as an offer, solicitation, or recommendation with respect to products and services provided by the Companies operating under the FXOpen brand, nor is it to be considered financial advice.
|
|
|
|
Market Analysis: GBP/USD Attempts Recovery While EUR/GBP Gains Strength GBP/USD is attempting a fresh increase from the 1.2535 zone. EUR/GBP is gaining pace and might extend its rally above the 0.8570 zone.Important Takeaways for GBP/USD and EUR/GBP Analysis Today GBP/USD is attempting a fresh increase from the 1.2535 zone. EUR/GBP is gaining pace and might extend its rally above the 0.8570 zone.Important Takeaways for GBP/USD and EUR/GBP Analysis Today- The British Pound is attempting a recovery above the 1.2550 zone against the US Dollar.
- There is a key rising channel forming with support at 1.2570 on the hourly chart of GBP/USD at FXOpen.
- EUR/GBP started a fresh increase above the 0.8535 resistance zone.
- There is a major bullish trend line forming with support near 0.8550 on the hourly chart at FXOpen.
GBP/USD Technical Analysis On the hourly chart of GBP/USD at FXOpen, the pair started a fresh decline from the 1.2690 zone. The British Pound traded below the 1.2600 zone against the US Dollar. A low was formed near 1.2535 and the pair is now attempting a recovery wave. There was a break above the 23.6% Fib retracement level of the downward move from the 1.2690 swing high to the 1.2535 low. The pair settled above the 50-hour simple moving average and 1.2570. On the upside, the GBP/USD chart indicates that the pair is facing resistance near 1.2600 or the 50% Fib retracement level of the downward move from the 1.2690 swing high to the 1.2535 low. The next major resistance is near the 1.2650 level. If the RSI moves above 60 and the pair climbs above 1.2650, there could be another rally. In the stated case, the pair could rise toward the 1.2720 level or even 1.2750. On the downside, there is a major support forming near 1.2570 and a key rising channel. If there is a downside break below the 1.2570 support, the pair could accelerate lower. The next major support is near the 1.2535 zone, below which the pair could test 1.2500. Any more losses could lead the pair toward the 1.2450 support. VIEW FULL ANALYSIS VISIT - FXOpen Blog...Disclaimer: This article represents the opinion of the Companies operating under the FXOpen brand only (excluding FXOpen EU). It is not to be construed as an offer, solicitation, or recommendation with respect to products and services provided by the Companies operating under the FXOpen brand, nor is it to be considered financial advice.
|
|
|
|
GBPUSD Technical Analysis 15th FEB, 2024GBPUSD Resistance of Channel is Broken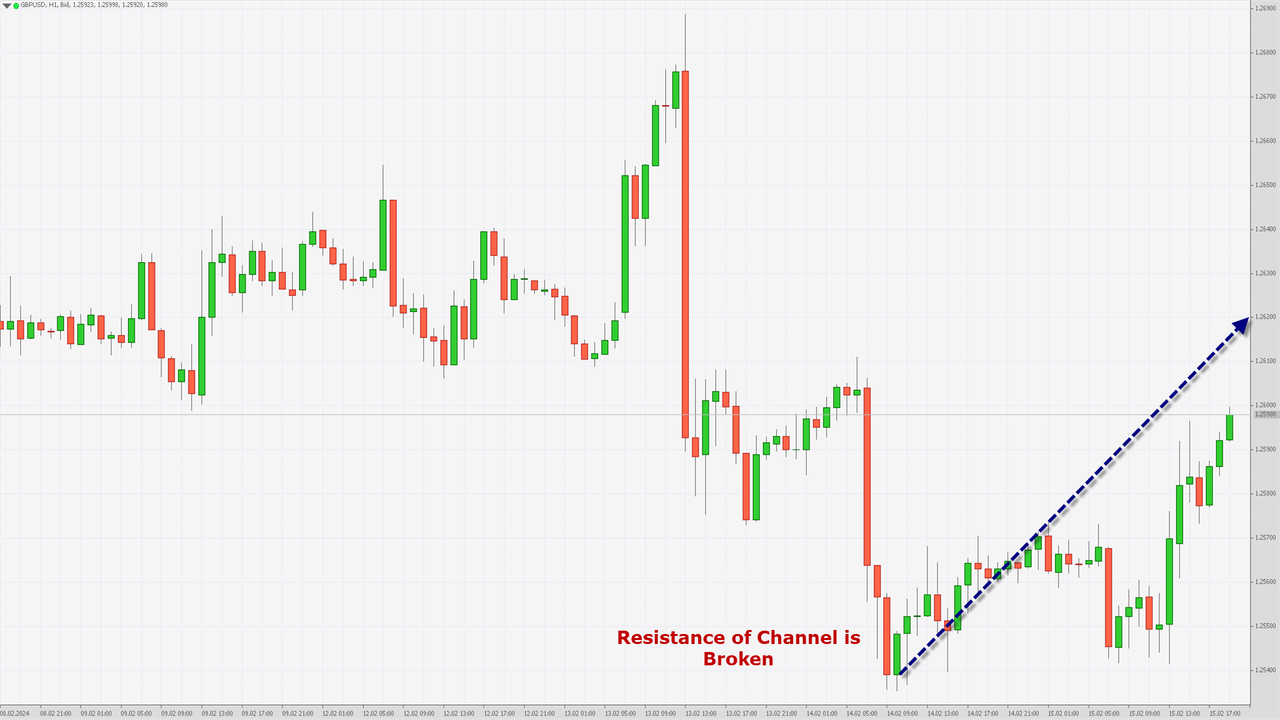 GBPUSD resumed its bullish trend today after touching a low of 1.2541 today in the Asian trading session. We can see a continuous recovery in its levels which broke the resistance barrier of 1.2594 which is a 14-3 Day Raw Stochastic at 30%. We can see that the resistance of the channel is broken in the 1-hourly timeframe. We can see Bullish price crossover with the Adaptive moving average AMA20 in the 2-hourly timeframe. The MACD crosses UP its moving average in the 4-hourly timeframe. We can see that the price of GBPUSD is ranging near support of channel and near support of triangle in the daily timeframe, which indicates a Bullish tone present in the markets. The prices are expected to enter into a consolidation phase after crossing the 1.2600 levels. GBPUSD is now trading below its both the 100-hour SMA and 200-hour SMA simple moving average. - Pound bullish continuation pattern seen above the 1.2540 mark.
- Short-term range appears to be Mild Bullish.
- GBPUSD continues to remain above the 1.2580 levels.
- Average true range ATR is indicating high market volatility.
GBPUSD is now trading above its Pivot levels of 1.2591 and is moving into a Mild Bullish Channel. The price of GBPUSD has already crossed its Classic resistance levels of 1.2587 and the next target is located at 1.2616 which is a 38.2% Retracement From 4 Week Low. Note: This Analytics is created by me and is based on my own personal Forex trading experience of 10 years. I am using my trading experience to help Experienced and Newbie traders and they should know about the risks of Forex trading.For in-depth analysis, please check FXOpen Blog
|
|
|
|
|

