Bitcoin responds positively as Brazil welcomes crypto payments Within Latin America, Brazil has for many years been a burgeoning economic force. It is a large nation with a diversified economy, ranging from manufacturing and engineering to banking and tertiary services and is part of the all-important BRICS (Brazil, India, China, South Africa) economic bloc. Like all other nations in South America, Brazil is a developing economy, but it has been rapidly developing and is far ahead of all of the other national economies in the continent. Today, Brazil's government has taken a very prominent step forward in announcing that the country's lawmakers have approved a bill which regulates Bitcoin and other cryptocurrencies as a payment instrument. Investors appear to have responded well to the news, as Bitcoin began to pump almost immediately, followed by a short squeeze and then it pumped again. Bitcoin is currently trading at $16,876.80, which is a 2.68% increase over yesterday's value. That may not sound very much on the face of it, but Bitcoin values have been very stagnant recently, so a 2.68% increase when viewed on the chart is quite significant. Private individuals and businesses have a lot to gain from the new ruling which allows cryptocurrency to be used as a method of payment, because South American economies for many decades now have been synonymous with rampant inflation, draconian capital control laws causing people to lose their money when it depreciates, and in many countries in South America, a deep-seated distrust in the local banking infrastruture or government policy. Around 10 years ago, neighboring Argentina ordered the liquidation of US Dollar bank accounts held in North America by Argentinian citizens, and that the US Dollars should be repatriated to Argentina and converted to Pesos. At the same time, capital controls were invoked so that nobody could transfer their Pesos out of the country without government permission. This meant that anyone who adhered to that rule would be at grave risk of substantial loss due to a terrible conversion rate and then having to store Pesos which are notorious for depreciating at the rate of an iron girder falling off a cliff. At that time, Bitcoin was in its absolute infancy, and still very much an unknown quantity. It had a tiny following of enthusiasts and 1 Bitcoin was worth something like $50, however a core group of Argentinian enthusiasts began to rally the cause of Bitcoin, largely because they saw it as an independent method of conducting their everyday life without the restrictions and inflationary chaos associated with Peso. Now, many years later, Bitcoin and many other cryptocurrencies are very established globally, and South America's largest economy is opening its doors to them. If this paves the way for greater acceptance across the South American continent, it could well be a boon for citizens as well as for the cryptocurrency market itself. VIEW FULL ANALYSIS VISIT - FXOpen Blog...Disclaimer: This forecast represents FXOpen Companies opinion only, it should not be construed as an offer, invitation or recommendation in respect to FXOpen Companies products and services or as financial advice.
|
|
|
|
BTCUSD and XRPUSD Technical Analysis 29th NOV 2022 BTCUSD: Bullish Engulfing Pattern Above $15510 BTCUSD: Bullish Engulfing Pattern Above $15510Bitcoin was unable to sustain its bearish momentum and after touching a low of 15510 on 21st Nov, the price started to correct upwards against the US dollar crossing the $16500 handle today in the European trading session. The price of bitcoin continues to rise after the recent crash and now we are looking to cross the $17000 handle soon. We can see the formation of bullish engulfing lines in the daily time frame. The CCI indicator is giving a bullish divergence signal in the daily time frame. We can clearly see a bullish engulfing pattern above the $15510 handle which is a bullish reversal pattern because it signifies the end of a downtrend and a shift towards an uptrend. Bitcoin touched an intraday low of 16124 in the Asian trading session and an intraday high of 16536 in the European trading session today. Both the STOCH and STOCHRSI are indicating overbought levels which means that in the immediate short term, a decline in the prices is expected. The relative strength index is at 63 indicating a STRONG demand for bitcoin, and the continuation of the buying pressure in the markets. Bitcoin is now moving above its 100 hourly simple moving average and 200 hourly exponential moving average. Most of the major technical indicators are giving a STRONG BUY signal, which means that in the immediate short term, we are expecting targets of 17000 and 17500. The average true range is indicating LESS market volatility with a strong bullish momentum. - Bitcoin: a bullish reversal seen above $15510
- The Williams percent range is indicating an overbought level
- The price is now trading above its pivot level of $16509
- All of the moving averages are giving a STRONG BUY market signal
Bitcoin: Bullish Reversal Seen Above $15510 We can now see that the price of Bitcoin is moving in a strong bullish momentum and we are expecting more upside waves this week. The Williams percent range indicator is back over -50 indicating a bullish scenario in the daily time frame. The MACD has crossed UP its moving average in the 4-hour time frame indicating bullish trends. We can see the formation of a bullish price crossover pattern with an adaptive moving average AMA100 in the 4-hour time frame. The price of bitcoin is ranging near the support of the channel in the 15-minute time frame indicating a bullish trend. The immediate short-term outlook for bitcoin is strongly bullish, the medium-term outlook has turned bullish, and the long-term outlook remains neutral under present market conditions. Bitcoins support zone is located at $16155 which is a 14-3 day raw stochastic at 20%. The price of BTCUSD is now facing its classic resistance level of 16536 and Fibonacci resistance level of 16550 after which the path towards 17000 will get cleared. In the last 24hrs, BTCUSD has increased by 1.92% by 310$, and has a 24hr trading volume of USD 26.099 billion. We can see an increase of 3.95% in the trading volume compared to yesterday, which appears to be normal. The Week AheadThe price of Bitcoin is expected to enter the super bullish zone above the $17000 handle. There is an ascending channel forming with current support at $15510 on the hourly chart of BTCUSD. We can see that the MACD indicator is back over zero in the 2-hour time frame indicating the bullish scenario present in the markets. The daily RSI is printing at 41 which indicates a weaker demand for bitcoin and the possibility of a shift towards the consolidation/correction phase for a short term in the markets. The price of BTCUSD is now facing its resistance zone at $17113 which is a 14-3 day raw stochastic at 50%. The weekly outlook is projected at $17500 with a consolidation zone of $17000. Technical Indicators:The moving averages convergence divergence, MACD (12,26): is at 48.30 indicating a BUY The commodity channel index, CCI (14): is at 93.27 indicating a BUY The rate of price change, ROC: is at 1.537 indicating a BUY The bull/bear power (13): is at 217.36 indicating a BUY VIEW FULL ANALYSIS VISIT - FXOpen Blog...Disclaimer: This forecast represents FXOpen Companies opinion only, it should not be construed as an offer, invitation or recommendation in respect to FXOpen Companies products and services or as financial advice.
|
|
|
|
Crypto lender's demise sends fears into digital markets The unsurprising fall out from the catastrophic and high profile demise of cryptocurrency exchange FTX has begun to make its presence felt. At the end of the working day in the United States, it became publicly known that BlockFi, a commercial lending company which was founded in 2017 to provide credit services to markets with limited access to simple financial products, had gone bankrupt. At one point in its five-year lifespan, BlockFi was valued at an astronomical $3 billion, however, like so many components of the modern economy, BlockFi has gone from startup to billion-dollar hyperbole, to ashes in just 5 years. BlockFi announced earlier this month that it had halted withdrawals, citing significant exposure to the FTX exchange in the immediate aftermath of its demise. What that really means is that BlockFi had borrowed money from FTX, and when FTX went to the wall, BlockFi's assets became the interest of receivers. This has represented yet another dark day for the digital asset sector, and this time has highlighted how it is not just cryptocurrency exchanges with unscrupulous owners that can collapse like a house of cards, but also others offering bona fide financial services such as lending, which can have their lives claimed because the board of directors put its faith in individuals such as Sam Bankman-Fried. The result of this news is that Bitcoin had dipped in value once again over night, but interestingly it is now rising in value as the European markets opened this morning. Bitcoin now stands at just a touch over $16,450, but certainly there has been some volatile movement this morning due to the 'sailing close to the wind' nature that BlockFi has demonstrated. It may well be easy to blame BlockFi's demise on its dealings with FTX, but actually BlockFi had already shown signs of financial strife before Mr Bankman-Fried headed for the hills with his customers' money. Back in the summer of this year, BlockFi ran into financial trouble and managed to secure a $250 million emergency funding from FTX. Because BlockFi owed FTX this sum, the receivers moved in on BlockFi when FTX went bankrupt. At that time, Mark Renzi of Berkley Research Group stated in a corporate announcement With the collapse of FTX, the BlockFi management team and board of directors immediately took action to protect clients and the Company. BlockFi revealed in its Chapter 11 petition that its three largest creditor claims are a $729 million indenture from Ankura Trust, a distressed loan administration company, a $275 million loan from West Realm Shires, the holding company for FTXs US subsidiary, as well as a $30 million settlement payment to the U.S. Securities and Exchange Commission. Big debts and a big bankruptcy. The question remains, is it a buyers market right now, or are the bears still out in force? VIEW FULL ANALYSIS VISIT - FXOpen Blog...Disclaimer: This forecast represents FXOpen Companies opinion only, it should not be construed as an offer, invitation or recommendation in respect to FXOpen Companies products and services or as financial advice.
|
|
|
|
Watch FXOpen's November 21 - 25 Weekly Market Wrap VideoIn this video, FXOpen UK COO Gary Thomson sums up the weeks happenings and discusses the most significant news reports.- Why is gold going up?
- NZD at 3-month highs
- COVID outbreak in China, oil finds support
- Bitcoin hits new year low amid rumors of another high-profile bankruptcy.
Watch our short and informative video, and stay updated with FXOpen. FXOpen YouTubeDisclaimer: CFDs are complex instruments and come with a high risk of losing your money. FXOpen YouTubeDisclaimer: CFDs are complex instruments and come with a high risk of losing your money.
|
|
|
|
ETHUSD and LTCUSD Technical Analysis 24th NOV, 2022 ETHUSD: Bullish Engulfing Pattern Above $1075 ETHUSD: Bullish Engulfing Pattern Above $1075Ethereum was unable to sustain its bullish momentum and after touching a high of 1230 on 20th Nov, the prices started to decline against the US dollar touching a low of 1078 on 22nd Nov. After this decline we can see some upwards correction in the levels of Ethereum towards the $1200 handle. We can see a three white soldiers pattern in the daily time frame indicating the Bullish trend. We can clearly see a bullish engulfing pattern above the $1075 handle which is a bullish pattern and signifies the end of a bearish phase and the start of a bullish phase in the markets. ETH is now trading just above its pivot levels of 1201 and moving into a strongly bullish channel. The price of ETHUSD is now testing its classic resistance level of 1205 and Fibonacci resistance level of 1211 after which the path towards 1250 will get cleared. The relative strength index is at 62 indicating a STRONG demand for Ether and the continuation of the buying pressure in the markets. The Williams percent range is back over -50 in the daily time frame indicating a bullish sentiment. The STOCHRSI is indicating an oversold level, which means that the prices are expected to correct upwards in the short-term range. Most of the technical indicators are giving a STRONG BUY market signal. Most of the moving averages are giving a BUY signal, and we are now looking at the levels of $1250 to $1300 in the short-term range. ETH is now trading below its 100 hourly simple and exponential moving averages. - Ether: bullish reversal seen above the $1075 mark
- The short-term range appears to be strongly bullish
- ETH continues to remain above the $1100 level
- The average true range is indicating LESS market volatility
Ether: Bullish Reversal Seen Above $1075 ETHUSD is now moving into a strongly bullish channel with the price trading above the $1100 handle in the European trading session today. ETH continues to correct higher against the US dollar and is expected to stay above the $1200 level. ETHUSD touched an intraday low of 1168 in the Asian trading session and an intraday high of 1217 in the European trading session today. We can see the formation of both the bullish harami and bullish harami cross pattern in the 1-hour time frame. The momentum indicator is back over zero in the 15-minute time frame. The resistance of the channel is broken in the 1-hour time frame indicating a bullish trend. The daily RSI is printing at 43 indicating a neutral demand for Ether in the long-term range. The key support levels to watch are $1185 at which price crosses the 9-day moving average, and $1195 which is a 14-3 day raw stochastic at 20%. ETH has increased by 3.00% with a price change of 35.00$ in the past 24hrs and has a trading volume of 11.226 billion USD. We can see a decrease of 7.02% in the total trading volume in the last 24 hrs which appears to be normal. The Week AheadETH price continues to remain in a strongly bullish zone against the US dollar and bitcoin. ETHUSD is expected to correct higher towards the $1200 and $1300 levels this week. We can see the formation of a major bullish trendline in place from $1075 towards $1234 level. The immediate short-term outlook for Ether has turned strongly bullish, the medium-term outlook has turned neutral, and the long-term outlook for Ether is neutral in present market conditions. The price of ETHUSD will need to remain above the important support levelsof $1144 which is a 3-10 day MACD oscillator stalls. The weekly outlook is projected at $1250 with a consolidation zone of $1200. Technical Indicators:The relative strength index (14): is at 62.17 indicating a BUY The rate of price change: is at 2.80 indicating a BUY Bull/bear power (13): is at 8.042 indicating a BUY High/lows (14): is at 3.72 indicating a BUY VIEW FULL ANALYSIS VISIT - FXOpen Blog...Disclaimer: CFDs are complex instruments and come with a high risk of losing your money.
|
|
|
|
TOP-20 most powerful currencies in the world According to the United Nations, 180 currencies are legal tender, but when asked what is the strongest currency in the world, what comes to mind? The US dollar, which is strengthening because of the Feds hawkish monetary policy stance in response to skyrocketing inflation. Or the euro, despite the International Monetary Fund predicting just 0.5% growth in the European economy in 2023 and warning that the worst is yet to come due to the war in Ukraine, record inflation, and the impact of the COVID-19 pandemic. Perhaps the British pound, despite the UKs challenging domestic picture? Youd be surprised to learn that there are currencies that outperform the trio. FXOpen has compiled a list of the world's top-20 currencies in the world as of 2022. Learn which is number one, and which are stronger than USD, EUR, and GBP despite the latters title of the most famous, most traded, and most widely spread currencies of the world. Trading currencies involves simultaneously buying one currency and selling another, which is known as currency comparison. In the following list, all currencies are quoted against one US dollar. VIEW FULL ANALYSIS VISIT - FXOpen Blog...Disclaimer: CFDs are complex instruments and come with a high risk of losing your money.
|
|
|
|
BTCUSD and XRPUSD Technical Analysis 22nd NOV 2022 BTCUSD: Shooting Star Pattern Below $17110 BTCUSD: Shooting Star Pattern Below $17110Bitcoin was unable to sustain its bullish momentum and after touching a high of 17110 on 15th Nov, the prices started to decline against the US dollar touching a low of 15509 on 21st Nov. The global demand for bitcoin continues to remain weak, and the prices are expected to break below the $15000 handle soon. We can see the formation of bearish engulfing lines in the weekly time frame. The RSI indicator is under 30 in the 4-hour time frame indicating the neutral signal and oversold markets. We can clearly see a shooting star pattern below the $17110 handle which is a bearish reversal pattern because it signifies the end of an uptrend and a shift towards a downtrend. Bitcoin touched an intraday low of 15524 and an intraday high of 15948 in the Asian trading session today. Both the STOCH and STOCHRSI are indicating overbought levels which means that in the immediate short term, a decline in the prices is expected. The relative strength index is at 36 indicating a WEAK demand for bitcoin, and the continuation of the selling pressure in the markets. Bitcoin is now moving below its 100 hourly simple moving average and below its 200 hourly exponential moving averages. Most of the major technical indicators are giving a STRONG SELL signal, which means that in the immediate short term, we are expecting targets of 15500 and 15000. The average true range is indicating LESS market volatility with a mildly bearish momentum. - Bitcoin: bearish reversal seen below $17110
- The Williams percent range is indicating an overbought levels
- The price is now trading just above its pivot level of $15718
- All of the moving averages are giving a STRONG SELL market signal
Bitcoin: Bearish Reversal Seen Below $17110 We can now see that the price of bitcoin is moving in a mildly bearish momentum and we are expecting more downside waves in this week. We can see that the support of the channel is broken in the daily time frame indicating bearish trends. The price of bitcoin is ranging near a new record low of 1 month and 1 years time frame. There is a descending channel forming which is expected to break the current support levels of bitcoin at $15716. The immediate short-term outlook for bitcoin is strongly bearish, the medium-term outlook has turned bearish, and the long-term outlook remains neutral under present market conditions. Bitcoins support zone is located at $15516 which is a 1-month and 1-years low point. The price of BTCUSD is now facing its classic support level of 15583 and Fibonacci support level of 15682 after which the path towards 15500 will get cleared. In the last 24hrs BTCUSD has decreased by 2.09% by 334$ and has a 24hr trading volume of USD 33.191 billion. We can see an increase of 12.91% in the trading volume compared to yesterday, which appears to be normal. The Week AheadThe price of bitcoin is moving near the 1-year low and has already broken the support levels of $15980 which is the last pivot point. We can see a bearish trend reversal signal with the moving average MA50 in the 15-minute time frame. The daily RSI is printing at 31 which indicates a weaker demand for bitcoin and the continuation of the selling pressure in the markets. The price of BTCUSD will need to remain above the important support level of $14688 which is a 310-day MACD oscillator stalls. The weekly outlook is projected at $15500 with a consolidation zone of $15000. The Collapse of FTXThe cryptocurrency exchange FTX, valued at $26.5 billion last year, collapsed, which sent ripples through the crypto market and became the primary driving force for Bitcoin which is near the record lows of its 1 year. FTX faced a liquidity crisis, and in the hours following, experienced a possible hack in which hundreds of millions worth of tokens were stolen. FTX filed for bankruptcy on Nov. 11, 2022. The future of FTX as a cryptocurrency exchange is in serious jeopardy. As of mid-November 2022, withdrawals are disabled and a notice on the FTX website says the company strongly advises against depositing. Technical Indicators:The moving averages convergence divergence, MACD (12,26): is at -116.00 indicating a SELL The commodity channel index, CCI (14): is at -75.95 indicating a SELL The rate of price change, ROC: is at -0.140 indicating a SELL Bull/Bear power (13): is at -141.77 indicating a SELL VIEW FULL ANALYSIS VISIT - FXOpen Blog...Disclaimer: CFDs are complex instruments and come with a high risk of losing your money.
|
|
|
|
Watch FXOpen's November 14 - 18 Weekly Market Wrap VideoIn this video, FXOpen UK COO Gary Thomson sums up the weeks happenings and discusses the most significant news reports.- How will Rishi Sunak affect the pound?
- US may avoid recession whereas Europe may plunge deeper
- EUR/USD rallies while USD/JPY takes a major hit
- GBPUSD reaches 1.20, what's next?
- Inflation in the UK hits high at 11.1% as US inflation goes down.
Watch our short and informative video, and stay updated with FXOpen. FXOpen YouTubeDisclaimer: CFDs are complex instruments and come with a high risk of losing your money. FXOpen YouTubeDisclaimer: CFDs are complex instruments and come with a high risk of losing your money.
|
|
|
|
ETHUSD and LTCUSD Technical Analysis 17th NOV, 2022 ETHUSD: Bearish Engulfing Pattern Below $1349 ETHUSD: Bearish Engulfing Pattern Below $1349Ethereum was unable to sustain its bullish momentum and after touching a high of 1349 on 10th Nov, the prices started to decline against the US dollar touching a low of 1171 on 14th Nov. After this decline, we can see some upwards correction in the levels of Ethereum above the $1200 handle. We have seen a bearish opening of the markets this week. We can clearly see a bearish engulfing pattern below the $1349 handle which is a bearish pattern and signifies the end of a bullish phase and the start of a bearish phase in the markets. ETH is now trading just below its pivot levels of 1204 and moving into a mildly bearish channel. The price of ETHUSD is now testing its classic support level of 1188 and Fibonacci resistance level of 1198 after which the path towards 1100 will get cleared. The relative strength index is at 40 indicating a WEAK demand for Ether and the continuation of the selling pressure in the markets. The prices are ranging near the horizontal resistance in the weekly time frame, indicating a bearish trend. Both the STOCHRSI and Williams percent range are indicating oversold levels. All of the technical indicators are giving a STRONG SELL market signal. Most of the moving averages are giving a STRONG SELL signal and we are now looking at the levels of $1150 to $1100 in the short-term range. ETH is now trading below both the 100 & 200 hourly simple and exponential moving averages. - Ether: bearish reversal seen below the $1349 mark
- Short-term range appears to be mildly bearish
- ETH continues to remain below the $1300 level
- The average true range is indicating LESS market volatility
Ether: Bearish Reversal Seen Below $1349 ETHUSD is now moving in a mildly bearish channel with the prices trading below the $1300 handle in the European trading session today. ETH continues to remain under pressure this month and fresh downsides are expected below the $1100 handle. ETHUSD touched an intraday high of 1227 and an intraday low of 1193 in the Asian trading session today. We can see a bullish price crossover pattern with moving averages MA50 and MA100 in the 1-hour time frame. We can also see the formation of a black evening star pattern in the 15-minute time frame. The daily RSI is printing at 38 indicating a very weak demand for Ether in the long-term range. The key support level to watch is $1186 which is the last resistance level, and $1195 which is a 14-3 day raw stochastic at 20% ETH has decreased by 3.15% with a price change of 38.81$ in the past 24hrs and has a trading volume of 11.524 billion USD. We can see an increase of 1.46% in the total trading volume in the last 24 hrs which appears to be normal. The Week AheadETH price continues to remain in a bearish zone against the US dollar and bitcoin. ETHUSD is expected to move lower towards the $1100 and $11150 levels this week. We can see the formation of a major bearish trend line in place from $1349 towards $1119 levels. The immediate short-term outlook for Ether has turned mildly bearish, the medium-term outlook has turned neutral, and the long-term outlook for Ether is neutral in present market conditions. The prices of ETHUSD will need to remain above the important support levels of $1094 which is the 3rd support pivot point. The weekly outlook is projected at $1150 with a consolidation zone of $1100. Technical Indicators:The relative strength index (14): is at 37.20 indicating a SELL The rate of price change: is at -1.23 indicating a SELL Bull/Bear power (13): is at -14.17 indicating a SELL High/lows (14): is at -7.94 indicating a SELL VIEW FULL ANALYSIS VISIT - FXOpen Blog...Disclaimer: CFDs are complex instruments and come with a high risk of losing your money.
|
|
|
|
BTCUSD and XRPUSD Technical Analysis 15th NOV 2022 BTCUSD: Double Bottom Pattern Above $15590 BTCUSD: Double Bottom Pattern Above $15590Bitcoin was unable to sustain its bullish momentum and after touching a high of 20877 on 07th Nov, the prices started to decline against the US dollar touching a low of 15622 on 10th Nov. After this decline we can see some correction in the price of bitcoin which is now trading above the 16500 in the European Trading session today. We can see the formation of a bullish harami pattern in both the 30-minute and weekly time frames. The RSI indicator is back over 50 indicating the bullish scenario present in the markets. We can clearly see a double bottom pattern above the $15590 handle which is a bullish reversal pattern because it signifies the end of a downtrend and a shift towards an uptrend. Bitcoin touched an intraday low of 16364 in the Asian trading session and an intraday high of 16968 in the European trading session today. Both the STOCH and STOCHRSI are indicating overbought levels which means that in the immediate short term, a decline in the prices is expected. The relative strength index is at 58 indicating a STRONG demand for bitcoin, and the continuation of the buying pressure in the markets. Bitcoin is now moving above its 100 hourly exponential moving average and below its 200 hourly exponential moving averages. Most of the major technical indicators are giving a STRONG BUY signal, which means that in the immediate short term, we are expecting targets of 17000 and 18500. The average true range is indicating LESS market volatility with a mildly bullish momentum. - Bitcoin: bullish reversal seen above $15590
- The Williams percent range is indicating an overbought level
- The price is now trading just below its pivot level of $16924
- Most of the moving averages are giving a BUY market signal
Bitcoin: Bullish Reversal Seen Above $15590 We can now see that the price of bitcoin is moving in a mildly bullish momentum and we are expecting more correction waves in this week. We can see the formation of a three white soldiers pattern in the 4-hour time frame. We can see a bullish trend reversal signal with adaptive moving average AMA50 in the 2-hourly time frame. The price of bitcoin is now moving in an up-channel formation above the $16000 handle. Some of the technical indicators are also giving a neutral stance of the markets. The immediate short-term outlook for bitcoin is strongly bullish,the medium-term outlook has turned bullish, and the long-term outlook remains neutral under present market conditions. Bitcoins support zone is located at $16447 which is a pivot point, and $16783 which is a 14-3 day raw stochastic at 20%. The price of BTCUSD is now facing its classic resistance level of 17015 and Fibonacci resistance level of 17090 after which the path towards 21500 will get cleared. In the last 24hrs, BTCUSD has increased by 0.36% by 59$ and has a 24hr trading volume of USD 41.390 billion. We can see an increase of 5.45% in the trading volume compared to yesterday, which appears to be normal. The Week AheadThe price of Bitcoin is moving in an ascending channel forming with support at $15850 on the hourly chart of the BTCUSD. Both the MACD and RSI are now giving bullish divergence signals on the weekly time frame. Now we are aiming for $17849 which is a 38.2% retracement from a 4-week low. The daily RSI is printing at 36 which indicates a weaker demand for bitcoin and a shift towards the consolidation/correction phase in the markets. The prices of BTCUSD will need to remain above the important support levels of $16000 this week. The weekly outlook is projected at $18500 with a consolidation zone of $18000. Technical Indicators:The moving averages convergence divergence, MACD (12,26): is at 90.80 indicating a BUY The commodity channel index, CCI (14): is at 72.52 indicating a BUY The rate of price change, ROC: is at 3.18 indicating a BUY The bull/bear power (13): is at 201.98 indicating a BUY VIEW FULL ANALYSIS VISIT - FXOpen Blog...Disclaimer: CFDs are complex instruments and come with a high risk of losing your money.
|
|
|
|
GBP/USD Climbs Higher, EUR/GBP Eyes Upside Break GBP/USD started a recovery wave and climbed above the 1.1750 resistance. EUR/GBP is trading above the 0.8700 support and might eye a fresh increase.Important Takeaways for GBP/USD and EUR/GBP GBP/USD started a recovery wave and climbed above the 1.1750 resistance. EUR/GBP is trading above the 0.8700 support and might eye a fresh increase.Important Takeaways for GBP/USD and EUR/GBP- The British Pound started a fresh increase after it broke the 1.1550 resistance against the US Dollar.
- There is a key bullish trend line forming with support near 1.1780 on the hourly chart of GBP/USD.
- EUR/GBP started a decent increase and remained well bid above the 0.8700 support.
- There is a major bearish trend line forming with resistance near 0.8765 on the hourly chart.
GBP/USD Technical AnalysisThe British Pound found support near the 1.1350 zone against the US Dollar. The GBP/USD pair started a recovery wave and was able to clear the 1.1550 resistance zone. There was a decent increase above the 1.1650 level and the 50 hourly simple moving average. The pair even climbed above the 1.1750 level. A high was formed near 1.1852 on FXOpen and the pair is now consolidating gains. GBP/USD Hourly Chart On the downside, an initial support is near the 1.1780 level. There is also a key bullish trend line forming with support near 1.1780 on the hourly chart of GBP/USD, below which it could test the 23.6% Fib retracement level of the upward move from the 1.1334 swing low to 1.1852 high. The next major support is near the 1.1650 level and the 50 hourly simple moving average. Any more losses could lead the pair towards the 1.1600 support zone or the 50% Fib retracement level of the upward move from the 1.1334 swing low to 1.1852 high. On the upside, an initial resistance is near the 1.1820 level. The next main resistance is near the 1.1850 zone. A clear upside break above the 1.1820 and 1.1850 resistance levels could open the doors for a steady increase in the near term. The next major resistance sits near the 1.2000 level. VIEW FULL ANALYSIS VISIT - FXOpen Blog...Disclaimer: CFDs are complex instruments and come with a high risk of losing your money.
|
|
|
|
Watch FXOpen's November 7 - 11 Weekly Market Wrap VideoIn this video, FXOpen UK COO Gary Thomson sums up the weeks happenings and discusses the most significant news reports.- FTX crash overshadows inflation news
- Bearish reversal in the oil market?
- EUR/USD aiming at more upsides
- Big tech stocks in focus
Watch our short and informative video, and stay updated with FXOpen. FXOpen YouTubeDisclaimer: CFDs are complex instruments and come with a high risk of losing your money. FXOpen YouTubeDisclaimer: CFDs are complex instruments and come with a high risk of losing your money.
|
|
|
|
ETHUSD and LTCUSD Technical Analysis 10th NOV, 2022 ETHUSD: Hammer Pattern Above $1072 ETHUSD: Hammer Pattern Above $1072Ethereum was unable to sustain its bullish momentum, and after touching a high of 1654 on 05th Nov, the price started to decline against the US dollar touching a low of 1079 on 10th Nov, 2022. Today we can see some upwards correction in the price of Ethereum which has touched $1200 handle in the European trading session. We have seen a bullish opening of the markets this week. We can clearly see a hammer pattern above the $1072 handle which is a bullish pattern and signifies the end of a bearish phase and the start of a bullish phase in the markets. ETH is now trading just below its pivot level of 1203 and moving into a mildly bullish channel. The price of ETHUSD is now testing its classic resistance level of 1230 and Fibonacci resistance level of 1246 after which the path towards 1300 will get cleared. The relative strength index is at 47 indicating a neutral market and a shift towards the correction and consolidation phase in the markets. We can see that the price is back over the pivot point indicating a bullish scenario in the daily time frame. The STOCHRSI is indicating an overbought market, which means that the prices are expected to decline in the short-term range. Most of the technical indicators are giving a BUY market signal. Some of the moving averages are giving a BUY signal and we are now looking at the levels of $1350 to $1400 in the short-term range. ETH is now trading below both the 100 & 200 hourly simple and exponential moving averages. - Ether: bullish reversal seen above the $1072 mark
- Short-term range appears to be mildly bullish
- ETH continues to remain above the $1100 level
- The average true range is indicating LESS market volatility
Ether: Bullish Reversal Seen Above $1072 ETHUSD is now moving into a mildly bullish channel with the price trading above the $1150 handle in the European trading session today. ETH touched an intraday low of 1127 in the Asian trading session and an intraday high of 1217 in the European trading session today. We can see a bullish trend reversal signal with moving average MA50 in the 15-minute time frame. Some of the technical indicators still continue to give bearish signals including the rate of price change. The price of Ethereum is marching towards a nullish zone against the US dollar and bitcoin. ETHUSD could continue to move higher back towards the $1400 level. The daily RSI is printing at 36 indicating a very weak demand for Ether in the long-term range. The key support levels to watch are $1077 which is a 1-month low, and 1184 which is a pivot point. ETH has increased by 1.79% with a price change of 20.91$ in the past 24hrs and has a trading volume of 36.854 billion USD. We can see a decrease of 13.76% in the total trading volume in the last 24 hrs which appears to be normal. The Week AheadThe price of ETH continues to remain in a bullish zone against the US dollar and bitcoin. ETHUSD is expected to move higher towards the $1300 and $1400 levels this week. On the upside, we are now looking at the immediate targets of 1303 which is a 38.2% retracement from a 4-week low, and 1372 which is a 50% retracement from 4-week high/low. The immediate short-term outlook for Ether has turned mildly bullish, the medium-term outlook has turned neutral, and the long-term outlook for Ether is neutral in present market conditions. The price of ETHUSD will need to remain above the important support levels of $1188 which is the last support point. The weekly outlook is projected at $1450 with a consolidation zone of $1350. Technical Indicators:The average directional index ADX (14): is at 37.20 indicating a BUY The rate of price change: is at 3.057 indicating a BUY The bull/bear power (13): is at 37.90 indicating a BUY High/lows (14): is at 25.17 indicating a BUY VIEW FULL ANALYSIS VISIT - FXOpen Blog...Disclaimer: CFDs are complex instruments and come with a high risk of losing your money.
|
|
|
|
BTCUSD and XRPUSD Technical Analysis 08th NOV 2022 BTCUSD: Shooting Star Pattern Below $21470 BTCUSD: Shooting Star Pattern Below $21470Bitcoin was unable to sustain its bullish momentum and after touching a high of 21470 on 05th Nov, the price started to correct lower against the US dollar and is now trading below the $20000 handle in the European trading session. We can see that the price is declining due to heavy selling pressure seen across the global crypto markets, and the price of bitcoin is expected to break below the $19000 handle this week. We have seen a bearish opening of the markets this week. We can see the formation of bearish engulfing lines in the 1-hour time frame. The price of bitcoin is below the pivot point and camarilla S3 support level, indicating the bearish trends present in the market. We can clearly see a shooting star pattern below the $21470 handle which is a bearish reversal pattern because it signifies the end of an uptrend and a shift towards a downtrend. Bitcoin touched an intraday high of 20666 and an intraday low of 19413 in the Asian trading session today. Both the STOCH and Williams percent range are indicating overbought levels which means that in the immediate short term, a decline in the prices is expected. The relative strength index is at 27 indicating a VERY WEAK demand for bitcoin, and the continuation of selling pressure in the markets. Bitcoin is now moving below its 100 hourly exponential moving average and above its 200 hourly exponential moving average. Most of the major technical indicators are giving a STRONG SELL signal, which means that in the immediate short term, we are expecting targets of 19000 and 18500. The average true range is indicating HIGH market volatility with a strong bearish momentum. - Bitcoin: bearish reversal seen below $21470
- The STOCHRSI range is indicating an oversold level
- The price is now trading below its pivot level of $19818
- Most of the moving averages are giving a STRONG SELL market signal
Bitcoin: Bearish Reversal Seen Below $21470 We can now see that the price of bitcoin failed to clear the $22000 handle and is now moving towards the $19000 level. The MACD has crossed down its moving average in the daily time frame indicating a bearish trend. The parabolic SAR indicator is giving a bearish reversal signal in the daily time frame. We can see the formation of a bearish price crossover pattern with adaptive moving average AMA20 and AMA50 in the daily time frame. We have also seen a black evening star in the weekly time frame. The immediate short-term outlook for bitcoin is strongly bearish, the medium-term outlook has turned bearish, and the long-term outlook remains neutral under present market conditions. Bitcoins support zone is located at $19475 which is a 38.2% retracement from a 4 week low, and the price needs to remain above these levels for any potential bullish reversal in the markets. The price of BTCUSD is now facing its classic support level of 19646 and Fibonacci resistance level of 19700 after which the path towards 19000 will get cleared. In the last 24hrs, BTCUSD has decreased by 4.68% by 970$ and has a 24hr trading volume of USD 66.898 billion. We can see an increase of 51.65% in the trading volume compared to yesterday, which is due to the heavy selling pressure seen in the global markets. The Week AheadThe price of Bitcoin is moving in a strongly bearish zone below the $20000 level. Further downsides are projected at $19000 and $18500 as the immediate targets. Now we are aiming for $19385which is an 18-day moving average. The daily RSI is printing at 45 which indicates a neutral demand for bitcoin and a shift towards the consolidation phase in the markets. The price of BTCUSD has already crossed below $19855 which is a 50% retracement from a 4-week high/low. The weekly outlook is projected at $19000 with a consolidation zone of $19250. Technical Indicators:The moving averages convergence divergence MACD (12, 26): is at -303.10 indicating a SELL The commodity channel index CCI (14): is at -107.49 indicating a SELL The rate of price change ROC: is at -4.53 indicating a SELL The bull/bear power (13): is at -775.38 indicating a SELL VIEW FULL ANALYSIS VISIT - FXOpen Blog...Disclaimer: CFDs are complex instruments and come with a high risk of losing your money.
|
|
|
|
BTCUSD and XRPUSD Technical Analysis 08th NOV 2022BTCUSD: Shooting Star Pattern Below $21470Bitcoin was unable to sustain its bullish momentum and after touching a high of 21470 on 05th Nov, the price started to correct lower against the US dollar and is now trading below the $20000 handle in the European trading session. We can see that the price is declining due to heavy selling pressure seen across the global crypto markets, and the price of bitcoin is expected to break below the $19000 handle this week. We have seen a bearish opening of the markets this week. We can see the formation of bearish engulfing lines in the 1-hour time frame. The price of bitcoin is below the pivot point and camarilla S3 support level, indicating the bearish trends present in the market. We can clearly see a shooting star pattern below the $21470 handle which is a bearish reversal pattern because it signifies the end of an uptrend and a shift towards a downtrend. Bitcoin touched an intraday high of 20666 and an intraday low of 19413 in the Asian trading session today. Both the STOCH and Williams percent range are indicating overbought levels which means that in the immediate short term, a decline in the prices is expected. The relative strength index is at 27 indicating a VERY WEAK demand for bitcoin, and the continuation of selling pressure in the markets. Bitcoin is now moving below its 100 hourly exponential moving average and above its 200 hourly exponential moving average. Most of the major technical indicators are giving a STRONG SELL signal, which means that in the immediate short term, we are expecting targets of 19000 and 18500. The average true range is indicating HIGH market volatility with a strong bearish momentum. - Bitcoin: bearish reversal seen below $21470
- The STOCHRSI range is indicating an oversold level
- The price is now trading below its pivot level of $19818
- Most of the moving averages are giving a STRONG SELL market signal
Bitcoin: Bearish Reversal Seen Below $21470We can now see that the price of bitcoin failed to clear the $22000 handle and is now moving towards the $19000 level. The MACD has crossed down its moving average in the daily time frame indicating a bearish trend. The parabolic SAR indicator is giving a bearish reversal signal in the daily time frame. We can see the formation of a bearish price crossover pattern with adaptive moving average AMA20 and AMA50 in the daily time frame. We have also seen a black evening star in the weekly time frame. The immediate short-term outlook for bitcoin is strongly bearish, the medium-term outlook has turned bearish, and the long-term outlook remains neutral under present market conditions. Bitcoins support zone is located at $19475 which is a 38.2% retracement from a 4 week low, and the price needs to remain above these levels for any potential bullish reversal in the markets. The price of BTCUSD is now facing its classic support level of 19646 and Fibonacci resistance level of 19700 after which the path towards 19000 will get cleared. In the last 24hrs, BTCUSD has decreased by 4.68% by 970$ and has a 24hr trading volume of USD 66.898 billion. We can see an increase of 51.65% in the trading volume compared to yesterday, which is due to the heavy selling pressure seen in the global markets. The Week AheadThe price of Bitcoin is moving in a strongly bearish zone below the $20000 level. Further downsides are projected at $19000 and $18500 as the immediate targets. Now we are aiming for $19385which is an 18-day moving average. The daily RSI is printing at 45 which indicates a neutral demand for bitcoin and a shift towards the consolidation phase in the markets. The price of BTCUSD has already crossed below $19855 which is a 50% retracement from a 4-week high/low. The weekly outlook is projected at $19000 with a consolidation zone of $19250. Technical Indicators:The moving averages convergence divergence MACD (12, 26): is at -303.10 indicating a SELL The commodity channel index CCI (14): is at -107.49 indicating a SELL The rate of price change ROC: is at -4.53 indicating a SELL The bull/bear power (13): is at -775.38 indicating a SELL VIEW FULL ANALYSIS VISIT - FXOpen Blog...Disclaimer: CFDs are complex instruments and come with a high risk of losing your money.
|
|
|
|
Watch FXOpen's October 31 - November 4 Weekly Market Wrap VideoIn this video, FXOpen UK COO Gary Thomson sums up the weeks happenings and discusses the most significant news reports.- FTSE 100 rockets as oil giant reaps the profits
- The Fed shook the market. What's next?
- UK Interest Rate announcement
- Will the Oil price rise?
Watch our short and informative video, and stay updated with FXOpen. FXOpen YouTubeDisclaimer: CFDs are complex instruments and come with a high risk of losing your money. FXOpen YouTubeDisclaimer: CFDs are complex instruments and come with a high risk of losing your money.
|
|
|
|
ETHUSD and LTCUSD Technical Analysis 03rd NOV, 2022 ETHUSD: Bullish Engulfing Pattern Above $1483 ETHUSD: Bullish Engulfing Pattern Above $1483Ethereum was unable to sustain its bearish momentum and after touching a low of 1488 on 28th Oct, the prices started to correct upwards against the US dollar. The prices of Ethereum touched a high of 1642 on 29th Oct after which we can see a shift towards the consolidation phase in the markets. We can see that the MACD indicator is giving a bullish divergence signal in the 4-hour time frame We can clearly see a bullish engulfing pattern above the $1483 handle which is a bullish pattern and signifies the end of a bearish phase and the start of a bullish phase in the markets. ETH is now trading just above its pivot level of 1544 and is moving into a mildly bullish channel. The price of ETHUSD is now testing its classic resistance levels of 1548 and Fibonacci resistance level of 1552 after which the path towards 1600 will get cleared. The relative strength index is at 48 indicating a neutral market and the shift towards a correction and consolidation phase in the markets. We can see that the commodity channel index is giving a neutral signal which indicates a range bound movement for some time in the markets. The STOCHRSI is indicating an overbought market, which means that the prices are expected to decline in the short-term range. Some of the technical indicators are giving a BUY market signal. Some of the moving averages are giving a BUY signal and we are now looking at the levels of $1650 to $1700 in the short-term range. ETH is now trading below both its 100 & 200 hourly simple and exponential moving averages. - Ether: bullish reversal seen above the $1483 mark
- The short-term range appears to be mildly bullish
- ETH continues to remain above the $1500 levels
- The average true range is indicating LESS market volatility
Ether: Bullish Reversal Seen Above $1254 ETHUSD is now moving into a mildly bullish channel with the prices trading above the $1500 handle in the European trading session today. ETH touched an intraday low of 1502 in the Asian trading session and an intraday low of 1558 in the European trading session today. The RSI indicator is back over 50 indicating a bullish scenario. We can see a bullish price crossover pattern with moving averages MA20 and MA100. We can also see the formation of a bullish harami pattern in both the 2-hour and 4-hour time frames. The MA20 is also indicating a bullish trend reversal signal in the weekly timeframe. The daily RSI is printing at 60 indicating a strong demand for Ether in the long-term range. The key support level to watch is $1427 which is a 50% retracement from a 4-week high/low and 1482 which is a 38.2% retracement from 4 week high/low. ETH has decreased by 0.70% with a price change of 11.14$ in the past 24hrs and has a trading volume of 22.835 billion USD. We can see an increase of 53.42% in the total trading volume in the last 24 hrs which is due to the continued buying seen at lower levels. The Week AheadETH price continues to remain in a bullish zone against the US dollar and bitcoin. ETHUSD is expected to move higher towards the $1600 and $1700 levels this week. We can see the formation of a major bullish trendline in place from $1483 towards $1640 level. The immediate short-term outlook for Ether has turned mildly bullish, the medium-term outlook has turned neutral, and the long-term outlook for Ether is neutral at present market conditions. The prices of ETHUSD will need to remain above the important support level of $1513 which is a 38.2% retracement from 13-week low. Weekly outlook is projected at $1750 with a consolidation zone of $1650. Technical Indicators:The STOCH (9,6): is at 77.85 indicating a BUY. The rate of price change: is at 0.983 indicating a BUY. The bull/bear power (13): is at 4.55 indicating a BUY. High/lows(14): is at 9.01 indicating a BUY. VIEW FULL ANALYSIS VISIT - FXOpen Blog...Disclaimer: CFDs are complex instruments and come with a high risk of losing your money.
|
|
|
|
BTCUSD and XRPUSD Technical Analysis 01st NOV 2022 BTCUSD: Inverted Hammer Pattern Above $19187 BTCUSD: Inverted Hammer Pattern Above $19187Bitcoin was unable to sustain its bearish momentum and after touching a low of 19187 on 24th Oct, the prices started to correct upwards crossing the $20500 handle. We can see continued appreciation in the price of BTCUSD which is now trading above the 20500 in the European trading session today. We can see the formation of a bullish harami pattern in the 30-minute time frame. The resistance of the channel is broken in the 1-hourly time frame indicating the bullish tone of the markets. We can clearly see an inverted hammer pattern above the $19187 handle which is a bullish reversal pattern because it signifies the end of a downtrend and a shift towards an uptrend. Bitcoin touched an intraday low of 20379 in the Asian trading session and an intraday high of 20657 in the European trading session today. Both the STOCH and STOCHRSI are indicating overbought levels which means that in the immediate short term, a decline in the price is expected. The relative strength index is at 53 indicating a NEUTRAL demand for bitcoin and a shift towards the consolidation phase in the markets. Bitcoin is now moving above its 100 hourly exponential moving average and above its 200 hourly exponential moving averages. Most of the major technical indicators are giving a STRONG BUY signal, which means that in the immediate short term, we are expecting targets of 21000 and 21500. The average true range is indicating LESS market volatility with a mildly bullish momentum. - Bitcoin: bullish reversal seen above $19187.
- The Williams percent range is indicating an overbought level.
- The price is now trading just below its pivot level of $20607.
- Most of the moving averages are giving a STRONG BUY market signal.
Bitcoin: Bullish Reversal Seen Above $19187 We can now see that the price of bitcoin rocketed higher recently towards the monthly high of 20969 on 29th Oct, and we can now witness the formation of an ascending channel in the markets. Bitcoins price is super bullish against the US dollar and bitcoin and now we are aiming towards crossing the $21000 and $22000 levels soon. The adaptive moving average AMA20 and AMA50 are giving a bullish trend reversal signal. The price of bitcoin is back over the pivot point in the daily time frame indicating the bullish overtone present in the markets. We have also seen a bullish opening of the markets this week. The immediate short-term outlook for bitcoin is strongly bullish, the medium-term outlook has turned bullish, and the long-term outlook remains neutral under present market conditions. Bitcoins support zone is located at $19637 which is a 50% retracement from a 4-week high/low and the price needs to remain above this level for the continuation of the bullish reversal in the markets. The price of BTCUSD is now facing its classic resistance level of 20628 and Fibonacci resistance level of 20667 after which the path towards 21500 will get cleared. In the last 24hrs, BTCUSD has increased by 0.25% by 51$ and has a 24hr trading volume of USD 45.266 billion. We can see an increase of 39.05% in the trading volume compared to yesterday, which is due to the heavy buying pressure seen in the global markets. The Week AheadThe price of bitcoin is moving in a strongly bullish zone above the $20500 levels. Further upsides are projected at $21500 and $22000 as the immediate targets. Now we are aiming for $21710 which is a 50% retracement from 13 week high/low. The daily RSI is printing at 59 which indicates a strong demand for bitcoin and the continuation of the buying pressure in the markets. The price of BTCUSD will need to remain above the important support level of $20000 this week. The weekly outlook is projected at $21500 with a consolidation zone of $22000. Technical Indicators:The moving averages convergence divergence MACD (12,26): is at 6.20 indicating a BUY. The commodity channel index CCI (14): is at 138.28 indicating a BUY. The rate of price change ROC: is at 1.22 indicating a BUY. Bull/bear power (13): is at 128.67 indicating a BUY. VIEW FULL ANALYSIS VISIT - FXOpen Blog...Disclaimer: CFDs are complex instruments and come with a high risk of losing your money.
|
|
|
|
Watch FXOpen's October 24-28 Weekly Market Wrap VideoIn this video, FXOpen UK COO Gary Thomson sums up the weeks happenings and discusses the most significant news reports.- How will Rishi Sunak affect the pound?
- EUR/USD gathers pace
- Big Tech hit by fears of potential recession
- META (FB) shares fall 20% after earnings report
Watch our short and informative video, and stay updated with FXOpen. FXOpen YouTubeDisclaimer: CFDs are complex instruments and come with a high risk of losing your money. FXOpen YouTubeDisclaimer: CFDs are complex instruments and come with a high risk of losing your money.
|
|
|
|
ETHUSD and LTCUSD Technical Analysis 27th OCT, 2022 ETHUSD: Inverted Hammer Pattern Above $1254 ETHUSD: Inverted Hammer Pattern Above $1254Ethereum was unable to sustain its bearish momentum and after touching a low of 1254 on 21st Oct, the prices started to correct upwards against the US dollar. The prices of Ethereum touched a high of 1593 on 26th Oct after which we can see a shift towards the consolidation phase in the markets. We can see that the prices of Ethereum are ranging near the support of the triangle in the 15-minute time frame indicating the bullish overtone of the markets. We can clearly see an inverted hammer pattern above the $1254 handle which is a bullish pattern and signifies the end of a bearish phase and the start of a bullish phase in the markets. ETH is now trading just below its pivot level of 1554 and is moving into a mildly bullish channel. The price of ETHUSD is now testing its classic resistance levels of 1568 and Fibonacci resistance levels of 1583 after which the path towards 1600 will get cleared. The relative strength index is at 75 indicating an overbought market and the shift towards the correction and consolidation phase in the markets. We can see that the commodity channel index is giving a bullish divergence signal in the 30-minute time frame. Both the STOCH and Williams percent range are indicating an overbought market, which means that the prices are expected to decline in the short-term range. Some of the technical indicators are giving a STRONG BUY market signal. Some of the moving averages are giving a BUY signal, and we are now looking at the levels of $1650 to $1700 in the short-term range. ETH is now trading above both the 100 & 200 hourly simple and exponential moving averages. - Ether: bullish reversal seen above the $1254 mark
- The short-term range appears to be mildly bullish
- ETH continues to remain above the $1500 level
- The average true range is indicating HIGH market volatility
Ether: Bullish Reversal Seen Above $1254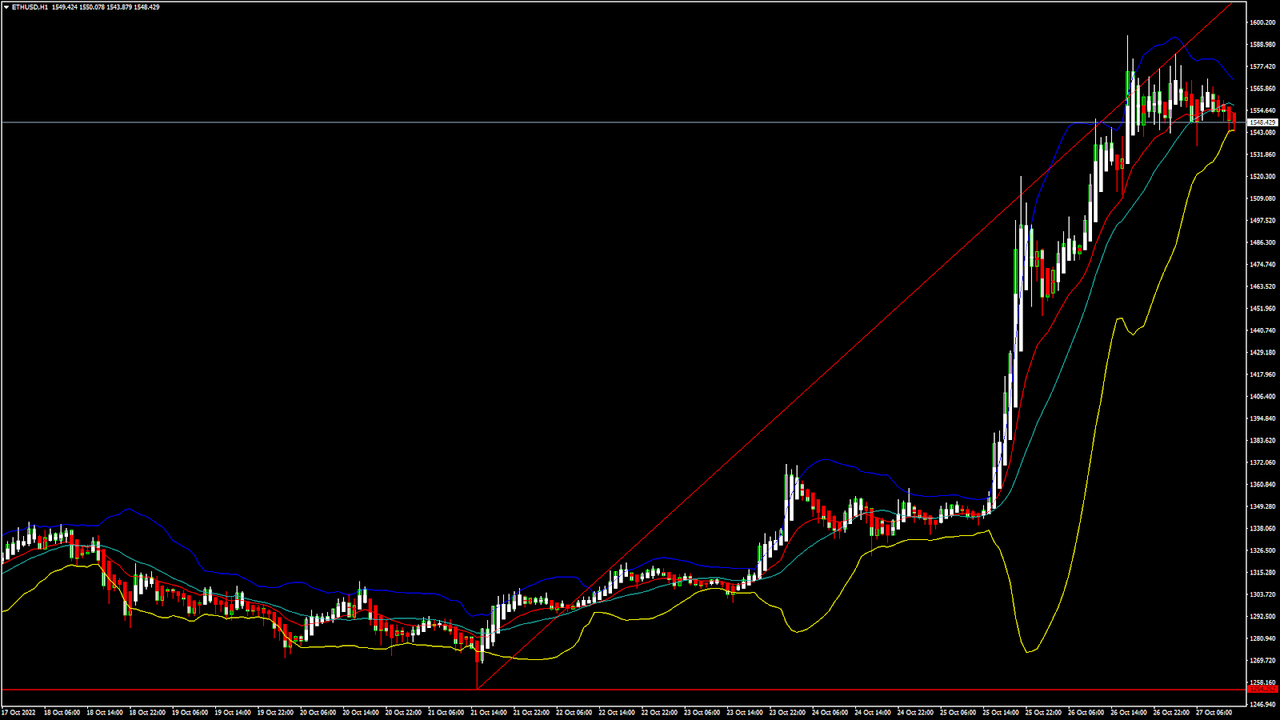 ETHUSD is now moving into a mildly bullish channel with the price trading above the $1500 handle in the European trading session today. ETH touched an intraday high of 1583 in the Asian trading session and an intraday low of 1536 in the European trading session today. The parabolic SAR indicator is giving a bullish reversal signal in the weekly time frame. Moving average bullish crossovers are seen: AMA20 and AMA50 in the daily timeframe. We can also see the formation of a bullish price crossover pattern with moving average MA20 in the weekly time frame. Ethereums price continues to move into a bullish zone against the US dollar and is expected to move above the $1600 level. The daily RSI is printing at 69 indicating a very strong demand for Ether in the long-term range. The key support levels to watch are $1392 which is a 50% retracement from a 4-week low and 1439 which is a 38.2% retracement from 4-week high. ETH has increased by 0.74% with a price change of 11.43$ in the past 24hrs and has a trading volume of 26.649 billion USD. We can see a decrease of 29.89% in the total trading volume in the last 24 hrs which is due to the shift towards the consolidation phase in the markets. The Week AheadAfter the recent declines, Ethereums price is extending upwards correction against the US dollar and bitcoin. We are now looking for a fresh rally into the markets towards the $1800 level. We can see the formation of a major bullish trend line in place from $1254 towards $1745 level. The immediate short-term outlook for Ether has turned mildly bullish, the medium-term outlook has turned neutral, and the long-term outlook for Ether is neutral in present market conditions. The price of ETHUSD will need to remain above the important support levels of $1473 1273 which is a pivot point 1st support point. The weekly outlook is projected at $1700 with a consolidation zone of $1600. Technical Indicators:The average directional index ADX (14): is at 42.29 indicating a BUY The ultimate oscillator: is at 61.39 indicating a BUY The bull/bear power (13): is at 126.52 indicating a BUY The commodity channel index (14): is at 81.21 indicating a BUY VIEW FULL ANALYSIS VISIT - FXOpen Blog...Disclaimer: CFDs are complex instruments and come with a high risk of losing your money.
|
|
|
|
|

